
Novel Cooling Strategy for a Hybrid Photovoltaic/Parabolic Dish Concentrator


Abstract
:1. Introduction
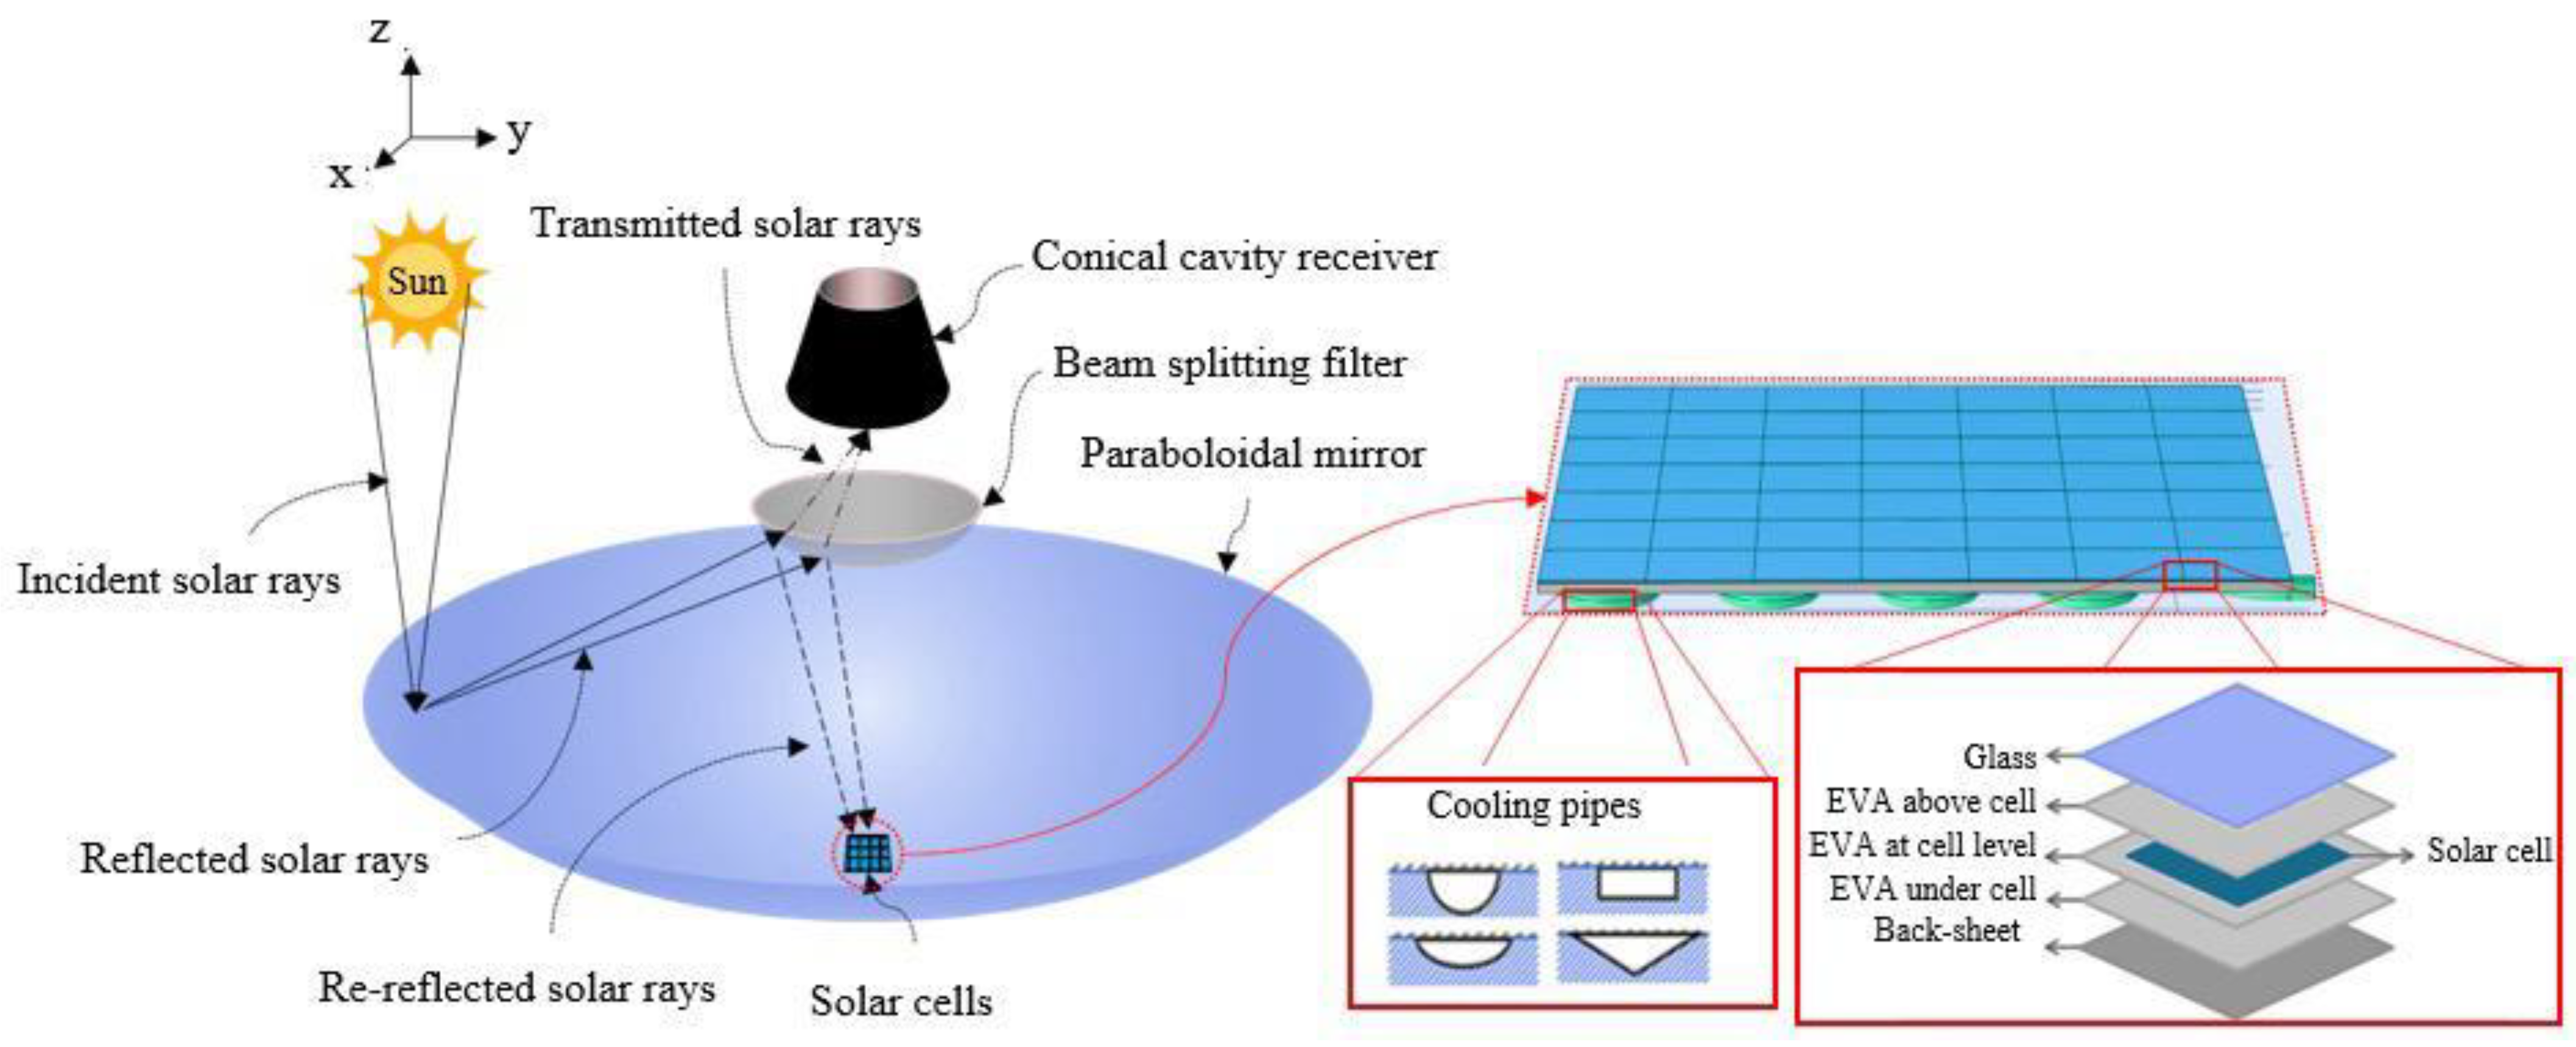
2. PV/PDC-CTR-BSF Approach
2.1. PV/PDC-CTR-BSF Design
2.2. Solar Dish Reflector
2.3. Reflected Solar Rays and Splitter Filter
2.4. Thermal Receiver and Transmitted Solar Rays
2.5. PV Panel and the Conventional Cooling System
3. Novel Cooling Strategy
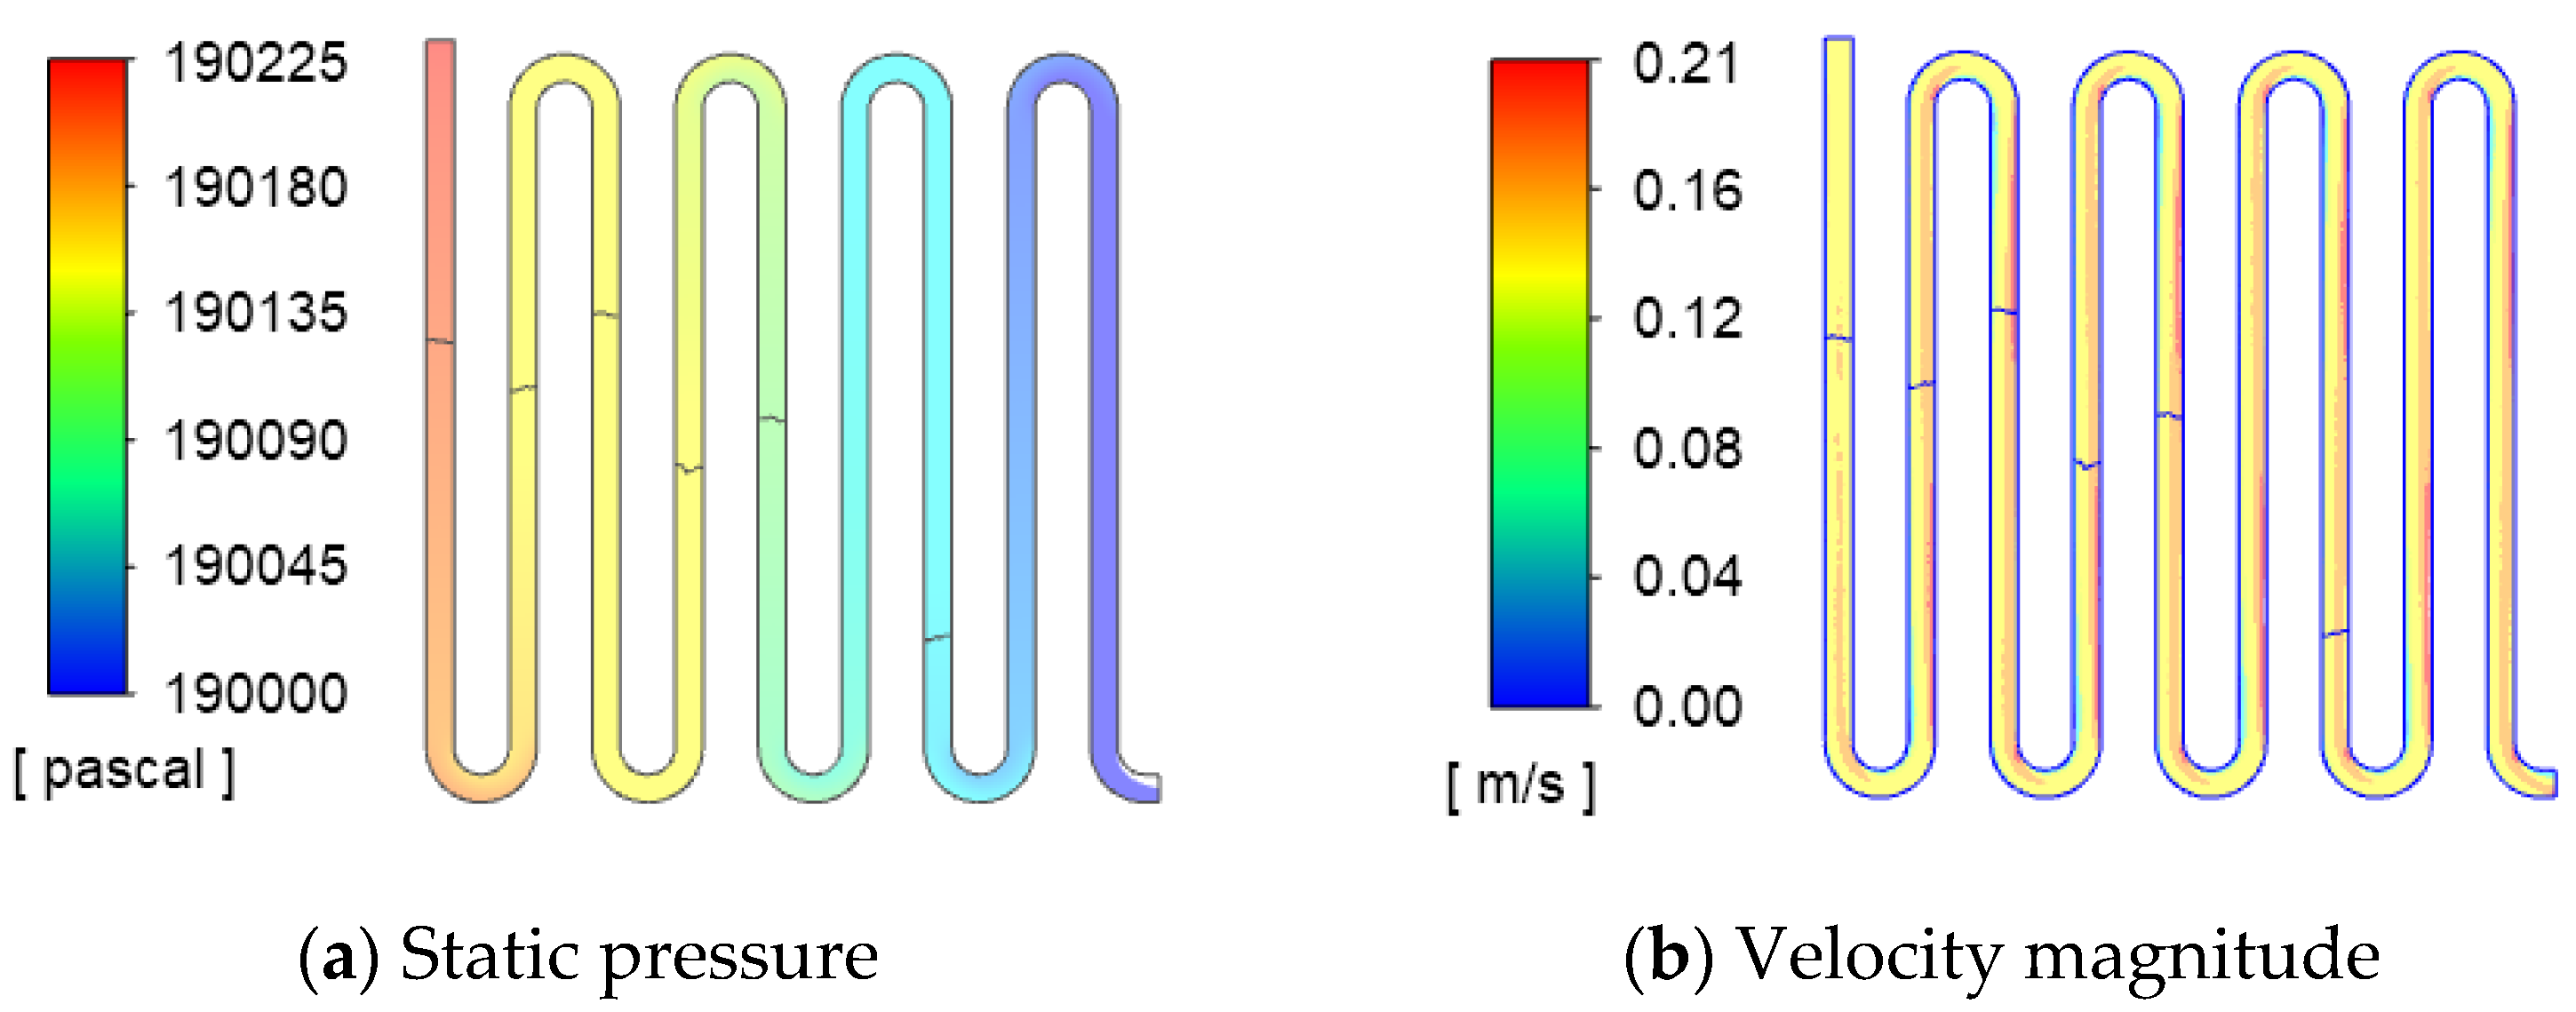
3.1. Computational Modeling
3.2. Input and Boundary Conditions
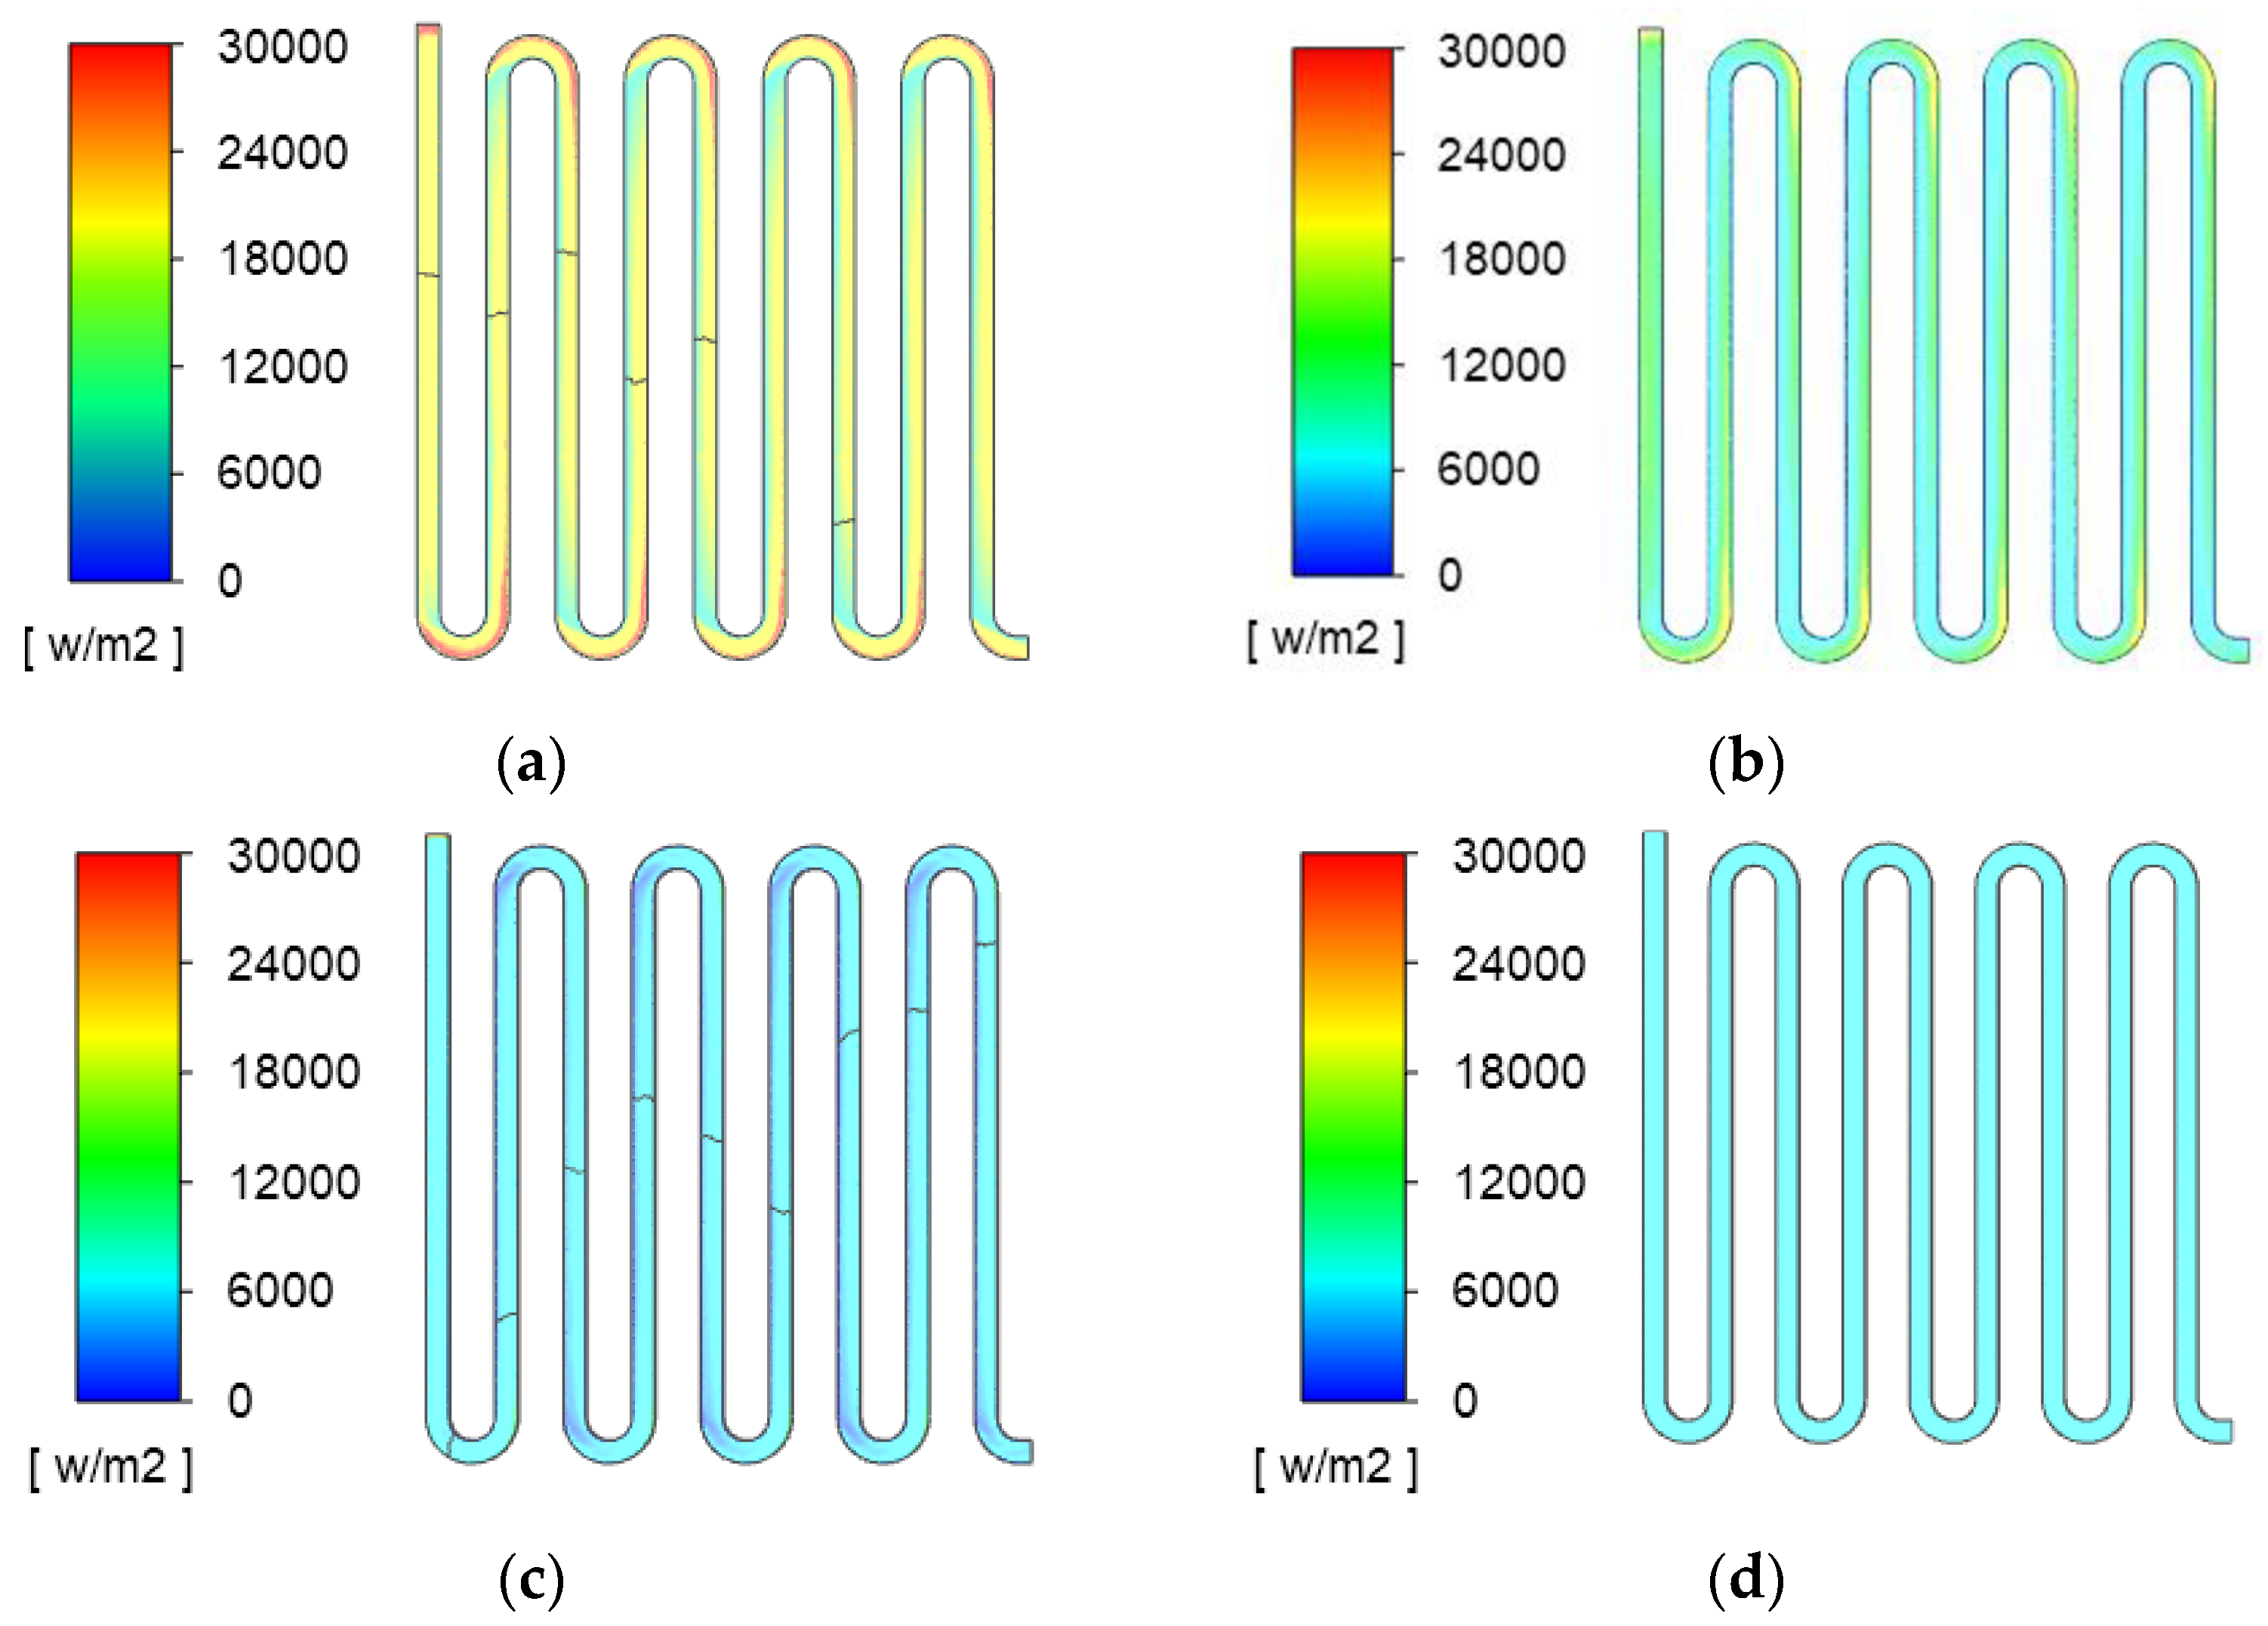
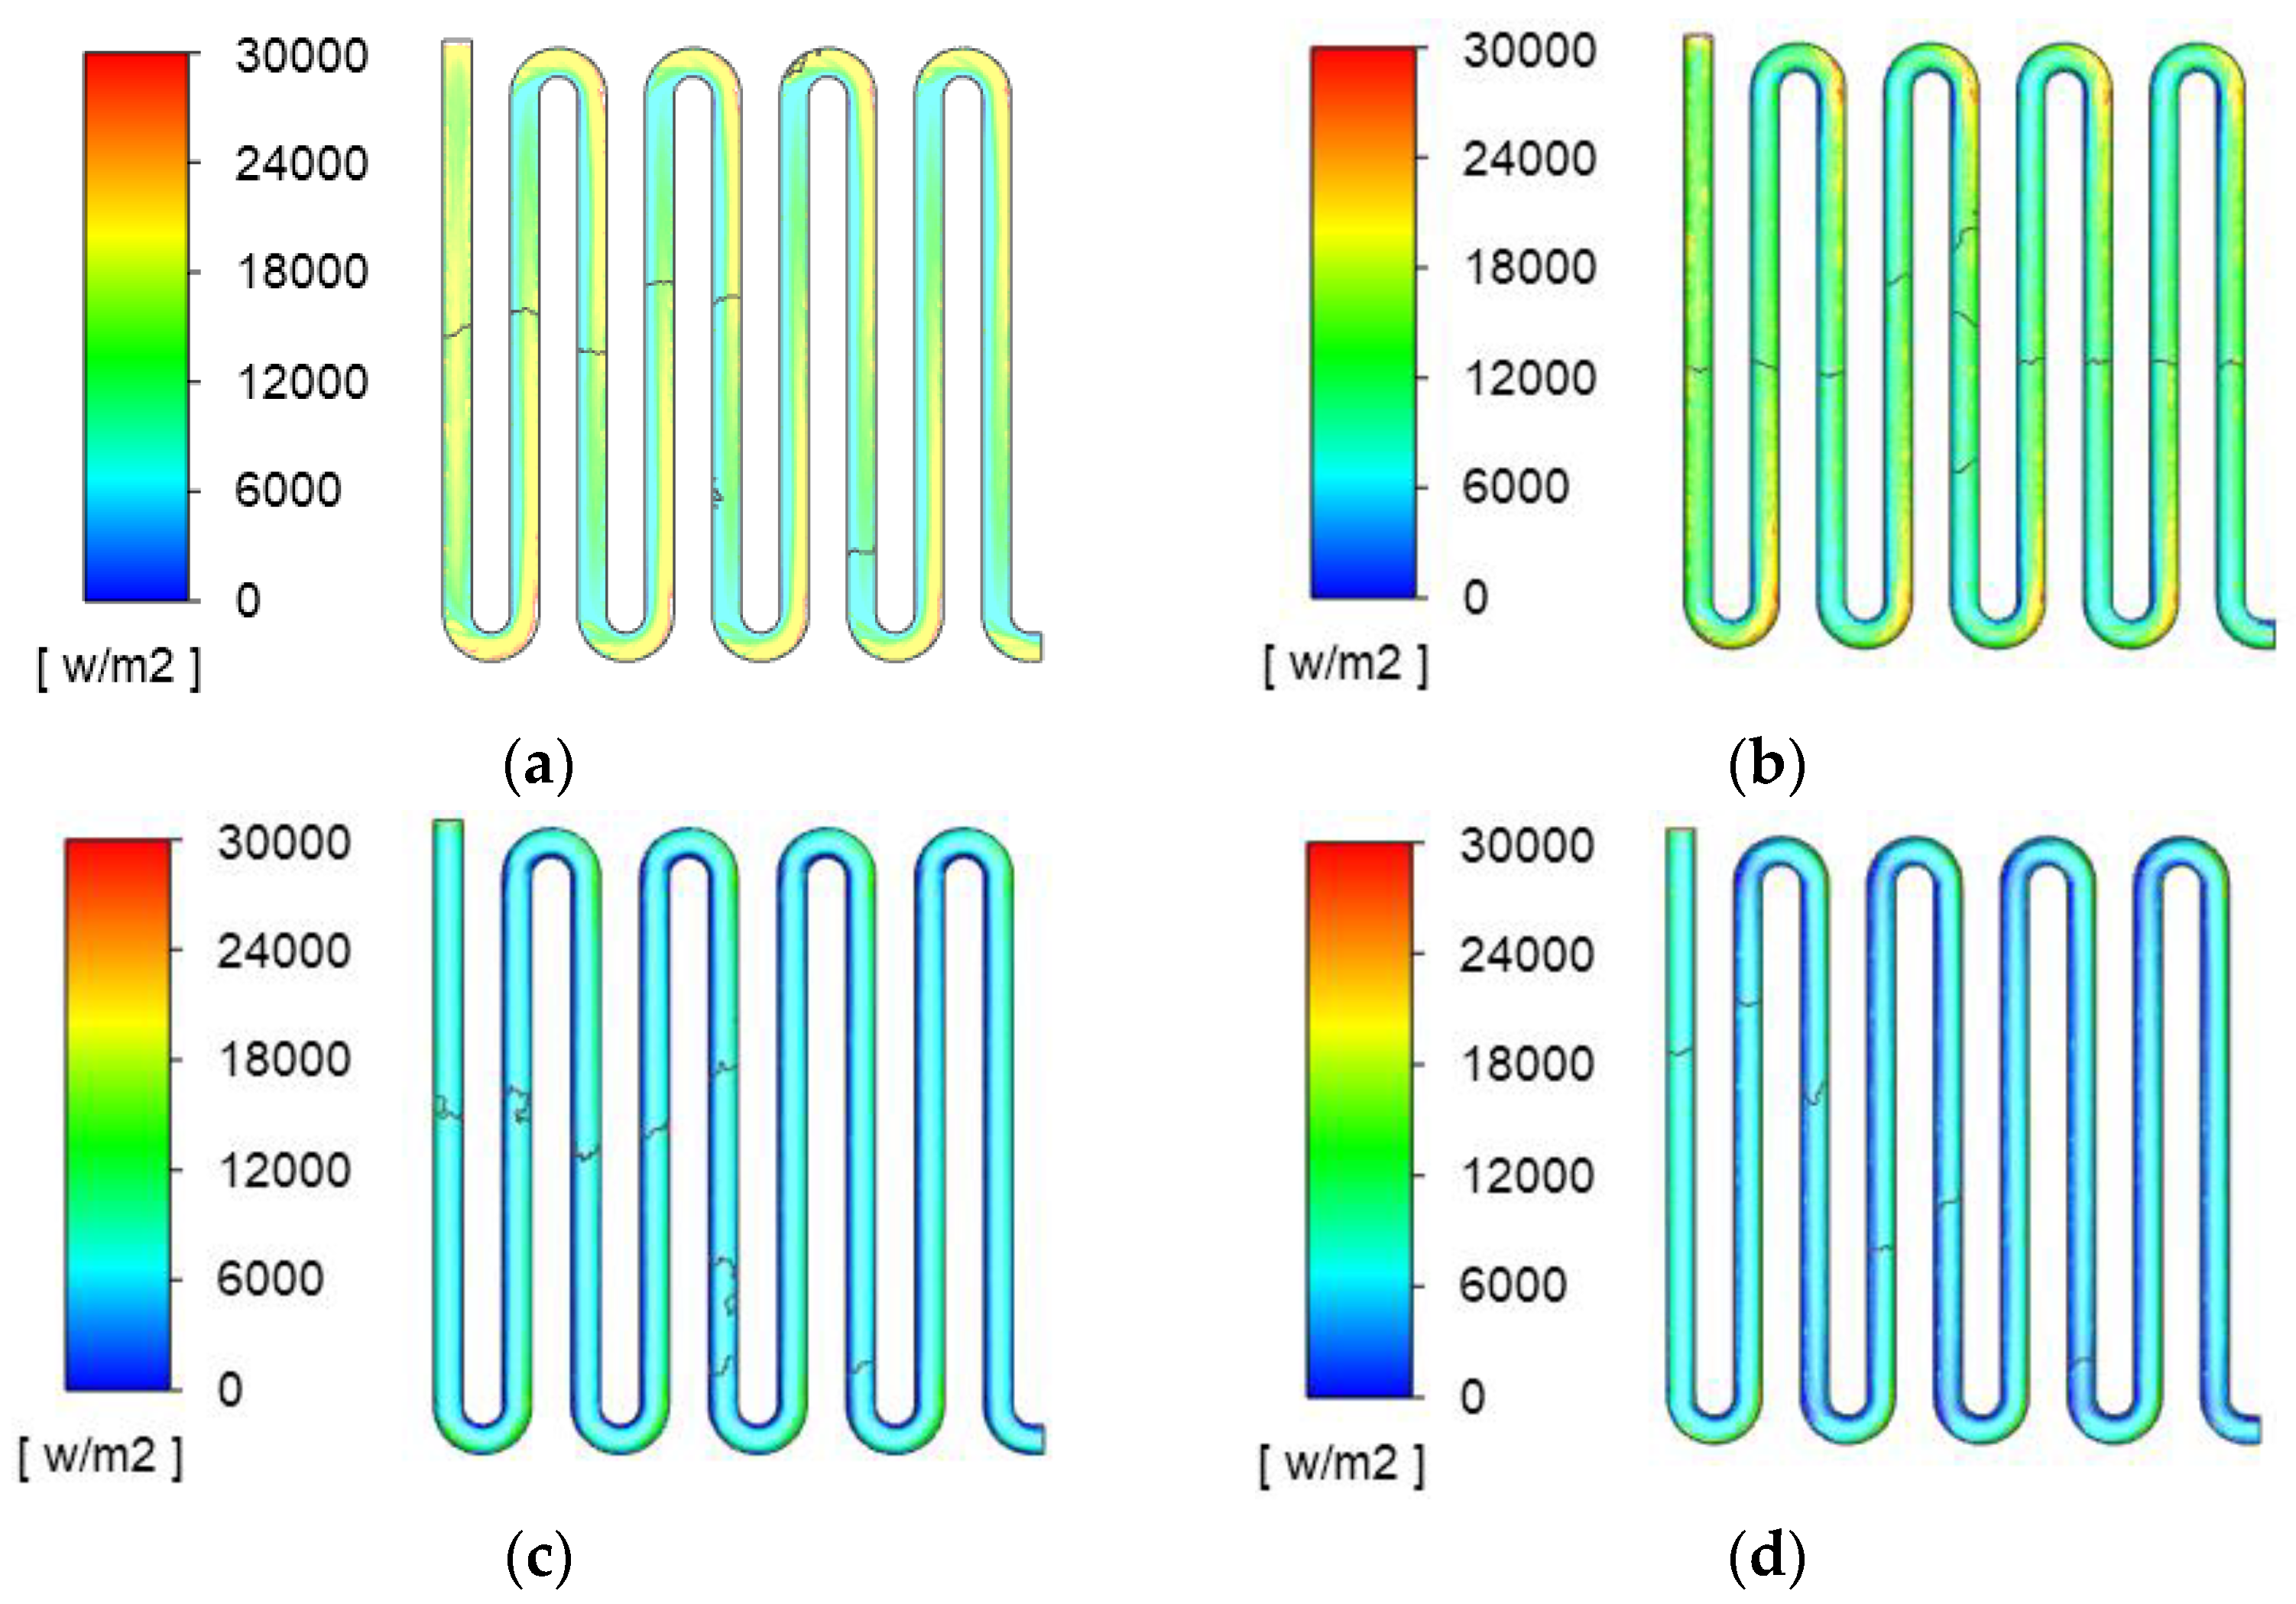
4. Numerical Results
4.1. Area-Weighted Temperatures and Heat Transfer Rates
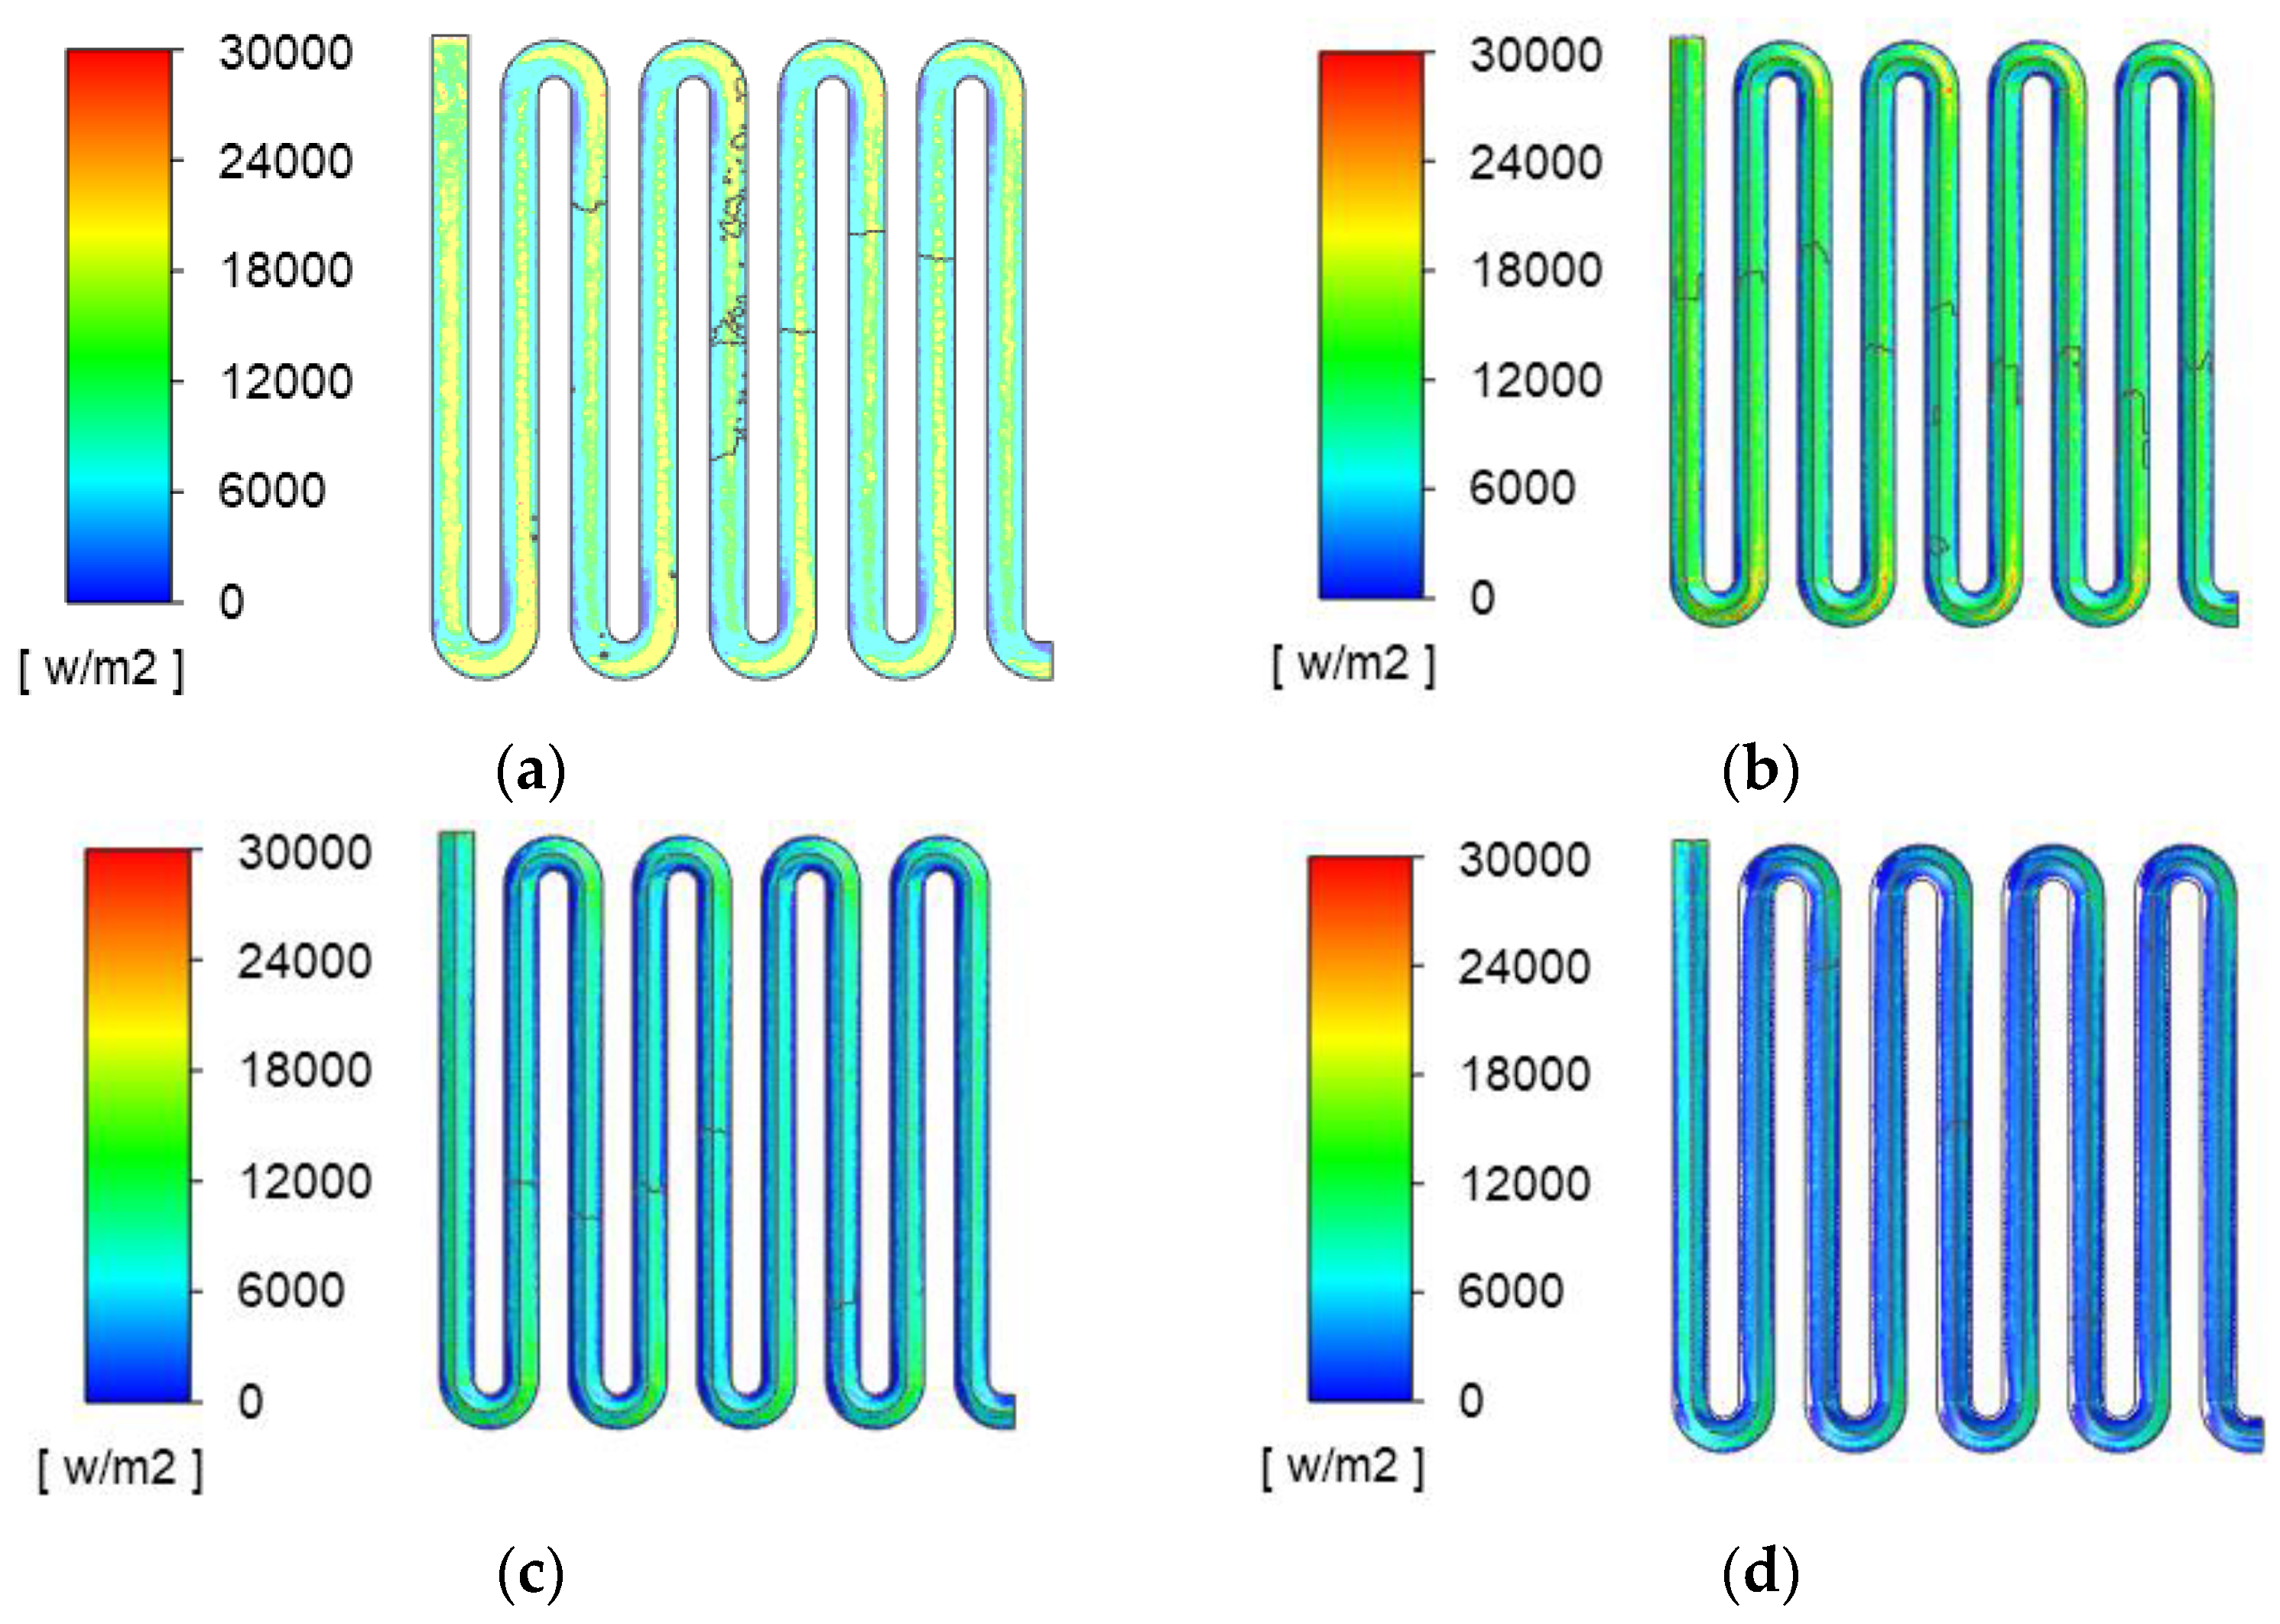
4.2. Surface Heat Flux Distribution
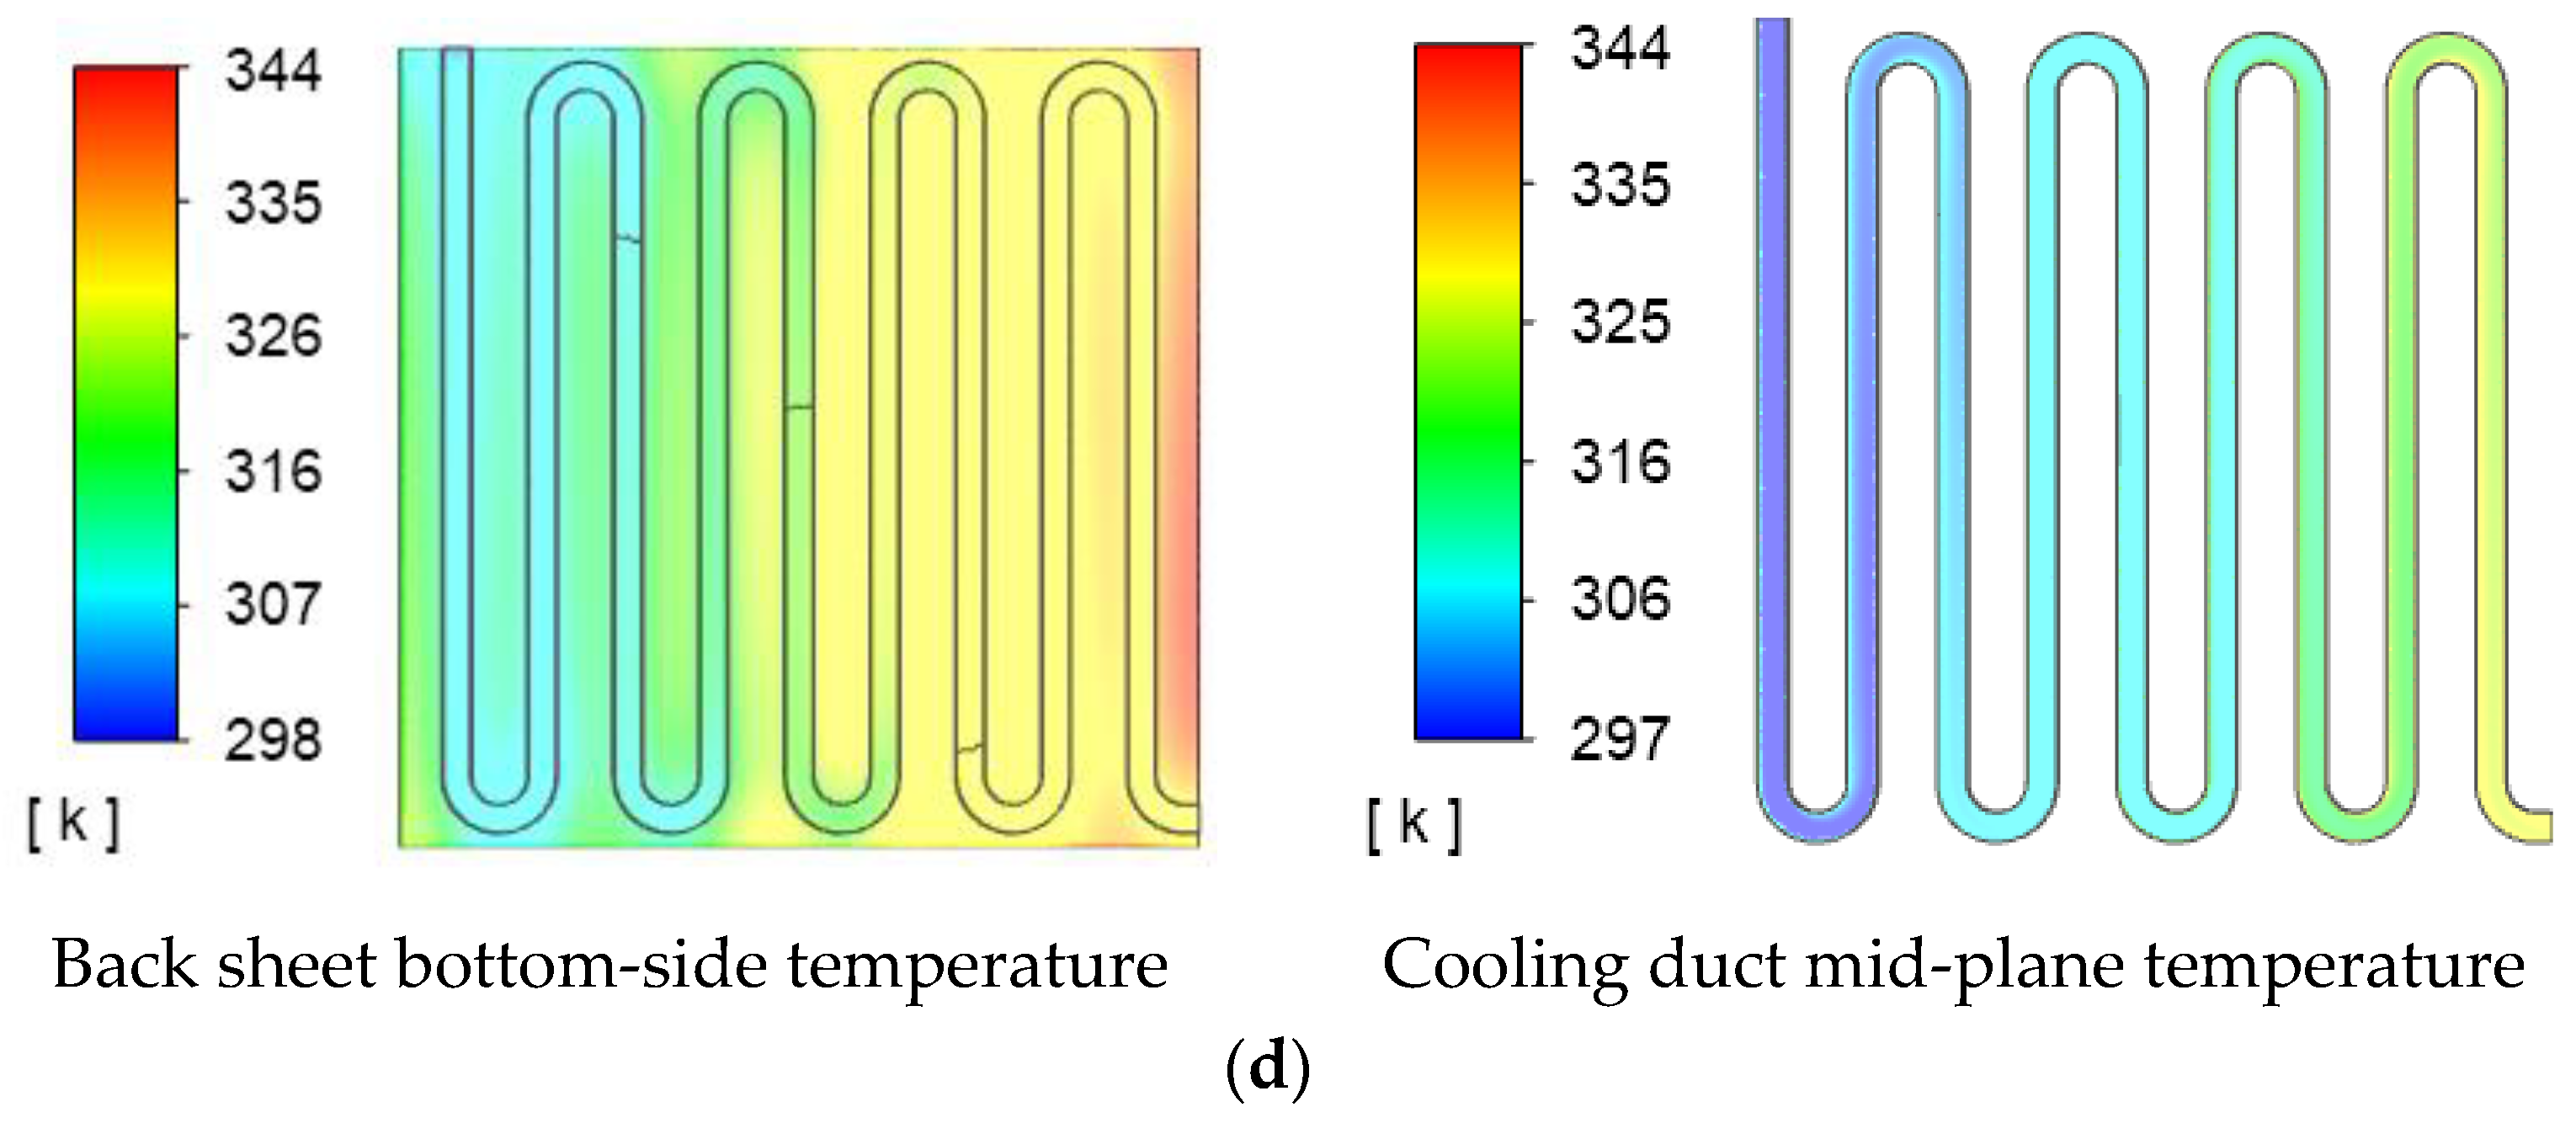
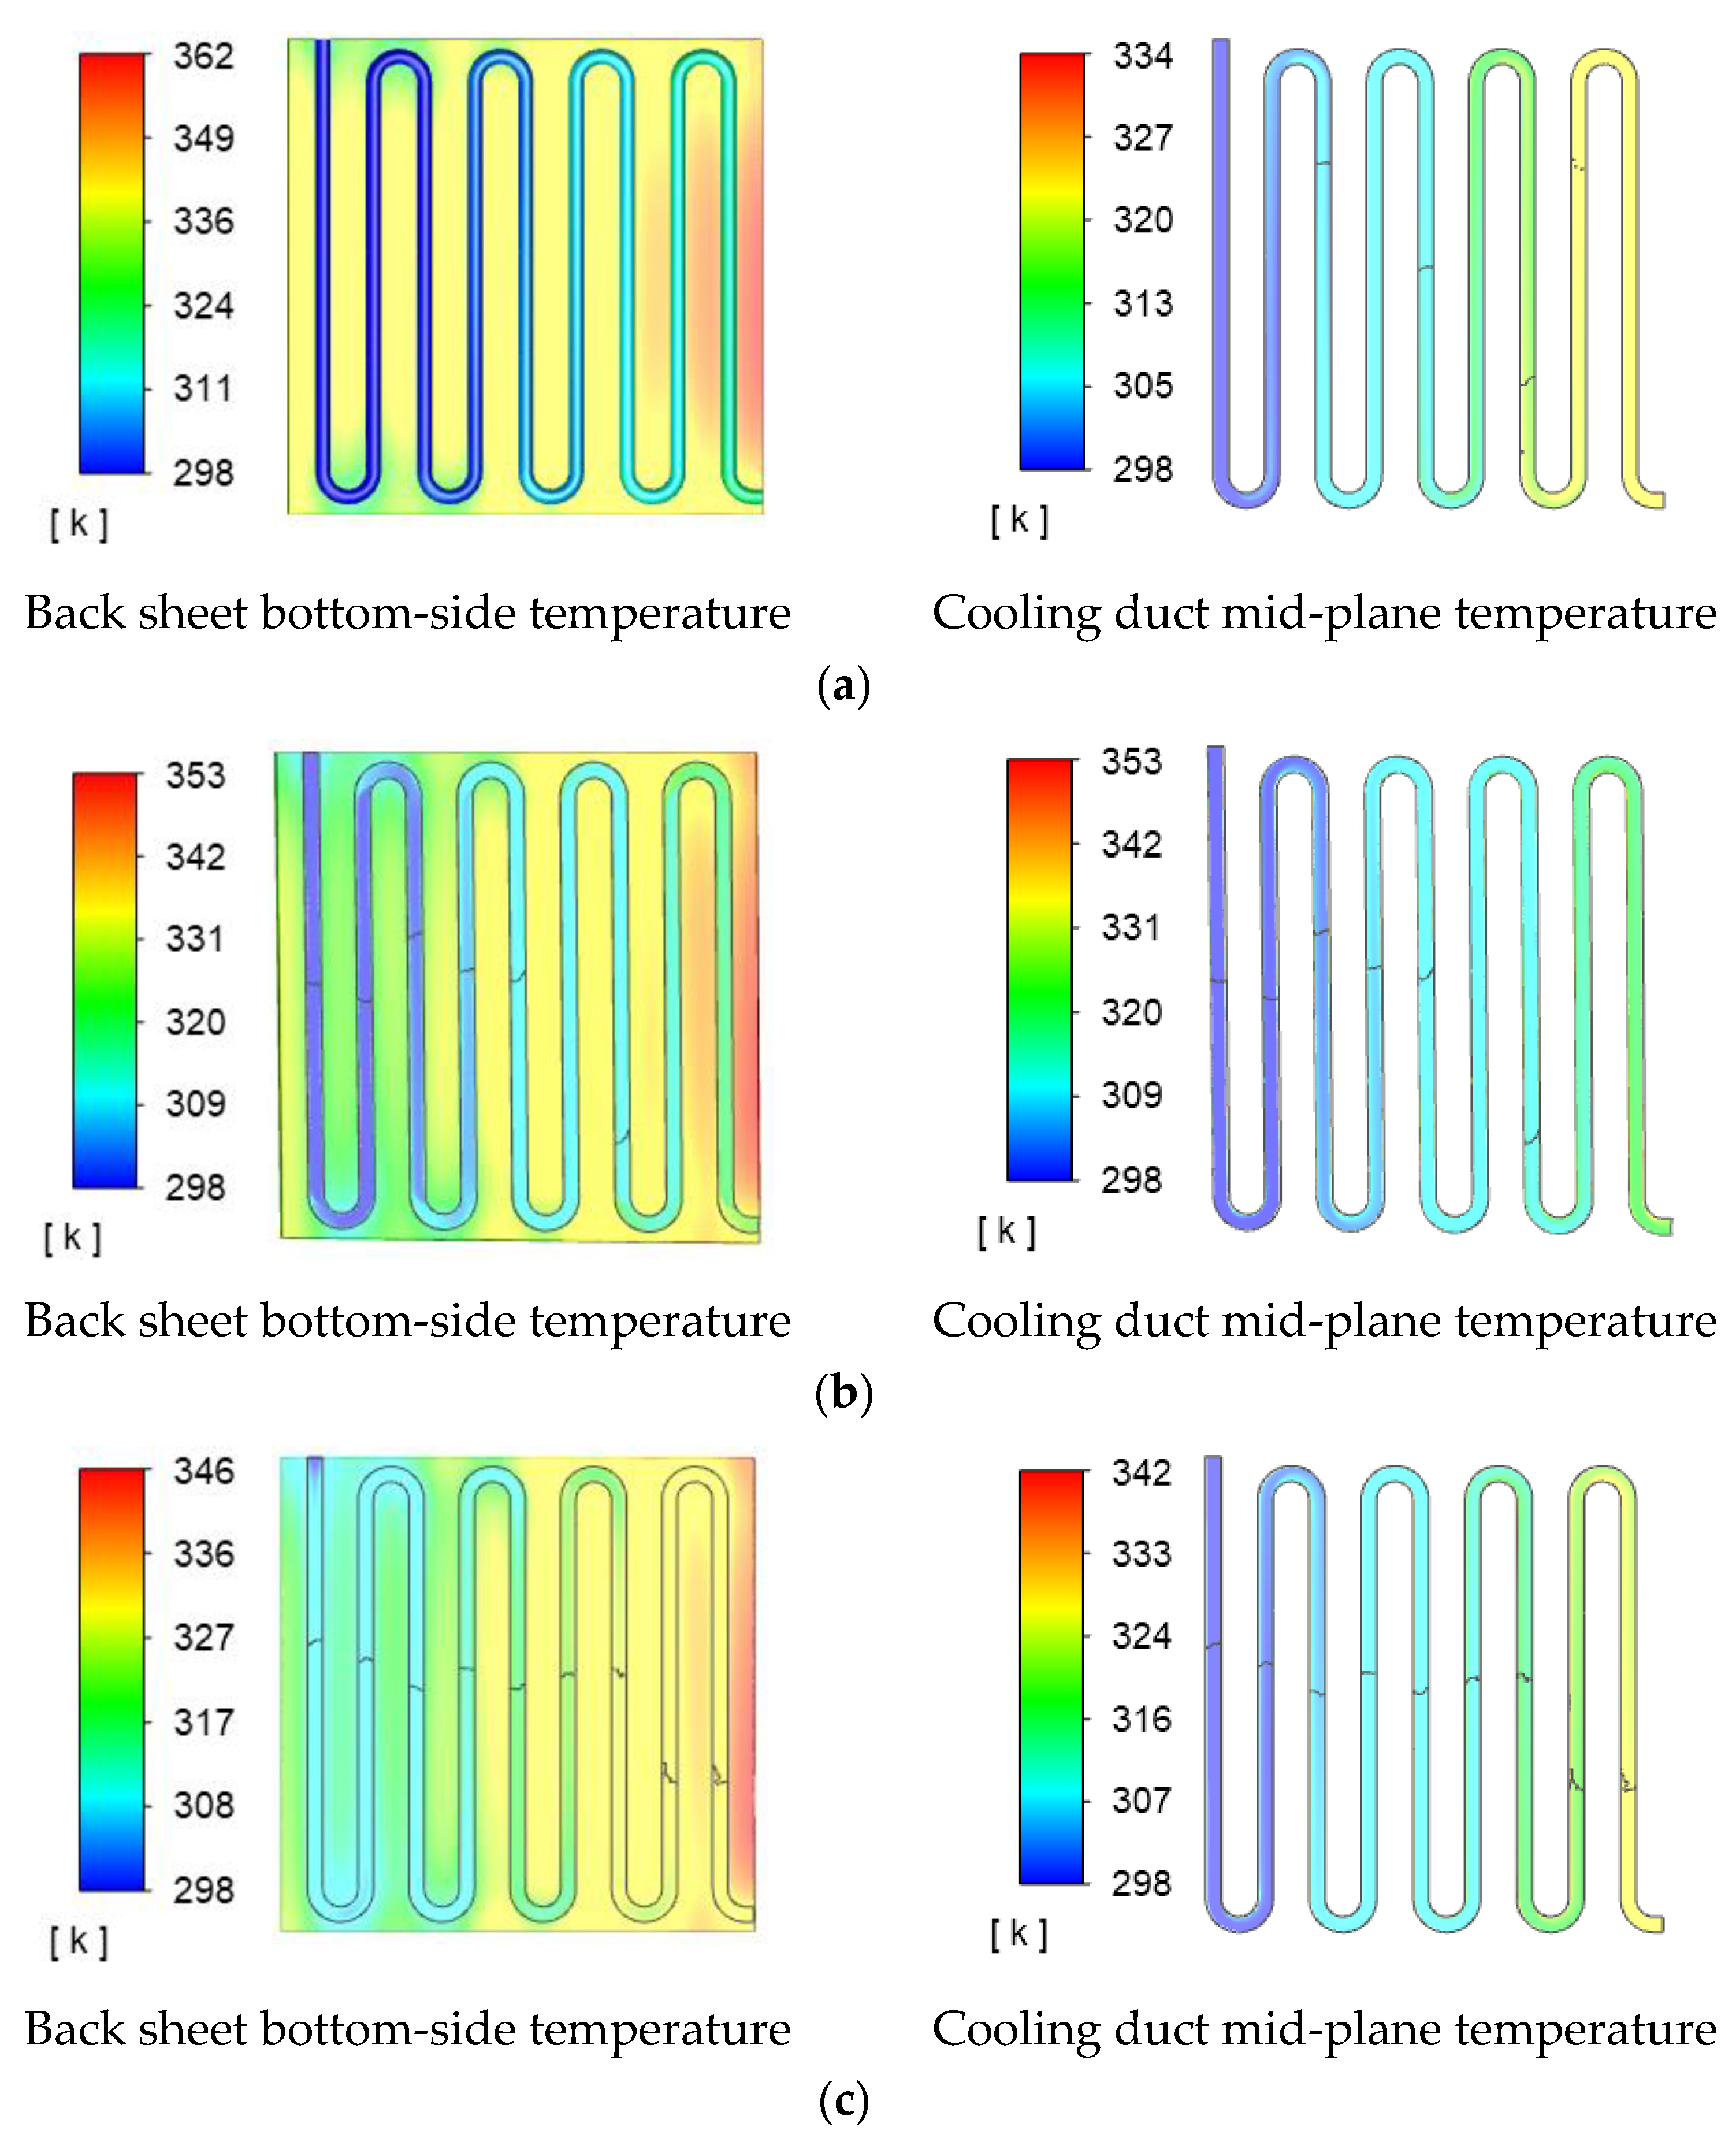
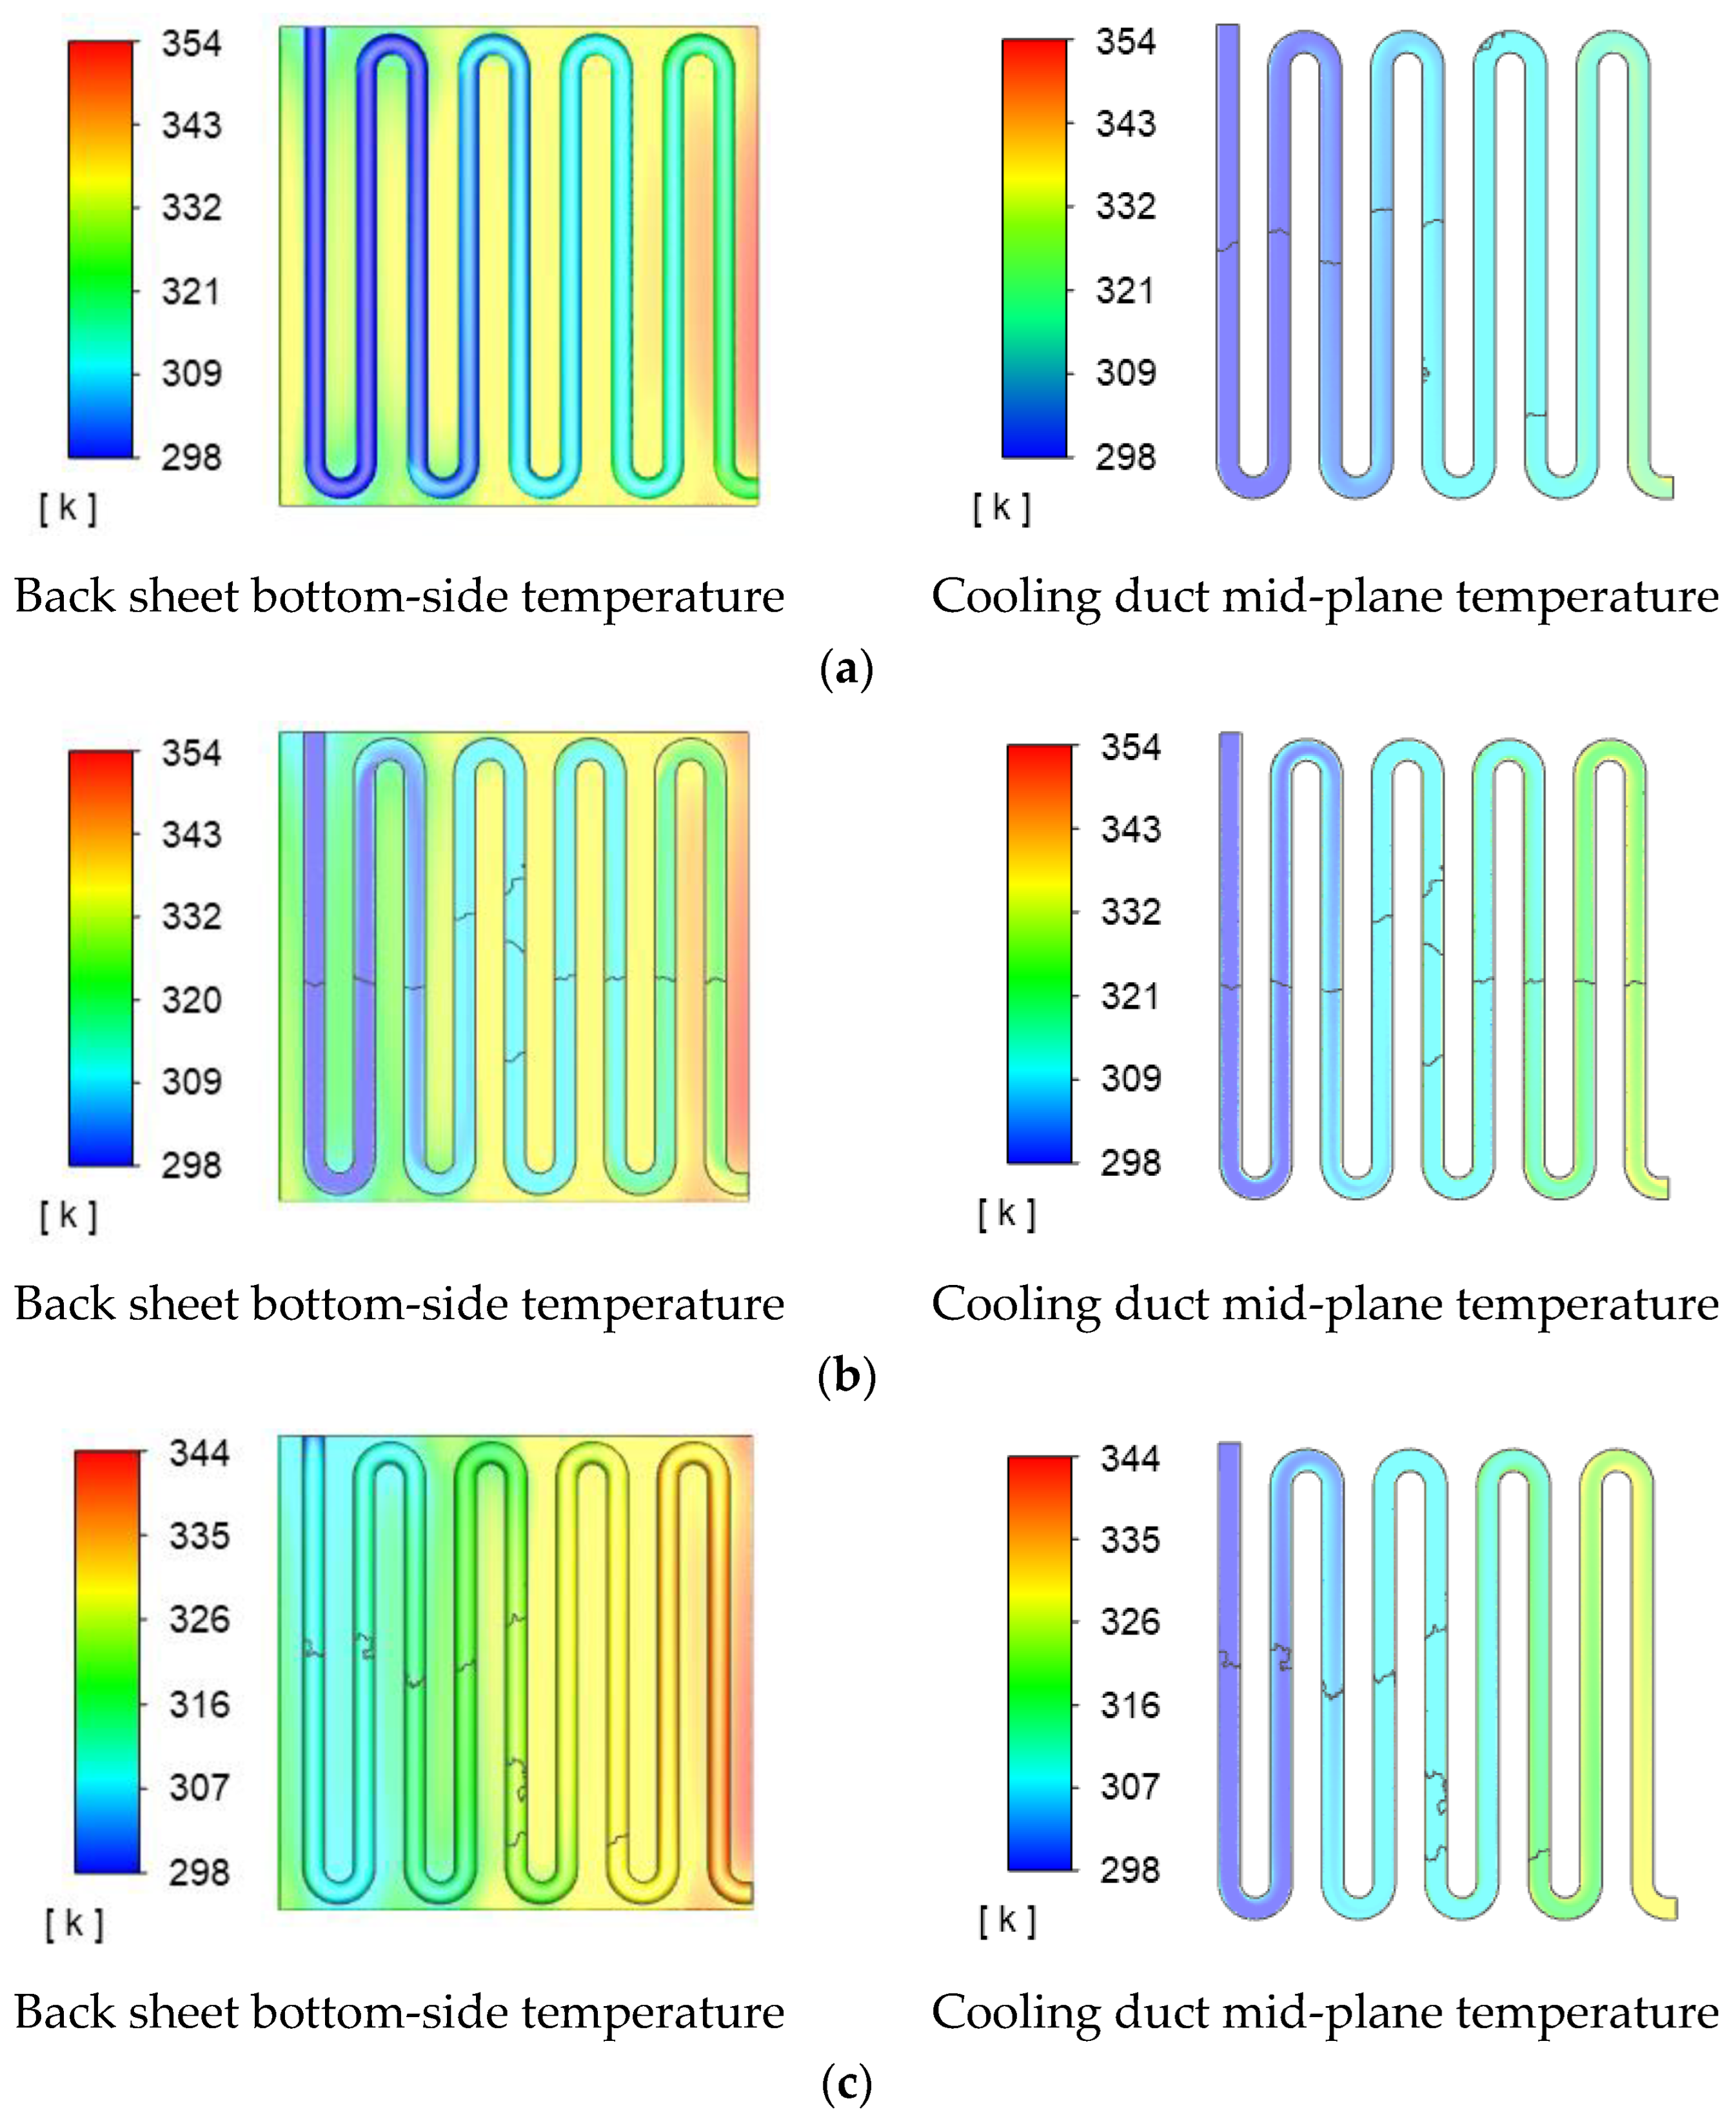
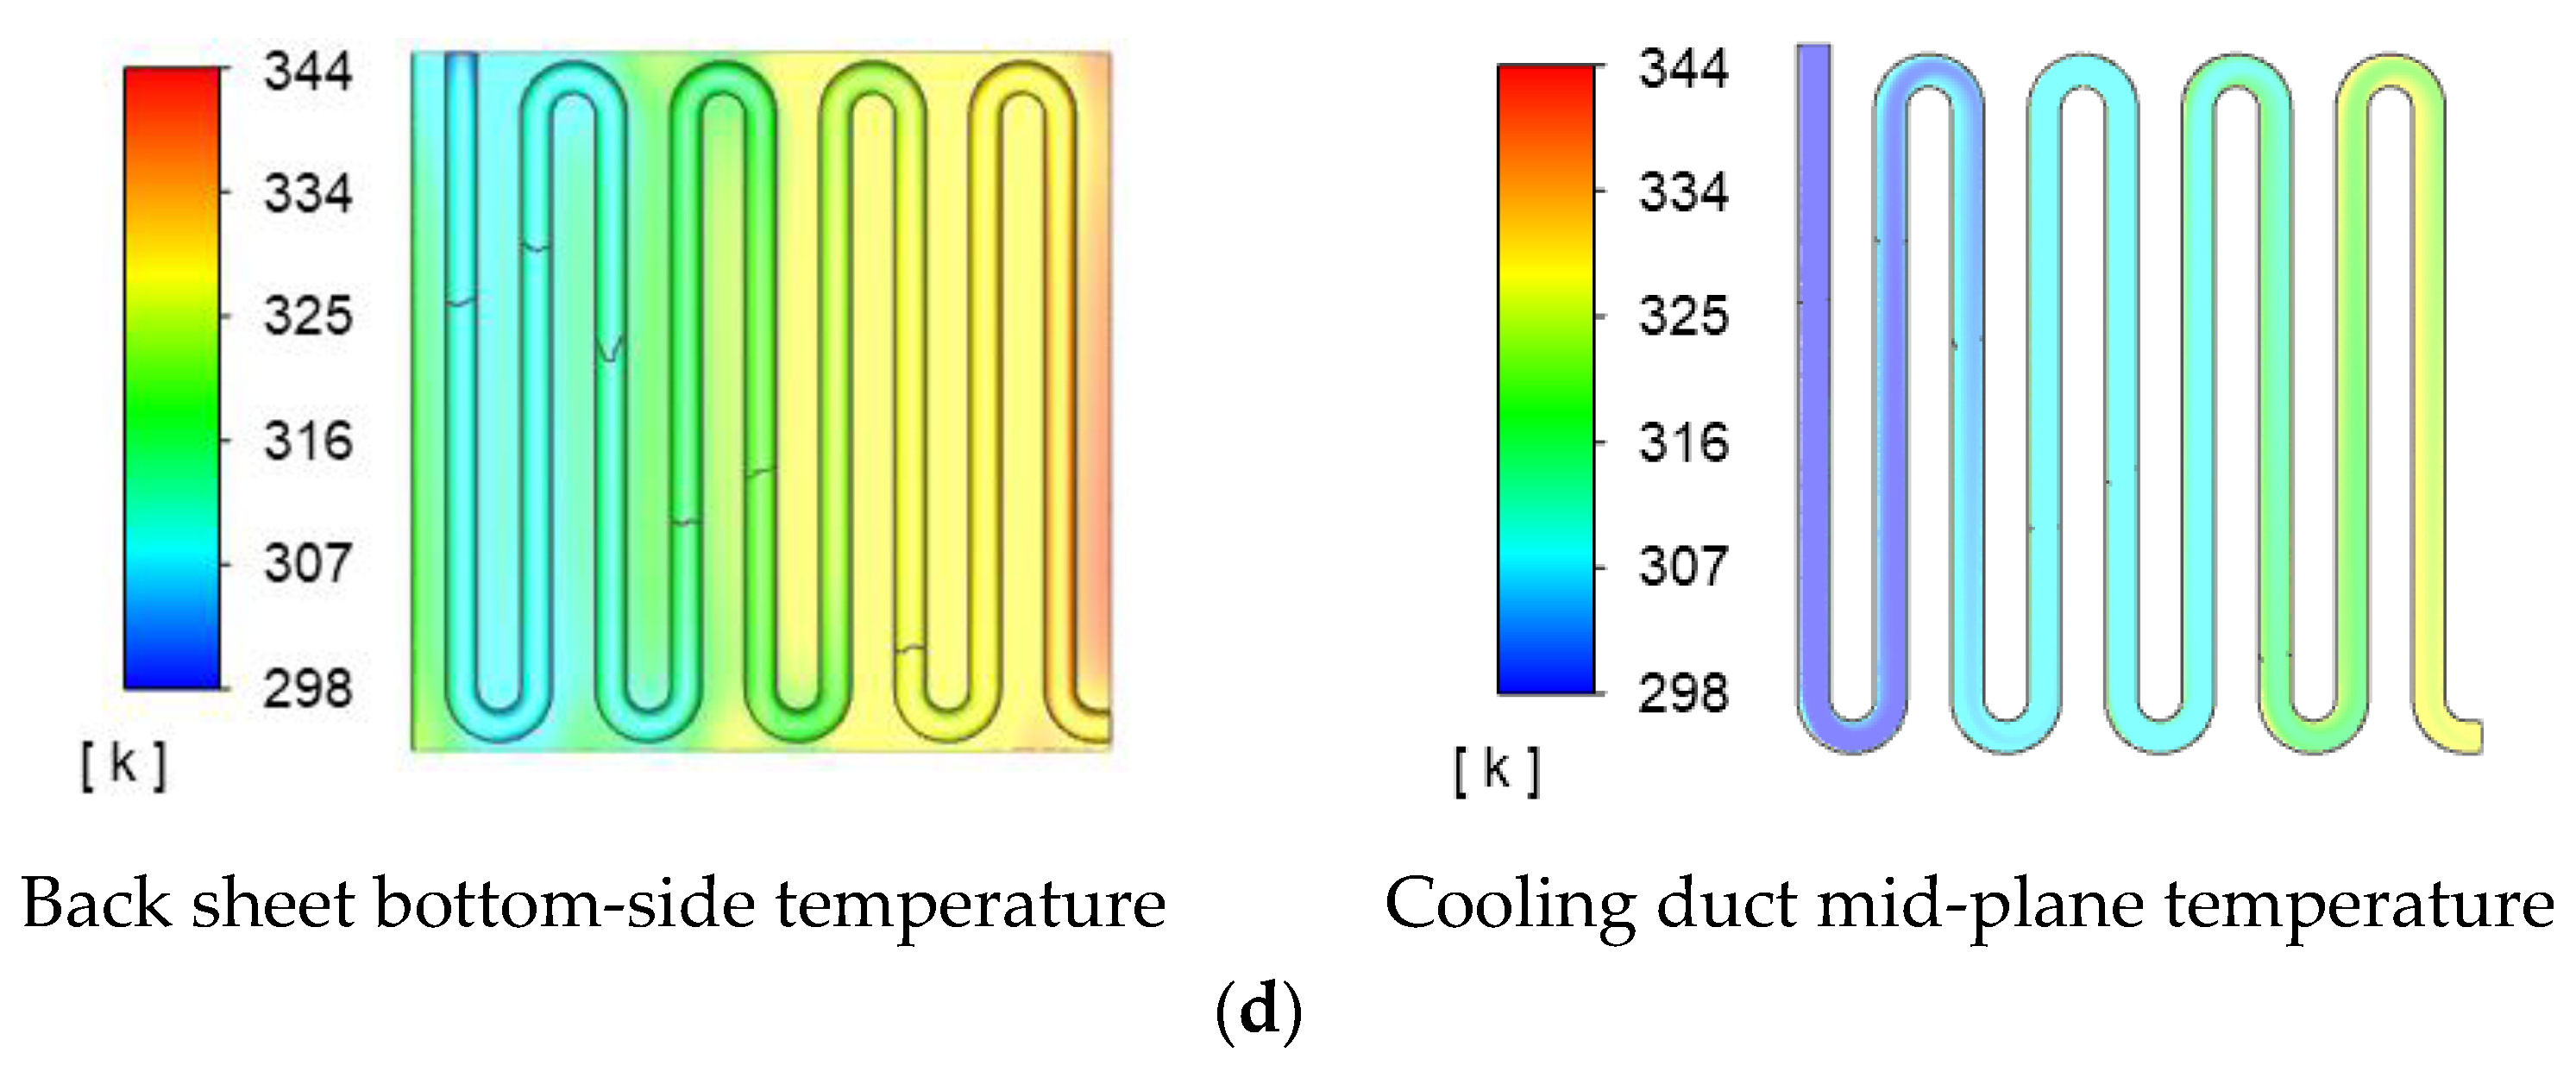
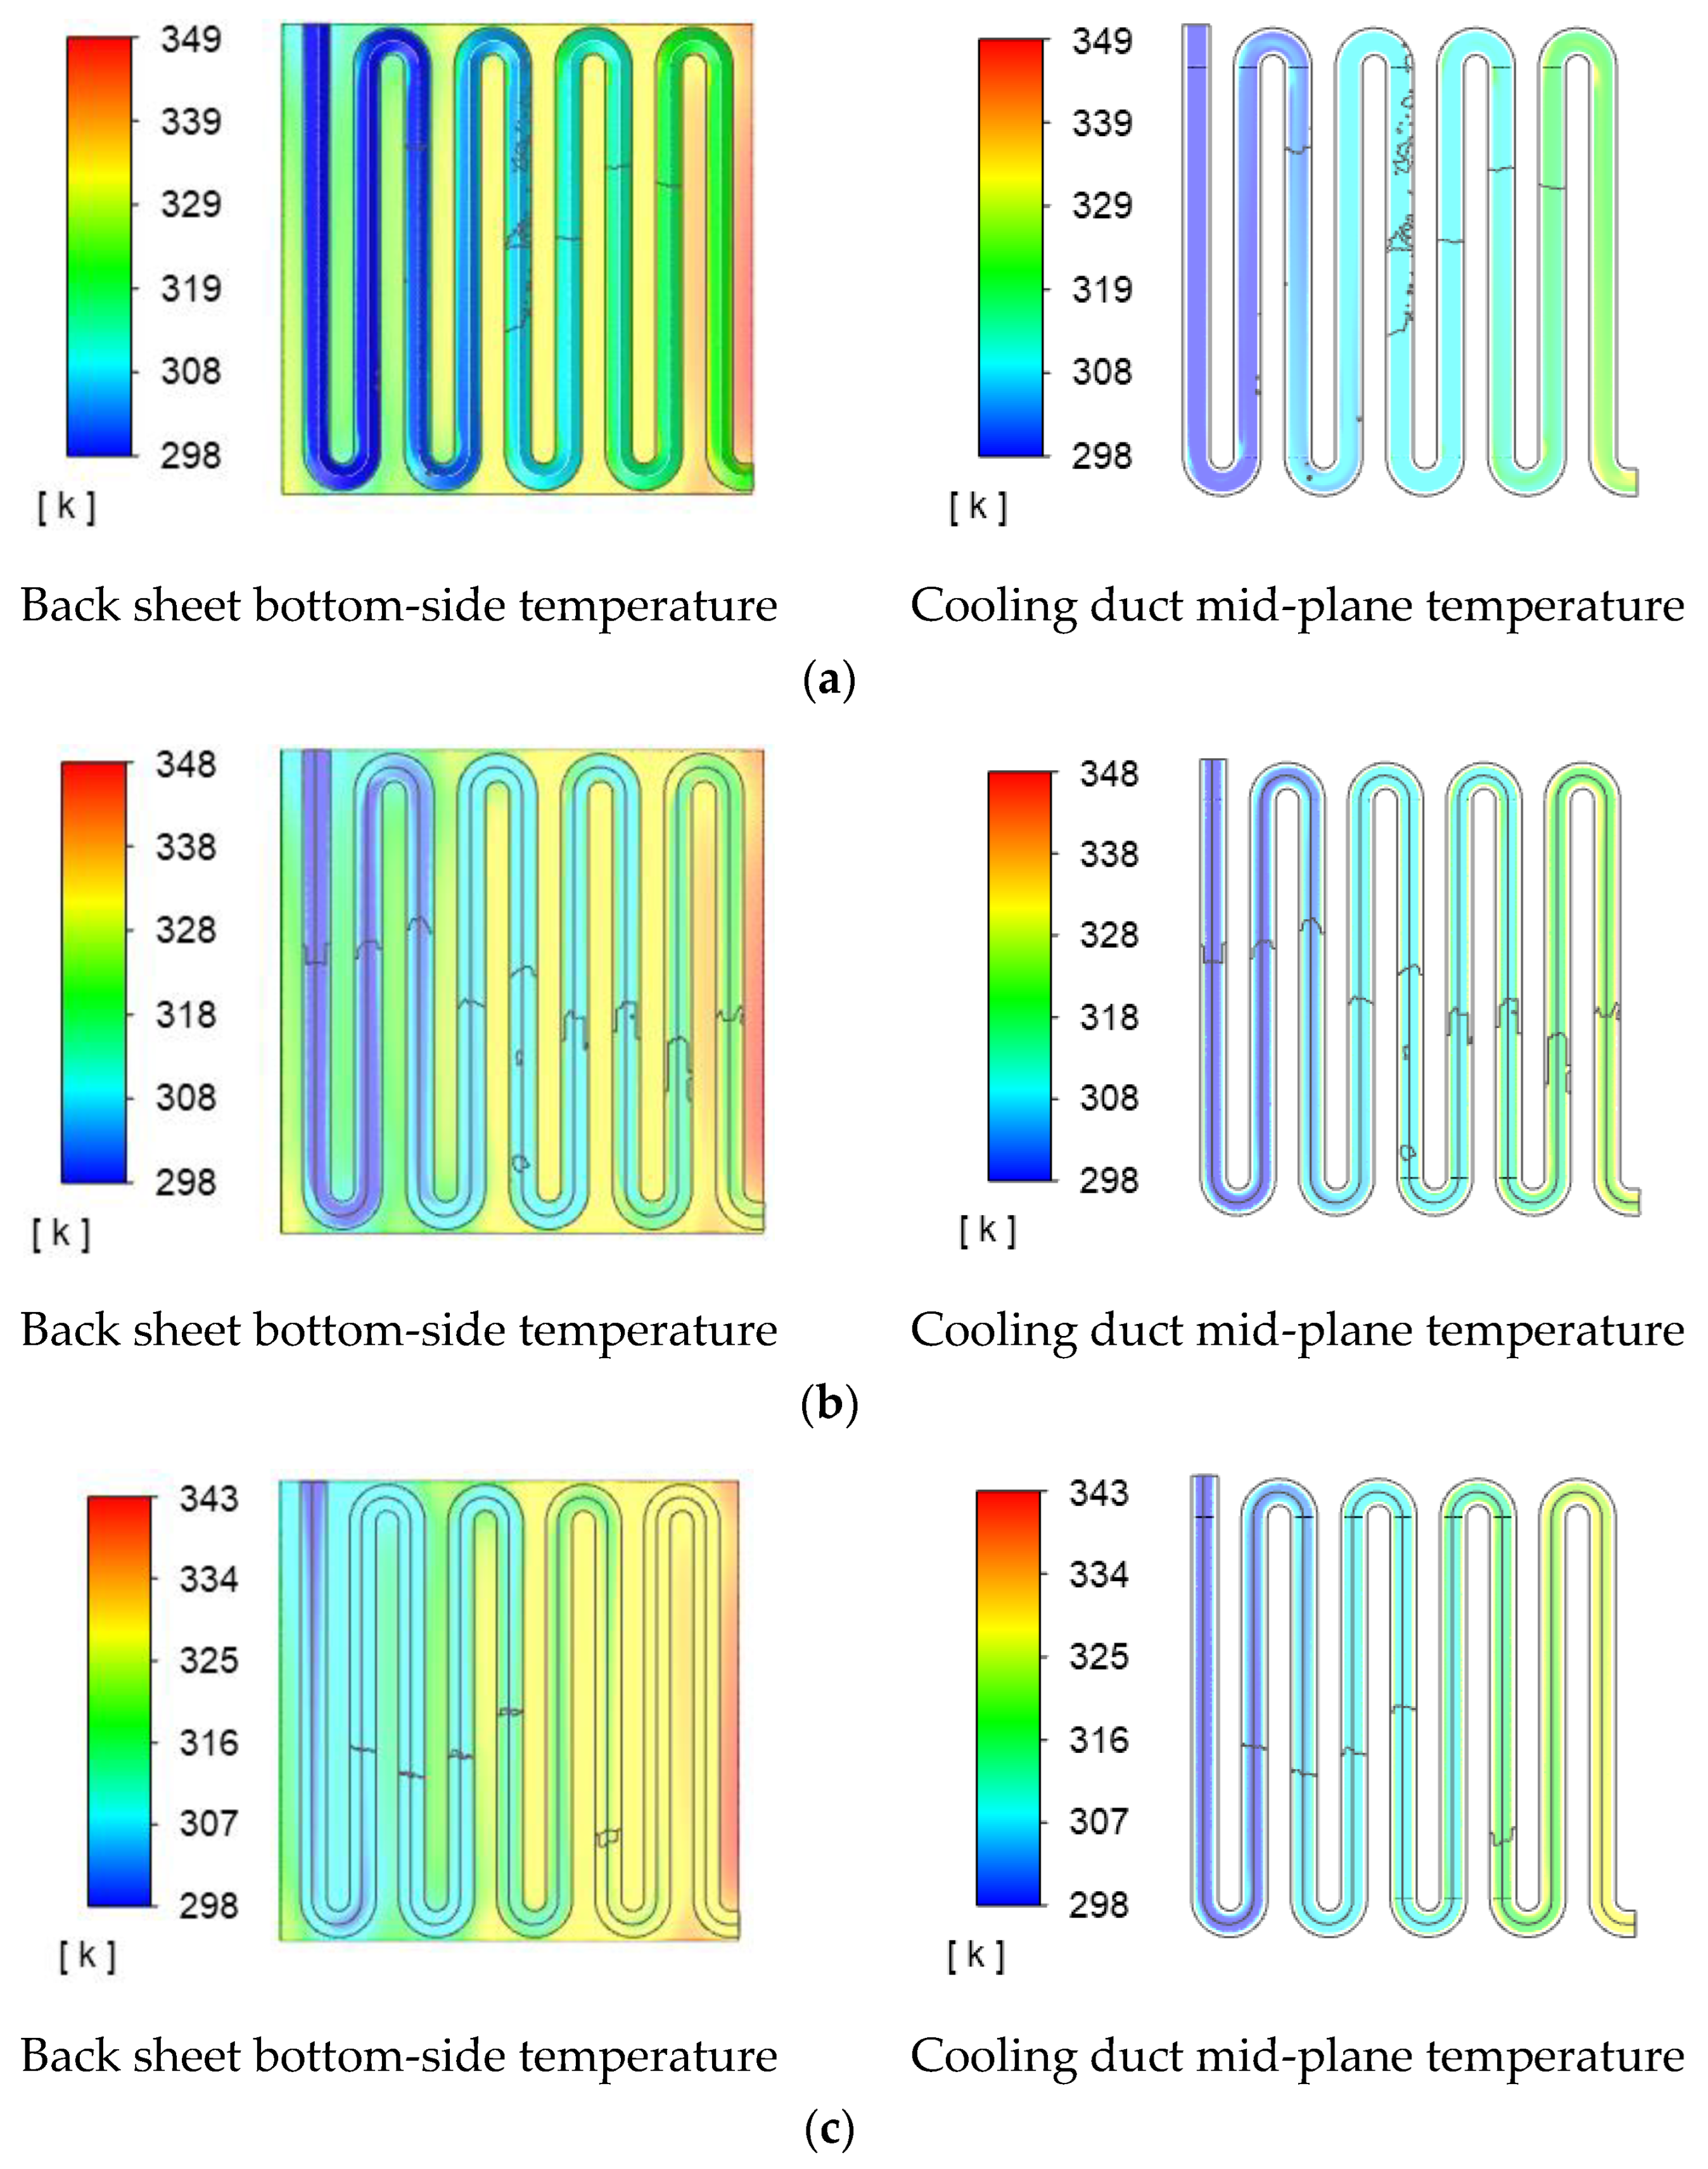
4.3. Back Sheet and Cooling Fluid Temperatures
5. Validation
6. Conclusions
- The results prove that the conventional rectangular cross-section cooling duct is the least effective configuration in cooling the PV panel back sheet and removing heat as compared to the other cross-section considered in this study.
- The results show that cooling ducts that are an integral part of the back sheet, i.e., the ducts that are embedded within the back sheet, are more effective in removing the heat from the PV back sheet.
- Amongst the cases studied, case (a), representing ducts flush at the bottom of back sheet, irrespective of the cross-section, resulted in the lowest heat transfer rate as well as the highest cooling fluid temperature at the exit of the duct.
- Amongst the cases studied, case (c), representing ducts embedded in the middle of the back sheet, irrespective of the cross-section, resulted in the highest rate of heat removal as suggested by the heat transfer rate flowing out from the duct as well as the cooling fluid temperature at the exit of the duct.
- Amongst the four duct cross-sections, the semi-elliptical duct placed in the middle of the back sheet was found to remove the heat the most within a given time.
- Ducts located flush on the bottom or top on the inside of the back sheet exhibit similar cooling or heat transfer performance, with the duct flush on the top inside of the back sheet exhibiting slightly better cooling performance.
- The heat flux distribution and heat transfer rates are directly proportional to the width of the contact area between the back sheet and the cooling pipe.
- Amongst the configurations investigated, the semi-ellipse cross-section, configuration 3(b) in Table 2, yields the maximum increase in the cooling fluid temperature at the duct exit.
- If it is desired to have the lowest possible back sheet temperature, then the triangular duct placed flush with the back sheet top, i.e., case 4(d) in Table 2, is seen to be the best candidate because it can result in an increase in the electric output power of the mono-crystalline PV modules by at least 8%.
Author Contributions
Funding
Institutional Review Board Statement
Informed Consent Statement
Data Availability Statement
Acknowledgments
Conflicts of Interest
Nomenclature
| Dh | Hydraulic diameter | [m] |
| d | Depth of duct | [m] |
| f | Focal length | [m] |
| Mass flow rate | [kg/s] | |
| p | Perimeter | [m] |
| Heat transfer rate | [W] | |
| Heat flux | [W/m2] | |
| r | Radius | [m] |
| T | Temperature | [K or °C] |
| w | Width of duct | [m] |
| (x, y, z) | Square coordinates | [m] |
| θ | Angle | [deg] |
| ρ | Reflectivity | - |
| λ | Solar ray wavelength | [m] |
| ε | Emissivity | - |
| Subscripts | ||
| back | Back of back sheet | |
| c | Collector | |
| cr | Center receiver | |
| in | Inlet | |
| min | Minimum | |
| op | Opening | |
| out | Outlet | |
| pipe | Cooling duct surface | |
| r | Receiver | |
| sf | Splitter filter | |
| sur | Surrounding | |
| Abbreviations | ||
| BSF | Beam Splitter Filter | |
| CCR | Conical Cavity Receiver | |
| CPV | Concentrated Photovoltaic | |
| CPV/T | Concentrated Photovoltaic/Thermal | |
| CR | Concentration Ratio (Optical) | |
| CS | Concentrated Solar | |
| CTR | Conical Thermal Receiver | |
| EVA | Ethylene Vinyl Acetate | |
| PDC | Parabolic Dish Concentrator | |
| PV | Photovoltaic | |
| RO | Reverse Osmosis | |
| UV | Ultraviolet | |
References
- Donovan, R.L.; Hunter, H.C. Ten kilowatt photovoltaic concentrating array. In Proceedings of the 13th IEEE Photovoltaic Specialists Conference, Washington, DC, USA, 5–8 June 1978; pp. 1125–1130. [Google Scholar]
- Green, M.A. Solar Cells—Operating Principles, Technology and System Applications; Prentice-Hall: Upper Saddle River, NJ, USA, 1982. [Google Scholar]
- Ju, X.; Xu, C.; Liao, Z.; Du, X.; Wei, G.; Wang, Z.; Yang, Y. A review of concentrated photovoltaic-thermal (CPVT) hybrid solar systems with waste heat recovery (WHR). Sci. Bull. 2017, 62, 1388–1426. [Google Scholar] [CrossRef]
- Daneshazarian, R.; Cuce, E.; Cuce, P.M.; Sher, F. Concentrating photovoltaic thermal (CPVT) collectors and systems: Theory, performance assessment and applications. Renew. Sustain. Energy Rev. 2018, 81, 473–492. [Google Scholar] [CrossRef]
- Mathew, G.; Pandey, A.K.; Nasrudin, A.R.; Tyagi, V.V.; Syed, S.; Saidur, R. Concentrated photovoltaic thermal systems: A component-by-component view on the developments in the design, heat transfer medium and applications. Energy Convers. Manag. 2019, 186, 15–41. [Google Scholar]
- Sultan, S.M.; Efzan, M.E. Review on recent Photovoltaic/Thermal (PV/T) technology advances and applications. Sol. Energy 2018, 173, 939–954. [Google Scholar] [CrossRef]
- Lupu, A.G.; Homutescu, V.M.; Balanescu, D.T.; Popescu, A. A review of solar photovoltaic systems cooling technologies. In Proceedings of the 8th International Conference on Advanced Concepts in Mechanical Engineering, Iasi, Romania, 7–8 June 2018. [Google Scholar]
- Tyagi, V.V.; Kaushik, S.C.; Tyagi, S.K. Advancement in solar photovoltaic/thermal (PV/T) hybrid collector technology. Renew. Sustain. Energy Rev. 2012, 16, 1383–1398. [Google Scholar] [CrossRef]
- Akbarzadeh, A.; Wadowski, T. Heat pipe-based cooling systems for photovoltaic cells under concentrated solar radiation. Appl. Therm. Eng. 1996, 16, 81–87. [Google Scholar] [CrossRef]
- Mittelman, G.; Kribus, A.; Dayan, A. Solar cooling with concentrating photovoltaic/thermal (CPVT) systems. Energy Convers. Manag. 2007, 48, 2481–2490. [Google Scholar] [CrossRef]
- Mittelman, G.; Kribus, A.; Mouchtar, O.; Dayan, A. Water desalination with concentrating photovoltaic/thermal (CPVT) systems. Sol. Energy 2009, 83, 1322–1334. [Google Scholar] [CrossRef]
- Hedayatizadeh, M.; Ajabshirchi, Y.; Sarhaddi, F.; Safavinejad, A.; Farahat, S.; Chaji, H. Thermal and Electrical Assessment of an Integrated Solar Photovoltaic Thermal (PV/T) Water Collector Equipped with a Compound Parabolic Concentrator (CPC). Int. J. Green Energy 2013, 10, 494–522. [Google Scholar] [CrossRef]
- He, Y.; Xiao, L.; Li, L. Theoretical and experimental study on the application of diffuse-reflection concentrators in PV/T solar system. Int. J. Energy Res. 2016, 40, 963–970. [Google Scholar] [CrossRef]
- Meng, X.-L.; Xia, X.-L.; Sun, C.; Li, Y.; Li, X.-L. A novel free-form Cassegrain concentrator for PV/T combining utilization. Sol. Energy 2016, 135, 864–873. [Google Scholar] [CrossRef]
- Koronaki, I.P.; Nitsas, M.T. Experimental and theoretical performance investigation of asymmetric photovoltaic/thermal hybrid solar collectors connected in series. Renew. Energy 2018, 118, 654–672. [Google Scholar] [CrossRef]
- Demircan, C.; Bayrakçı, H.C.; Keçebaş, A.; Calise, F.; Vicidomini, M. The effect of temperature distribution on parabolic triangular-based CPVT system performances: Electrical and thermal perspectives. Therm. Sci. Eng. Prog. 2023, 38, 101664. [Google Scholar] [CrossRef]
- Mojiri, A.; Taylor, R.; Thomsen, E.; Rosengarten, G. Spectral beam splitting for efficient conversion of solar energy—A review. Renew. Sustain. Energy Rev. 2013, 28, 654–663. [Google Scholar] [CrossRef]
- Howard, D.; Harley, R.G. Modeling of Dish-Stirling Solar Thermal Power Generation. In Proceedings of the IEEE PES General Meeting, Minneapolis, MN, USA, 25–29 July 2010; pp. 1–7. [Google Scholar]
- Fraser, P.R. Stirling Dish System Performance Prediction Model; University of Wisconsin: Madison, WI, USA, 2008. [Google Scholar]
- Noor, N.; Muneer, S. Concentrating Solar Power (CSP) and Its Prospect in Bangladesh. In Proceedings of the IEEE Conference Publications, Dhaka, 17–19 December 2009; pp. 1–5. [Google Scholar]
- William, B.S.; Richard, B.D. A Compendium of Solar/Dish Stirling Technology; Sandia National Laboratories, Albuquerque New Mexico 87185 and Livermore, California 94550; For the United States Department of Energy: Washington, DC, USA, 1994. [Google Scholar]
- Stine, W.B.; Geyer, M. Power from the Sun. 2001. Available online: http://powerfromthesun.net/ (accessed on 19 December 2023).
- Jiang, S.; Wang, G.; Jia, L. The Design of Beam Splitter for Two-Stage Reflective Spectral Beam Splitting Concentrating PV/thermal System. In Proceedings of the Asia-Pacific Power and Energy Engineering Conference, Wuhan, China, 25–28 March 2011. [Google Scholar]
- Wang, F.Q.; Lin, R.Y.; Liu, B.; Tan, H.P.; Shuai, Y. Optical efficiency analysis of cylindrical cavity receiver with bottom surface convex. Sol. Energy 2013, 90, 195–204. [Google Scholar] [CrossRef]
- Daabo, A.M.; Mahmoud, S.; Al-Dadah, R.K. The optical efficiency of three different geometries of a small-scale cavity receiver for concentrated solar applications. Appl. Energy 2016, 179, 1081–1096. [Google Scholar] [CrossRef]
- Daabo, A.M.; Mahmoud, S.; Al-Dadah, R.K. The effect of receiver geometry on the optical performance of a small-scale solar cavity receiver for parabolic dish applications. Energy 2016, 114, 513–525. [Google Scholar] [CrossRef]
- Shuai, Y.; Xia, X.-L.; Tan, H.-P. Radiation performance of dish solar concentrator/cavity receiver systems. Sol. Energy 2008, 82, 13–21. [Google Scholar] [CrossRef]
- Shuai, Y.; Xia, X.-L.; Tan, H.-P. Numerical Study of Radiation Characteristics in a Dish Solar Collector System. J. Sol. Energy Eng. 2008, 130, 021001. [Google Scholar] [CrossRef]
- Shuai, Y.; Xia, X.-L.; Tan, H.-P. Numerical simulation and experiment research of radiation performance in a dish solar collector system. Front. Energy Power Eng. China 2010, 4, 488–495. [Google Scholar] [CrossRef]
- Sha, L.; Guoqiang, X.; Xiang, L.; Yongkai, Q.; Yunting, G. Optical performance of a solar dish concentrator/receiver system: Influence of geometrical and surface properties of cavity receiver. Energy 2016, 113, 95–107. [Google Scholar]
- Reddy, K.S.; Sendhil, K.N.; Veershetty, G. Experimental performance investigation of modified cavity receiver with fuzzy focal solar dish concentrator. Renew. Energy 2015, 74, 148–157. [Google Scholar] [CrossRef]
- Glen, J. Focal region measurements of the 20 m2 tiled dish at the Australian National University. Sol. Energy 1998, 63, 117–124. [Google Scholar]
- Othman, M.Y.H.; Yatim, B.; Sopian, K.; Bakar, M.N.A. Performance analysis of a double-pass photovoltaic/thermal (PV/T) solar collector with CPC and fins. Renew. Energy 2005, 30, 2005–2017. [Google Scholar] [CrossRef]
- Han, X.; Tu, L.; Sun, Y. A spectrally splitting concentrating PV/T system using combined absorption optical filter and linear Fresnel reflector concentrator. Sol. Energy 2021, 223, 168–181. [Google Scholar] [CrossRef]


| No | Geometry | Dimensions | Width w (mm) | Perimeter * p (mm) | Depth d (mm) | Hydraulic Diameter Dh (mm) |
|---|---|---|---|---|---|---|
| 1. | 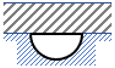 |  | 50.00 | 132.0 | 16.00 | 24.2 |
| 2. |  | 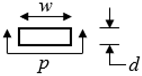 | 45.14 | 141.8 | 22.57 | 22.6 |
| 3. | 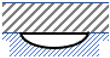 | 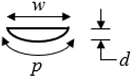 | 63.66 | 158.3 | 16.00 | 20.2 |
| 4. | 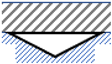 | 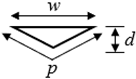 | 80.00 | 169.4 | 20.00 | 18.9 |
| No. | Geometry | (K) | ) | (K) | (K) | (kW) | (W) | (W) |
|---|---|---|---|---|---|---|---|---|
| 1(a) |  | 326.6 | 28.6 | 311.72 | 342.70 | 11.548 | 154 | 779 |
| 1(b) |  | 327.1 | 29.1 | 312.38 | 333.12 | 11.786 | 98 | 597 |
| 1(c) |  | 328.1 | 30.1 | – | 325.48 | 12.197 | – | 289 |
| 1(d) |  | 327.3 | 29.3 | – | 325.64 | 11.826 | – | 656 |
| 2(a) |  | 326.2 | 28.2 | 311.93 | 344.76 | 11.491 | 136 | 854 |
| 2(b) |  | 327.0 | 29.0 | 312.90 | 334.90 | 11.734 | 92 | 656 |
| 2(c) |  | 327.1 | 29.1 | – | 326.60 | 11.800 | – | 681 |
| 2(d) |  | 327.1 | 29.1 | – | 328.20 | 11.761 | – | 721 |
| 3(a) |  | 327.9 | 29.9 | 312.1 | 337.60 | 11.730 | 149 | 603 |
| 3(b) |  | 331.4 | 33.4 | 315.2 | 335.80 | 11.765 | 151 | 573 |
| 3(c) |  | 328.4 | 30.4 | – | 324.50 | 12.203 | – | 278 |
| 3(d) |  | 327.7 | 29.7 | – | 324.50 | 11.855 | – | 626 |
| 4(a) |  | 328.3 | 30.3 | 313.82 | 333.10 | 11.834 | 195 | 446 |
| 4(b) |  | 327.5 | 29.5 | 314.80 | 333.10 | 11.876 | 185 | 420 |
| 4(c) |  | 327.9 | 29.9 | – | 322.35 | 11.978 | – | 574 |
| 4(d) |  | 328.0 | 30.0 | – | 321.89 | 11.920 | – | 562 |
| Investigators | Type of Study | Type of CS System | Type of Cooling System | Optical CR | Cooling Fluid | ΔT (°C) |
|---|---|---|---|---|---|---|
| Akbarzadeh et al. [9] | Numerical and experimental | One-axis tracked east–west parabolic trough concentrator | Thermosyphon external to the system | 20 suns | R-11, R-22 and water | 21 |
| Othman et al. [33] | Experimental | Compound parabolic concentrator | Fins external to the system | 1.86 suns | air | 18 |
| Hedayatizadeh et al. [12] | Numerical | Compound parabolic concentrator | Duct external to the system | 2 suns | water | 7.7 |
| Han et al. [34] | Numerical | Linear flat mirror concentrator | Channel external to the system | 24 suns | liquid | 23.9 |
| Present work | Numerical | Hybrid photovoltaic/ parabolic dish concentrator | Channels embedded within the PV back sheet with different cross-sections and locations | 6.4 suns | water | 29-33 |
Disclaimer/Publisher’s Note: The statements, opinions and data contained in all publications are solely those of the individual author(s) and contributor(s) and not of MDPI and/or the editor(s). MDPI and/or the editor(s) disclaim responsibility for any injury to people or property resulting from any ideas, methods, instructions or products referred to in the content. |
© 2023 by the authors. Licensee MDPI, Basel, Switzerland. This article is an open access article distributed under the terms and conditions of the Creative Commons Attribution (CC BY) license (https://creativecommons.org/licenses/by/4.0/).
Share and Cite
Saeed, F.; Maatallah, T.; Houcine, A.; Jamal, A.; Ali, S. Novel Cooling Strategy for a Hybrid Photovoltaic/Parabolic Dish Concentrator. Appl. Sci. 2024, 14, 168. https://doi.org/10.3390/app14010168
Saeed F, Maatallah T, Houcine A, Jamal A, Ali S. Novel Cooling Strategy for a Hybrid Photovoltaic/Parabolic Dish Concentrator. Applied Sciences. 2024; 14(1):168. https://doi.org/10.3390/app14010168
Chicago/Turabian StyleSaeed, Farooq, Taher Maatallah, Ahlem Houcine, Arshad Jamal, and Sajid Ali. 2024. "Novel Cooling Strategy for a Hybrid Photovoltaic/Parabolic Dish Concentrator" Applied Sciences 14, no. 1: 168. https://doi.org/10.3390/app14010168
APA StyleSaeed, F., Maatallah, T., Houcine, A., Jamal, A., & Ali, S. (2024). Novel Cooling Strategy for a Hybrid Photovoltaic/Parabolic Dish Concentrator. Applied Sciences, 14(1), 168. https://doi.org/10.3390/app14010168