Featured Application
The investigated device could be used to tune the resonant frequency of a cantilever to harvest energy from vibrations to power wireless sensor networks for the internet of things.
Abstract
The inability to tune the frequency of MEMS vibration energy-harvesting devices is considered to be a major challenge which is limiting the use of these devices in real world applications. Previous attempts are either not compatible with microfabrication, have large footprints, or use complex tuning methods which consume power. This paper reports on a novel passive method of tuning the frequency by embedding solid microparticle masses into a stationary proof mass with an array of cavities. Altering the location, density, and volume of embedded solid filler will affect the resonant frequency, resulting in tuning capabilities. The experimental and computational validation of changing and tuning the frequency are demonstrated. The change in frequency is caused by varying the location of the particle filler in the proof mass to alter the center of gravity. The goal of this study was to experimentally and numerically validate the concept using macro-scale piezoelectric energy-harvesting devices, and to determine key parameters that affect the resolution and range of the frequency-tuning capabilities. The experimental results demonstrated that the range of the frequency tuning for the particular piezoelectric cantilever that was used was between 20.3 Hz and 49.1 Hz. Computational simulations gave similar results of 23.7 Hz to 49.4 Hz. However, the tuning range could be increased by altering the proof mass and cantilever design, which resulted in a tuning range from 144.6 Hz to 30.2 Hz. The resolution of tuning the frequency was <0.1 Hz.
1. Introduction
The internet of things (IoT) is composed of numerous wireless sensor networks (WSN), which consists of sensors, communications, a processing unit, and a power source. Each system can have unique components for a specific application, but each WSN needs a power source for sensing, electronics, and data transmission. Currently these are powered by batteries, which fail over time. As the demand for the IoT increases, the need to create a sustainable energy source to power the WSN increases. Numerous energy harvesting methods have been developed to resolve this issue including photovoltaics, thermal, and vibration or kinetic energy harvesters [1,2]. Vibration-based energy harvesters offer more diversity as most applications have some mechanical vibration that operates continuously. Kinetic energy harvesters can use different transduction mechanisms such as electromagnetic, electrostatic, piezoelectric, or triboelectric, but piezoelectric offers significant advantages such as high voltage output and less complex fabrication techniques for microelectromechanical systems (MEMS). There has been some initial research demonstrating the integration of kinetic energy harvesters into WSN at both the micro and macro scales [3,4]. However, MEMS-based kinetic energy harvesters present several challenges which have limited their success.
Challenges associated with MEMS kinetic energy harvesters include low power density, narrow bandwidth, lack of frequency tuning, and unreliability. Extensive research has been conducted on methods of increasing power density through optimizing materials, stress, electrode configuration, power management, and cantilever design [5,6,7,8,9,10,11]. Cantilevers are defined as a thin structure with a fixed end and a free end. MEMS energy harvesters typically have a narrow bandwidth (1–3 Hz) as they need a high Q factor to increase power density, but a narrow bandwidth prevents the device from being used in applications with varying resonant frequencies. Researchers have investigated numerous methods to increase bandwidth using non-linear dynamics [12,13,14], creating an array of devices with different frequencies [6,15] and movable mass [16,17,18,19,20,21,22,23], and using repulsive and attractive forces to slow or accelerate the cantilevers’ dynamics [24,25,26,27]. However, most of these methods either significantly decrease the power generated or they only slightly increase bandwidth to cover resonate frequency errors due to manufacturing. Most applications where energy harvesters would be used to power WSN have low-frequency vibrations (<250 Hz) and low accelerations (<1 g), but the frequency can change from application to application which makes creating a universal device difficult.
Tuning the frequency is another viable method to optimize power generation by matching the resonant frequency of the energy harvester to the vibration frequency. There are two scenarios where tuning the frequency is necessary. The first is during operation; if the frequency spectrum of the vibration changes and the bandwidth of the device is narrow, then the power generated will be significantly lower than expected. In this case, it would be ideal if the energy harvester’s frequency could be tuned to match the new vibration frequency. There have been several attempts to overcome this, including methods of altering the stiffness through light or electrical stimulation [28,29]. Other methods include altering the mass distribution using magnetics [30,31,32]. However, these methods require energy to tune the frequency, thus reducing the overall power generated.
The second scenario that requires tuning is during manufacturing. The advantage of MEMS energy harvesters is their ability to be batch fabricated to reduce cost; but with a narrow bandwidth (1–3 Hz), this means each device would need to be custom designed to meet the end-users’ specifications for a particular application, which significantly reduces the appeal of using MEMS energy harvesters. Therefore, there is a strong demand to create a MEMS energy harvester that could be tuned during manufacturing to take advantage of the batch fabrication capabilities. Researchers have investigated methods to tune the frequency by etching or removing sections of the cantilever or length [33]. However, this affects the dynamics and requires complex fabrication techniques. Researchers have tuned the frequency by adding mass through deposition or pick-and-place machines to reduce the frequency [31,34]. A recent conference paper by the authors demonstrated tuning capability using a proof mass cavity array to distribute the mass along the cantilever, which is the basis of this study [35].
This paper investigates a method to resolve the issue with tuning the frequency during manufacturing by creating a custom-designed cavity array proof mass, which can be filled individually to redistribute the mass load on the cantilever using solid micro/nano particles. Filling specific cavities will alter the total mass, thus changing the resonant frequency; but by varying the location, volume, and density of the filler, the resonant frequency can be finely tuned with a long frequency range. The goal is to increase both frequency tuning range and resolution. This study investigates altering the mass load distribution to tune the frequency using a macro-scale piezoelectric cantilever structure, but the concept could be scaled down to the micro-scale and could also be applied to various shaped structures. Accomplishing this task would allow manufacturers to create a single energy harvester device, that could be customized using back-end fabrication to fill specific cavities to meet the end user’s specifications. The method is validated both experimentally as well as numerically through finite element modelling (FEM) using various particles and a commercial low-frequency piezoelectric cantilever.
2. Materials and Methods
2.1. Concept
A simplified equation for predicting the 1st resonant frequency mode of a cantilever using point proof mass-based beam theory is given by the following equation [5,20,36]:
where E, m, w, t, and L are the elastic modulus, proof mass, width, thickness, and length of the beam, respectively. To tune the frequency one of these parameters would need to be altered. Altering the physical dimensions (L, t, and w) has been attempted using etching or laser dicing, but these methods are not practical for batch fabrication. Altering the elastic modulus can be done by adding additional layers to change the stiffness, but then this affects the neutral axis, which could alter piezoelectric performance. Therefore, altering the proof mass is the easiest method to change the resonant frequency during manufacturing. Equation (1) assumes the proof mass is a single point with a center of gravity at the centroid of the proof mass. The concept of altering the proof mass to reduce the resonant frequency can also be applied to other structures such as plates, fixed–fixed suspensions, and membranes. However, changing the location of the center of gravity of the proof mass will also affect the resonant frequency, as illustrated by Equation (2) which combines Equation (1) with the Rayleigh principle [19,20,37]:
where r = lc/L, and lc is the length location of the center of gravity. Thus, shifting the center of gravity towards the free end will reduce the frequency, and shifting center of gravity closer to the tethered end will increase the frequency. The center of gravity along the width also influences the resonant frequency and higher order resonant frequencies that have a twisting motion. However, the goal of this study was to investigate the 1st order out-of-plane mode, as this is the most common mode used to harvest high-power-density energy harvesters. These equations illustrate that altering the magnitude and location of the mass will alter the resonant frequency.
The tuning method investigated in this study involves creating a proof mass with an array of cavities which can be filled with a solid mass (microparticles) to alter the center of gravity, which should alter the resonant frequency. By modifying the type of particles (density), the volume, and the location of the filled cavities, the cantilever should be capable of being tuned. The resolution of tuning should be dependent on the volume of the cavity, whereas the range of tuning should be dependent on the change in the overall mass. Thus, higher density and volume should increase the potential range of tuning. Figure 1a,b illustrate the schematic of the proof mass with cavities. An example of the nomenclature used in this paper to identify the cavities is H24, where the first digit represents the row, and the second digit represents the column number.

Figure 1.
(a) Schematic of piezoelectric cantilever with custom-made proof mass consisting of 9 × 7 array of cavities with 3 × 3 × 20 mm and top capping layer; (b) top view of arrays with labelled rows and columns; (c) image of testing setup with vibration shaker and oscilloscope; and (d) image of the mounted device on a vibration shaker.
2.2. Energy-Harvesting Device
Commercial lead zirconate titanate (PZT)-based piezoelectric cantilevers were used to validate the concept. A low-frequency (125 Hz w/no mass) cantilever (Mide, Woburn, MA, USA, V25W) with dimensions of 57.2 × 38.1 × 0.6 mm (L, w, and t), and a higher frequency (440 Hz w/no mass) cantilever (Mide, S233-H5FR-1107XB) with dimensions of 53 × 20.8 × 0.83 mm were used. Most of the results illustrated in this paper used the low-frequency (V25W) cantilever unless otherwise specified. The high-frequency cantilever was used to illustrate methods of increasing frequency range. The proof mass was 3D printed using polylactic acid (PLA) and an Ultimaker S5 printer. The proof mass had dimensions of 30 × 38.1 × 20 mm, with a 1 mm thick capping layer. The initial proof mass had a 9 × 7 cavity array of 3 × 3 × 20 mm. Additional proof masses of 5 × 7 arrays were made to determine the effects of increasing cavity size on tuning ability. The overall mass of the (0% filled) 9 × 7 proof mass was 12.76 g, and the 5 × 7 proof mass was 13.22 g. The proof masses were then bonded to the cantilever. A rectangular-shaped proof mass was chosen due to the rectangular shape of the cantilever, where the width of the proof mass was equal to the width of the cantilever. The size of the cavities was selected based on the array size and overall width of the proof mass.
2.3. Cavity Filling
The density and fill factor for the particles will alter the overall mass. Three different powders consisting of microparticles with varying densities were investigated (Tungsten, Molybdenum, and Silica). The three different types of particles had significantly different densities, which is why they were selected to demonstrate large changes in overall mass. Tungsten and Molybdenum powders were purchased from Elmet technologies (W = UX-5, with an average diameter of 75 μm and a density of 7 g cm−3). Molybdenum powder had an average size of 40 μm and a density of 3 g cm−3. The Silica powder was purchased from GoodFellow, and had an average size of 45 μm and a density of 2.13 g cm−3. However, the average filling density will be affected by the fill factor which is dependent on the filling technique, and the size and shape of the particles. The effective densities of the powders and fill factors were measured by filling the cavities of known volume and measuring the increase in mass after filling. The process was repeated 25 times to get an average fill factor. The fill factor was determined based on the measured density and the manufacturer’s specified density. No additional treatment was administered to the powders prior to filling the cavity. The cavities were filled using a syringe and leveled using a doctor blade to prevent overfilling.
2.4. Experimental Testing
The cantilever with proof mass was mounted on a vibration shaker (ET 139, Labworks, Costa Mesa, CA, USA) as shown in Figure 1c. A clamp with metal screws was used to mount it to the shaker. An accelerometer was mounted to provide feedback control with <0.01 g accuracy. The accelerometer was used to determine how much acceleration was being applied to the cantilever, as power output is dependent on applied acceleration. The piezoelectric cantilever was connected to an oscilloscope (Tektronix 100 MHz with 5 GS/s sampling rate). This setup has been described in more detail previously [6]. The open circuit peak-to-peak voltage was measured, and the frequency was swept to determine the resonant frequency. The power generated was measured by matching the impedance, but the majority of data illustrates the open circuit Vpp, as the goal of this study was to illustrate frequency tuning which can be analyzed using open circuit voltage. Only the output voltage associated with the 1st resonant frequency mode was measured in this study, as it provides the highest voltage output at the lowest frequency, which is the primary mode used in energy-harvesting devices. The frequency sweep was performed at a rate of 0.02 Hz/s. The applied acceleration of 0.2 g was used in this study as most kinetic energy-harvesting applications operate with <0.5 g. The 1st resonant frequency mode was determined to be the frequency with the highest output voltage at the lowest frequency. To determine the potential frequency tuning range, the control (a cantilever with 0% filled cavities was used as the reference) was used as the upper limit and a mass with 100% filled cavities was used as the lower limit. To determine the resolution and the effects of varying the center of gravity’s location, we filled individual cavities and proceeded to fill entire rows and columns to determine their effects on tuning.
2.5. Computational Modelling
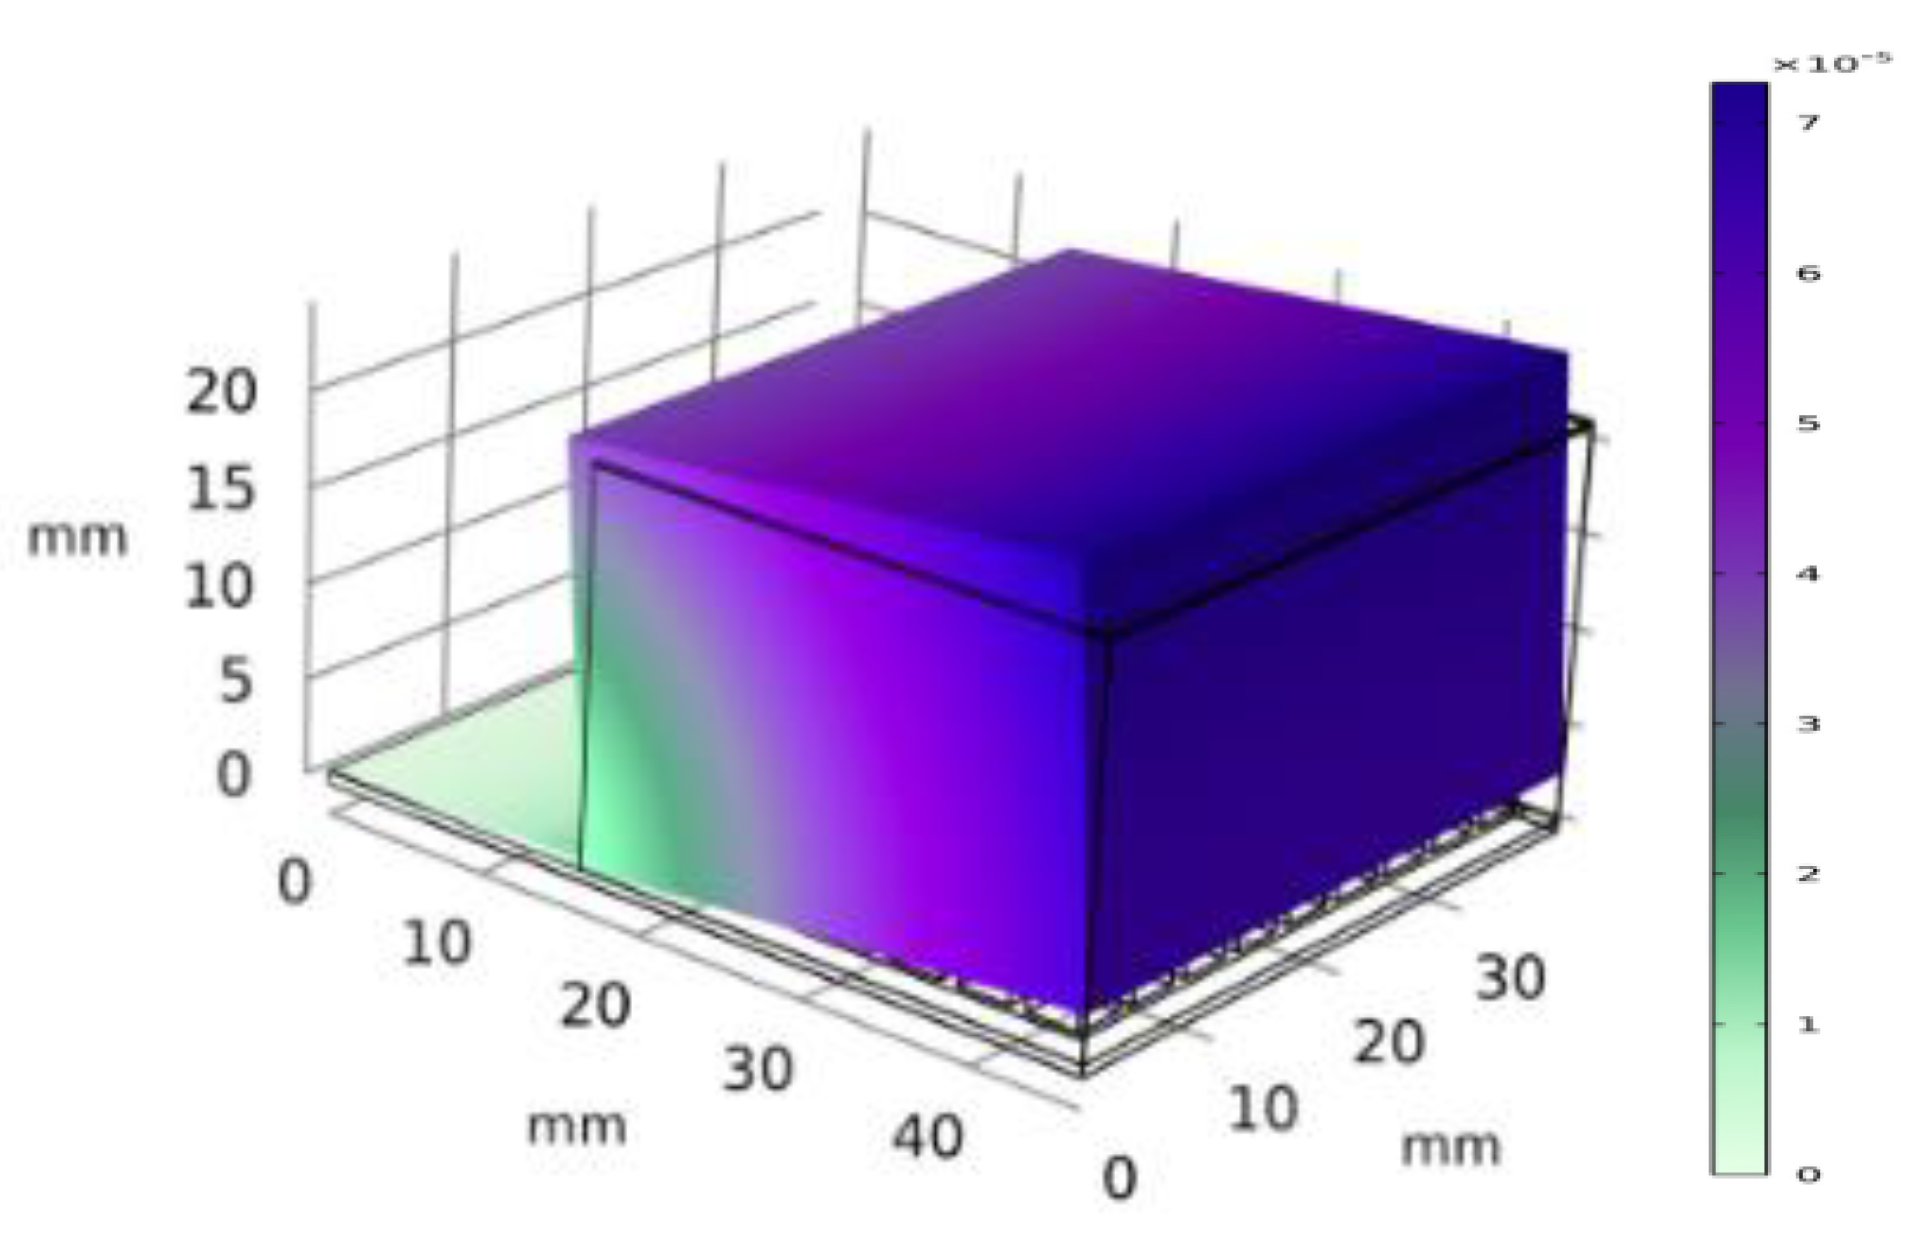
COMSOL Multiphysics FEM was used to simulate the modal analysis of the cantilever with integrated proof mass, as this could be used as a tool to determine which cavities to fill and what density filler to use to achieve the specified resonant frequency. The commercial cantilevers consisted of multiple stacked layers including FR4 (glass-reinforced epoxy resin used in printed circuit boards), PZT, and Cu layers. The overall cantilever consists of stacked films of FR4/Cu/PZT/Cu/FR4. The PZT layer is the piezoelectric film (190 μm) which requires a top and bottom electrode consisting of Cu layers (30 μm each), and the FR4 was used as a protective layer and to alter the stiffness of the cantilever. A cantilever without a proof mass was originally used to model the cantilever. Since the elastic modulus of each layer can vary significantly depending on how it is manufactured, the stacked beam was considered as a single hybrid layer. To create an accurate FEM, we experimentally determined the modal analysis frequencies of the cantilever, and then adjusted the elastic modulus of the cantilever in COMSOL until the FEM resonant frequency matched the experimental results. The elastic modulus of the stacked layers was determined to be 52 GPa, which makes sense since PZT has a modulus of 70–120 GPa, Cu’s is 110 GPa, and the average for FR4 is 26 GPa. Due to laws of mixture, an elastic modulus of 52 GPa is a reasonable value that matches the experimental data. The cavity filler in the FEM was assumed to be a solid rectangle with a density that matched the particle density specified by the manufacturer. A tetragonal finer mesh was used with a minimum element size of 0.185 and the tethered end of the cantilever was anchored. The placement of the filler mass varied, and the 1st resonant frequency mode was monitored and compared to the experimental data. Figure 2 illustrates the FEM of the cantilever and proof mass.
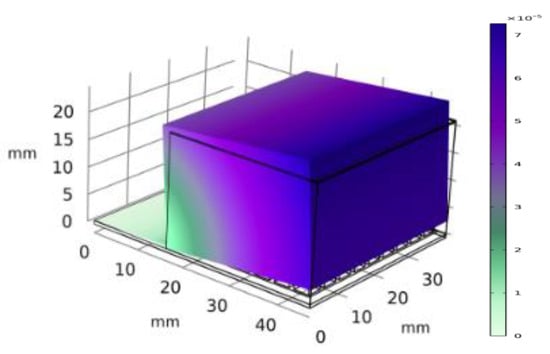
Figure 2.
COMSOL Multiphysics simulation displacement results for the cantilever and proof mass.
3. Results and Discussion
3.1. Density of Fillers
The microparticles will not occupy the entire volume of the cavity due to the shape of the particles, so there will be some empty space occupied by air. Therefore, the effective density of the filled cavity will not be the same as the density of the individual particles. The effective density and the average fill factor were needed to accurately determine the average mass added to each cavity. The fill factor represents the volume of particles as a function of cavity volume. The fill factor was determined by first measuring the mass before and after adding the filler to the cavity, which can be used to determine the experimental density based on the volume of the cavity. Then the fill factor was determined by dividing the experimental density by the manufacturer’s measured density of the particles. If there were no air gaps, then the density values would be equal, and the fill factor would be 100%. The effective densities of the three powders used are illustrated in Table 1, where the average density is based on the volume and the average mass used to fill an individual cavity. The individual particles still have the same density as determined by their specifications, but due to gaps between particles, the effective density was decreased. The average fill factor was dependent on size of the particles, as smaller particles resulted in a higher fill factor. However, since all the filler particles had a similar size, the fill factors were similar, resulting in W having the highest effective density, followed by Mo, and then Silica, which was expected. The fill factor could be improved by using a compression method or smaller particles, but for this study we wanted to determine the effects of fillers with different densities.

Table 1.
Filler Density Measurements.
3.2. Tuning Range
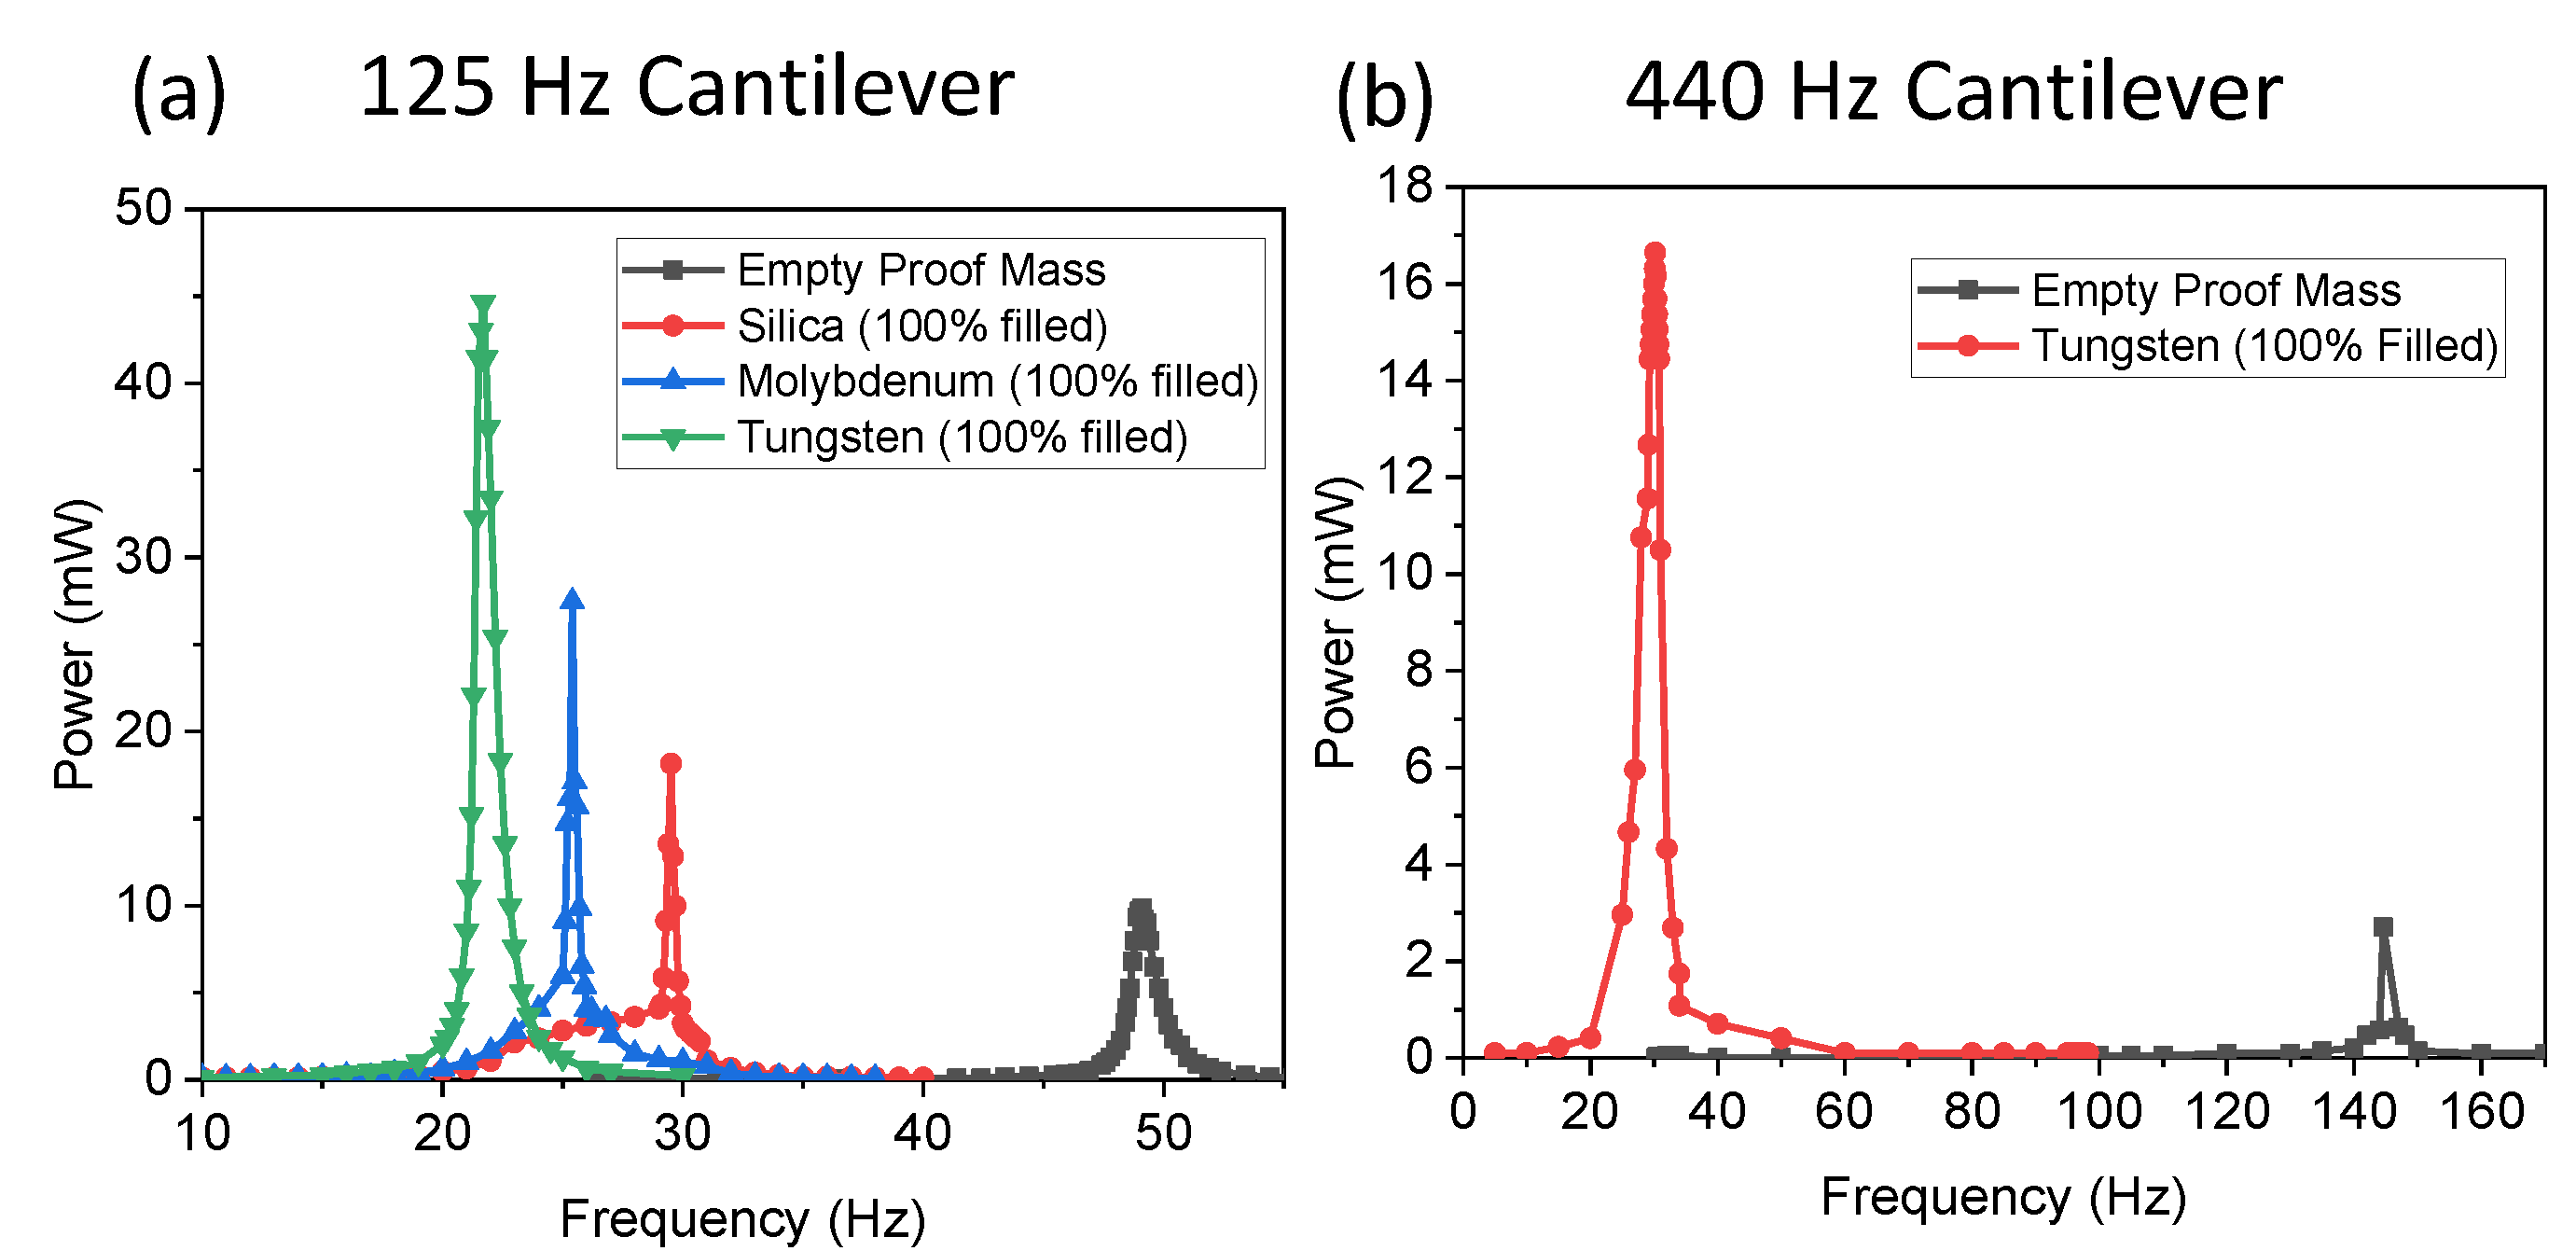
Frequency as a function of power output was used to illustrate the tuning range that was achievable for the given cantilever with various fillers. The cantilever with an empty proof mass was used to represent the maximum frequency, while the proof mass with all the cavities filled (100%) was used to illustrate the minimum frequency that could be achieved with the various powders. The results are shown in Figure 3a for the V25W cantilever, which had an initial resonant frequency of 125 Hz without a proof mass. Adding an empty proof mass/cap decreased the resonant frequency to 49.1 Hz due to the additional weight. Filling the proof mass with the various powders decreased the resonant frequency. The resonant frequencies for the 100% filled cavities were 29.5, 25.4, and 21.7 Hz for Silica, Molybdenum, and Tungsten, respectively. The Silica-filled proof mass had the least weight per cavity and resulted in the lowest potential tuning range of 19.6 Hz (40% tuning reduction), while the Tungsten-filled proof mass demonstrated a tuning range of 27.4 Hz (55.8% tuning reduction). The output power also increased as mass increased due to increased stress/strain, which resulted in increased power. The FEM-simulated resonant frequency for Tungsten-filled solid proof mass resulted in a frequency of 22.55 Hz (3.92% error from the experimental data). The error is likely due to the potential error in filling each cavity with the same mass, as the fill factor and density of the powders had some variation as shown in Table 1.
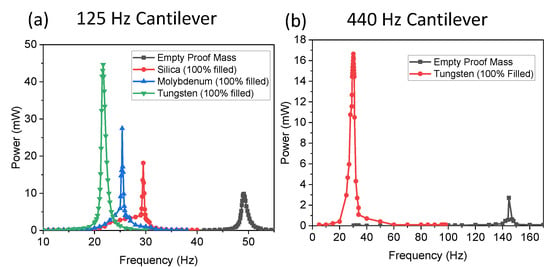
Figure 3.
Experimental results illustrating power as a function of frequency for the 1st resonant frequency mode in (a) a low-frequency cantilever (V25W) with various filled proof masses and (b) a high-frequency cantilever (S233-H5FR-1107XB) with empty and Tungsten-filled proof mass.
The tuning potential of the V25W cantilever was relatively low as the initial frequency with proof mass was low (49.1 Hz), which limited the potential tuning range as adding mass can only decrease the resonant frequency. However, high-frequency cantilevers should demonstrate increased tuning range. To demonstrate this, a higher resonant frequency (440 Hz) cantilever (Mide, S233-H5FR-1107XB) was investigated with the same empty proof, and then the cavities were filled with 100% Tungsten. The results are shown in Figure 3b, where the cantilever with empty proof mass had a frequency of 144.6 Hz. When the cavities were filled with Tungsten powder, the resonant frequency decreased to 30.2 Hz, thus demonstrating a 114.4 Hz tuning range potential (79.1% tuning reduction). The tuning range could be increased further by decreasing the mass of the initial proof mass, increasing the initial frequency of the cantilever, or increasing the amount/density of the filler. The power output values between the two different cantilevers were different due to the dimensional changes which affect the frequency and voltage output.
To further illustrate methods to increase tuning range, the cavity dimensions were increased from 3 × 3 mm to 4.8 by 4.8 mm (5 × 7 array) and the gap spacing between the cavities was reduced to 0.5 mm instead of 1 mm. This resulted in a decrease in the initial proof mass, but allowed for increased mass from the filler. For the V25W cantilever, this resulted in an empty proof mass frequency of 53.7 Hz (increase of 4.6 Hz or 9.37%) and a 100% Tungsten-filled resonant frequency of 19.2 Hz (decrease of 2.5 Hz or 11.5%), illustrating a tuning range of 34.5 Hz (64.3% reduction) compared to the 7 × 9 array, which had a tuning range of 27.4 Hz (55.8% reduction). Therefore, optimizing the cavity array dimensions could be used to further increase the tuning range in the future.
3.3. Tuning Resolution
The frequency tuning resolution that can be achieved is also important, as most low-frequency MEMS energy-harvesting devices have narrow bandwidths of approximately 1–3 Hz (approximately 1% of the resonant frequency) [5,6]. Therefore, the ability to tune the frequency to sub-Hz resolution is desired to maximize power output. Individual cavities were filled with various powders to demonstrate the potential frequency tuning resolution that could be achieved. Figure 4 illustrates the frequency values for filling the middle column cavities in the 7 × 9 array. The results illustrate that filling the free end Row 1 (H15) middle cavity had the largest change in frequency of 1 Hz, 2.9 Hz, and 3.5 Hz for Silica, Mo, and W, respectively. However, filling the last row closer to the tethered end (H75) had the least change, resulting in change of frequency of 0.1 Hz, 0.5 Hz, and 0.7 Hz for Silica, Mo, and W, respectively. The results were expected, as Equation (2) illustrates that as the center of gravity moves closer to the free end, the frequency will decrease compared to a central center of gravity. The frequency was dependent on the density of the filler, as W powder caused a larger change in frequency than Silica or Mo, given the same filled cavity. Figure 4b demonstrates that the FEM model had similar results compared to the experimental data, thus validating the model.

Figure 4.
(a) Experimental results illustrating 1st mode resonant frequency as a function of filling individual cavities along the middle column with W, Mo, and Silica powders, (b) results of simulated FEM versus experimental results of W-filled cavities, and (c) image of filled column.
The effect on tuning resolution by filling a row instead of a column is illustrated in Figure 5, where the middle row cavities were filled (H4n, where n is the various columns in the array). Filling cavities along the row had little impact on the resonant frequency as it was mostly influenced by the overall change in mass and not the location of the cavity. The frequency difference between filling the middle cavity (H45) versus filling the most lateral cavity (H41) was 0.5 Hz, 1 Hz, and 0.5 Hz for Silica, Mo, and W, respectively. However, there was a frequency reduction from the original frequency of 49.1 Hz for all proof masses, where W had the largest reduction, which was expected. This illustrates that additional mass added to lateral cavities reduces the frequency due to the mass change but not due to the lateral location, so filling these cavities could be used to tune the frequency with sub-Hz resolution. The lateral filled cavities could help to reduce the 2nd frequency mode which has a twisting motion, but this mode would have higher frequency and lower displacement, resulting in low power density, so we primarily investigated the 1st mode. Figure 5b illustrates similar results between the FEM and the experimental versions.

Figure 5.
(a) Experimental results illustrating 1st mode resonant frequency as a function of filling individual cavities along the middle row with W, Mo, and Silica powders, (b) results of simulated FEM versus experimental results of W powder, and (c) image of filled row.
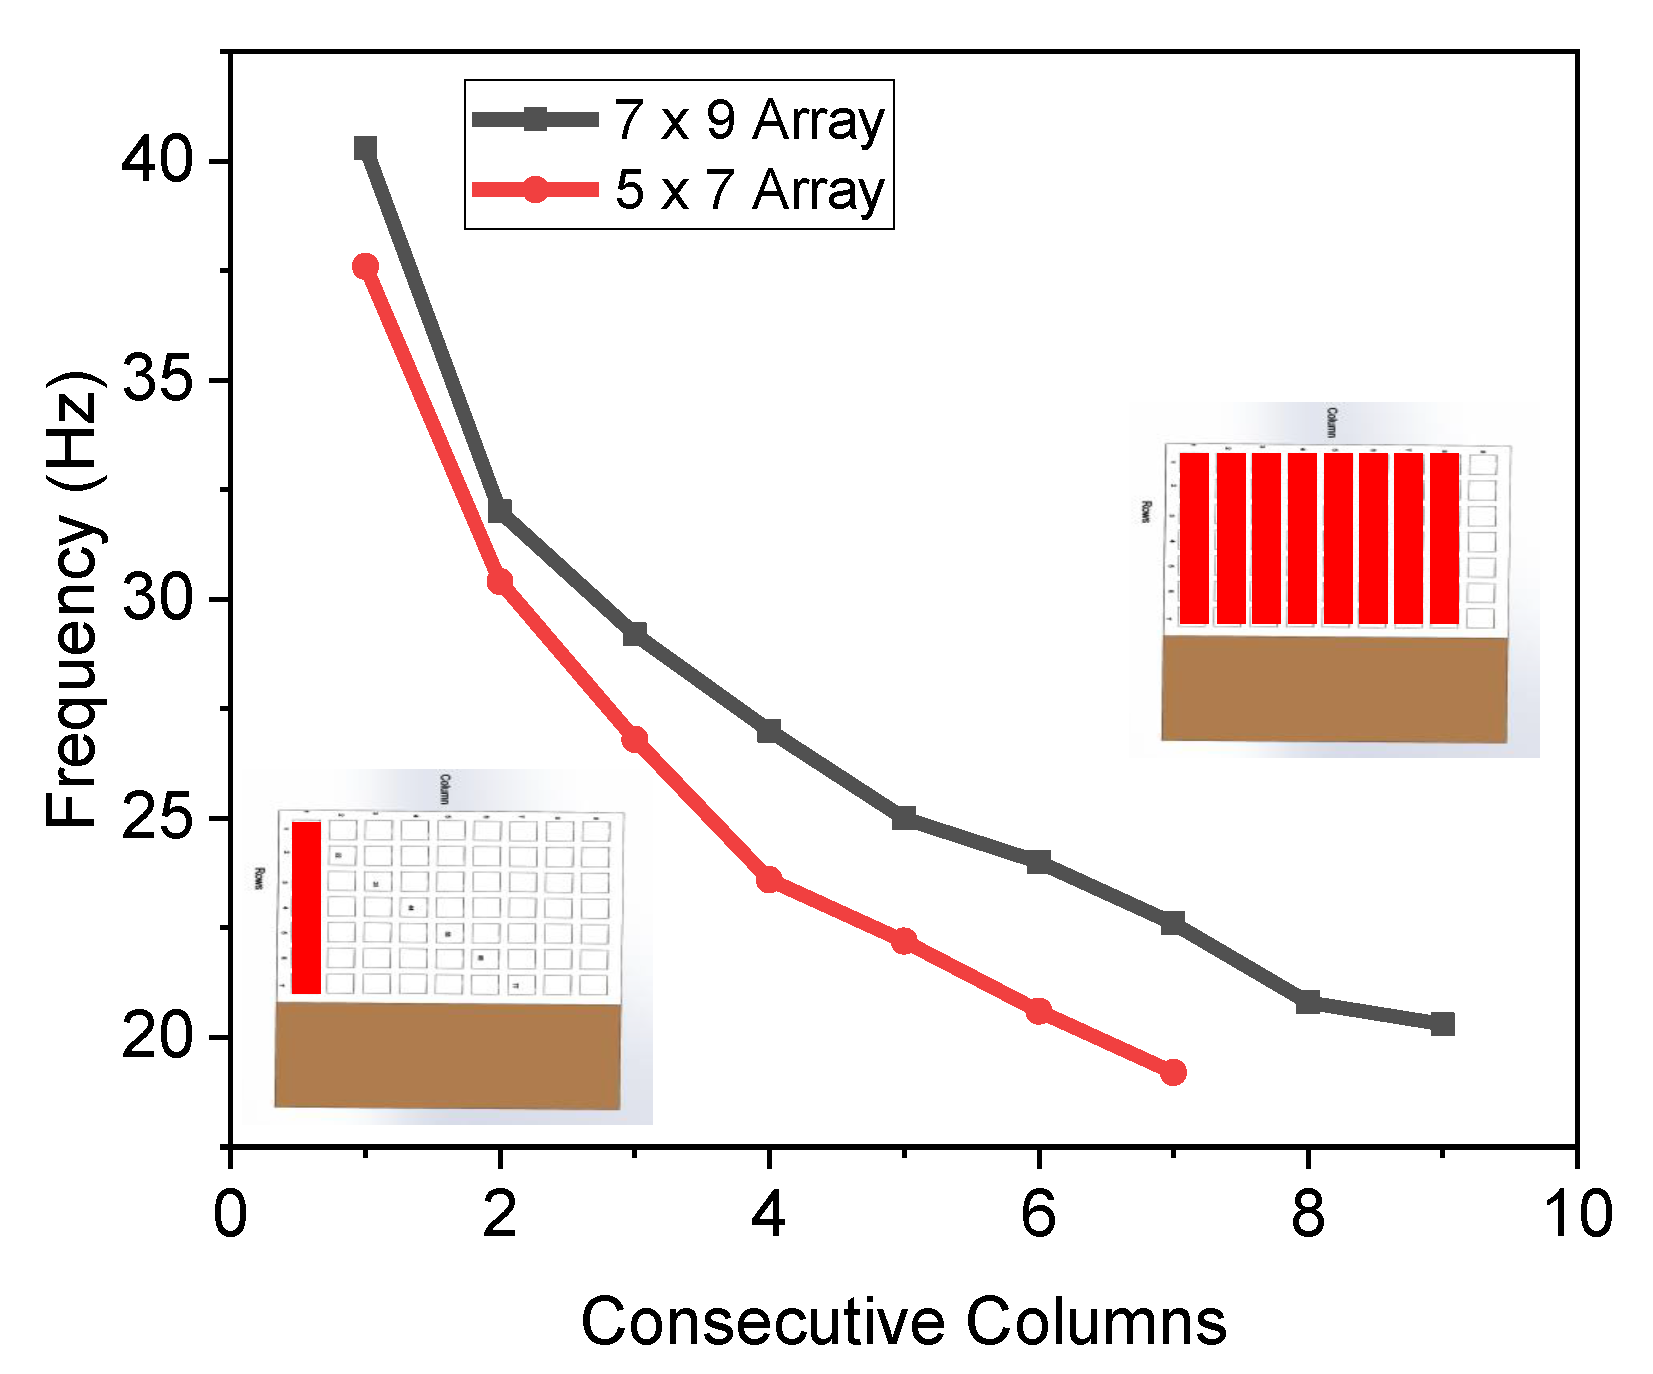
The dimensions of the proof mass cavities have a significant influence on the range and resolution of the tuning capabilities. Figure 6 illustrates the impact of using a 7 × 9 array with smaller width and length of cavities compared to a 5 × 7 array with larger cavities. The overall dimensions of the proof mass remained the same except for the cavity and gap dimensions. The results illustrate that the larger cavities from the 5 × 7 array caused a decrease in frequency for any given filled column. Since filling the columns resulted in a symmetric frequency change as shown in Figure 5, the filling order does not have an influence on the resonant frequency.
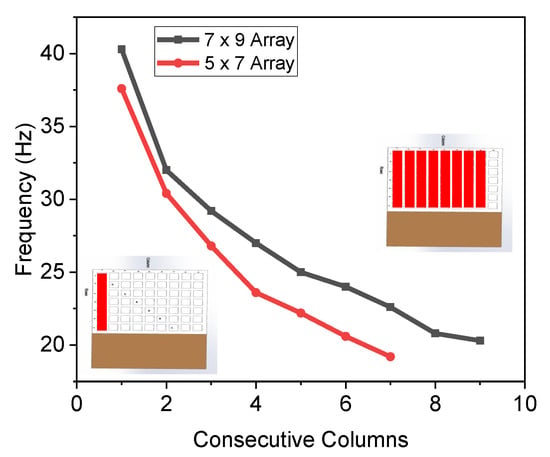
Figure 6.
Experimental results illustrating 1st mode resonant frequency as a function of filling consecutive columns, starting with the most lateral (C1), using W powder for both a 5 × 7 array and a 7 × 9 array.
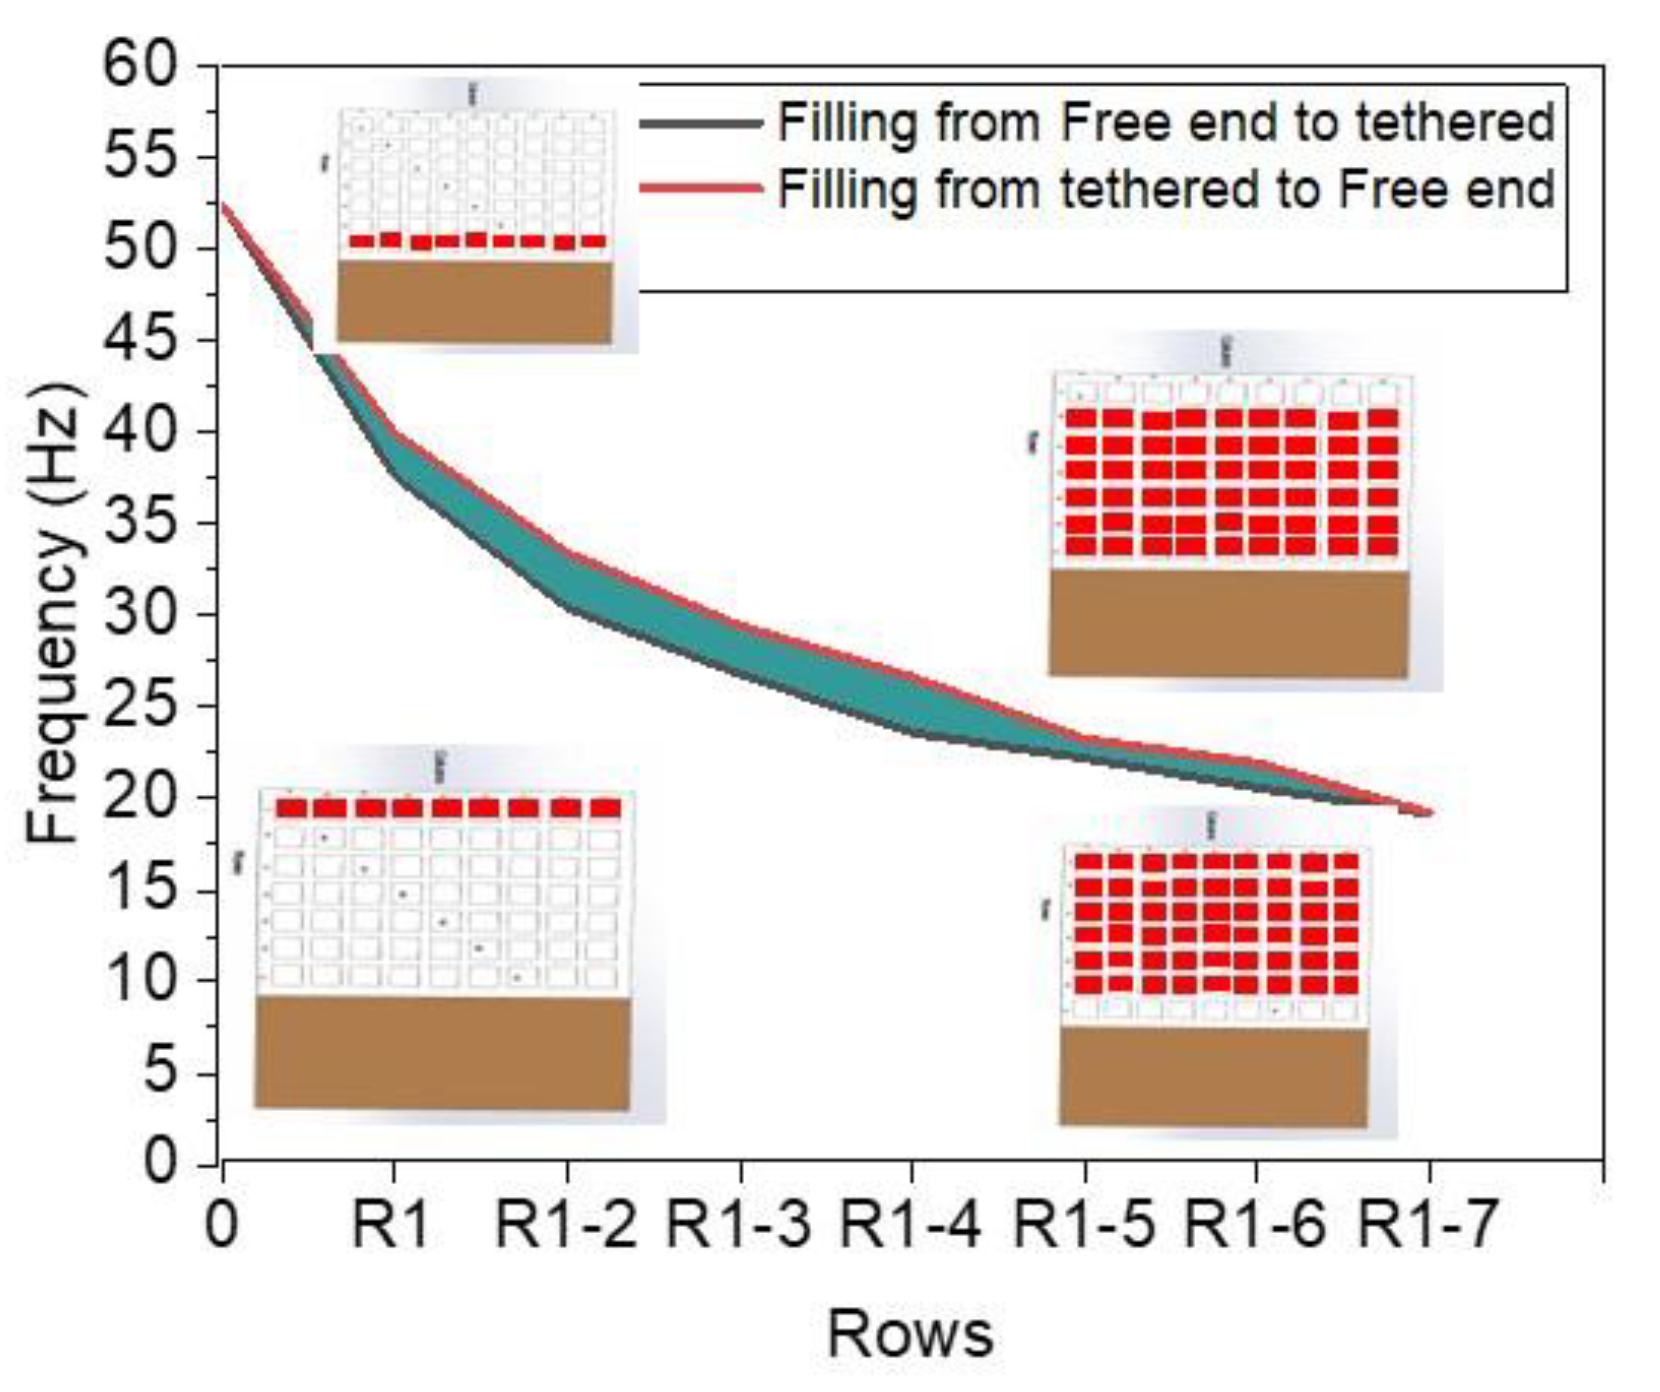
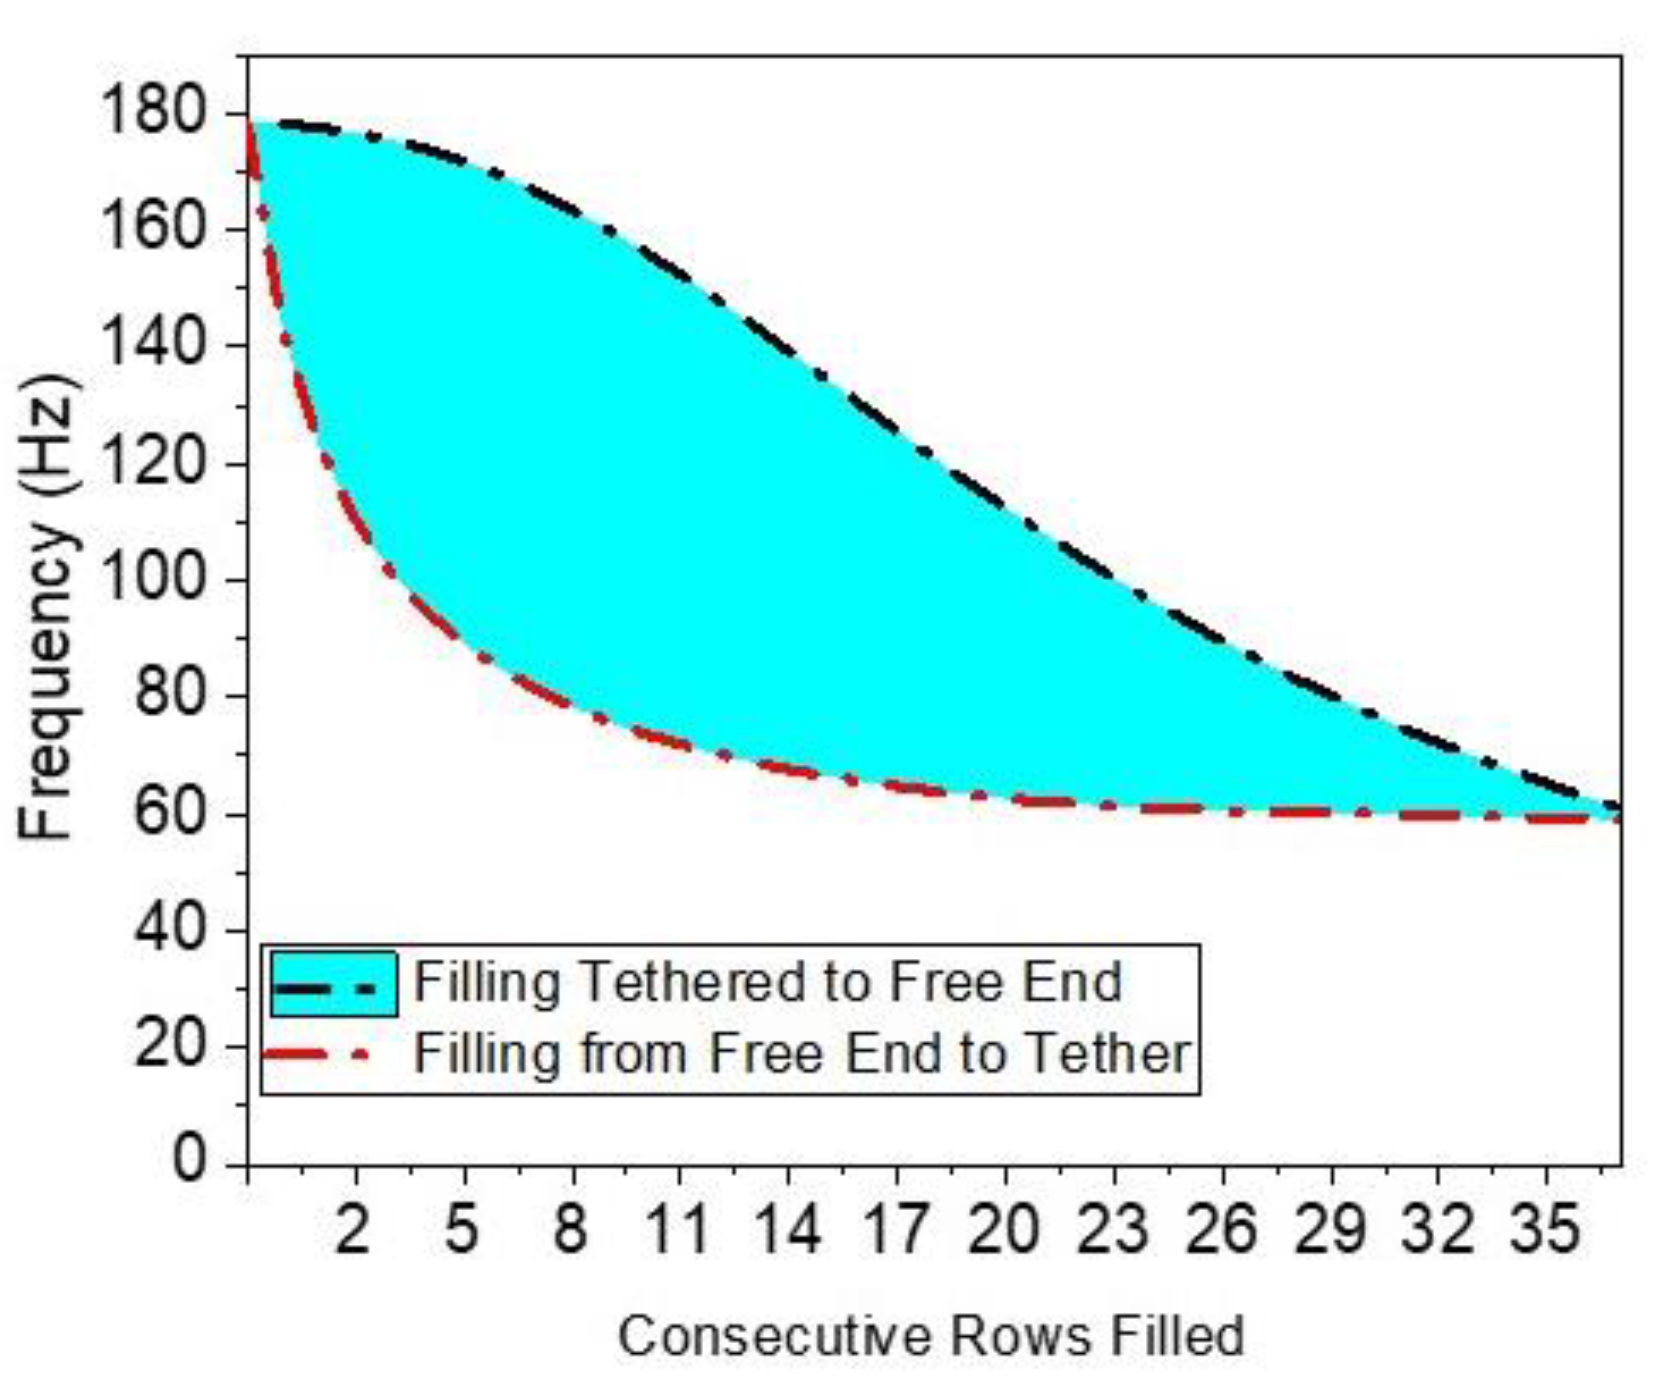
The order of filling the columns did not significantly influence the resonant frequency because the lateral location has little impact on the 1st frequency mode, so the effective change in frequency was due to the change in overall mass. However, filling consecutive rows should have an influence as per Equation (2). The experimental results of the 1st mode frequency as a function of filling rows of cavities in both directions (free end to tethered end, and tethered end to free end) for W-filled cavities are illustrated in Figure 7. The colored space between both curves represents the possible frequency values that could be achieved by filling the cavities. The results show that any specific frequency can be achieved within the given range. Mismatching different types of fillers could also be used to enhance resolution even more—for example, you could fill H45 with W to reduce the frequency, and then fill cavity H41 with Silica to obtain a large range with high resolution.
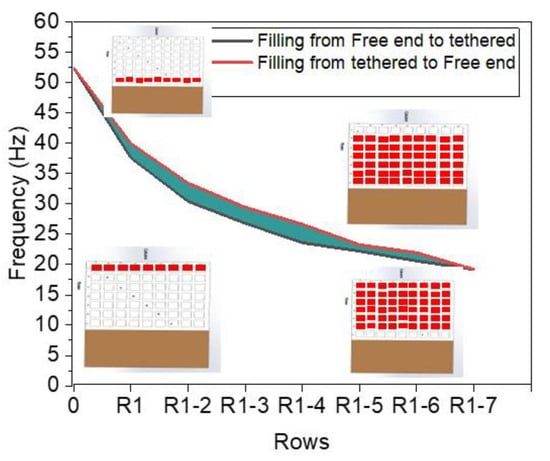
Figure 7.
Experimental results illustrating 1st mode resonant frequency as a function of filling consecutive rows in both directions (black—free end to tethered end, and red—tethered end to free end).
3.4. MEMS Tuning Simulation
To illustrate the potential tuning capability at the MEMS scale, COMSOL FEM was used to simulate the results. A silicon cantilever with dimensions of 9.5 × 11 × 0.025 mm (w × l × t) was developed based on previous research [5,6]. A silicon proof mass (650 μm thick) with an array of 38 × 38 cavities that were 235 × 235 μm squares was simulated. A solid rectangle of W with a density of 4.33 g cm−3 was used to fill the cavities. The result of filling consecutive rows in both directions (free end to tethered end and tethered to free) is illustrated in Figure 8. In the figure the x-axis represents consecutive filled rows, so 2 on the x-axis represents the red line filling rows 1 and 2, whereas the black line represents filling rows 37 and 38. The results demonstrate the potential to have a tuning range from 178 Hz to 59 Hz using standard MEMS energy-harvesting devices. The tuning range could be further increased by increasing the density of the filler or decreasing the density of the proof mass. The results illustrate the potential to use this method in a scaled-down device. However, developing methods of dispensing the particles into sub-mm cavities would need to be investigated further.
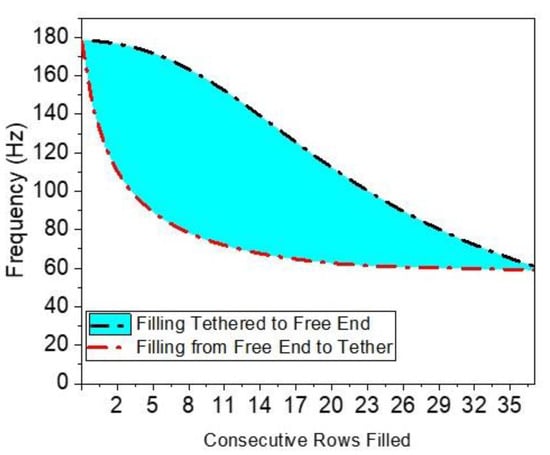
Figure 8.
Simulated frequency tuning range of MEMS cantilever filled with W powder. The black dashed line shows the frequency by filling consecutive rows from the tethered to the free end, and the red line shows filling from free end to tethered end. The area between the curves demonstrates all the possible frequencies that could be achieved.
4. Conclusions
This study demonstrated a passive method of tuning the frequency of an energy-harvesting cantilever structure during manufacturing by adjusting the mass load distribution along the cantilever. The method was experimentally and numerically validated using a macro-scale piezoelectric energy-harvesting cantilever, with a custom-designed 3D-printed proof mass consisting of an array of cavities that were filled with various microparticles with varying density. This method could be applied to MEMS devices by filling cavities during the back-end processing steps to meet the frequency specifications’ needs. The results illustrate that a wide range of frequency tuning was achieved which was dependent on the initial resonant frequency of the cantilever, the mass of the empty proof mass, the overall volume of cavities available to be filled, the density, and the fill factor of the microparticles. The resolution of the frequency could be sub-Hz, which was dependent on individual cavity volume and density, the fill factor of the microparticles, and the location of the cavity. Overall, the method used has numerous advantages, including ease of implementation, infinite possible frequency outcomes (by using multiple powders), and proof mass designs. The potential scalability of the method is also advantageous. The concept was illustrated using a rectangular proof mass with square cavities, but the concept could be applied to other shapes as well.
Author Contributions
Conceptualization, N.J.; methodology, R.A.; computation, R.A.; validation, R.A.; investigation, R.A.; resources, N.J.; writing—original draft preparation, R.A.; writing—review and editing, N.J. and R.A.; supervision, N.J.; project administration, N.J.; funding acquisition, N.J. All authors have read and agreed to the published version of the manuscript.
Funding
This research was funded by the National Science Foundation’s EPSCoR Program, grant number OJA-1757207; and the National Science Foundation’s NSF CAREER program, grant number 2237086.
Institutional Review Board Statement
Not applicable.
Informed Consent Statement
Not applicable.
Data Availability Statement
The data presented in this study are available on request from the corresponding author. The data are not publicly available due to privacy.
Acknowledgments
The authors would like to thank their fellow colleagues of the SMART Lab at the University of New Mexico.
Conflicts of Interest
The authors declare no conflicts of interest.
References
- Hidalgo-Leon, R.; Urquizo, J.; Silva, C.E.; Silva-Leon, J.; Wu, J.; Singh, P.; Soriano, G. Powering nodes of wireless sensor networks with energy harvesters for intelligent buildings: A review. Energy Rep. 2022, 8, 3809–3826. [Google Scholar] [CrossRef]
- Shaikh, F.K.; Zeadally, S. Energy harvesting in wireless sensor networks: A comprehensive review. Renew. Sustain. Energy Rev. 2016, 55, 1041–1054. [Google Scholar] [CrossRef]
- Adu-Manu, K.S.; Adam, N.; Tapparello, C.; Ayatollahi, H.; Heinzelman, W. Energy-Harvesting Wireless Sensor Networks (EH-WSNs) A Review; ACM Transactions on Sensor Networks (TOSN): New York, NY, USA, 2018; Volume 14, pp. 1–50. [Google Scholar]
- Iqbal, M.; Nauman, M.M.; Khan, F.U.; Abas, P.E.; Cheok, Q.; Iqbal, A.; Aissa, B. Vibration-based piezoelectric, electromagnetic, and hybrid energy harvesters for microsystems applications: A contributed review. Int. J. Energy Res. 2020, 45, 65–102. [Google Scholar] [CrossRef]
- Andosca, R.; McDonald, T.G.; Genova, V.; Rosenberg, S.; Keating, J.; Benedixen, C.; Wu, J. Experimental and theoretical studies on MEMS piezoelectric vibrational energy harvesters with mass loading. Sens. Actuators A Phys. 2012, 178, 76–87. [Google Scholar] [CrossRef]
- Jackson, N.; O’keeffe, R.; Waldron, F.; O’neill, M.; Mathewson, A. Evaluation of low-acceleration MEMS piezoelectric energy harvesting devices. Microsyst. Technol. 2013, 20, 671–680. [Google Scholar] [CrossRef]
- Lee, M.-S.; Kim, C.-I.; Park, W.-I.; Cho, J.-H.; Paik, J.-H.; Jeong, Y.H. Energy harvesting performance of unimorph piezoelectric cantilever generator using interdigitated electrode lead zirconate titanate laminate. Energy 2019, 179, 373–382. [Google Scholar] [CrossRef]
- Pertin, O.; Shrivas, P.; Guha, K.; Rao, K.S.; Iannacci, J. New and efficient design of multimode piezoelectric vibration energy harvester for MEMS application. Microsyst. Technol. 2021, 27, 3523–3531. [Google Scholar] [CrossRef]
- Ren, Z.; Wu, L.; Zhang, J.; Wang, Y.; Wang, Y.; Li, Q.; Wang, F.; Liang, X.; Yang, R. Trapezoidal Cantilever-Structure Triboelectric Nanogenerator Integrated with a Power Management Module for Low-Frequency Vibration Energy Harvesting. ACS Appl. Mater. Interfaces 2022, 14, 5497–5505. [Google Scholar] [CrossRef]
- Song, H.-C.; Kumar, P.; Maurya, D.; Kang, M.-G.; Reynolds, W.T.; Jeong, D.-Y.; Kang, C.-Y.; Priya, S. Ultra-Low Resonant Piezoelectric MEMS Energy Harvester with High Power Density. J. Microelectromech. Syst. 2017, 26, 1226–1234. [Google Scholar] [CrossRef]
- Wang, L.; Zhao, L.; Luo, G.; Zhao, Y.; Yang, P.; Jiang, Z.; Maeda, R. System level design of wireless sensor node powered by piezoelectric vibration energy harvesting. Sens. Actuators A Phys. 2020, 310, 112039. [Google Scholar] [CrossRef]
- Hajati, A.; Kim, S.-G. Ultra-wide bandwidth piezoelectric energy harvesting. Appl. Phys. Lett. 2011, 99, 083105. [Google Scholar] [CrossRef]
- Nabavi, S.; Zhang, L. Nonlinear Multi-Mode Wideband Piezoelectric MEMS Vibration Energy Harvester. IEEE Sens. J. 2019, 19, 4837–4848. [Google Scholar] [CrossRef]
- Nguyen, S.D.; Halvorsen, E. Nonlinear Springs for Bandwidth-Tolerant Vibration Energy Harvesting. J. Microelectromech. Syst. 2011, 20, 1225–1227. [Google Scholar] [CrossRef]
- Upadrashta, D.; Yang, Y. Nonlinear piezomagnetoelastic harvester array for broadband energy harvesting. J. Appl. Phys. 2016, 120, 054504. [Google Scholar] [CrossRef]
- Chandwani, J.; Somkuwar, R.; Deshmukh, R. Multi-band piezoelectric vibration energy harvester for low-frequency applications. Microsyst. Technol. 2019, 25, 3867–3877. [Google Scholar] [CrossRef]
- Doria, A.; Marconi, E.; Moro, F. Tuning of Vibration Energy Harvesters by Means of Liquid Masses. In Proceedings of the 2021 Sixteenth International Conference on Ecological Vehicles and Renewable Energies (EVER), Monte-Carlo, Monaco, 5–7 May 2021; pp. 1–7. [Google Scholar]
- Jackson, N.; Rodriguez, L.A.; Adhikari, R. Wide Bandwidth Vibration Energy Harvester with Embedded Transverse Movable Mass. Sensors 2021, 21, 5517. [Google Scholar] [CrossRef] [PubMed]
- Jackson, N.; Stam, F. Sloshing liquid-metal mass for widening the bandwidth of a vibration energy harvester. Sens. Actuators A Phys. 2018, 284, 17–21. [Google Scholar] [CrossRef]
- Jackson, N.; Stam, F.; Olszewski, O.Z.; Doyle, H.; Quinn, A.; Mathewson, A. Widening the bandwidth of vibration energy harvesters using a liquid-based non-uniform load distribution. Sens. Actuators A Phys. 2016, 246, 170–179. [Google Scholar] [CrossRef]
- Shi, G.; Yang, Y.; Chen, J.; Peng, Y.; Xia, H.; Xia, Y. A broadband piezoelectric energy harvester with movable mass for frequency active self-tuning. Smart Mater. Struct. 2020, 29, 055023. [Google Scholar] [CrossRef]
- Somkuwar, R.; Chandwani, J.; Deshmukh, R. Bandwidth widening of piezoelectric energy harvester by free moving cylinders in liquid medium. Microsyst. Technol. 2020, 27, 1959–1970. [Google Scholar] [CrossRef]
- Song, H.; Hwang, G.-T.; Ryu, J.; Choi, H. Stable output performance generated from a magneto-mechano-electric generator having self-resonance tunability with a movable proof mass. Nano Energy 2022, 101, 107607. [Google Scholar] [CrossRef]
- Anand, A.; Pal, S.; Kundu, S. Bandwidth and power enhancement in the MEMS-based piezoelectric energy harvester using magnetic tip mass. Bull. Pol. Acad. Sci. Tech. Sci. 2022, 70. [Google Scholar] [CrossRef]
- Jackson, N. PiezoMEMS Nonlinear Low Acceleration Energy Harvester with an Embedded Permanent Magnet. Micromachines 2020, 11, 500. [Google Scholar] [CrossRef] [PubMed]
- Li, C.; Wu, S.; Luk, P.C.K.; Gu, M.; Jiao, Z. Enhanced Bandwidth Nonlinear Resonance Electromagnetic Human Motion Energy Harvester Using Magnetic Springs and Ferrofluid. IEEE/ASME Trans. Mechatron. 2019, 24, 710–717. [Google Scholar] [CrossRef]
- Tang, Q.C.; Yang, Y.L.; Li, X. Bi-stable frequency up-conversion piezoelectric energy harvester driven by non-contact magnetic repulsion. Smart Mater. Struct. 2011, 20, 125011. [Google Scholar] [CrossRef]
- Jackson, N.; Kumar, K.; Olszewski, O.; Schenning, A.P.H.J.; Debije, M.G. Tuning MEMS cantilever devices using photoresponsive polymers. Smart Mater. Struct. 2018, 28, 085024. [Google Scholar] [CrossRef]
- Lallart, M.; Anton, S.R.; Inman, D.J. Frequency Self-tuning Scheme for Broadband Vibration Energy Harvesting. J. Intell. Mater. Syst. Struct. 2010, 21, 897–906. [Google Scholar] [CrossRef]
- Jackson, N. Tuning and widening the bandwidth of vibration energy harvesters using a ferrofluid embedded mass. Microsyst. Technol. 2020, 26, 2043–2051. [Google Scholar] [CrossRef]
- Jia, Y.; Seshia, A.A. Power Optimization by Mass Tuning for MEMS Piezoelectric Cantilever Vibration Energy Harvesting. J. Microelectromech. Syst. 2015, 25, 108–117. [Google Scholar] [CrossRef]
- Podder, P.; Constantinou, P.; Mallick, D.; Amann, A.; Roy, S. Magnetic Tuning of Nonlinear MEMS Electromagnetic Vibration Energy Harvester. J. Microelectromech. Syst. 2017, 26, 539–549. [Google Scholar] [CrossRef]
- Rivadeneyra, A.; Soto-Rueda, J.M.; O’keeffe, R.; Banqueri, J.; Jackson, N.; Mathewson, A.; López-Villanueva, J.A. Tunable MEMS piezoelectric energy harvesting device. Microsyst. Technol. 2015, 22, 823–830. [Google Scholar] [CrossRef]
- Kouritem, S.A.; Al-Moghazy, M.A.; Noori, M.; Altabey, W.A. Mass tuning technique for a broadband piezoelectric energy harvester array. Mech. Syst. Signal Process. 2022, 181, 109500. [Google Scholar] [CrossRef]
- Adhikari, R.; Jackson, N. Passive Frequency Tuning of Piezoelectric Energy Harvester using Embedded Masses. In Proceedings of the 2021 IEEE 20th International Conference on Micro and Nanotechnology for Power Generation and Energy Conversion Applications (PowerMEMS), Exeter, UK, 6–8 December 2021; pp. 176–179. [Google Scholar]
- Shen, D.; Park, J.-H.; Ajitsaria, J.; Choe, S.-Y.; Wikle, H.C.; Kim, D.-J. The design, fabrication and evaluation of a MEMS PZT cantilever with an integrated Si proof mass for vibration energy harvesting. J. Micromech. Microeng. 2008, 18, 055017. [Google Scholar] [CrossRef]
- Somkuwar, R.; Chandwani, J.; Deshmukh, R. Wideband auto-tunable vibration energy harvester using change in centre of gravity. Microsyst. Technol. 2018, 24, 3033–3044. [Google Scholar] [CrossRef]
Disclaimer/Publisher’s Note: The statements, opinions and data contained in all publications are solely those of the individual author(s) and contributor(s) and not of MDPI and/or the editor(s). MDPI and/or the editor(s) disclaim responsibility for any injury to people or property resulting from any ideas, methods, instructions or products referred to in the content. |
© 2023 by the authors. Licensee MDPI, Basel, Switzerland. This article is an open access article distributed under the terms and conditions of the Creative Commons Attribution (CC BY) license (https://creativecommons.org/licenses/by/4.0/).


