


The Role of Shear-Wave Elastography of the Spleen in Ruling out the Presence of High-Risk Varices in Non-Alcoholic Fatty Liver Disease (NAFLD)

 , , , ,
  and
and 
Abstract
1. Introduction
2. Materials and Methods
2.1. Patients
2.2. Study Protocol
2.3. Statistical Analysis
3. Results
3.1. Univariate Analysis
3.2. Multivariate Analysis
4. Discussion
5. Conclusions
Author Contributions
Funding
Institutional Review Board Statement
Informed Consent Statement
Data Availability Statement
Conflicts of Interest
References
- Pacifico, L.; Perla, F.M.; Roggini, M.; Andreoli, G.; D’Avanzo, M.; Chiesa, C. A Systematic Review of NAFLD-Associated Extrahepatic Disorders in Youths. J. Clin. Med. 2019, 8, 868. [Google Scholar] [CrossRef] [PubMed]
- de Franchis, R. Revising consensus in portal hypertension: Report of the Baveno V consensus workshop on methodology of diagnosis and therapy in portal hypertension. J. Hepatol. 2010, 53, 762–768. [Google Scholar] [CrossRef] [PubMed]
- Bosch, J.; Abraldes, J.G.; Berzigotti, A.; Garcia-Pagan, J.C. The clinical use of HVPG measurements in chronic liver disease. Nature reviews. Nat. Rev. Gastroenterol. Hepatol. 2009, 6, 573–582. [Google Scholar] [CrossRef] [PubMed]
- Ripoll, C.; Groszmann, R.J.; Garcia-Tsao, G.; Bosch, J.; Grace, N.; Burroughs, A.; Planas, R.; Escorsell, A.; Garcia-Pagan, J.C.; Makuch, R.; et al. Hepatic venous pressure gradient predicts development of hepatocellular carcinoma independently of severity of cirrhosis. J. Hepatol. 2009, 50, 923–928. [Google Scholar] [CrossRef] [PubMed]
- Thiele, M.; Krag, A. Editorial: The portal hypertension puzzle-spleen stiffness evades validation as non-invasive marker of clinically significant portal hypertension. Aliment. Pharmacol. Ther. 2018, 47, 856–857. [Google Scholar] [CrossRef]
- de Franchis, R.; Baveno, V.I.F. Expanding consensus in portal hypertension: Report of the Baveno VI Consensus Workshop: Stratifying risk and individualizing care for portal hypertension. J. Hepatol. 2015, 63, 743–752. [Google Scholar] [CrossRef]
- Elkrief, L.; Rautou, P.E.; Ronot, M.; Lambert, S.; Dioguardi Burgio, M.; Francoz, C.; Plessier, A.; Durand, F.; Valla, D.; Lebrec, D.; et al. Prospective comparison of spleen and liver stiffness by using shear-wave and transient elastography for detection of portal hypertension in cirrhosis. Radiology 2015, 275, 589–598. [Google Scholar] [CrossRef]
- Procopet, B.; Berzigotti, A.; Abraldes, J.G.; Turon, F.; Hernandez-Gea, V.; García-Pagán, J.C.; Bosch, J. Real-time shear-wave elastography: Applicability, reliability and accuracy for clinically significant portal hypertension. J. Hepatol. 2015, 62, 1068–1075. [Google Scholar] [CrossRef]
- Kim, H.J.; Lee, H.K.; Cho, J.H.; Yang, H.J. Quantitative comparison of transient elastography (TE), shear wave elastography (SWE) and liver biopsy results of patients with chronic liver disease. J. Phys. Ther. Sci. 2015, 27, 2465–2468. [Google Scholar] [CrossRef]
- Jansen, C.; Bogs, C.; Verlinden, W.; Thiele, M.; Möller, P.; Görtzen, J.; Lehmann, J.; Vanwolleghem, T.; Vonghia, L.; Praktiknjo, M.; et al. Shear-wave elastography of the liver and spleen identifies clinically significant portal hypertension: A prospective multicenter study. Liver Int. 2017, 37, 396–405. [Google Scholar] [CrossRef]
- Yan, Y.; Xing, X.; Wang, X.; Yang, L. Liver stiffness by two-dimensional shear wave elastography for screening high-risk varices in patients with compensated advanced chronic liver disease. Eur. Radiol. 2022, 32, 2078–2088. [Google Scholar] [CrossRef]
- Liu, Y.; Tan, H.Y.; Zhang, X.G.; Zhen, Y.H.; Gao, F.; Lu, X.F. Prediction of high-risk esophageal varices in patients with chronic liver disease with point and 2D shear wave elastography: A systematic review and meta-analysis. Eur. Radiol. 2022, 32, 4616–4627. [Google Scholar] [CrossRef]
- Fernandes, F.; Piedade, J.; Freitas, G.; Area, P.; Santos, R.; Grinsztejn, B.; Veloso, V.; Pereira, G.; Perazzo, H. Agreement and accuracy of shear-wave techniques (point shear-wave elastography and 2D-shear-wave elastography) using transient elastography as reference. Eur. J. Gastroenterol. Hepatol. 2022, 34, 873–881. [Google Scholar] [CrossRef]
- Colecchia, A.; Montrone, L.; Scaioli, E.; Bacchi-Reggiani, M.L.; Colli, A.; Casazza, G.; Schiumerini, R.; Turco, L.; Di Biase, A.R.; Mazzella, G.; et al. Measurement of spleen stiffness to evaluate portal hypertension and the presence of esophageal varices in patients with HCV-related cirrhosis. Gastroenterology 2012, 143, 646–654. [Google Scholar] [CrossRef]
- Singh, S.; Eaton, J.E.; Murad, M.H.; Tanaka, H.; Iijima, H.; Talwalkar, J.A. Accuracy of spleen stiffness measurement in detection of esophageal varices in patients with chronic liver disease: Systematic review and meta-analysis. Clin. Gastroenterol. Hepatol. 2014, 12, 935–945. [Google Scholar] [CrossRef]
- Colecchia, A.; Marasco, G.; Taddia, M.; Montrone, L.; Eusebi, L.H.; Mandolesi, D.; Schiumerini, R.; Di Biase, A.R.; Festi, D. Liver and spleen stiffness and other noninvasive methods to assess portal hypertension in cirrhotic patients: A review of the literature. Eur. J. Gastroenterol. Hepatol. 2015, 27, 992–1001. [Google Scholar] [CrossRef]
- Karagiannakis, D.S.; Voulgaris, T.; Koureta, E.; Chloupi, E.; Papatheodoridis, G.V.; Vlachogiannakos, J. Role of Spleen Stiffness Measurement by 2D-Shear Wave Elastography in Ruling Out the Presence of High-Risk Varices in Cirrhotic Patients. Dig. Dis. Sci. 2019, 64, 2653–2660. [Google Scholar] [CrossRef]
- Tarantino, G.; Citro, V.; Conforti, P.; Balsano, C.; Capone, D. Is There a Link between Basal Metabolic Rate, Spleen Volume and Hepatic Growth Factor Levels in Patients with Obesity-Related NAFLD? J. Clin. Med. 2019, 8, 1510. [Google Scholar] [CrossRef]
- Giannini, E.; Botta, F.; Borro, P.; Risso, D.; Romagnoli, P.; Fasoli, A.; Mele, M.R.; Testa, E.; Mansi, C.; Savarino, V.; et al. Platelet count/spleen diameter ratio: Proposal and validation of a non-invasive parameter to predict the presence of oesophageal varices in patients with liver cirrhosis. Gut 2003, 52, 1200–1205. [Google Scholar] [CrossRef]
- Berzigotti, A.; Seijo, S.; Arena, U.; Abraldes, J.G.; Vizzutti, F.; García-Pagán, J.C.; Pinzani, M.; Bosch, J. Elastography, spleen size, and platelet count identify portal hypertension in patients with compensated cirrhosis. Gastroenterology 2013, 144, 102–111. [Google Scholar] [CrossRef]
- Kamath, P.S. Esophageal variceal bleeding: Primary prophylaxis. Clin. Gastroenterol. Hepatol. 2005, 3, 90–93. [Google Scholar] [CrossRef] [PubMed]
- Berzigotti, A.; Gilabert, R.; Abraldes, J.G.; Nicolau, C.; Bru, C.; Bosch, J.; García-Pagan, J.C. Noninvasive prediction of clinically significant portal hypertension and esophageal varices in patients with compensated liver cirrhosis. Am. J. Gastroenterol. 2008, 103, 1159–1167. [Google Scholar] [CrossRef] [PubMed]
- Manatsathit, W.; Samant, H.; Kapur, S.; Ingviya, T.; Esmadi, M.; Wijarnpreecha, K.; McCashland, T. Accuracy of liver stiffness, spleen stiffness, and LS-spleen diameter to platelet ratio score in detection of esophageal varices: Systemic review and meta-analysis. J. Gastroenterol. Hepatol. 2018, 33, 1696–1706. [Google Scholar] [CrossRef] [PubMed]
- Colecchia, A.; Ravaioli, F.; Marasco, G.; Colli, A.; Dajti, E.; Di Biase, A.R.; Bacchi Reggiani, M.L.; Berzigotti, A.; Pinzani, M.; Festi, D. A combined model based on spleen stiffness measurement and Baveno VI criteria to rule out high-risk varices in advanced chronic liver disease. J. Hepatol. 2018, 69, 308–317. [Google Scholar] [CrossRef]
- Cassinotto, C.; Charrie, A.; Mouries, A.; Lapuyade, B.; Hiriart, J.B.; Vergniol, J.; Gaye, D.; Hocquelet, A.; Charbonnier, M.; Foucher, J.; et al. Liver and spleen elastography using supersonic shear imaging for the non-invasive diagnosis of cirrhosis severity and oesophageal varices. Dig. Liver Dis. 2015, 47, 695–701. [Google Scholar] [CrossRef]
- Bende, F.; Sporea, I.; Sirli, R.; Popescu, A.; Danila, M.; Mare, R.; Lupusoru, R. Comparative study between two 2D-Shear Waves Elastography techniques for the assessment of liver stiffness: 2D-SWE.SSI vs. 2D-SWE.GE. Ultraschall Med. 2016, 37, S4–S11. [Google Scholar] [CrossRef]
- Kim, D.W.; Suh, C.H.; Kim, K.W.; Pyo, J.; Park, C.; Jung, S.C. Technical Performance of Two-Dimensional Shear Wave Elastography for Measuring Liver Stiffness: A Systematic Review and Meta-Analysis. Korean J. Radiol. 2019, 20, 880–893. [Google Scholar] [CrossRef]
- Paternostro, R.; Reiberger, T.; Bucsics, T. Elastography-based screening for esophageal varices in patients with advanced chronic liver disease. World J. Gastroenterol. 2019, 25, 308–329. [Google Scholar] [CrossRef]
- Roccarina, D.; Rosselli, M.; Genesca, J.; Tsochatzis, E.A. Elastography methods for the non-invasive assessment of portal hypertension. Expert Rev. Gastroenterol. Hepatol. 2018, 12, 155–164. [Google Scholar] [CrossRef]
- Berzigotti, A. Non-invasive evaluation of portal hypertension using ultrasound elastography. J. Hepatol. 2017, 67, 399–411. [Google Scholar] [CrossRef]
- Giuffrè, M.; Macor, D.; Masutti, F.; Abazia, C.; Tinè, F.; Patti, R.; Buonocore, M.R.; Colombo, A.; Visintin, A.; Campigotto, M.; et al. Evaluation of spleen stiffness in healthy volunteers using point shear wave elastography. Ann. Hepatol. 2019, 18, 736–741. [Google Scholar] [CrossRef]
- Lantinga, M.; van Kleef, L.A.; den Hoed, C.M.; De Knegt, R.J.; Marten, A. Spleen Stiffness Measurement Across the Spectrum of Liver Disease Patients in Real-World Practice. J. Clin. Exp. Hepatol. 2022; in press. [Google Scholar] [CrossRef]


| Parameter | Total (n = 48) M ± SD/n(%) | HREVs (n = 18) M ± SD/n(%) | Without HREVs (n = 30) M ± SD/n(%) | p |
|---|---|---|---|---|
| Gender | 0.017 | |||
| M | 35 (72.9%) | 17 (94.4%) | 18 (60.0%) | |
| F | 13 (27.1%) | 1 (5.6%) | 12 (40.0%) | |
| Age (y.o.) | 55.77 ± 13.09 | 51.50 ± 13.50 | 58.33 ± 12.36 | 0.08 |
| Portal vein caliber (mm) | 13.37 ± 1.51 | 14.11 ± 1.63 | 12.92 ± 1.27 | 0.007 |
| SBD (mm) | 134.25 ± 16.26 | 142.56 ± 13.92 | 129.27 ± 15.702 | 0.005 |
| Albumin (g/L) | 3.53 ± 0.59 | 3.13 ± 0.54 | 3.77 ± 0.50 | <0.001 |
| Platelets (n/cmm) | 129.02 ± 45.74 | 94.72 ± 23.71 | 149.60 ± 43.51 | <0.001 |
| Total bilirubin (mg/dL) | 1.69 ± 0.84 | 2.1072 ± 0.80 | 1.44 ± 0.77 | 0.007 |
| INR | 1.32 ± 0.26 | 1.44 ± 0.34 | 1.24 ± 0.15 | 0.022 |
| TGO | 69.33 ± 54.81 | 91.94 ± 63.76 | 55.77 ± 44.47 | 0.067 |
| TGP | 49.17 ± 39.02 | 57.67 ± 43.60 | 44.07 ± 35.80 | 0.160 |
| LS (kPa) | 14.18 ± 3.04 | 16.05± 3.76 | 13.06 ± 1.81 | 0.004 |
| SS (kPa) | 17.67 ± 4.48 | 22.20 ± 3.98 | 14.94 ± 1.67 | <0.001 |
| GOV | 0.005 | |||
| Present | 5 (10.4%) | 5 (27.8%) | - | |
| Absent | 43 (89.6%) | 13 (72.2%) | 30 (100.0%) | |
| GPH | <0.001 | |||
| Present | 7 (14.6%) | 7 (38.9%) | - | |
| Absent | 41 (85.4%) | 11 (61.1%) | 30 (100.0%) | |
| CHILD | <0.001 | |||
| A | 26 (54.2%) | 3 (16.7%) | 23 (76.7%) | |
| B | 22 (45.8%) | 15 (83.3%) | 7 (23.3%) | |
| FIB-4 | 1.02 ± 0.51 | 1.03 ± 0.50 | 1.37 ± 0.82 |
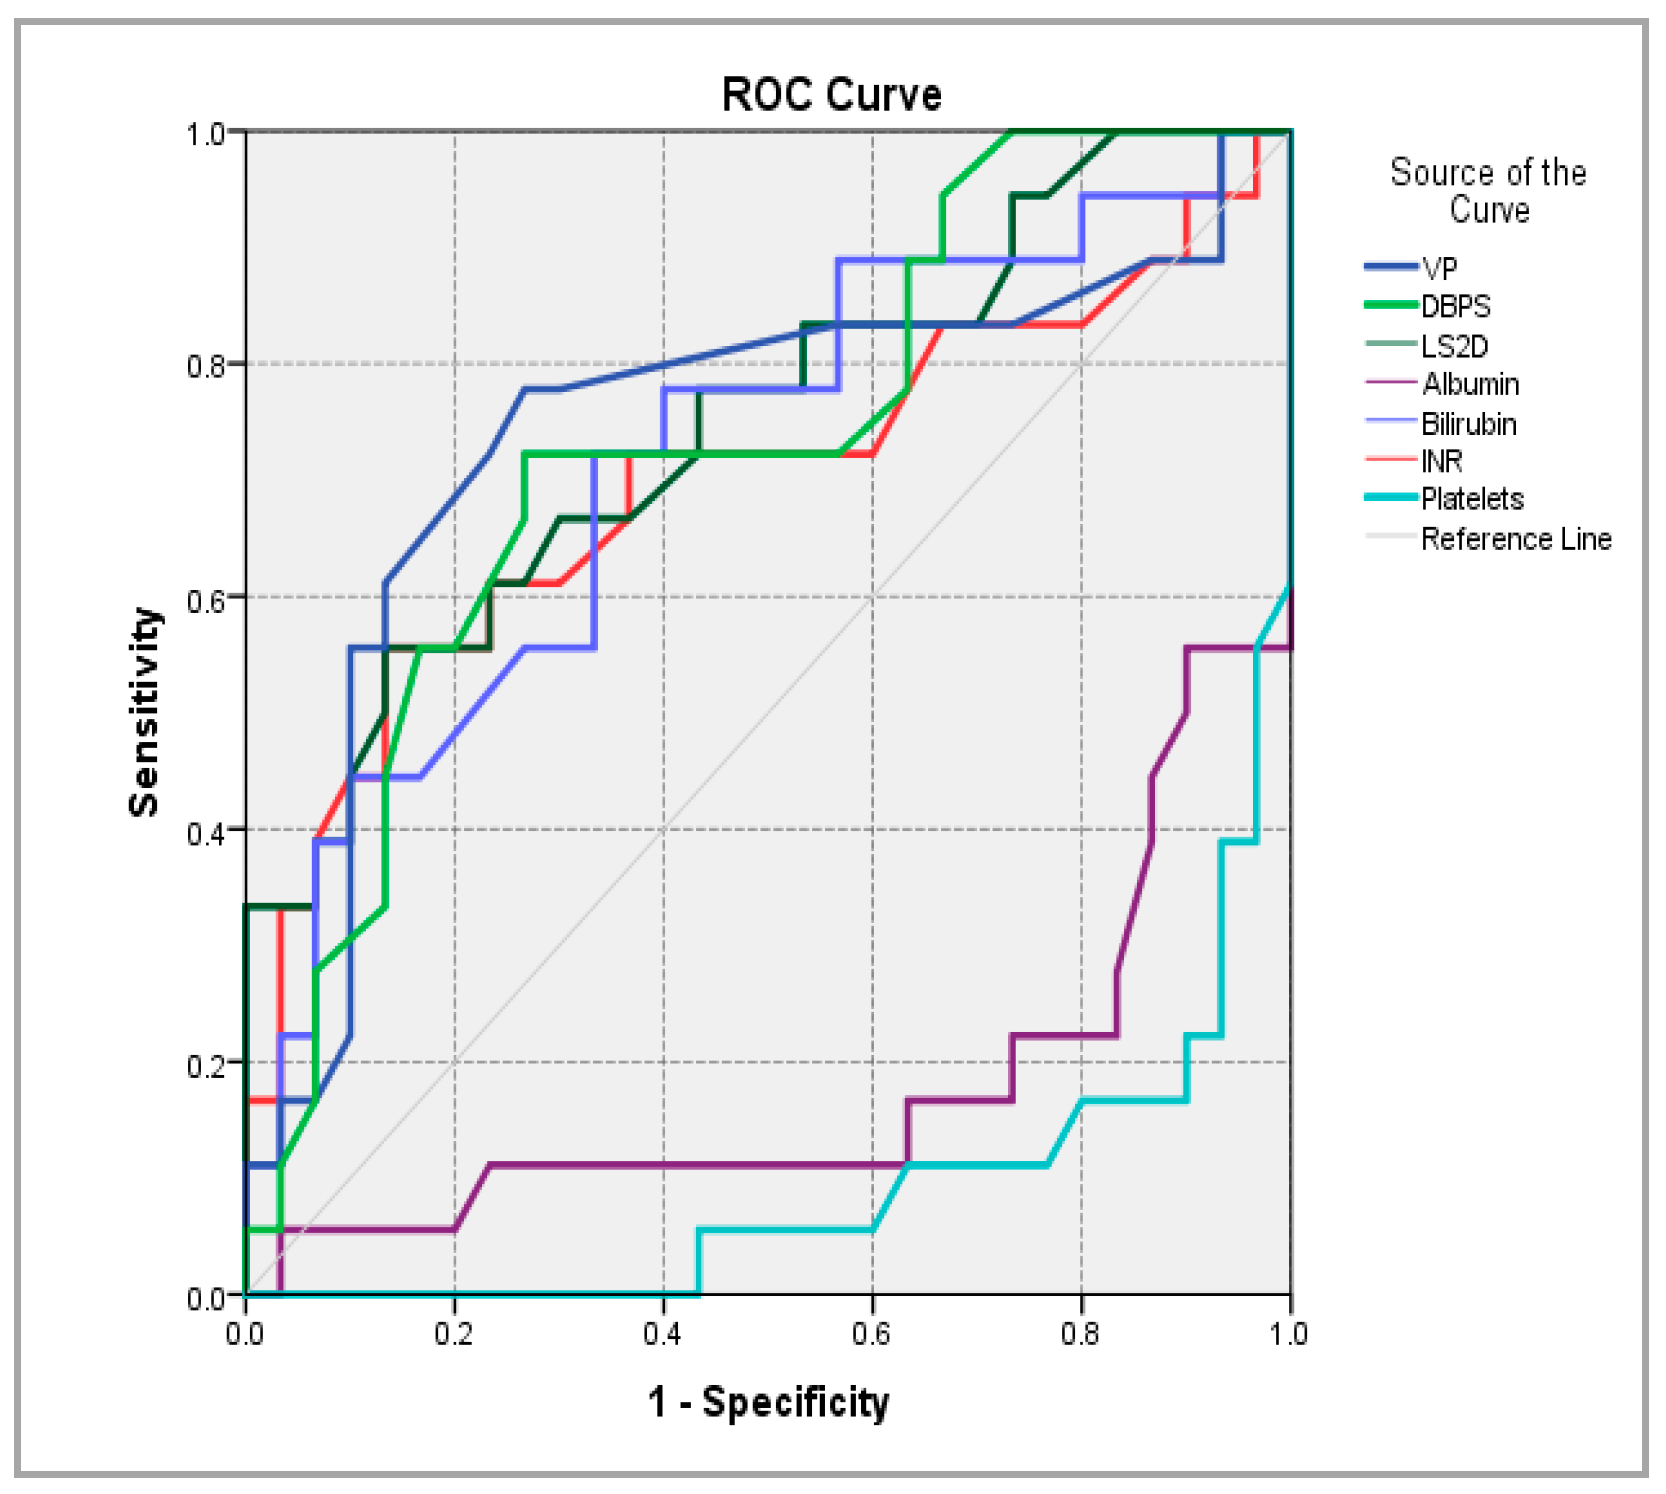
| Parameter | AUC | AUC 95% CI | p-Value | Cutoff Value | Sensitivity (%) | Specificity (%) |
|---|---|---|---|---|---|---|
| PV caliber | 0.746 | 0.586 ÷ 0.907 | 0.005 | 13.45 | 77.80% | 73.30% |
| SBD | 0.731 | 0.583 ÷ 0.878 | 0.008 | 137 | 72.20% | 73.30% |
| LS | 0.747 | 0.600 ÷ 0.895 | 0.004 | 15.16 | 55.60% | 86.70% |
| Albumin | 0.178 | 0.041 ÷ 0.315 | 0.000 | 4.555 | 5.60% | 96.70% |
| BT | 0.719 | 0.565 ÷ 0.872 | 0.012 | 1.82 | 72.20% | 66.70% |
| INR | 0.699 | 0.531 ÷ 0.867 | 0.022 | 1.375 | 55.60% | 86.70% |
| Platelets | 0.088 | 0.003 ÷ 0.172 | 0 | 265.5 | - | 96.70% |
| SS | 0.987 | 0.964 ÷ 1.000 | 0.000 | 17.95 | 94.40% | 96.70% |
| Variable | Score | df | Sig. |
|---|---|---|---|
| VP | 7.044 | 1 | 0.008 |
| DBPS | 7.669 | 1 | 0.006 |
| LS 2D | 11.087 | 1 | 0.001 |
| SS | 30.169 | 1 | 0.000 |
| Albumin | 12.917 | 1 | 0.000 |
| BT | 7.148 | 1 | 0.008 |
| INR | 7.241 | 1 | 0.007 |
| SGOT | 5.005 | 1 | 0.025 |
| SGPT | 1.395 | 1 | 0.237 |
| Platelets | 16.535 | 1 | 0.000 |
| Child(1) | 16.313 | 1 | 0.000 |
| Variable | B | Standard Error | Wald | df | p Value | OR | 95% CI for EXP(B) | |
|---|---|---|---|---|---|---|---|---|
| Exp(B) | Lower | Upper | ||||||
| SS | 1.606 | 0.587 | 7.5 | 1 | 0.006 | 4.985 | 1.579 | 15.736 |
Disclaimer/Publisher’s Note: The statements, opinions and data contained in all publications are solely those of the individual author(s) and contributor(s) and not of MDPI and/or the editor(s). MDPI and/or the editor(s) disclaim responsibility for any injury to people or property resulting from any ideas, methods, instructions or products referred to in the content. |
© 2023 by the authors. Licensee MDPI, Basel, Switzerland. This article is an open access article distributed under the terms and conditions of the Creative Commons Attribution (CC BY) license (https://creativecommons.org/licenses/by/4.0/).
Share and Cite
Olteanu, V.-A.; Sfarti, C.-V.; Balan, G.G.; Timofte, O.; Gologan, E.; Mitrică, D.E.; Gilca-Blanariu, G.-E.; Dascalu, C.G.; Sandu, I.; Ştefănescu, G. The Role of Shear-Wave Elastography of the Spleen in Ruling out the Presence of High-Risk Varices in Non-Alcoholic Fatty Liver Disease (NAFLD). Appl. Sci. 2023, 13, 5764. https://doi.org/10.3390/app13095764
Olteanu V-A, Sfarti C-V, Balan GG, Timofte O, Gologan E, Mitrică DE, Gilca-Blanariu G-E, Dascalu CG, Sandu I, Ştefănescu G. The Role of Shear-Wave Elastography of the Spleen in Ruling out the Presence of High-Risk Varices in Non-Alcoholic Fatty Liver Disease (NAFLD). Applied Sciences. 2023; 13(9):5764. https://doi.org/10.3390/app13095764
Chicago/Turabian StyleOlteanu, Vasile-Andrei, Catalin-Victor Sfarti, Gheorghe G. Balan, Oana Timofte, Elena Gologan, Dana Elena Mitrică, Georgiana-Emmanuela Gilca-Blanariu, Cristina Gena Dascalu, Ion Sandu, and Gabriela Ştefănescu. 2023. "The Role of Shear-Wave Elastography of the Spleen in Ruling out the Presence of High-Risk Varices in Non-Alcoholic Fatty Liver Disease (NAFLD)" Applied Sciences 13, no. 9: 5764. https://doi.org/10.3390/app13095764
APA StyleOlteanu, V.-A., Sfarti, C.-V., Balan, G. G., Timofte, O., Gologan, E., Mitrică, D. E., Gilca-Blanariu, G.-E., Dascalu, C. G., Sandu, I., & Ştefănescu, G. (2023). The Role of Shear-Wave Elastography of the Spleen in Ruling out the Presence of High-Risk Varices in Non-Alcoholic Fatty Liver Disease (NAFLD). Applied Sciences, 13(9), 5764. https://doi.org/10.3390/app13095764