Abstract
This paper studies the load-bearing characteristics of two prestressed high-strength concrete (PHC) pipe piles constructed by the medium mid-digging and hammering methods. The ultimate load tests and numerical simulations of the pipe piles constructed by both methods were carried out to analyze the ultimate lateral resistance, and ultimate resistance performance characteristics of the two pipe piles and the influence of the wall thickness of the pipe piles on the bearing performance. The test results show that the pipe pile constructed by the middle inner digging method has a higher pile quality. The single pile bearing capacity of the pipe pile constructed by the middle inner digging method is 50% higher than that of the common hammering method. The enlarged part of the pile end has an obvious effect on improving the bearing capacity. The settlement of the pipe pile constructed by the middle inner digging method is smaller than that of the hammering method. The large diameter pipe pile constructed by the middle inner digging method usually shows characteristics of the end-bearing pile. The resistance of the pile end accounts for 40–50% of the top load. The numerical simulation results agree with the field test and are compared and discussed. The simulation results show that when the bearing capacity of the pile is provided by the pile side frictional resistance, the influence of the pile wall thickness on the bearing capacity is insignificant. When the top pile load is close to the bearing capacity of the pipe pile, the influence of the pipe pile wall thickness on the bearing capacity is greater.
1. Introduction
Prestressed high-strength concrete (PHC) pipe piles are one of the most commonly used pile types in current engineering construction. Compared with bored piles, it has advantages of high single pile load-bearing capacity, reliable pile quality and low project cost, and it has been widely used in civil engineering. The traditional construction methods of prestressed pipe piles include hammering and static compression methods, which produce a significant crowding effect during construction, resulting in vertical uplift and horizontal movement of the soil around the pile, thus limiting its application in densely built-up areas near pipelines or tunnels. The inner digging method is a new precast pile construction method that can effectively solve the problem of soil extrusion.
Various studies have focused on the bearing characteristics of PHC piles constructed by different methods [1]. Choi Y et al. proposed a prestressed spun high-strength concrete (PHC). Their tests showed that the new piling method could reduce the noise and vibration impact on the soil compared with conventional piling [2]. Yang, Shao-Hong et al. tested PHC precast piles constructed by the vibratory pile-sinking method and showed that the amplitude and frequency of the vibratory hammer had a more significant influence on the quality of the piles [3]. Rooz, AFH et al. conducted numerical modeling of continuous impact pile driving from the ground surface to the final depth of pile installation by the arbitrary Lagrangian–Eulerian (ALE) adaptive mesh method; a series of extensive parametric studies were carried out in which hammer impact force, pile diameter, tip angle and damping ratio of soil were concluded as the factors most affecting the ground vibrations induced by impact pile driving [4]. Thuyet N. Nguyen et al. proposed a method for estimating tensile stress used in pipe piles constructed by the impact hammer method. A case study of the effects of pile failures on tensile strength was presented to verify the approach [5]. Dai Yahui et al. studied the bearing capacity of PHC piles constructed by hammering and static compression methods and proposed related quality control measures [6,7]. R. Daryaei et al. tested soil behavior during pile installation. Results of the numerical model show several advantages of vibratory driving over impact driving in the dense sand, including reaching the designated depth using less momentum and work, and more soil compaction [8]. Tales Vieira Sofiste et al. conducted a numerical simulation of the pipe pile hammering construction and the effect of hammering on the soil around the pile was discussed [9,10]. Zhang Kanpei et al. conducted a study on the soil compaction around the pipe pile during the construction process of the hydrostatic method. The results showed that the saturated powdery clay and the medium-dense coarse sand layer deep underground are squeezed, and the volume of the geotechnical body expands and rises upwards due to the shear expansion characteristics of the geotechnical body. The strength of the pile will be improved, and the pile side and end resistance will also be improved [11].
To further promote the development of PHC piles, scholars have researched the mechanical properties of PHC piles [12,13,14,15,16]. Kou Hai-Lei et al. tested two open-ended PHC piles using FBG sensors and discussed the effect of residual force distribution on the load-carrying capacity of the piles, and found that the residual force significantly affected the axial force of the closed-ended piles and thus the pile body and pile end resistance, but not the open-ended PHC piles. It was found that the residual force significantly affected the pile shaft force and thus the pile end resistance, but not the total bearing capacity of open-ended PHC pipe piles; the penetration depth and local lateral soil resistance had significant effects on the pile shaft force and piled side shear stress [17,18]. Baturalp Ozturk et al. established a prediction model of pipe pile bearing capacity using machine learning methods and verified the feasibility of this approach [19]. Michał Baca et al. proposed a new method for the static test modeling of pipe piles. The contact between the pile ad soil was well-treated and the accuracy of the modeling was verified [20,21]. Xiao-long Zhou et al. investigated the pile lateral resistance of open-ended PHC piles. They showed that the pile lateral resistance is gradually transmitted along the depth, and its magnitude is closely related to the soil properties. The pile lateral resistance at the same depth decreases with an increase in the number of cycles [22,23,24]. Liu Jun-Wei et al. found that the flexural stiffness of reinforced PHC piles was greater than that of conventional PHC piles, and the moment-bearing capacity of reinforced piles was significantly higher than that of conventional piles by comparing the flexural performance of reinforced PHC piles with that of conventional PHC piles [25,26,27,28]. Mustafa Jafariet et al. studied the bearing capacity of pipe piles at the end, and the results showed that the bearing capacity of pipe piles is close to the limit value, which is less than or at most equal to the end-bearing capacity of an embedded strip foundation of width equal to the pipe wall thickness. Scholars have also studied the long-term performance of PHC piles [29,30]. Yi Yan et al. studied the bidirectional diffusion of chloride ions in coastal pipe piles and analyzed how the chloride ion diffusion effect was affected by parameters such as bidirectional erosion of chloride ions, mortar, and concrete delamination and temperature, and found that the difference in wall temperature correction coefficients was significant for temperature differences between the inner and outer walls of the pipe piles greater than 15 °C, which should be corrected according to reality. The effects of bidirectional chloride ion erosion and centrifugal delamination on the pipe pile can be improved by adjusting the mortar layer thickness [31].
Despite the obvious advantages of the current PHC method for construction in the inner digging method [32,33], its monopile vertical load-bearing mechanism is different from other pile types. There is less research on the load-bearing mechanism of pipe piles constructed in the inner digging method [34,35], so it is necessary to conduct a comparative study on its monopile vertical compressive load-bearing capacity and load transfer law. Therefore, this paper compares and analyzes the vertical load-bearing characteristics of hammering method pipe piles and medium-drilling method pipe piles and discusses the force transmission mechanism of PHC piles in detail, taking a mega-bridge reconstruction and expansion project in Anhui Province as an example. The effect of different wall thicknesses of PHC piles on the bearing characteristics is discussed by establishing finite difference models and comparing them with field tests. The research results can provide a reference for further theoretical research and engineering applications.
2. Test Overview
2.1. Test Pile and Project Overview
According to the Technical Specification for Construction Pile Inspection (JGJ106-2014) and the Technical Specification for Pre-stressed Concrete Pile Foundation (DB34/5005-2014) [36,37], two PHC piles of the same size were designed and labeled as PHC−1 and PHC−2, respectively. Both test piles were 32 m and 600 mm in diameter. The pipe pile was assembled from three prefabricated sections of 10 m, 10 m, and 12 m during process construction. The thickness of the pipe was 200 mm for PHC−1 and PHC−2. Figure 1 shows the reinforcement arrangement of two PHC piles, the stirrups in the pipe pile were 6 mm in diameter and 100 mm in spacing, and the spacing near the end section was 60 mm. The prestressed reinforcement was made of seven wires with a diameter of 15.2 mm. Prestressed reinforcement was made of seven wires, a 15.2 mm diameter steel strand, and a total of 10 steel bars in cross-section; the reinforcement rate was 0.86%.
The concrete design strength of the pipe pile was 35.8 MPa. PHC−1 was driven by the impact driving method and central digging method for PHC−2; the diameter of the enlarged part at the end of PHC−2 was 720 mm, and the length was 1200 mm. The design vertical load capacity of the PHC−1 pile was 4000 kN and PHC−2 was 6000 kN. The test site of this project was located in the south of Hefei City.
The pile was placed correctly according to the specifications, the first section of the PHC−1 was kept inserted into the ground vertically and gently driven into the ground because the upper soil layer was soft. The hammer height was low during the hammering process because as the sinking pile deepens, sinking speed slows down. Therefore, the hammer height was slowly increased and when the head of the first section of the pile was 1 m from the ground for the second section of pile welding and when the controlled penetration degree was reached, we hammered 10 cm before finally stop hammering. When the controlled penetration was reached, the second pile was welded by 10 cm, and then the hammering was stopped. Figure 2 shows the PHC−2 installation process; the pile was lifted to the designated position and arranged with the pile driver, the pipe pile was set on the outside of the continuous auger, and the verticality was adjusted continuously. Continuous pile feeding occurred as the continuous auger went deeper. Welding was used to splice the next section of pipe pile, and the enlarged head at the end of the drill bit was opened to expand the hole and inject slurry by centrifugal pouring as the drill bit reached the designated position. The drill bit rotated up and down repeatedly to ensure that the slurry was mixed evenly with the foundation soil while sinking the pile to the designed elevation. Finally, the drill pipe was slowly lifted to prevent negative pressure in the pile.

Figure 1.
Arrangement of reinforcement in two PHC piles.
Figure 1.
Arrangement of reinforcement in two PHC piles.


Figure 2.
Inner digging method construction process.
Figure 2.
Inner digging method construction process.

2.2. Geological Survey of Site
The terrain of the test site was relatively flat, and the soil was evenly distributed. From top to bottom, it was divided into nine layers. The physical and mechanical parameters of each soil layer are shown in Table 1.

Table 1.
Geophysical and mechanical parameters of the soil layer.
2.3. Test Scheme
The static load test of the single pile was carried out using the pile load method, in which the ballast platform counterforce device was used for loading, and the counterforce was provided by the counterforce frame. One hydraulic jack with a rated output of 630 tons was used to apply pressure, and the loading load was measured by a hydraulic gauge parallel to the jack. The top pile settlement was automatically measured by four displacement transducers installed symmetrically. The field test is shown in Figure 3.
To study the load-bearing characteristics of pipe pile foundations constructed by the medium boring method and to further study the pile–soil interaction and pipe pile load transfer law. Both test piles were equipped with a rebar gauge. The arrangement of the rebar meter is shown in Figure 4. In order to ensure the normal operation of the rebar meter, four rebar meters were arranged symmetrically in each section when the rebar was installed. Each section had eight rebar meters; 24 for one pile and 48 for two test piles.

Figure 3.
Static load test.
Figure 3.
Static load test.


Figure 4.
Strain gauge installation and soil information.
Figure 4.
Strain gauge installation and soil information.

In this project, the static load test of the foundation pile adopted a slow maintenance load method; the upper pile load was a concrete block placed on the longitudinal beam, and the lower part of the longitudinal beam was in contact with the main reaction beam while the reaction loading device was placed on the pile at one end and in contact with the main reaction beam at the other end. The grading of loading and unloading, as well as the reading of top pile settlement, was by JGJ106-2014 after each level of load was applied, the top pile settlement was read at 5, 15, 30, 45, and 60 min, and then every 30 min. When unloading, each load level was maintained for 1 h, and the next load level could be unloaded after the settlement of the pile top was measured and read at 15, 30, and 60 min. After unloading to zero, the residual settlement at the top of the pile was measured and read; the maintenance time should not be less than 3 h, the reading time is the fifteenth and the thirtieth min, and then readings were taken every 30 min. The loading series and the initial and maximum loads on two test piles were given in Table 2.
Table 2.
Loading parameters of the static load test.
3. Analysis of Test Results
3.1. Analysis of Load–Settlement and Settlement-Lg Curves
The Q-s curve obtained by the vertical static load test of a single pile is a comprehensive reflection of the load transfer process, lateral resistance, and end resistance play properties of the pile–soil system. The Q-s curves plotted according to the static load test results of two test piles are shown in Figure 5.
From the Q-s curves of the vertical compressive static test of the single pile, it can be seen that the maximum test loads of PHC−1 and PHC−2 were 4000 kN and 6000 kN, respectively, and the curves did not show a steep drop at all levels of loading, both curves belonged to the slow change type, and the maximum settlement was 28.73 mm and 35.46 mm, respectively. Thus, it can be seen that the enlarged part of the pile end had a hindering effect on the settlement of the pile when the load was small. The maximum rebound amounts were 15.54 mm and 16.38 mm, respectively, with 54.1% and 46.2% rebound rates, respectively. From the s-lgt curves, both test piles showed a downward bending of the s-lgt curve under the last stage of loading, but the slope of the curve for Pile 1 was greater, indicating that the expanded portion of the pile end of the PHC−2 pile made a prominent contribution to the bearing capacity at the later stage of loading. For Pile 1, when loaded to 4000 kN, the top pile displacement reached 28.73 mm. The rebound amount reached 15.54 mm, according to the principle of determining the vertical compressive ultimate bearing capacity of a single pile in the specification (JGJ106-2014) [34], the maximum load value required by design has been reached, and the top pile settlement reached the relative stability standard; its vertical compressive ultimate bearing capacity test value can be taken as 4000 kN. In contrast, PHC−2 can be taken as 6000 kN, thus it can be seen that the overall bearing capacity of PHC−2 is 50% higher than PHC−1.

Figure 5.
Q-s curves and s-lgt curves of PHC−1 and PHC−2, (a) Load–settlement curves of PHC−1 and PHC−2; (b) s-lgt curves of PHC−1; (c) s-lgt curves of PHC−2.
Figure 5.
Q-s curves and s-lgt curves of PHC−1 and PHC−2, (a) Load–settlement curves of PHC−1 and PHC−2; (b) s-lgt curves of PHC−1; (c) s-lgt curves of PHC−2.

3.2. Analysis of the Distribution of Pile Axial Force on Pile Body
Based on the data recorded by the reinforcement meter, assuming that the reinforcement and concrete of the pipe pile could deform consistently together under the load, the stress of the reinforcement can be obtained from the cross-sectional area of the reinforcement and the modulus of elasticity. The pile axial force of the test pile under each level of load is shown in Figure 6. As can be seen from Figure 6, under each level of load, the axial force decreases as the depth of the pile increases. In the early stages of loading, the axial force in the lower part of the pile is small, the end resistance is small, and the lateral resistance comes into play before the end resistance. As the load increases, the slope of the axial force transfer curve increases continuously, the axial force in the lower part of the pile increases gradually, and the end resistance begins to come into play gradually.
The axial force diagrams from both test piles reflect that the axial force gradually decreases along the measured pile throughout the loading process, with the slope of the distribution decreasing with depth. The axial force decreases fastest in the bedrock layer, reflecting the progressive development of the pile lateral resistance along the pile body from top to bottom. This is mainly due to the relative displacement between the pile body and the soil caused by the compressive deformation of the pile body, while the pile lateral resistance transfers part of the pile shaft force to the soil layer around the pile, resulting in a gradual reduction in the pile axial force. Although the distribution of axial forces along the pile body is relatively similar for PHC−1 and PHC−2 piles, overall, the maximum axial force and pile end resistance are much higher for PHC−2, thus showing that the bottom flaring pipe pile has a higher pile end-bearing capacity.

Figure 6.
Axial force distribution along the pile body of PHC−1 and PHC−2 under different loads, (a) PHC−1; (b) PHC−2.
Figure 6.
Axial force distribution along the pile body of PHC−1 and PHC−2 under different loads, (a) PHC−1; (b) PHC−2.

3.3. Study on Traits of Lateral Frictional Resistance of the Test Piles
The ultimate side resistance is the rock–soil resistance generated on the side surface of the pile body when the pile top bears the ultimate load. By monitoring and recording the pile axial force distribution, the calculation of the pile lateral frictional resistance can be carried out. The force state of the pile section is shown in Figure 7.
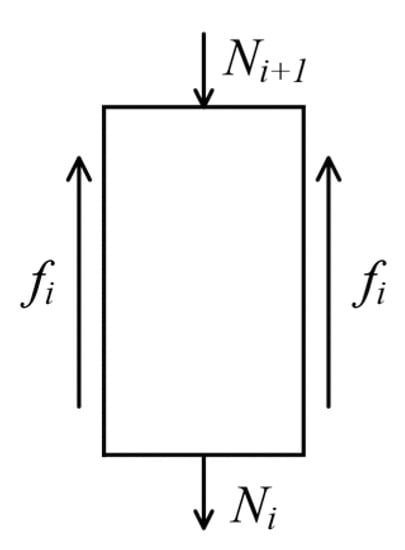
Figure 7.
Diagram of load transfer from soil layers.
The lateral frictional resistance of the pile unit is calculated as follows:
where d and Li are the diameters of test piles and length of pile section, respectively, fi is pile side frictional resistance per pile section, Ni+1 is the top axial force for each pile section, and Ni is the end axial force for each pile section.
Figure 8 shows the distribution of the lateral frictional resistance of the pile body at all levels of loading. It can be seen from Figure 8 that under working load, the upper part of the pile body is first subjected to elastic compression, generating a lateral resistance of the soil upwards against the pile body. As the load is transmitted down the pile body, the lateral resistance of the pile body is gradually applied from the top downwards and is distributed non-linearly along the pile body. During the loading process the unit lateral resistance distribution of each test pile increased along the depth of the pile body, which is because at the beginning of the loading the lateral resistance of the pile is small, and the load-carrying capacity is mainly provided by the lateral frictional resistance of the upper soil layer. With an increase in the load on the top of the pile, the soil pressure on the part of the pile located in the deep soil layer is much greater than that on the part of the pile located in the shallow soil layer, resulting in a greater increase in the lateral resistance of the deep soil layer. The lateral resistance of the shallow soil layer increases more than the lateral resistance of the shallow soil layer. The lateral resistance generated by the geotechnical layers gradually increases and accounts for the major part of the bearing capacity. Under an ultimate load, the lateral resistance provided by the geotechnical soil reaches its ultimate state, after which the end resistance becomes the main part of the load-carrying capacity, showing the characteristics of an end-loaded pile. In the 0–13 m soil layer, the lateral resistance of test pile PHC−1 showed a parabolic shape along the length of the pile. In the early stage of loading, the lateral resistance of the pile in the silt layer did not increase significantly, and with an increase in load, the lateral resistance of the pile changed more and more obviously with depth. In soils of 15–25 m, the lateral resistance curve of the pile appears to inflect at around 18 m, when the lateral resistance of the pile first increases and then decreases along the pile body. In the 15–25 m soils, the pile lateral resistance curve inflects at around 18 m, when the pile lateral resistance first increases and then decreases. In contrast, the pile lateral resistance of PHC−2 increased along the length of the pile throughout the loading process, with no decreasing inflection point in the curve, indicating that the inner digging method can increase the lateral resistance of the pile compared to the conventional construction process. This conclusion is consistent with previous research (i.e., Kou, HL et al. 2019). This again confirms that the pile lateral resistance is susceptible to the pile depth.
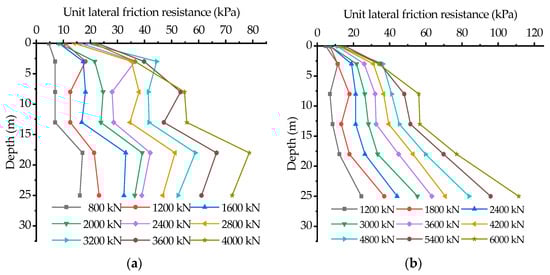
Figure 8.
Distribution of side friction resistance under different loads of PHC−1 and PHC−2: (a) Distribution of side friction resistance of PHC−1; (b) distribution of side friction resistance of PHC−2.
3.4. Relationship between Pile End Resistance and Pile Top Load
In this load test, the bottom measured section was closer to the pile end, and the pile end resistance was approximated by the axial force calculated from the measured section. The variation of pile end resistance with top pile load is shown in Figure 9. During the loading process, as the pile top load gradually increases, the pile end resistance also increases. When the top pile load was less than 2500 kN, the pile end resistance of both test piles increased linearly and accounted for no more than 30% of the pile top load. With an increase in the pile top load, the pile end resistance of PHC−2 firstly entered into a non-linear phase and accounted for an increasing proportion of the pile top load, gradually showing obvious characteristics of end-bearing piles. Under the maximum load, the pile end resistance of the two test piles accounted for 43.5% and 45.7%, respectively, showing that PHC−2 had more characteristics of end-bearing piles.
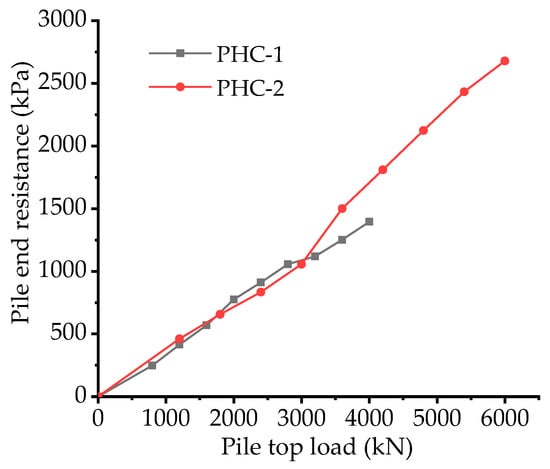
Figure 9.
Relationship between pile top load and pile end resistance of PHC−1 and PHC−2.
4. Finite Difference Method Simulation
4.1. FD Modeling
Fast Lagrangian Analysis of Continuum (FLAC3D) is a finite difference software that can dynamically simulate and calculate the stress and deformation patterns of geotechnical bodies. In specific applications, FLAC3D can provide a more comprehensive analysis of the stress, deformation, stability field, and dynamic properties of specific engineering structures under various external loads.
Pile–soil action models were established in this paper to completely reveal the load-bearing performance of PHC piles after installation and the response after force, and also to explore the effect of the wall thickness of piles on load-bearing performance. The piles were 32 m long with 600 mm outer diameter and 300 mm inner diameter. The depth of the simulated soil area was set to approximately twice the length of the pile, i.e., 64 m. The width was set to approximately one time the pile length, i.e., 32 m. The pile itself was simulated by the pile element, and the soil around the installation was simulated by the beam element. The symmetry principle was used to calculate the pile–soil as a 1/4 model, comparing the pipe piles constructed by the medium boring method with a flaring head diameter of 1.2D and a flaring head length of 2D with those constructed by the medium boring method without a flaring head, to analyze the stresses under the top pile load and to simulate the effect of diameter effect (0.6 m outer diameter and 0.1 m (ZL-25), 0.2 m (ZL-20), and 0.4 m (ZL-10) inner diameter, respectively) on the bearing performance of the pipe piles. Positive symmetric boundary conditions were established in the plane of symmetry. The Cullen–Moore principal structure model was used for the soil layer around the bank, the isotropic elastic model for the pile body, and the interface contact surface unit was used for the pile–soil contact. The numerical model is shown in Figure 10.
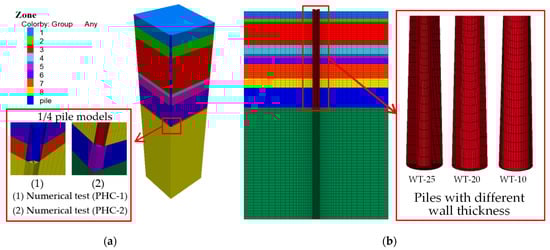
Figure 10.
Numerical pile–soil models: (a) 1/4 pile–soil models; (b) pile–soil models with different wall thicknesses.
4.2. Loading and Analysis of the Effect of Bottom Expansion
A vertical force opposite the z-direction was applied to the top of the pile. In total, 6500 kN was expected to be applied, with each increase in stress being 500 kN in accordance with the static load test specification, and the first stage was loaded continuously at twice the loading amount per stage, i.e., 1000 kN. After the simulated static load test was stabilized, the load–settlement curve of the large diameter pipe pile was made based on testing the load applied at the top of the pile, and the displacement of the top and bottom nodes. The specific curve is shown in Figure 11.
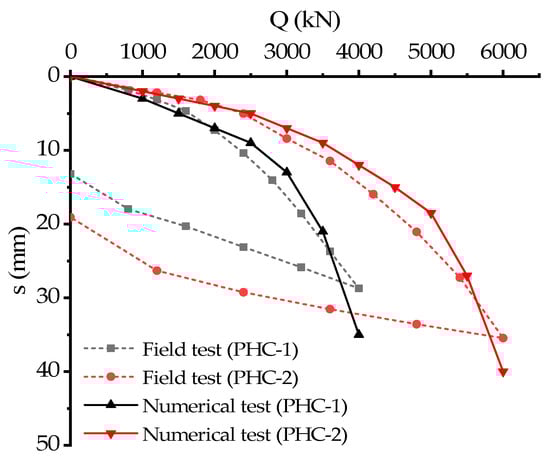
Figure 11.
Comparison of Q-S curves for PHC piles.
According to the Technical Specification for Foundation Pile Inspection in Construction Projects (JGJ106-2014), it can be seen from the Q-s curve that the limit value of the pipe pile without the flaring head was 4100 kN. In comparison, the limit value of the pipe pile with the flaring head was 6050 kN. The test value is consistent with the numerical simulation value, but due to the accuracy of the parameters and the limitation of the simulation conditions. Meanwhile, the soil response after unloading was not considered in the simulation, and the soil deformation kept becoming more extensive during the simulation, but no damage occurred from loading to the end. From the figure, it can be seen that the load–settlement curves of the loading process in the test and the loading process before the simulation fit relatively well, especially for PHC−2, while the numerical calculation results of PHC−1 had some deviation from the actual test which may be because the construction quality of the pipe pile constructed by the hammering method is relatively more difficult to control, but it can be seen that the load–settlement curves calculated numerically are relatively consistent with the trend obtained from the test. However, it can be seen that the numerically calculated load–settlement curves are relatively consistent with the trend obtained from the tests, the overall fitting effect is relatively satisfactory.
A comparison of the stress distribution clouds of the simulated pile–soil and the pile body after the application of the seventh load stage (4000 kN) is shown in Figure 12. From the pile stress distribution cloud diagram of the pipe pile, Figure 10, it can be found that the pipe pile appears to have low stress at the bottom seal of the pile, indicating that the upper load transferred down by the material at the seal is very small, and the main bearing role is played by the perimeter part of the pipe pile.
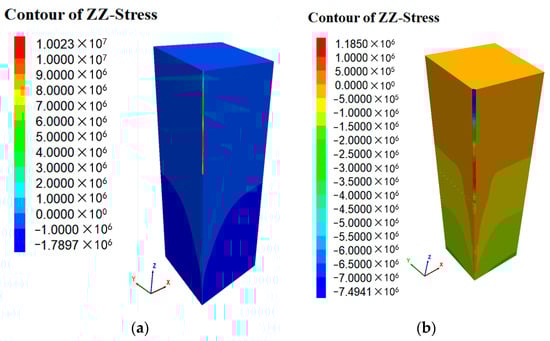
Figure 12.
Pile–soil vertical stress of numerical test (unit: Pa): (a) Pile–soil vertical stress of numerical test (PHC−1); (b) pile–soil vertical stress of numerical test (PHC−2).
When the load is small, the bottom load-carrying capacity is small, and the majority of the frictional resistance is provided by the side frictional resistance of the pile perimeter. Within a certain range, with increasing load on the top of the pile, the side resistance provided by the soil around the pile will increase significantly. When the load reaches a certain level, the lateral resistance of the pipe pile reaches its limit, at this time the bearing capacity provided by the lateral resistance of the pipe pile no longer increases, the increased load is borne by the enlarged head, the bearing capacity at the bottom of the enlarged head increases faster at this stage, and the proportion of resistance provided by the enlarged head increases significantly.
Figure 13 shows the vertical settlement clouds of the pile–soil model under the load. The settlement cloud showed that the settlement deformation mainly occurs in the pile body, followed by the soil on the side of the pile, and the displacement of the soil at the bottom of the pile is smaller compared with the first two, which indicates that the compression of the pile body is large when bearing, and plays the role of bearing. While the frictional resistance on the side of the pile and the resistance at the end of the pile play together to provide the bearing capacity. From the vertical displacement cloud of the pile, it can be found that the displacement of the pile is gradually decreasing from the top to bottom of the pile. From the vertical stress cloud of the pile, the stress distribution of the pile also decreases gradually from the top to the bottom of the pile as well as the displacement of the pile, which indicates that the deformation of the pipe pile is not uniform. The load concentrated at the top of the pile is not completely transferred to the bottom of the pile along the pile but gradually decreases from top to bottom.

Figure 13.
Vertical displacement of piles and soil of numerical test (unit: m): (a) Vertical displacement of soil for the numerical test (PHC−1); (b) vertical displacement of soil for the numerical test (PHC−2); (c) vertical displacement of the pile for the numerical test (PHC−1); (d) vertical displacement of the pile for the numerical test (PHC−2).
From the settlement cloud of PHC−1, we can see that the settlement of the pile–soil model is mainly concentrated in the pile body, and the displacement of the soil on the pile side is very small. However, the settlement cloud diagram of the PHC−2 pile–soil shows that the deformation range of the upper soil is large, and the deformation cloud of the soil on the side of the pile shows a “funnel-shaped” distribution, which indicates that the load has a large influence range on the upper soil. With increasing depth, the area where the pile acts on the soil and causes the displacement of the soil is shrinking, probably because the soil pressure gradually increases and its squeezing effect on the pile gradually strengthens, which limits the lateral deformation of the pile. The overall settlement of PHC−2 is much smaller than PHC−1 due to the presence of the enlarged portion of the pile bottom.
Figure 14 shows the horizontal displacement response clouds of the pile–soil model under the vertical load. As can be seen from the figure, when an axial load of 4000 kN is applied, a lateral deflection of about 1.5 mm occurs even without a lateral load. This deflection is probably due to Poisson’s ratio effect under vertical loading, i.e., when a large axial load is applied, the pile material axial develop not only axial strain in the direction of the load but also lateral strain due to Poisson’s ratio. In addition, the lateral displacement of the pipe pile with the enlarged head is much smaller than that of the pipe pile without an enlarged probe, which may be due to the fact that the enlarged part of the pile bottom can increase the stability of the pile in the lateral direction after the pile is subjected to vertical load and has a limiting effect on the lateral displacement of the pile; however, the pipe pile without an enlarged head has a much smaller influence on the lateral displacement of the soil under vertical load than that of the pipe pile with an enlarged head, which also indicates that under the vertical load, the lateral response of the pipe pile without an enlarged head has less influence on the soil at a distance from the pile.
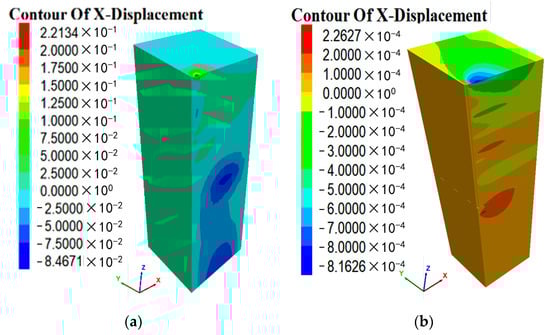
Figure 14.
Horizontal displacement of piles and soil of numerical test (unit: m): (a) Horizontal displacement of the soil for the numerical test (PHC−1); (b) horizontal displacement of the soil for the numerical test (PHC−2).
4.3. Loading and Analysis of the Effect of Pile Diameter
Loading was carried out in accordance with the requirements of the Technical Specification for Inspection of Building Pile Foundations (JGJ106-2014), with the first load level corresponding to a surface force of 1400 kPa at the top of the pile, and each load increased by 700 kPa until it was loaded to 9800 kPa for a total of 13 applied loads. Q-s curves for different diameters of pipe piles obtained by testing the displacement at each node of the pile–soil model are shown in Figure 15.
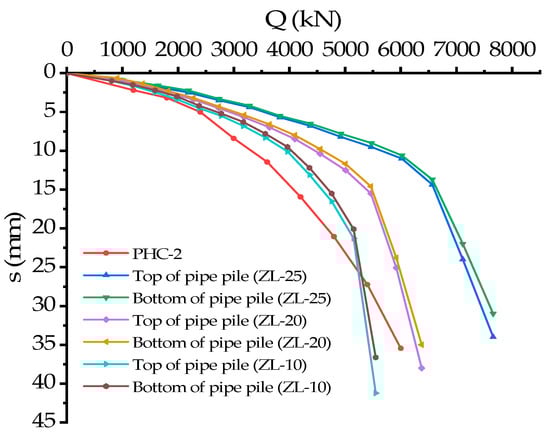
Figure 15.
Numerical simulation of load–settlement curves at the top and end of piles with different wall thicknesses of PHC piles.
Comparing the load–settlement curves of the test pile (PHC−2) with the simulated load–settlement curves of different pile diameters, it can be seen that the curves obtained from the numerical simulation and the test curves are in good agreement at the early stage of loading, with almost the same slope, and the slope of the corresponding load–settlement curves of the test pile increases faster with an increase in load and there is no obvious inflection point. The simulated load–settlement curve has a slow increase in slope in the middle of loading, and a rapid increase in slope in the later period with obvious inflection points.
It can be seen that the load–settlement curves of the top and end of the large diameter pipe pile with a wall thickness of 25 cm are distributed in a straight line in the early and middle periods of loading. When the load is applied to 6120 kN, the load–settlement curve shows a significant steep drop segment. We can obtain the following results from the load–settlement curves and comparison graphs of the three pile types:
- (a)
- The inflection points of the load–settlement curves of the three pile types are obvious, and the linear section curves of the three pile types in the middle period before loading are very close. This is because all three pile types are large diameter deep and long piles, and according to the model soil parameters, it is known that all three pile types are friction piles, and the load applied at the top is mainly borne by the frictional resistance of the soil on the side of the pile. Since the outer diameter of the three pile types is the same, the surface area on the pile side of the three types is also the same, and the contact area with the soil on the pile side is also the same. This causes the vertical bearing performance of the three pile types to not change greatly when the frictional resistance on the pile side is not fully exerted. This is consistent with the results obtained by Ma, JX et al. [38]. However, the straight line section of the precompression interim curve of the 10 cm wall pile is steeper than the first two, indicating that this pile type is weaker than the others in terms of settlement at the top of the pile when subjected to the same load and the ability to withstand vertical loads than the other two pile types. This is due to the smaller volume of the wall 0.1 m pipe pile, its pile can withstand less elastic compression, and the pile displacement is mainly the rigid displacement of the pile body.
- (b)
- From the comparative graph of load–settlement of the three pile types, it can be seen that as the inner diameter of the pile increases, the position of the inflection point of the three curves gradually moves to the left side of the curve and does not completely coincide. This is because although the lateral frictional resistance of the pile takes up most of the top load before the load–settlement curve enters the steeply descending section, a small portion of the load is still provided by the soil layer at the pile end. As the internal diameter of the pile gradually increases, the contact area between the pile end position and the pile end soil layer becomes smaller, resulting in a smaller load-carrying capacity provided by the pile end soil layer.
- (c)
- From the comparison graph of load–settlement of the three pile types it can be seen that after the load–settlement curve enters the steep fall section, the steep fall section curve of the three curves gradually becomes steeper with an increase in the inner diameter of the pile body. This is because at the late stage of loading, the lateral frictional resistance of the pile has exerted its ultimate value, and the increased load at the top of the pile is all borne by the soil layer at the end of the pile thereafter. As the internal diameter of the pile becomes larger, the contact area between the pile end position and the pile end soil layer becomes smaller, resulting in a reduction in the bearing capacity that the pile end soil layer can provide. The value of the load borne by the soil layer at the pile end increases at this stage, resulting in relatively large differences in the curves of the steeply descending section of the three curves. The calculation of the pile lateral frictional resistance was carried out by monitoring and recording the pile axial force distribution. The calculation method is the same as Equation (1). The pile lateral friction resistance diagrams for the three pile types under all levels of loading are shown in Figure 16.
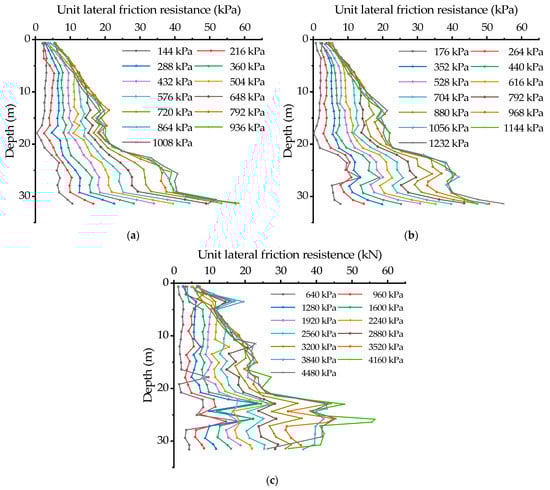 Figure 16. The pile lateral friction resistance curve obtained from numerical simulation: (a) The lateral pile friction resistance curve of ZL-25; (b) the lateral pile friction resistance curve of ZL-20; (c) the lateral pile friction resistance curve of ZL-10.
From the pile lateral friction resistance curves for different pile types under all levels of loading, we can see that with increasing pile depth into the soil, the pile lateral friction resistance shows a more obvious turning phenomenon at the position of the partition interface of each soil layer, which is caused by the inconsistent pile–soil contact surface stiffness at the position of the partition interface of the soil layer. For example, the pile–soil contact surface stiffness was 2.693 × 10⁹ kPa for the upper fine sandy soil and 1.223 × 10⁹ kPa for the lower pulverized soil at 20 m. The contact surface stiffness is reduced, resulting in a significant decrease in the pile lateral friction resistance and a large turn in the curve. With an increase in load, the pile lateral friction resistance of the shallow part of the pile gradually exerts its ultimate lateral resistance, and the lateral friction resistance curves of the powdered clay and powdered soil layers gradually tend to overlap. Finally, the pile lateral resistance curves under two load levels almost completely overlap, and the pile lateral resistance has reached its ultimate value.
To compare the pile lateral resistance curves of the three pile types, the pile lateral resistance curves of the three pile types under 1600 kN, 4400 kN, and 7200 kN were compared. As shown in Figure 17.
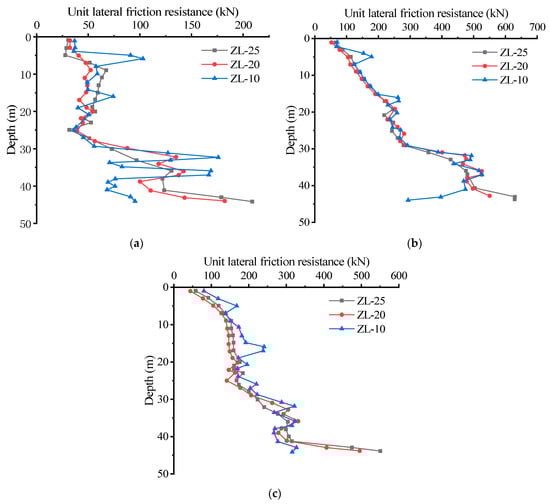
Figure 17.
Pile lateral resistance curves of the three pile types under different loads: (a) Pile lateral resistance curves of the three pile types under 1600 kN; (b) pile lateral resistance curves of the three pile types under 4400 kN; (c) pile lateral resistance curves of the three pile types under 7200 kN.
Comparing the pile lateral friction curves for three pile types subjected to 1600 kN, 4400 kN, and 7200 kN, we can see that the trend of the pile lateral friction curves of different pile types remains the same under different pile top load conditions. When the top pile load is small, the curves are more undulating, and the smaller the internal diameter, the stronger the undulation. With an increase in pile top load, the curves gradually converge, and the undulation gradually decreases. This is because when the top pile load is small, the pile side frictional resistance is less, and the top load is mainly borne by the pile body. Different pile types have different abilities to bear the load so the pile side frictional resistance degree is different. The pile body of a larger inner diameter pile is less able to bear the load so the pile side frictional resistance plays a larger degree, and the undulation at the soil partition interface is larger. Finally, when the load gradually increases, the pile side friction resistance fully plays its bearing capacity so the pile side friction resistance curve gradually tends to be consistent.
5. Conclusions
The pile end-bearing layer selected for this project was a strongly weathered sandstone, and both vertical static load testing of the monopile and pile stress testing were carried out. The results are shown below, combining the field tests and numerical simulation studies conducted on the pile side and pile end resistance.
- Under the same pile diameter and pile length, the single pile bearing capacity of the pipe pile by the inner digging method was 50% higher than that of the ordinary hammering method, and the enlarged part of the pile end had a significant effect on the improvement of the bearing capacity. Therefore, the bearing capacity of the structural foundation can be improved by using the inner digging method when the construction conditions allow.
- The axial force of the middle-digging and bottom-expanding method pipe pile plays from top to bottom; when the top load is small, the axial force of the pile is distributed more evenly as the top load keeps increasing, and the axial force of the part of the pile near the surface increases obviously and decreases rapidly along the direction away from the surface, at this time the pile end force also keeps increasing, the pile side resistance and pile end resistance is an asynchronous process of play. The lateral resistance of the pile is more evenly distributed along the pile body.
- When the top load of the medium-drilled pipe pile reaches the ultimate bearing capacity, the pile end-bearing capacity is strong, and the pile end resistance accounts for 40% to 50% of the pile top load. The pile will appear as an end-bearing friction pile or even as a friction end-bearing pile. In contrast, the higher pile end-bearing capacity helps to improve the pile side-bearing capacity, especially the lateral frictional resistance of the soil near the pile end. The piles have a high vertical load-carrying capacity.
- The simulation results show that increasing the diameter of the enlarged head or enlarging the range of the enlarged head has a certain improvement effect on the bearing capacity and settlement of the pipe pile. The enlarged head can be increased from 1.2 times the pile diameter to 1.4 times or more by mechanical modification of the pile driver. The large diameter enlarged head is preferable for the actual construction of the pipe pile as far as the mechanical conditions allow.
- When the pile is subjected to vertical load, it can be concluded that in different stages of the loading process, PHC pile inner diameter changes have different effects on the pile bearing capacity. When the pile side friction resistance is large in the early stage, the vertical bearing capacity of PHC pile with different wall thicknesses is not very different from other types of piles, and when the top pile load is large, the PHC inner diameter is too small to have a large effect on the pile bearing capacity, therefore, reducing the inner diameter of PHC pile within a certain range can improve the economy.
Author Contributions
Conceptualization, Y.Z.; methodology, Y.Q.; software, Y.Q.; validation, Z.W.; formal analysis, Y.Q.; investigation, D.Y.; resources, J.S.; data curation, Y.Q.; writing—original draft preparation, Y.Q.; writing—review and editing, Y.Z.; visualization, Y.Q.; supervision, J.S.; project administration, J.S.; funding acquisition, J.S. All authors have read and agreed to the published version of the manuscript.
Funding
This research received no external funding.
Institutional Review Board Statement
Not applicable.
Informed Consent Statement
Informed consent was obtained from all subjects involved in the study. Written informed consent has been obtained from the patient(s) to publish this paper.
Data Availability Statement
The data used to support the findings of this study are available from the corresponding author upon request.
Acknowledgments
The authors would like to express their sincere gratitude to Anhui Transport Consulting & Design Institute Co., Ltd. for their help in the course of the experiment.
Conflicts of Interest
The authors declare no conflict of interest.
References
- Zhao, J.P. Comparison for the behavior of expanded-base pile and normal pile driving in soil. Disaster Adv. 2013, 6, 99–106. [Google Scholar]
- Choi, Y.; Kim, D.C. Implementation of Noise-Free and vibration-Free PHC Screw Piles on the Basis of Full-Scale Tests. J. Constr. Eng. Manag. 2013, 139, 960–967. [Google Scholar] [CrossRef]
- Yang, S.H. Design of temporary pier pile foundation construction plan for bridge in soft soil area. Railw. Constr. Technol. 2008, S1, 407–408. [Google Scholar]
- Rooz, A.F.H.; Hamidi, A. Numerical Analysis of Factors Affecting Ground Vibrations due to Continuous Impact Pile Driving. Int. J. Geomech. 2017, 17, 04017107. [Google Scholar] [CrossRef]
- Nguyen, T.N.; Pham, T.Q. Predicting Tensile Strength for Prestressed Reinforced Concrete-Driven Piles. Appl. Sci. 2022, 12, 7112. [Google Scholar] [CrossRef]
- Ya, H.D. Quality control of PHC pipe pile construction by hammering method. J. Cent. South Univ. 2010, 2, 196–199. [Google Scholar]
- Cao, S.S. Construction technology and problem solving of PHC pipe piles by static compression. Fujian Build. Mater. 2019, 12, 59–61. [Google Scholar]
- Daryaei, R.; Bakroom, M.; Aubram, D. Numerical evaluation of the soil behanior during pipe-pile installation using impact and vibratory driing in sand. Soil. Dyn. Earthq. Eng. 2020, 134, 106177. [Google Scholar] [CrossRef]
- Sofiste, V.T.; Godinho, L. Numerical modelling for prediction of ground-borne vibrations induced by pile driving. Eng. Struct. 2021, 242, 112533. [Google Scholar] [CrossRef]
- Zhou, P.; Li, J.P.; Li, L.; Xie, F. Analysis of the existing pile response induced by adjacent pile driving in undrained clay. Comput. Geotech. 2021, 138, 104319. [Google Scholar] [CrossRef]
- Zhang, K.P. Analysis of the effect of soil extrusion on the piling effect of pre-stressed pipe piles constructed by the hydrostatic method. West. Resour. 2022, 1, 55–57. [Google Scholar]
- Zhou, J.J.; Gong, X.N.; Wang, K.H.; Zhang, R.H. A field study on the behavior of static drill rooted nodular piles with caps under compression. J. Zhejiang Univ. Sci. A 2015, 12, 951–963. [Google Scholar] [CrossRef]
- Cao, Z.H.; Liu, H.L.; Kong, G.Q.; Zhou, H. Physical modelling of pipe piles under oblique pullout loads using transparent soil and particle image velocimetry. J. Cent. South Univ. 2015, 22, 4329–4336. [Google Scholar] [CrossRef]
- Kong, G.Q.; Zhou, H.; Ding, X.M.; Cao, Z.H. Measuring effects of X-section pile installation in soft clay. Proc. Inst. Civ. Eng.-Geotech. Eng. 2015, 168, 296–305. [Google Scholar] [CrossRef]
- Liu, J.; Wang, F.; He, S.; Wang, E.; Zhou, H. Enlarging a large-diameter shield tunnel using the Pile-Beam-Arch method to create a metro station. Tunn. Undergr. Space Technol. 2015, 49, 130–143. [Google Scholar] [CrossRef]
- Wang, Y.; Gao, D.; Fang, J. Finite element analysis of deepwater conductor bearing capacity to analyze the subsea wellhead stability with consideration of contact interface models between pile and soil. J. Petrol. Sci. Eng. 2015, 126, 48–54. [Google Scholar] [CrossRef]
- Lei, K.H.; Zhou, D.W.; Liu, T. Field Performance of Open-Ended Prestressed High-Strength Concrete Pipe Piles Jacked into Clay. Sensors 2018, 18, 4216. [Google Scholar]
- Kou, H.L.; Yu, F.; Liu, T. Strain Monitoring on PHC pipe piles Based on Fiber Bragg Grating Sensors. J. Perform. Constr. Fac. 2019, 33, 04019003. [Google Scholar] [CrossRef]
- Ozturk, B.; Kodsy, A.; Iskander, M. Forecasting the Capacity of Open-Ended Pipe Piles Using Machine Learning. Infrastructures 2023, 8, 12. [Google Scholar] [CrossRef]
- Baca, M.; Ivannikov, A.L.; Rybak, J. Numerical Modelling of Various Aspects of Pipe Pile Static Load Test. Energies 2021, 14, 8598. [Google Scholar] [CrossRef]
- Baca, M.; Rybak, J. Pile Base and Shaft Capacity under Various Types of Loading. Appl. Sci. 2021, 11, 3396. [Google Scholar] [CrossRef]
- Zhou, X.L.; Kou, H.L.; Li, C.H. Shaft Resistances of Jacked Open-ended PHC Pipe Piles. Geotech. Eng. 2017, 48, 111–114. [Google Scholar]
- Zhang, Z.J.; Li, G.C.; Wang, W.J. Experimental lnvestigation and Nonlinear Finite Element Analysis on Seismic Performance of PHC Piles. Struct. Eng. Int. 2018, 28, 475–488. [Google Scholar]
- GTao, L.; Chen, X.J.; Chen, J.; Pan, Y.P. Study on seismic damage model of PHC pipe pile embedded in clay soil. IOP Conf. Ser. Earth. Environ. Sci. 2019, 304, 042033. [Google Scholar]
- Huang, F.Y.; Wu, S.W.; Luo, X.Y.; Lin, Y.W. Pseudo-static low cycle test on the mechanical behavior of PHC pipe piles with consideration of soil-pile interaction. Eng. Struct. 2018, 171, 992–1006. [Google Scholar] [CrossRef]
- Ren, J.W.; Xu, Q.B.; Chen, G.; Lu, Y. Flexural performance of pretensioned centrifugal spun concrete piles with combined steel strands and reinforcing bars. Structures 2021, 34, 4467–4485. [Google Scholar] [CrossRef]
- Wang, J.W.; Hyun, J.H.; Lee, B.Y.; Kim, Y.Y. Cyclic behavior of connection between footing and concrete-infilled composite PHC pile. Struct. Eng. Mech. 2014, 50, 741–754. [Google Scholar]
- Liu, J.W.; Zhang, Z.M.; Zhang, R.H.; Wang, S.F. Comparative Experimental Study on Flexural Property of Reinforced and Conventional PHC Pile. Adv. Mater. Res. 2010, 165, 2376–2380. [Google Scholar]
- Li, L.; Yang, C.Y.; Li, J.P. Corrosion initiation life of laterally loaded PHC pipe piles served in marine environment: Theoretical prediction and analysis. Constr. Build. Mater. 2021, 293, 123457. [Google Scholar] [CrossRef]
- Cao, X.L.; Dai, G.L.; Gong, W.M.; Tang, J.N. Experimental study on the seismic behavior of new PHC piles. Arab. J. Geosci. 2020, 13, 259–270. [Google Scholar] [CrossRef]
- Yao, Y.; Tian, T.; Wang, B. Impact of Marine Chloride ion Erosion Environment on the Durability of Deep Sea Pile Foundation. J. Coastal. Res. 2019, 98, 6–9. [Google Scholar]
- Zhou, J.J.; Yu, J.L.; Gong, X.N. Field study on the behavior of pre-bored grouted planted pile with enlarged grout base. Acta Geotech. 2021, 16, 3327–3338. [Google Scholar] [CrossRef]
- Ruan, B.Y. Rational construction analysis of follow-on drilling method pipe piles in sandy soils for railway bridges. Railw. Stand. Des. 2018, 10, 79–82. [Google Scholar]
- Li, Z.G.; Li, Y.; Zhao, C.F. Bearing performance of large-diameter medium-drilled expanded bottom method pipe piles in soft soil areas Field test analysis of performance. Chin. Civ. Eng. J. 2016, 49, 78–86. [Google Scholar]
- Zhao, C.; Du, X.H.; Zhao, C.F. Vertical bearing capacity of inner-digging prestressed piles. Chin. J. Geotech. Eng. 2013, 35 (Suppl. 1), 393–398. [Google Scholar]
- DB34/5005-2014; Technical Specifications for Pretensioned Pre-Stressed Spun Concrete Pile Foundation, 1st ed. Anhui Province Engineering Construction Standard Design Office: Hefei, China, 2014.
- JGJ 106-2014; Technical Code for Testing of Building Foundation Piles. China Architecture Publishing & Media Co., Ltd.: Beijing, China, 2014.
- Ma, J.X.; Wang, Y.H.; Zhang, M.Y. Penetration Characteristics of Jacked Piles with Different Pile Diameters Based on Fiber Bragg Grating Sensing Technology. Chin. J. Lasers 2020, 47, 0504003. [Google Scholar]


Disclaimer/Publisher’s Note: The statements, opinions and data contained in all publications are solely those of the individual author(s) and contributor(s) and not of MDPI and/or the editor(s). MDPI and/or the editor(s) disclaim responsibility for any injury to people or property resulting from any ideas, methods, instructions or products referred to in the content. |
© 2023 by the authors. Licensee MDPI, Basel, Switzerland. This article is an open access article distributed under the terms and conditions of the Creative Commons Attribution (CC BY) license (https://creativecommons.org/licenses/by/4.0/).