1. Introduction
Road tunnels pose the greatest danger for fires [
1,
2]. Due to the confined spaces, the effects of a road tunnel fire that starts naturally or as a result of a car accident can be disastrous [
3,
4,
5].
According to estimates, there are about 25 tunnel fires per 100 million kilometers of vehicle travel; 10 of these involve heavy vehicles carrying no risky goods and 2 involve heavy vehicles carrying dangerous goods. Weng et al. [
6] state that smoke inhalation causes 85% of fatalities in underground fires. Furthermore, in China, car technical issues account for more than half of tunnel fire accidents (TFAs).
To accurately define the technological systems for tunnel safety and to evaluate the safety conditions of a road tunnel, this type of risk must always be taken into account.
The factors that make the tunnel a place with particular needs from the point of view of fire precautions are many [
7]:
The confined environment, with the possible achievement of high temperatures and the production of toxic gases that can involve users;
The presence of a high amount of combustible material inside the tunnel, in particular with regard to the fuel in vehicle tanks and the high calorific value of some materials inside heavy vehicles;
The influence of natural or mechanical ventilation on the evolution of fire and on the propagation of temperatures and toxic gases;
The difficulty of accessing from the outside in order to intervene with the aim of containing or extinguishing the fire, or to reach and rescue the people inside the tunnel.
Analysis of previous tunnel incidents has shown that fires start in the vehicle’s chassis, which contains the fuel and ignition sources. The oxygenation brought on by natural or artificial ventilation then allows the fire to spread to other nearby materials. Because of the tunnel’s closed structure (heat and fumes are kept contained) the temperature raises, the air quality degrades, and visibility reduces, rendering the environment uninhabitable even far from the point where the fire began.
The three tragedies that occurred in Europe at the turn of the century—the Tauern Tunnel (Austria), which claimed twelve lives, the St. Gotthard Tunnel (Switzerland), which claimed eleven, and the Mont Blanc Tunnel (France–Italy), which claimed thirty-nine lives—had a profound emotional impact on the public [
8]. As a result, the discussion on road tunnel safety was expanded to include administrations, managers, designers, technical specialists, and users. They also asked for regulatory responses from the European Union. More precisely, there was a deficiency in mechanical ventilation during the emergency stage. Additionally, there were no communications made to travelers during the emergency phase, and the fire’s fumes rendered the environment uninhabitable even far from the site of ignition. In all these cases, it was necessary to wait for the natural extinction of the fire, for several hours after it was started, with serious damage to the tunnel structures.
To effectively manage a fire, it is necessary to know its dynamics and to understand the effects in terms of smoke production (toxic combustion gases) and temperature increase. Catastrophic fires in road tunnels have highlighted the need to study the dynamics of fires in detail: the rate of heat release over time (HRR—heat release rate) and the quantity and speed of smoke inside the tunnel. The starting point for these studies was the research carried out in the past on compartmentalized fires (i.e., those fires in an enclosed environment, such as a building).
Over time, some interesting experimental studies have been carried out to analyze these phenomena, in particular the spread of fires between nearby vehicles. Much knowledge derives from full-scale on-site tests on fires (Eureka 499 Firetun 1991–1992 project, European project developed in Norway; 1993–1995 Memorial Tunnel project in the USA) and back-analysis of large fires in tunnels and underground mines.
Tunnel fires differ from open fires for a few main reasons:
The effects of the heat produced are more important in a tunnel due to the space confinement (a vehicle that does not burn intensely outside can burn vigorously inside a tunnel); the maximum fire thermal power reached inside a tunnel can be 3–4 times larger for the same material than in the open space;
Inside a tunnel, there may be a lack of oxygen compared to open fires;
The fire in a tunnel interacts with the ventilation producing an aerodynamic disturbance in the airflow, that is not simple to evaluate preliminary.
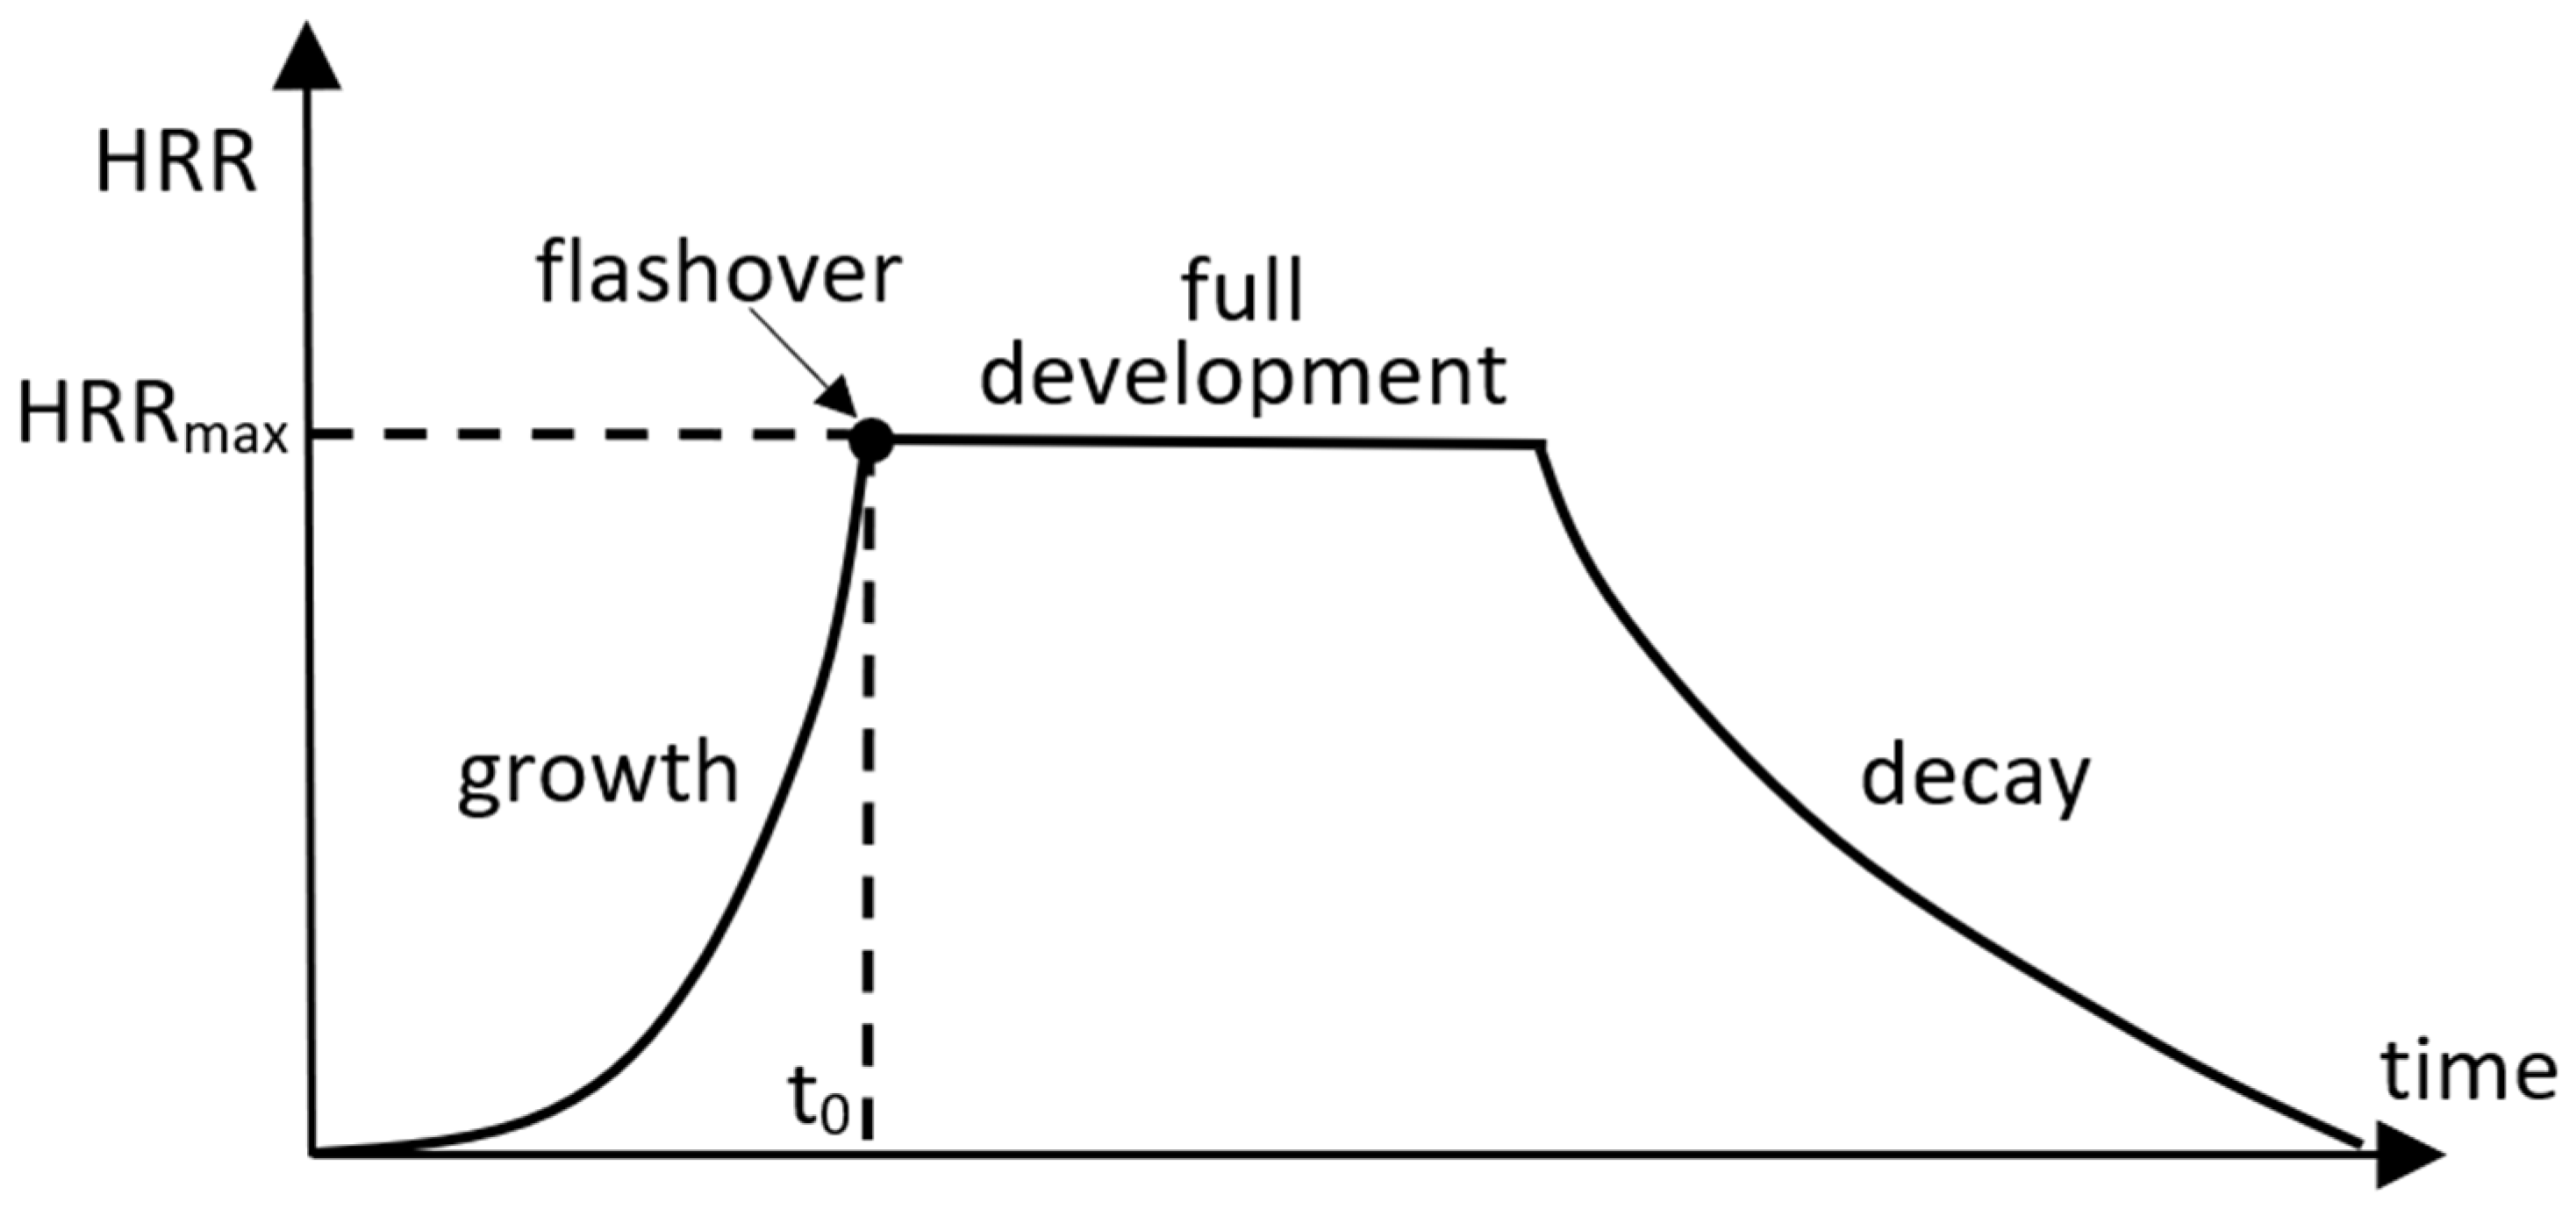
According to Drysdale [
9], the fire development is divided into separate phases (
Figure 1): growth (with an upward concavity curve indicating a progressive increase in
HRR over time up to the flashover); full development of the fire (with a constant
HRR value for a certain interval of time); decay (with a progressive decrease in the
HRR, until its complete extinction).
Similar power curves for fires can be found in the literature [
10] and can be used with computational fluid dynamics methods to accurately simulate a fire, particularly during its initial stages and the start of its complete development. To emphasize, the early stages of a fire are crucial because they allow for the possibility of saving those who are inside the tunnel before the fire reaches a hazardous (and challenging to control) power level. The following parabolic equations for the growth phase of a fire in a road tunnel (
HRR in MW,
t in min) can be written based on the curves suggested by PIARC and NFPA [
11]:
HRRmax = 10 MW: a = 0.4; t0 = 5 min
HRRmax = 30 MW: a = 1.33; t0 = 4.75 min
HRRmax = 50 MW: a = 0.5; t0 = 10 min
HRRmax = 100 MW: a = 1.0; t0 = 10 min
HRRmax = 300 MW: a = 1.33; t0 = 15 min
The maximum power (
HRRmax) reached by a tunnel fire depends on the type of vehicle that catches fire [
12]: a car (5 MW), a van (15 MW), a bus (30 MW), a loaded heavy vehicle (up to 100 MW), a heavy vehicle with dangerous goods (up to 300 MW). In the literature, it is also possible to have an estimate of the quantity of fumes
Q (in m
3/s) produced during a vehicle fire [
12] with reference to the
HRR value (in MW):
Due to the aforementioned factors, heavy vehicles transporting hazardous materials are a major source of safety worry. Additionally, heavy vehicles alone account for 50% of tunnel fire causes, so they must be carefully taken into account when evaluating the safety conditions of a road tunnel.
Tests conducted at the Memorial Tunnel have shown how the fumes produced by a 20 MW fire can move in the tunnel (in both directions) with a speed of 2.5–3 m/s when there is no mechanical ventilation; fires of 50 MW showed smoke velocities of 4–4.5 m/s. In recent large fires in the Mont Blanc and Gotthard Tunnel, even higher speeds were detected, corresponding to the peak power reached by the fire (
HRRmax) [
12].
The results of the studies on full-scale tests conducted as part of the mentioned Eureka Project have highlighted some interesting aspects of road tunnel fires:
The flashover is reached after 7–10 min from the start of the fire;
The total duration of a fire involving a vehicle in a tunnel can vary from 30 min to several hours;
Even small fires can emit a large quantity of fumes which can cause serious danger to the exposed persons in the tunnel;
In some cases, the saturation with fumes (with a visibility of less than 1 m) of the entire tunnel during the fire was detected.
The interaction of the fire with the ventilation system can lead to a very important phenomenon for the analysis of the risks for the users of the tunnel: the counter-current flow of hot gases and fumes (back-layering) from the fire towards the upstream entrance, against the air direction. In short, in one-way tunnels with longitudinal ventilation in the direction of vehicular traffic (the typical case), the back-layering can reach people who are trying to escape on foot after leaving their cars.
Furthermore, when a powerful ventilation system is activated after the fire has been started, the consequences can be dramatic; the flames can suddenly increase in length and the fire can easily spread to other vehicles.
Depending on the geometries and the flow of traffic, modern tunnels typically use a variety of ventilation methods [
13]. Systems for horizontal and transverse ventilation are regarded as standards. Using two different circuits, the transverse ventilation enables autonomous control of the fresh and exhausted air along the tunnel’s length. It is used for long tunnels with two-way traffic, but it has expensive startup and maintenance expenses. In one-way traffic tunnels, jet fans are used as part of the longitudinal ventilation system to bring fresh air in that direction [
14,
15,
16]. Usually, the fans are mounted on the tunnel ceiling to regulate smoke longitudinally.
Since ventilation is crucial during a tunnel fire, it is fundamental to proceed with the proper fan sizing in order to give exposed people time to flee before the environment becomes unsuitable for survival.
In this work, the effects of jet fans on the evolution of fires and on the control of toxic fumes in one-way road tunnels will be analyzed, using analytical and numerical methods. More specifically, a newly developed calculation procedure is presented; it is able to permit a fast analysis in order to evaluate the risk of the back-layering phenomenon during a fire in a one-way road tunnel. The calculation method will be then applied to a studied case of a road tunnel in Northern Italy with a length of 800 m. On the basis of the obtained results, specific considerations will be developed in order to define the characteristics of the fans to be used and their location along the tunnel.
2. Effects of the Ventilation System in a One-Way Road Tunnel during a Fire Using Analytical Methods
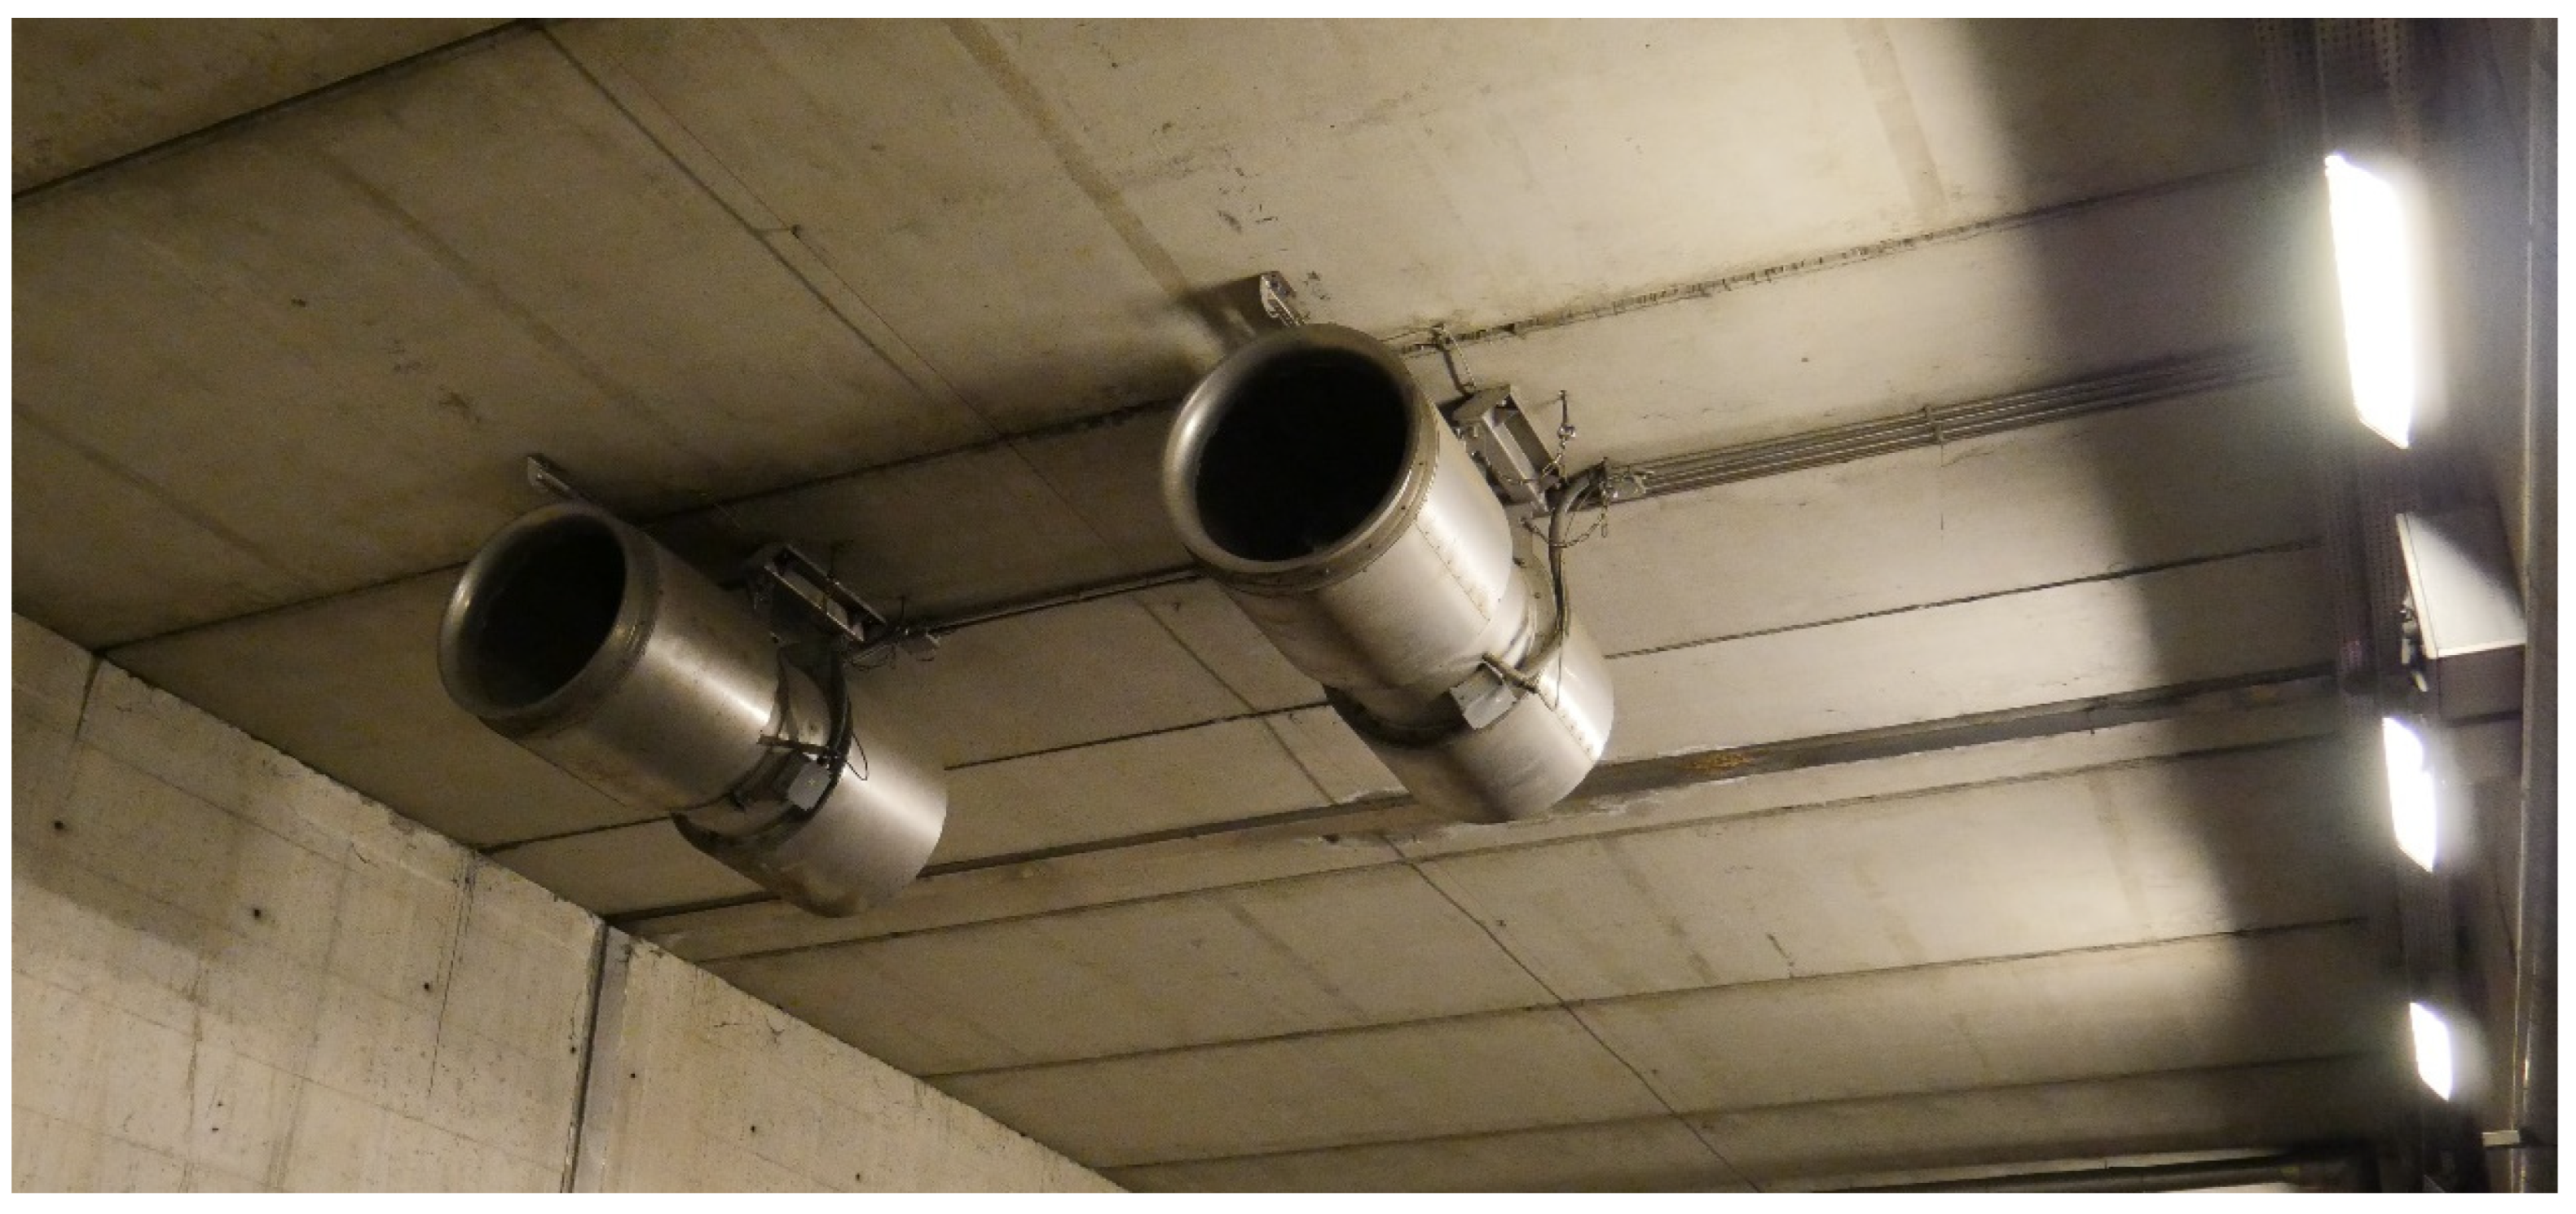
The use of jet fans (
Figure 2) in longitudinal ventilation of one-way tunnels enables the control of fumes upstream of the fire, keeping them contained to a small distance from it (back-layering distance), and allowing the escape and rescue of the tunnel occupants towards the upstream entrance. When the high temperatures of the fire engage fans downstream and render them inoperable, the ventilation system may experience a crisis. It would be possible to guarantee limited control of the fumes at least during the first evolutionary phase (fire growth) by restricting the operation of the fans to the upstream zone (possibly also downstream but at a certain distance from the fire). This would allow a slow propagation of the effects of the fire toward the upstream entrance.
Back-layering phenomenon happens when the air velocity is lower than the critical velocity (
vc) [
17,
18,
19,
20]. Typically, critical velocities are estimated in the range of 2.5–3.0 m/s [
17,
18,
19,
21]. According to NFPA 502-Annex D [
10],
vc can be evaluated by the following equations:
where:
KFr is the Froude number factor, which can be expressed as a function of HRR in kW by the following expression:
when HRR is between 10,000 and 100,000 kW
KFr = 0.870 when HRR 10,000 kW; KFr = 0.606 when HRR 100,000 kW;
Kg is the grade factor (1 for horizontal tunnels);
g is the gravity acceleration (9.81 m/s2);
H is the tunnel height (m);
is the air-specific mass upstream of the fire (kg/m3), depending on the temperature and atmospheric pressure (1225 kg/m3 in standard conditions);
Cp is the air average specific heat (kJ/(kg∙K)); generally, is adopted 1.009 kJ/(kg∙K) for standard conditions;
A is the tunnel cross section (m2);
Tf is the average temperature of the fire gas (K), defined by the following equation:
T and v are the air temperature and velocity upstream of the fire, respectively.
The critical speed
vc is obtained putting
v =
vc in Equation (5) and then adopting an iterative process using Equations (4) and (5) until finding the convergence of the values of
vc and
Tf, starting from nil initial values for both [
10].
Wu and Bakar [
21] proposed another interesting equation for
vc, subsequently modified by Li et al. [
20], based on laboratory and in situ experiments, as follows:
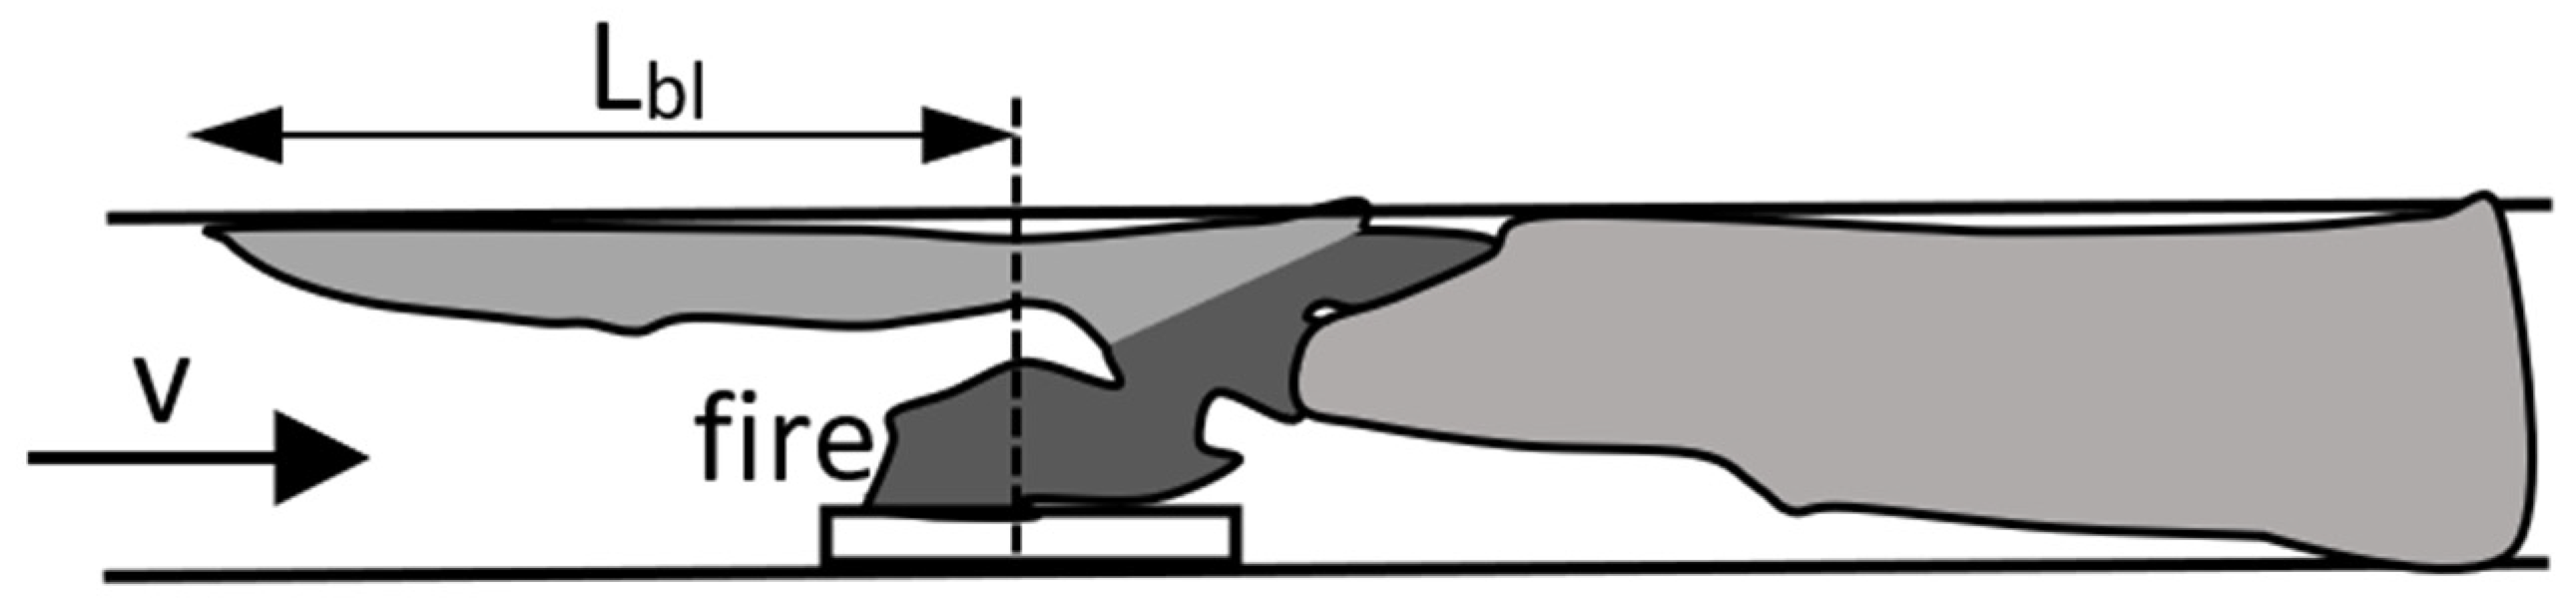
If the air velocity is lower than the critical one (
v <
vc), it is possible to determine the distance
Lb from the fire reached by the fumes in the upstream section of the tunnel (
Figure 3) [
18,
22]:
where:
k is a dimensionless constant experimentally evaluated between 0.6 and 2.2 [
17,
23,
24,
25];
The other quantities expressed in congruent units.
Figure 3.
Smoke formation towards the upstream direction (back-layering) in the presence of mechanical ventilation during a fire (redrawn by Beard and Carvel [
7]). Key:
v is the air velocity in the upstream section of the tunnel,
Lbl is the distance reached by the fumes upstream from the fire location point (
Lbl depends on
v and the fire heat output
HRR).
Li et al. [
20], based on the results of laboratory experiments, defined
Lbl with the following equations:
More precisely, as speed v decreases, the back-layering phenomenon assumes a greater importance, putting the evacuation of people inside the tunnel at serious risk. It is for this reason that the sizing of the jet fans in a one-way tunnel must be carried out not only by ensuring low concentrations of pollutants during its standard operation, but also by ensuring adequate air velocity v during a possible fire.
The presence of a number
n of jet fans in defined positions in the tunnel produces a pressure difference Δ
pjf in the air, between a section upstream and one downstream of them, equal to:
where:
P is the power absorbed by each jet fan; in simplified analyses, the fans are considered to be active from the beginning of the fire, assuming that the fire detection sensors can activate them at their maximum power as soon as (or shortly after) a fire starts.
η is the efficiency of the single jet fan.
Having to keep the mass flow rate constant, the air velocity downstream of the fire will increase by an incremental coefficient equal to
Tf/
T; the pressure variation produced by the jet fans downstream of the fire will therefore decrease according to the following equation:
where:
u is the air velocity exiting the jet fan, estimated by the following equation:
F is the nominal thrust force of the single jet fan.
The pressure increases Δpjf provided by the jet fans inside the tunnel are balanced by the loss of air pressure during its movement; the main losses are due to:
Air entry into the tunnel (Δpen) and exit (Δpex);
Friction on the tunnel walls upstream and downstream of the fire (Δptun);
Presence of the fire itself at a point inside the tunnel (Δpfire).
The pressure loss due to the tunnel entry and exit can be expressed by the following equations:
The pressure loss due to the friction of the air along the tunnel walls is given by the following equation:
where:
λ is the friction coefficient of the tunnel wall, also known as the Moody coefficient (set equal to 0.015–0.020 for concrete walls);
Dhyd is the hydraulic diameter of the tunnel cross-section, equal to 4 times the ratio between the area and the perimeter of the cross-section;
Ltot is the total length of the tunnel;
Lfire is the distance of the fire from the tunnel entrance.
Finally, a fire induces a concentrated pressure loss Δ
pfire, equal to about 60–100 Pa for medium–high thermal power fires, due to the air and fumes turbulence and accelerations. It is possible to use the following equation to determine an estimate of Δ
pfire (in Pa) as a function of the fire heat output
HRR (in Watts):
The air velocity
v in the upstream section of the fire is then obtained by equating the sum of the pressure increases due to the jet fans and the pressure losses detected along the tunnel during a fire (the pressure loss due to the back-layering phenomenon is neglected due to the fact that it is generally lower than the other terms):
Considering as a precaution that the fans downstream of a medium–high thermal power fire can go out of service due to the high air temperatures and that the thermal power lost by convection and radiation on the walls of the tunnel is negligible due to the sudden increase in the temperature of the same walls, the air velocity v can be obtained from the following equation (Cardano solution):
where:
m is the total number of jet fans active in the upstream zone of the tunnel;
All quantities are expressed in the international system: m, kg, N, s, J, K, W.
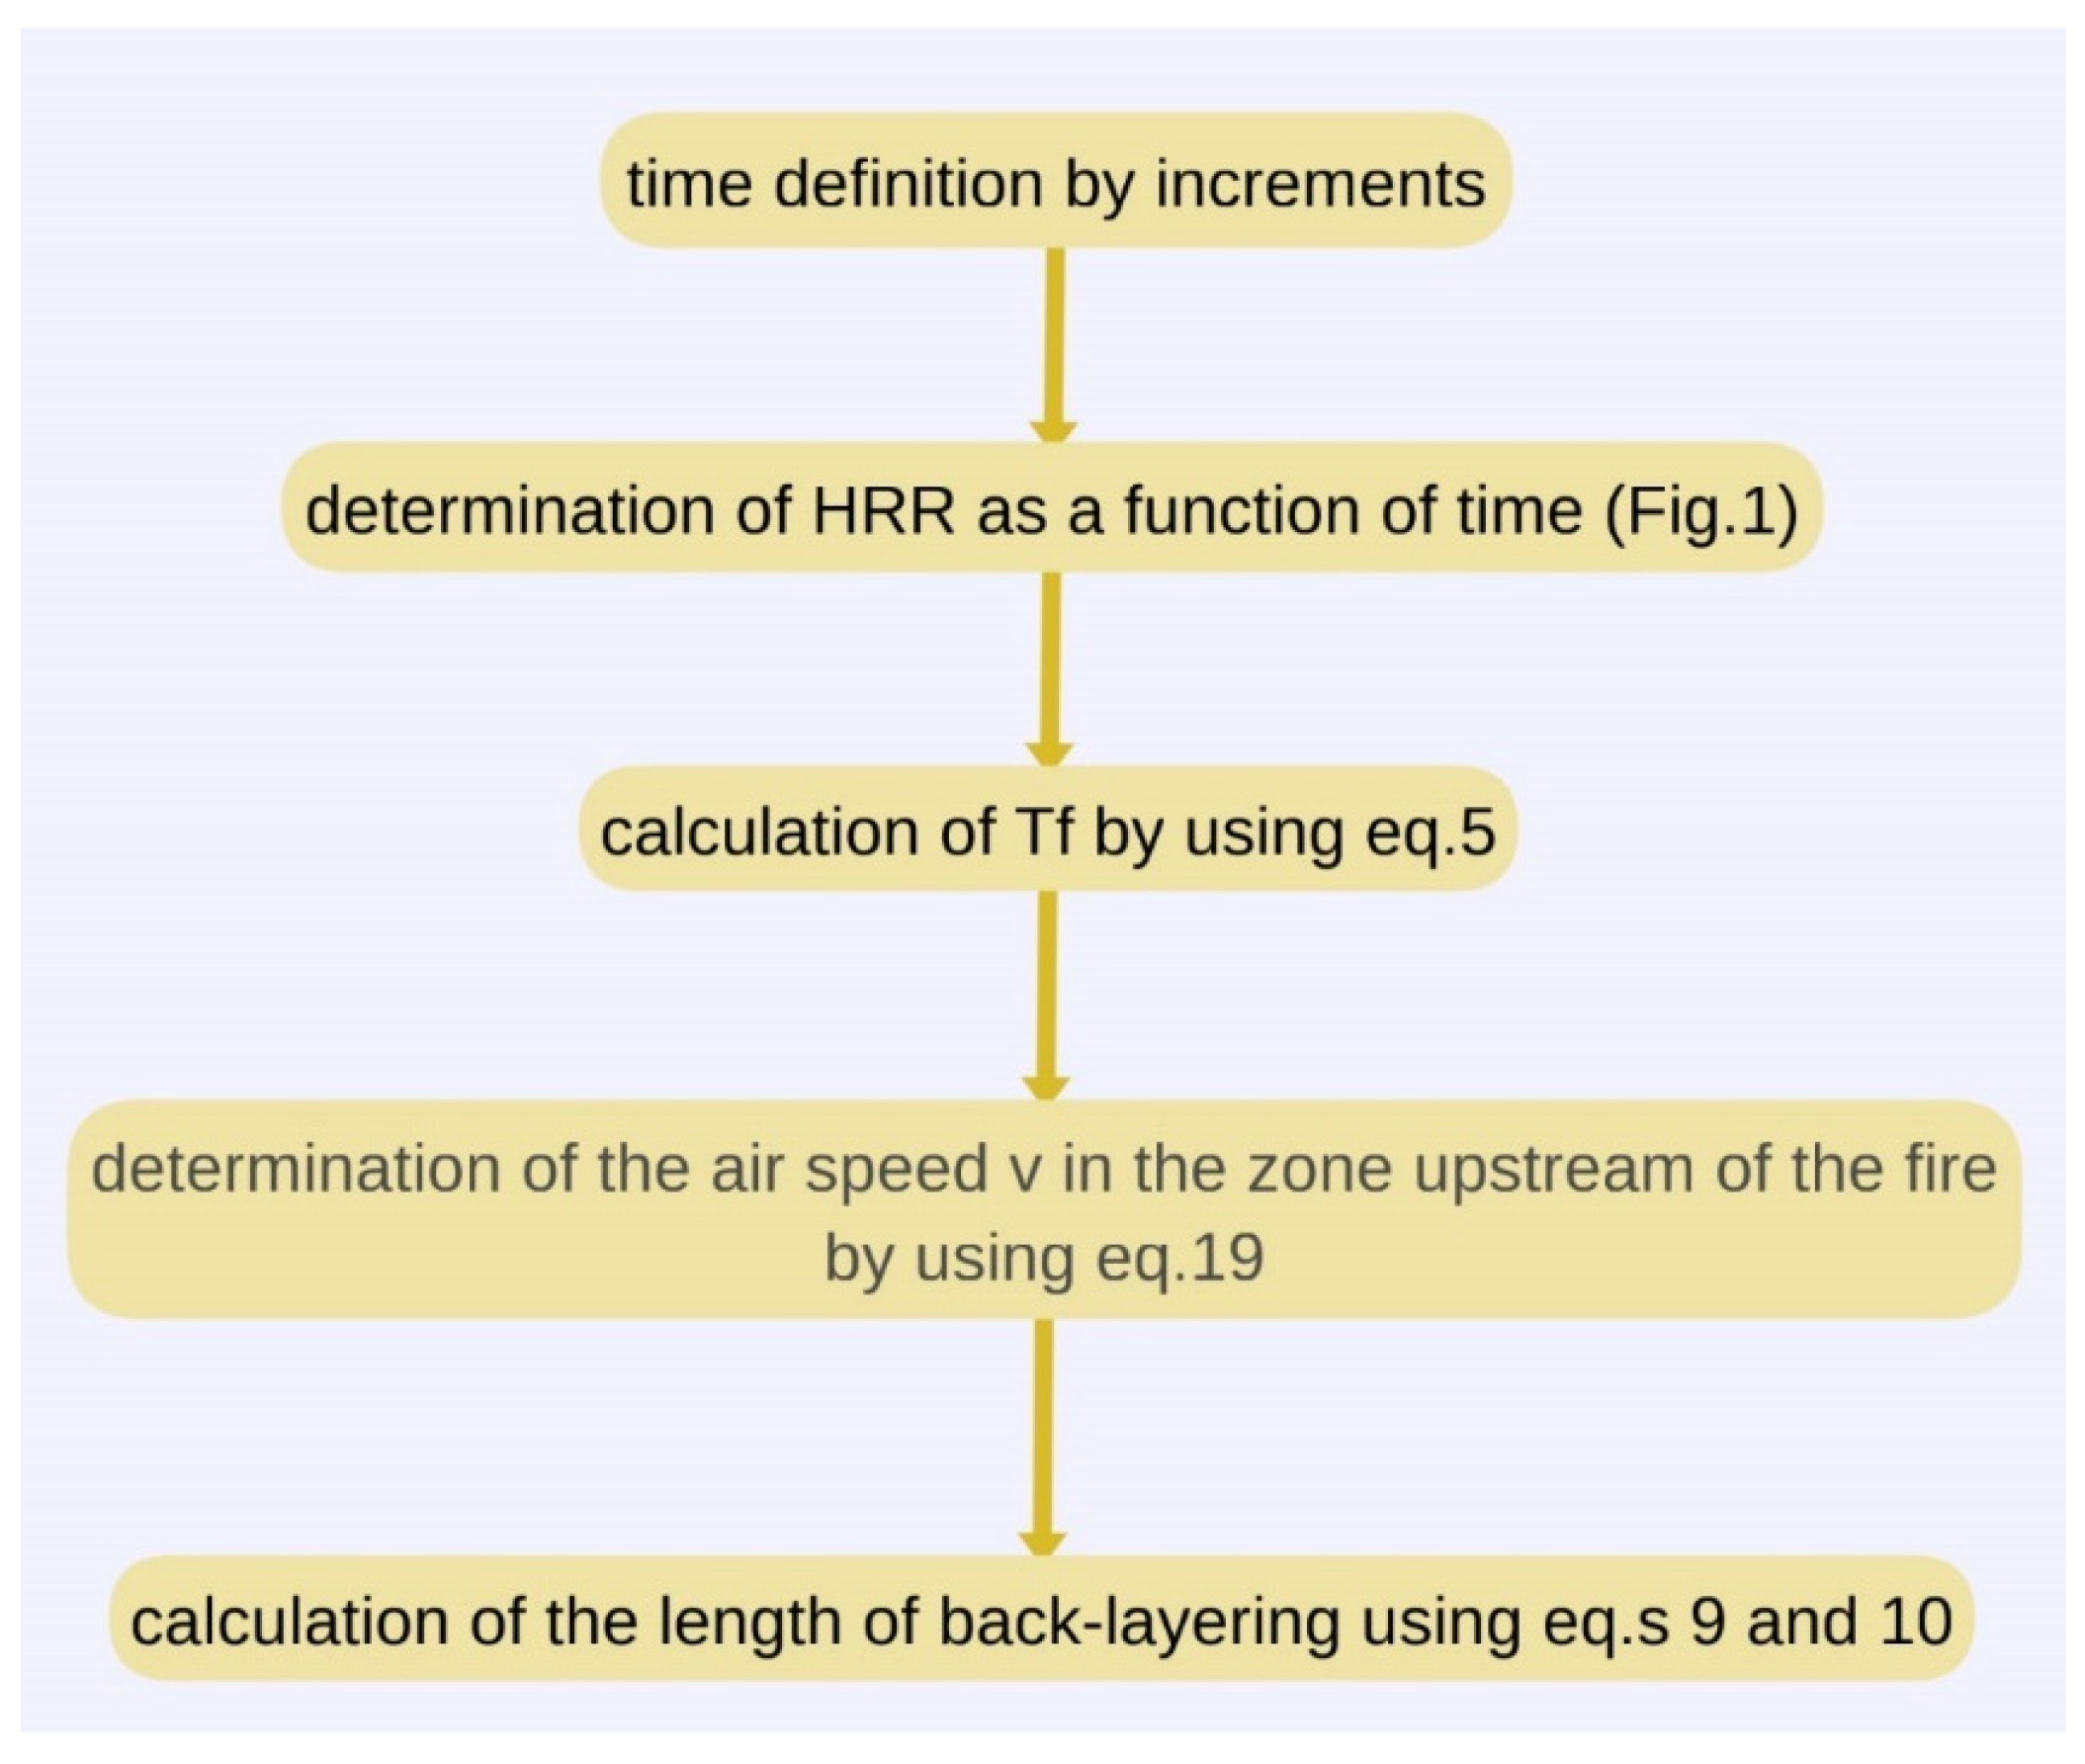
To analyze the evolution of the back-layering length over time from the start of the fire (
t = 0) it is necessary to adopt an iterative process (
Figure 4), increasing the time t for predefined intervals and evaluating the main characteristics of the fire. The iterative process requires an initial air velocity
v at time
t = 0 (in the absence of fire), which can be obtained from the following simple equation:
The final result of the procedure is represented by the evolution over time of: the air temperature downstream of the fire, the upstream air velocity, and the back-layering length of the fumes towards the upstream entrance.
If a fire occurs at a point where no active jet fans upstream of it are conceivable, it is appropriate to assume the absence of mechanical ventilation. In this case, the air velocity upstream of the fire must be cautiously set equal to 0. The back-layering distance can, however, be calculated using Equations (2) and (3) for the determination of the smoke flow rates produced by the fire, assuming that the fumes are divided equally in the two directions starting from the point of formation of the fire:
where we used m for
Lbl, m
2 for
A, MW for
HRR, and min for time
t.
In these cases, the length Lbl can rapidly increase over time, causing serious risks for people at a short distance from the fire. Therefore, the evaluation of the evolution of the fumes over time is of particular interest, when there are no jet fans in the zone upstream of the fire.
3. Numerical Modelling of a Fire in a Road Tunnel
Nowadays, numerical computational fluid dynamics (CFD) is often used to calculate air and fume velocities and temperature patterns in the event of a fire along a road tunnel [
13,
21,
26,
27,
28].
The simulation of a tunnel fire through numerical modeling allows us to analyze in detail the air characteristic parameters. Although this may be true, back layering is challenging to study directly in the calculation due to the numerous factors that can play a decisive role in this phenomenon. It is, however, possible to evaluate the air velocity and temperature inside the tunnel during the fire evolution. From these results, it is then possible to estimate the back-layering length using Equations (9) and (10).
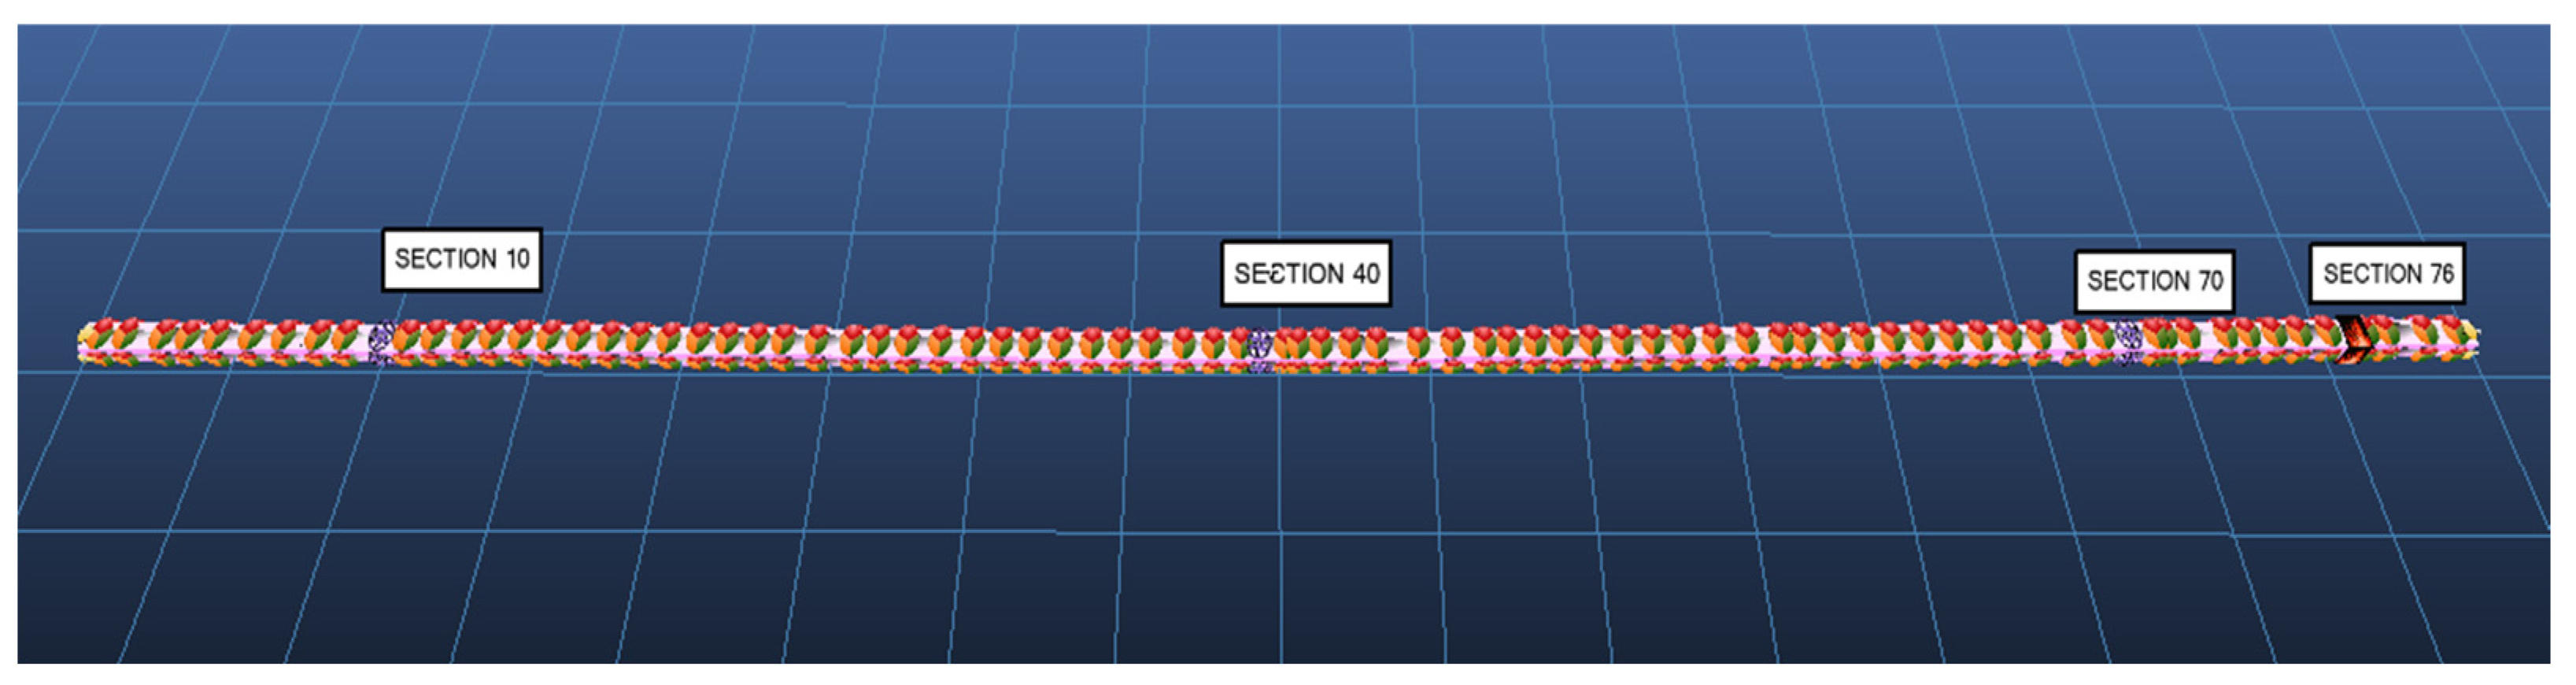
To allow relatively short calculation times to be obtained, the tunnel is generally simulated by one-dimensional elements placed in series, each one representing a portion of the tunnel length for its entire cross-section (
Figure 5).
The main input data required by numerical models are:
Dimensional characteristics of the tunnel (shape of the cross-section and its area);
Number of adopted elements and length of the tunnel represented in each element;
Friction coefficients of air on the tunnel lateral surface;
External temperature, specific mass, and specific heat of the air as its temperature and pressure vary;
Coefficients that govern the heat transmissivity towards the lining and the ground/rock surrounding the tunnel;
Location of the fire in the tunnel and hypothesized HRR evolution over time;
Number and position of jet fans inside the tunnel;
Operating parameters of the jet fans: more specifically the nominal absorbed power and the pressure–flow curve.
In general, the most interesting results obtained from the numerical calculation concern:
The air velocities upstream of the fire;
The temperatures reached downstream of it and along the entire section of the tunnel between the fire and the air outlet section;
The concentration of dangerous gases within the fumes and visibility in the areas of the tunnel occupied by the fumes;
The operating modes of the fans inside the tunnel.
Obviously, the results can be obtained over time during the entire evolution of the fire starting from its ignition. The effects of the fire on the air velocity upstream of the fire are able to permit the estimation of the length of back-layering over time and, therefore, the speed with which the fumes move against the fresh air towards the entrance of the tunnel.
Several calculation programs are now available to be able to develop these sophisticated simulations. In particular, VentSim (
https://ventsim.com/, accessed on 1 March 2023) [
29,
30] is a specific program to simulate underground ventilation circuits inside tunnels and mines. It is, therefore, particularly suitable for studying the airflow conditions during a fire inside a one-way tunnel in the presence of jet fans. The computer code has a specific module (VentFire module) capable of satisfactorily representing the fire inside the underground cavities, and for this reason, it will be adopted in this study.
Researchers from all over the world have used the Ventsim program and the VentFIRE module for many years to study the issues with mine ventilation and, more recently, to investigate the impacts of fires in underground cavities [
31,
32]. These calculation tools have been used in numerous studies that have allowed for the analysis of fire evolution and ventilation system circumstances. The validation of the calculation tool was made possible by the availability of the on-site data and the comparison with the modeling outcomes. Using the same calculation software (Ventsim 5.4), the authors of this paper have thoroughly examined the ventilation of the mine that is being studied and have successfully compared the obtained results with in situ measurements [
33].
In recent studies, it has been possible to successfully use the Ventsim 5.4 software also to analyze fires that develop in road tunnels [
34].
The used software has the benefit of being flexible and accurate in its calculations. It can take into account a sizable number of variables that can affect the air movement inside underground voids, even in the case of significant perturbations brought on by locally elevated temperatures from a fire.
The need to prepare specific models by inserting all the necessary input data previously seen make numerical modeling quite complex and relatively slow. Only some of the hypotheses that can be assumed in the design phase are thoroughly analyzed with numerical modeling, leaving the task of developing parametric analyzes to faster analytical methods. These parametric analyzes consist in varying input data that are significant in the problem under examination identifying one or more design solutions that are optimal in facing some specific risks related to the development of a fire in a road tunnel. The few solutions identified can then be analyzed in more detail with numerical modeling to guide the final solution that will be part of the project.
4. The Studied Case of a Road Tunnel in Northern Italy
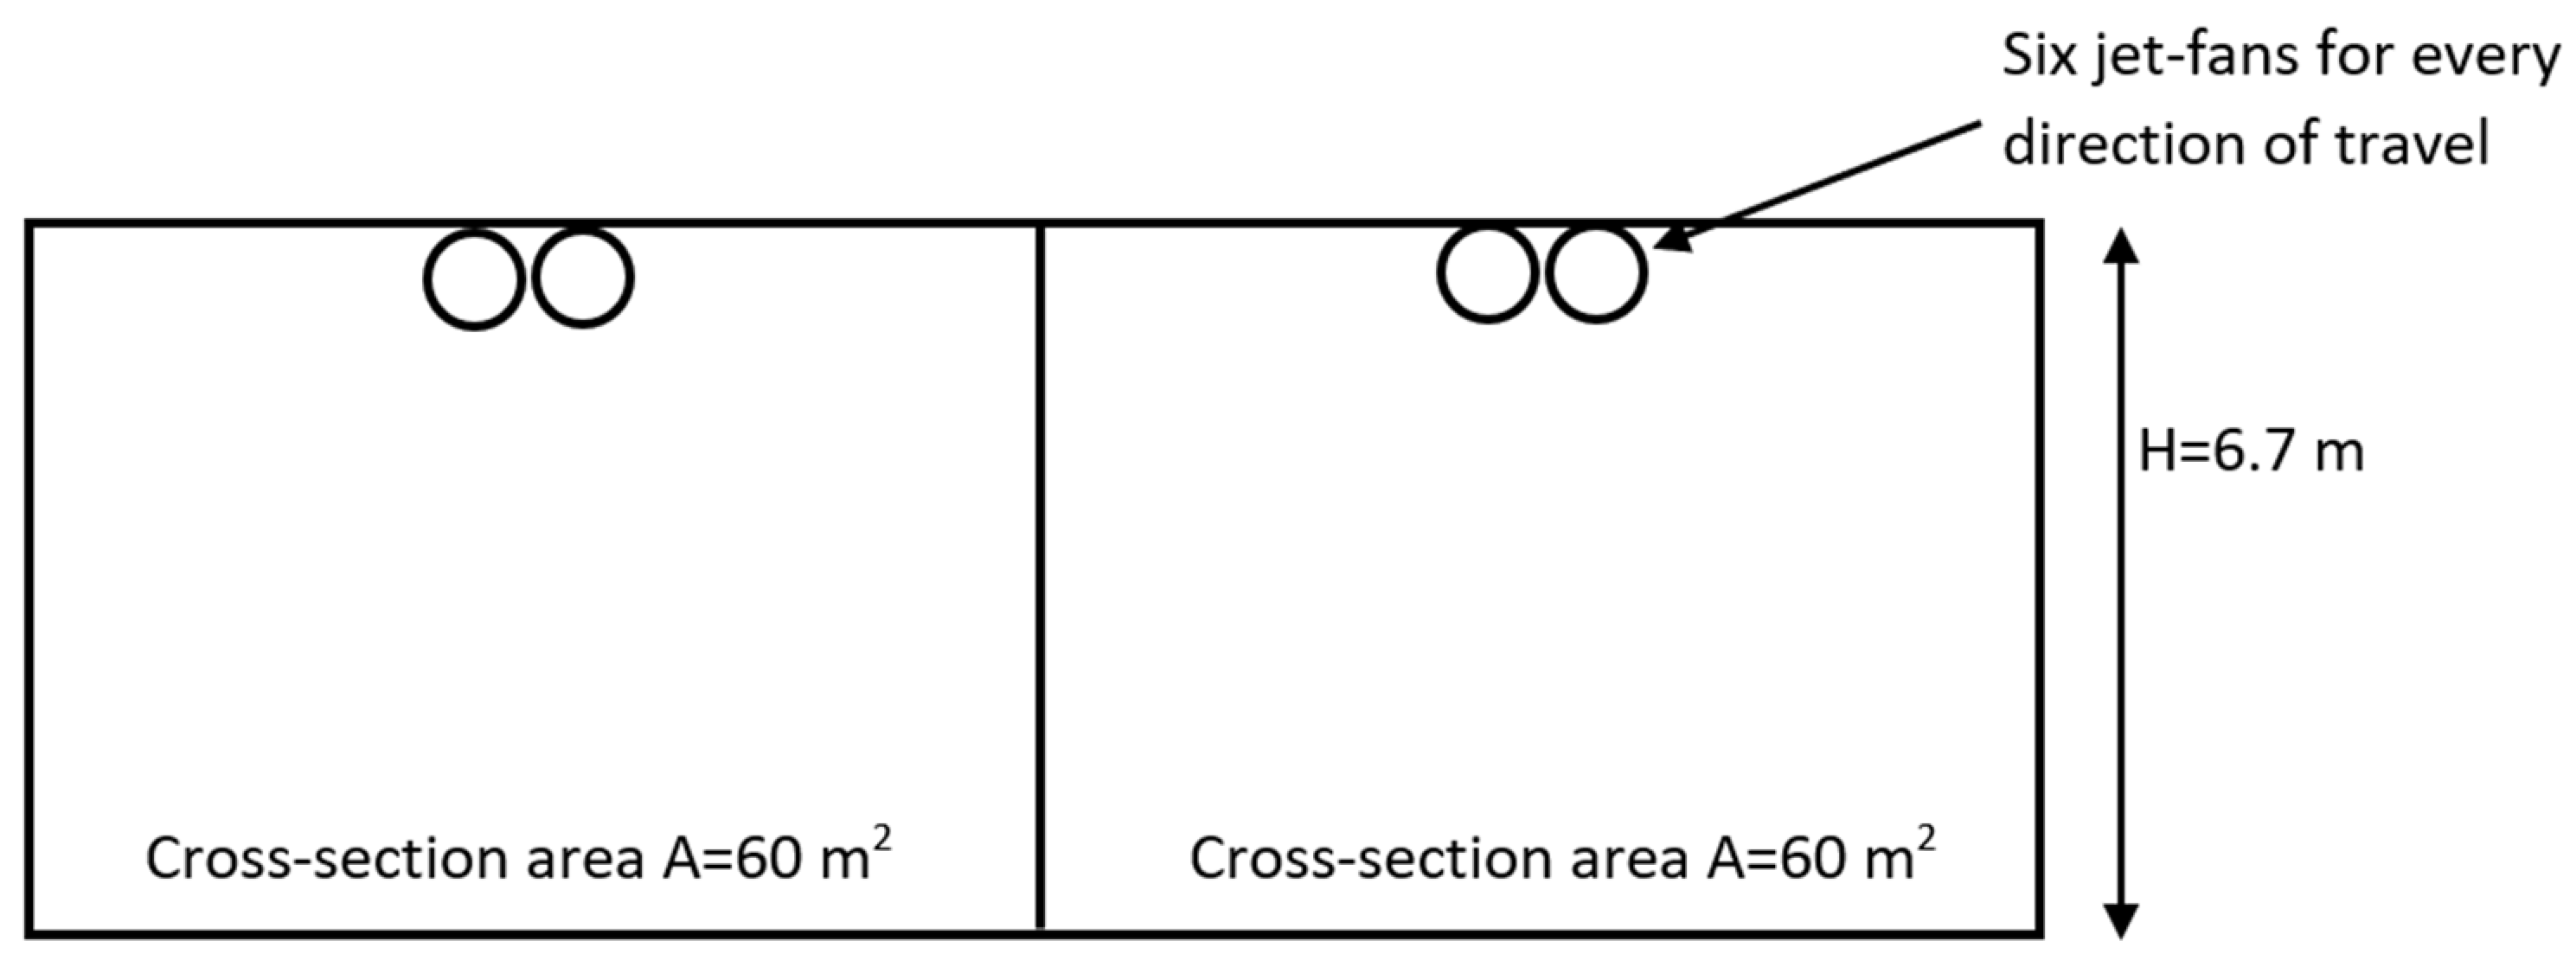
The studied tunnel is a one-way straight road tunnel with two traffic lanes, approximately 800 m long. Two identical tunnels are dedicated to the two driving directions of the vehicles. The tunnel section is rectangular with a height of 6.7 m with a cross-section area of approximately 60 m
2 (hydraulic diameter
Dhyd = 7.67 m) (
Figure 6). Six jet fans are placed on the roof of the tunnel in pairs. Their characteristics are as follows:
Diameter: 710 mm; thrust: 735 N; nominal power: 22 kW; efficiency: 0.6.
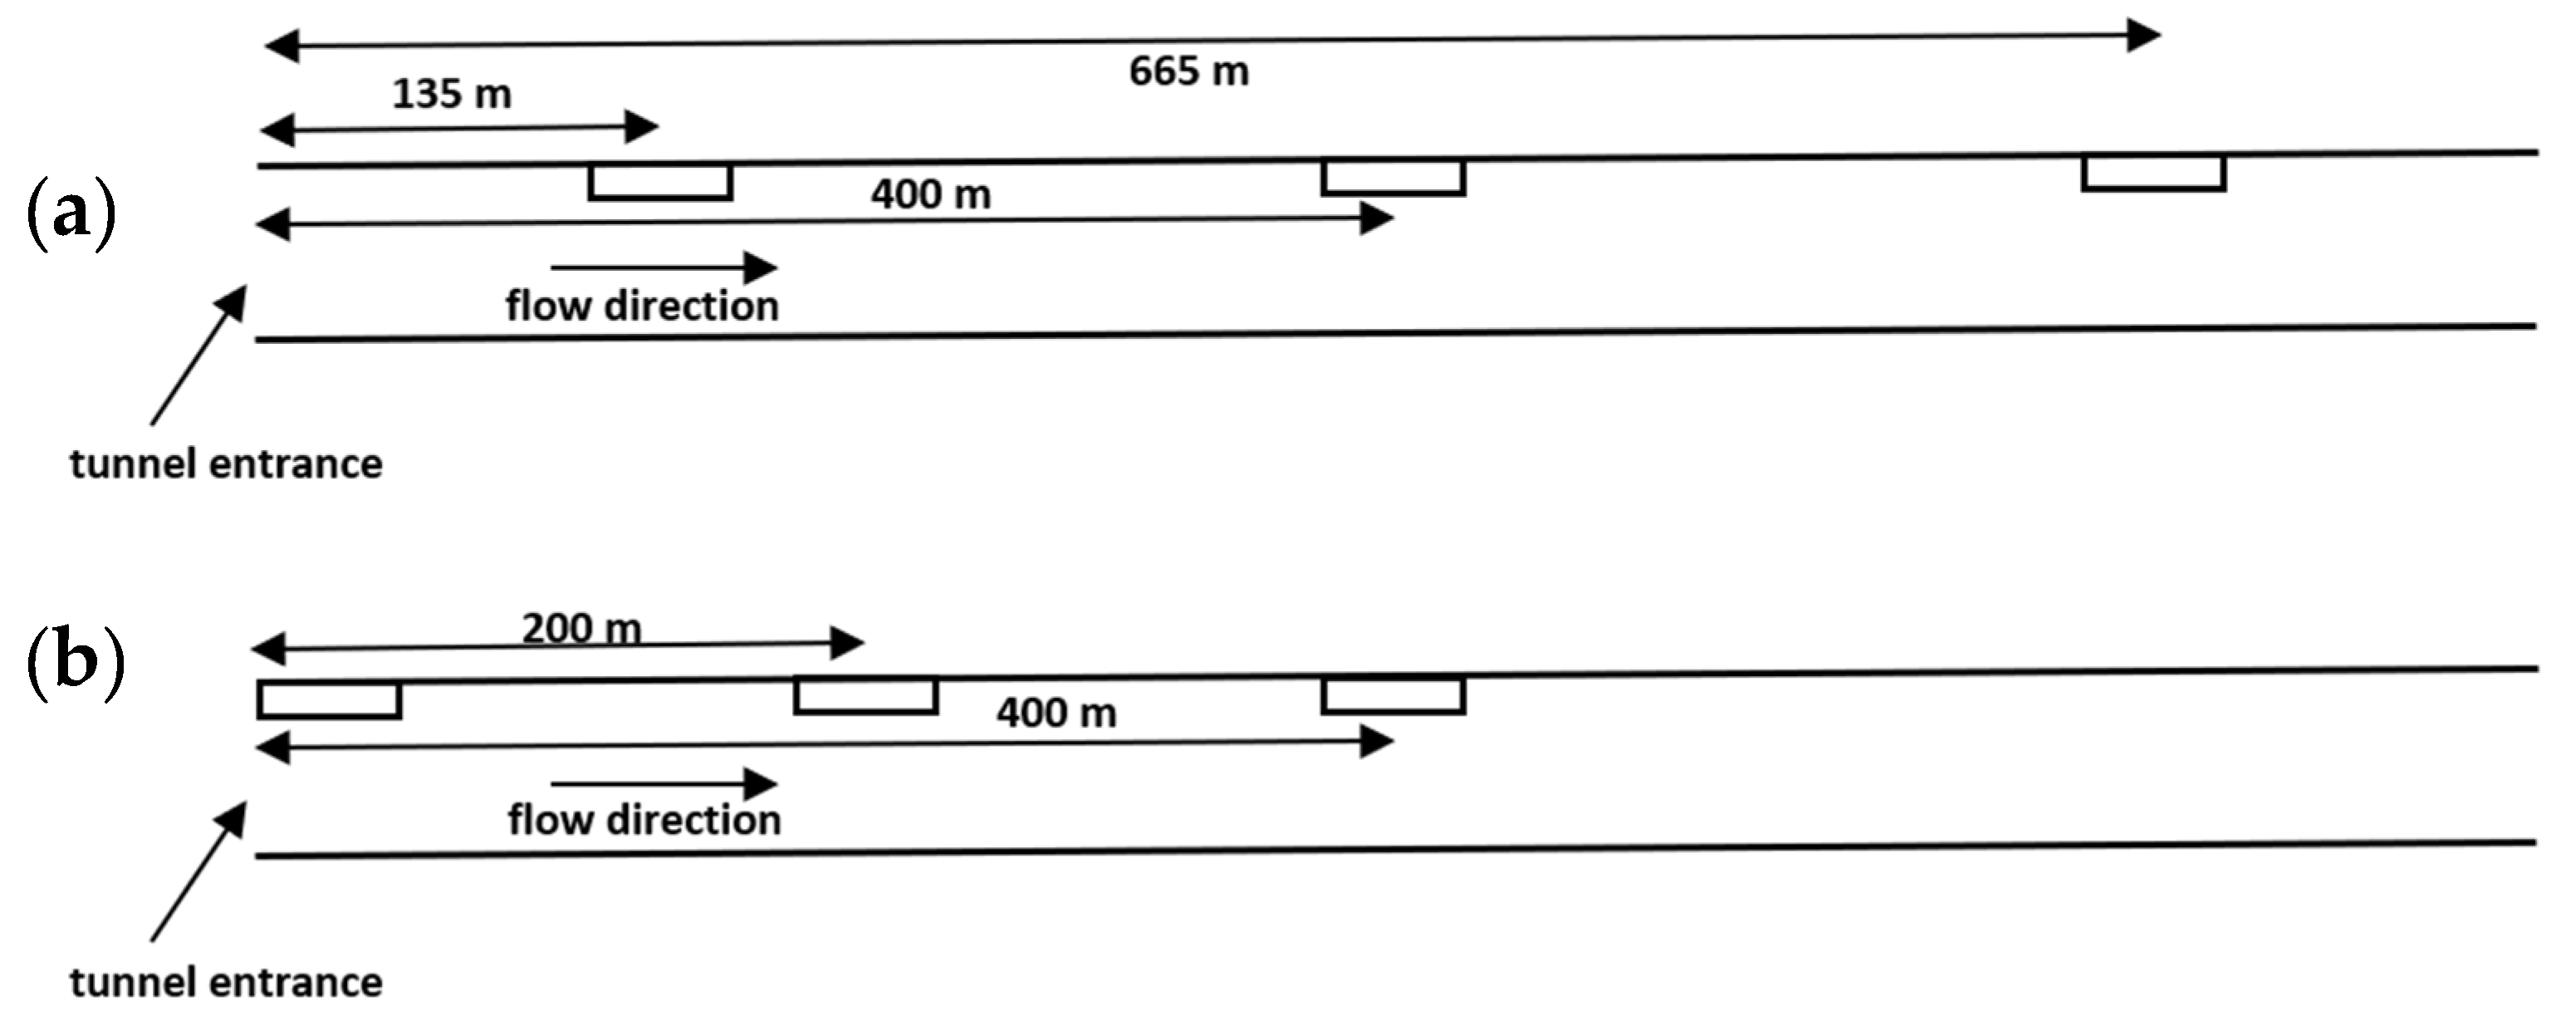
The pairs of fans are evenly distributed along the tunnel; they are positioned at progressive 135 m, 400 m, and 665 m from the tunnel entrance, i.e., at 1/6, 1/2, and 5/6 of the tunnel length, respectively (
Figure 7a).
As shown below, the ventilation is longitudinal and has the same direction as the vehicular flow. The side walls of the tunnel are made of concrete with a relatively low resistance to air movement (λ assumed to be approximately 0.025, also considering the presence of other obstacles along the walls).
To verify the effects of a large fire in the tunnel caused by a heavy vehicle transporting highly flammable materials (HRRmax = 300 MW), the analytical formulations illustrated in paragraph 3 (Equations (5)–(7), (9)–(12) and (14)–(22)) were used; different fire positions (Lfire = β∙Ltot) were adopted. The following precautionary assumptions were considered:
The initial evolution of the fire is represented with a parabola on the HRR time diagram, having a vertex on the origin and duration of the growth phase equal to 8 min;
The following standard characteristics were considered for air: specific mass ρ = 1.2 kg/m3; external temperature T = 293 K; specific heat Cp = 1009 J/(kg∙K);
The fans downstream of the fire, affected by fumes at high temperatures, capable of putting them out of use shortly after ignition, were not considered active;
The active fans work at their maximum power, i.e., when the fire is detected, they are activated at the maximum available power;
The heat dispersion towards the ground/rock surrounding the tunnel is not considered, nor is the reduction in the temperature of the fumes during the flow downstream of the fire.
For the particular case of a fire positioned at progressive 360 m (
β =
Lfire/
Ltot = 0.45), for example, the results in
Figure 8,
Figure 9 and
Figure 10 are obtained.
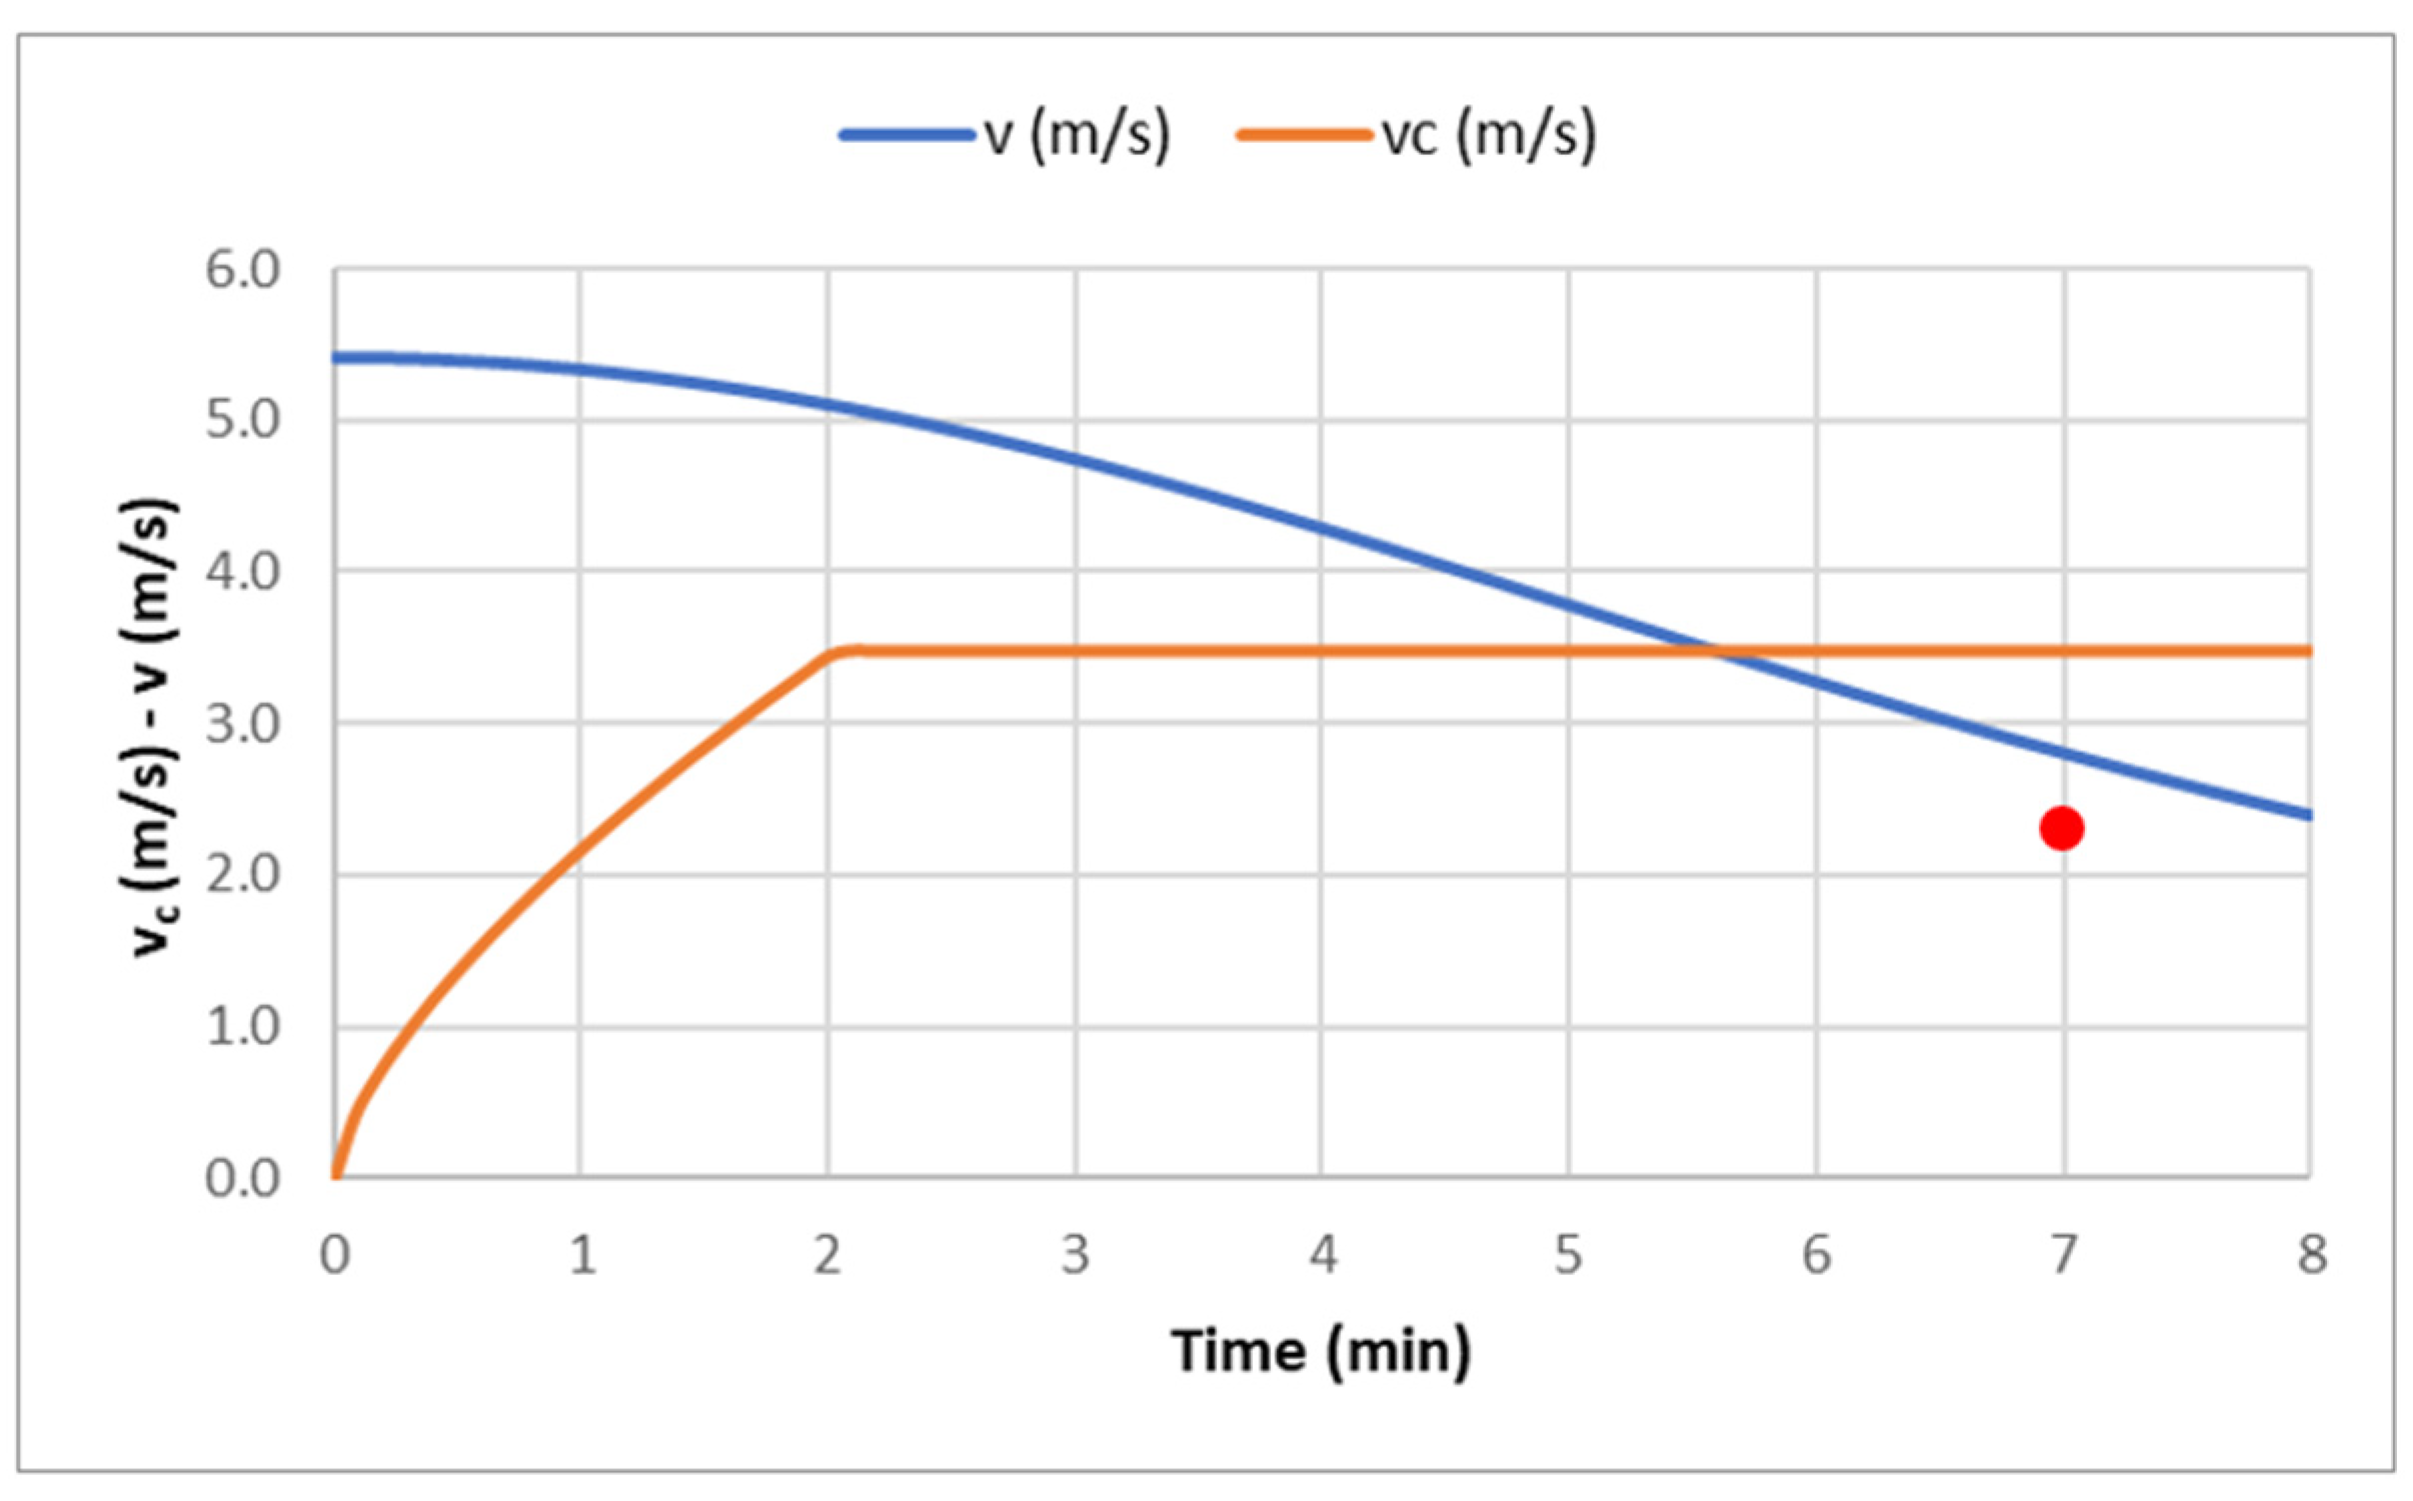
Figure 8 shows the trend of the air speed
v (upstream of the fire) and of the critical speed
vc, as the time t from ignition varies. In
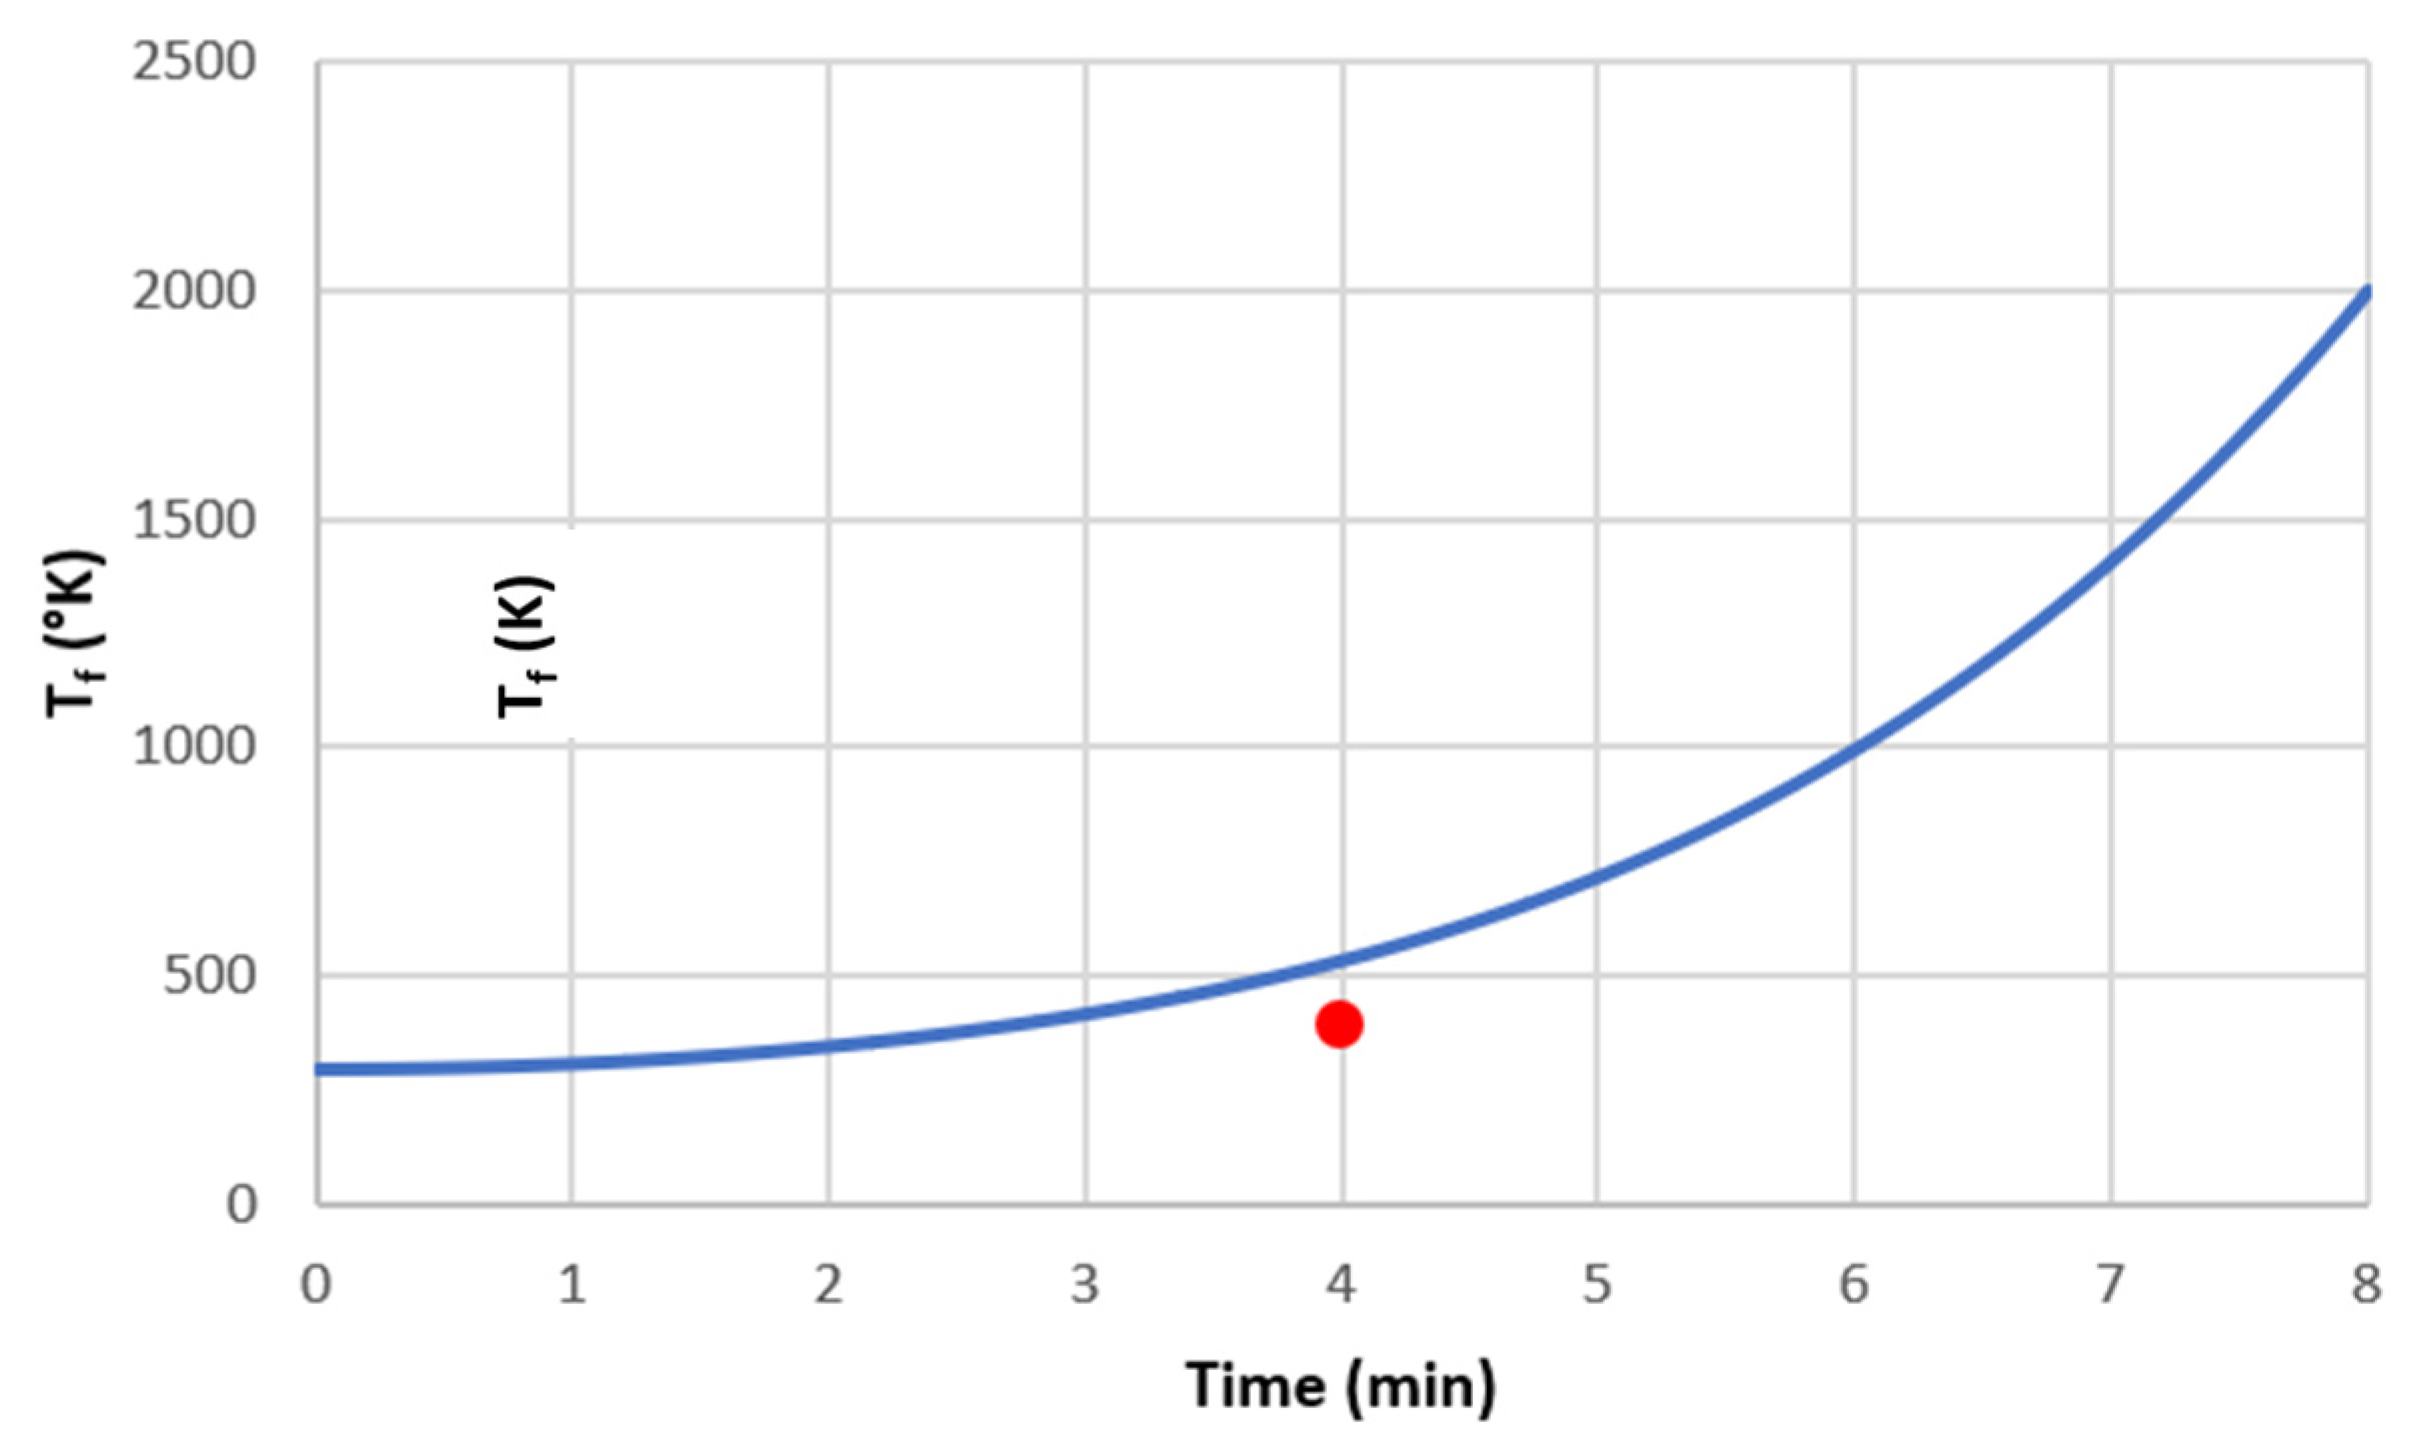
Figure 9 the temperature of the fumes
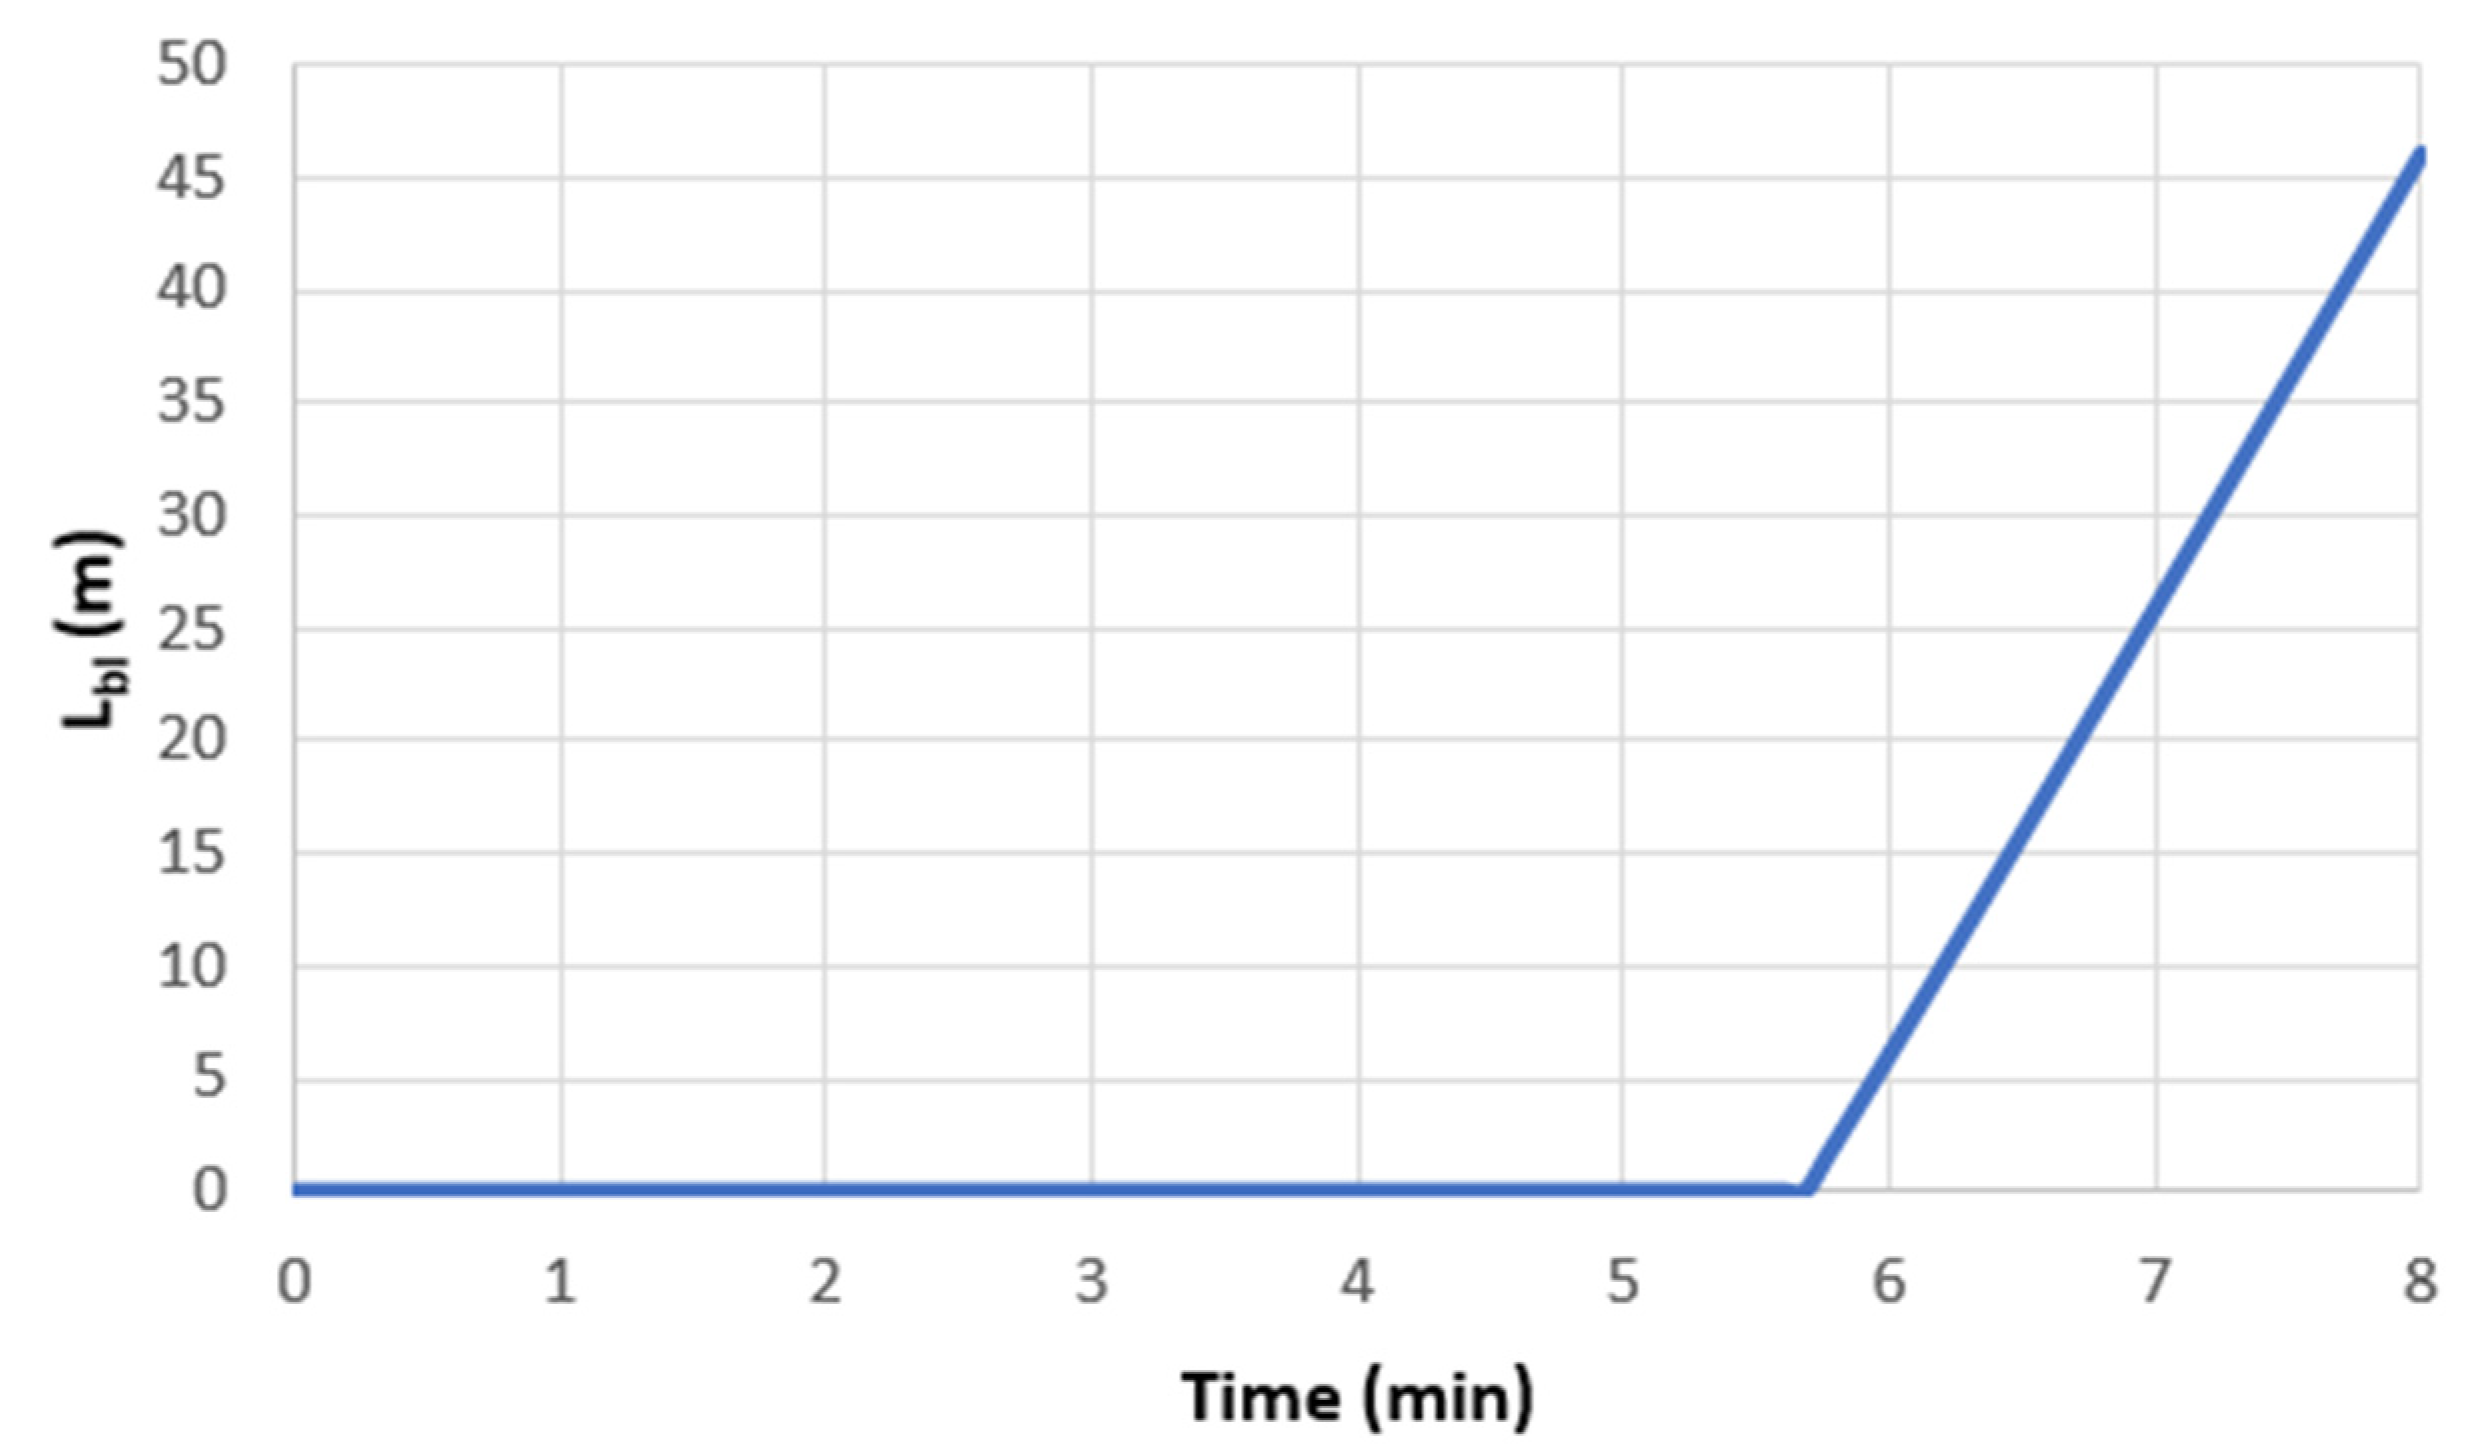
Tf over time, and in
Figure 10, the back-layering distance reached by the fumes in the opposite direction to the flow of air and vehicles over time.
In brief, the obtained results indicate that during the initial phase of increase in the thermal power of the fire, back-layering does not occur in the first 5.5 min from the ignition, and only subsequently do the fumes begin to move against the current towards the entrance to the tunnel, with an approximately constant speed equal to 0.30–0.35 m/s. The maximum distance reached by the fumes at the end of the initial phase (8 min from ignition) is approximately equal to 47 m.
After the first 2 min, the critical velocity remains constant and is equal to about 3.5 m/s; the air velocity upstream of the fire reduces over time from about 5.4 m/s (at ignition) to about 2.4 m/s at the end of the initial phase. With the second phase of the fire (full development) the main parameters of the fire (Tf, v, Lbl) stabilize; that is, they no longer vary with time.
In addition, a numerical model using the Ventsim software 5.4 (
https://ventsim.com/, accessed on 1 March 2023) [
29,
30] of the studied case was developed.
The only pair of fans present before the fire was inserted into the model at a distance of 135 m from the tunnel entrance. The degree of air friction on the tunnel surfaces was considered medium. A minimal dispersion of heat towards the lining and the surrounding rock was assumed in the calculation: this specific aspect is what most differentiates the developed numerical modeling from the proposed analytical procedure illustrated in the previous paragraphs.
The results of the calculation in terms of air speed and temperature over time from the start of the fire are represented through a colorimetric scale along the axis of the tunnel. Of particular interest is the analysis in a section upstream (340 m from the tunnel entrance) and downstream (380 m) of the fire. In the upstream section, an air speed of about 2.26 m/s is detected after 7 min from ignition (
Figure 8). In the one downstream, an air temperature of about 425 K is detected after 4 min from the start of the fire (
Figure 9). In both cases, numerical modeling produces slightly lower values than the proposed analytical calculation. The percentage difference between the values calculated with the proposed calculation procedure and numerical modeling is approximately 12% both for the air speed upstream of the fire (
v) and for the flue fumes temperature downstream of the fire (
Tf). The proposed simplified calculation procedure provides higher air speeds v and also higher fumes temperatures
Tf, compared to the more accurate numerical modeling. These differences can be traced back to some simplified hypotheses which are the basis of the developed calculation procedure: the lack of heat dispersion towards the rock surrounding the tunnel and the constancy of the mass flow rate of the air passing through the fire.
5. The Effects of the Different Positioning of the Fire inside the Tunnel on the Safety Conditions during the Evacuation Phase
To check the safety conditions of users with different fire positions inside the tunnel, the parameter β was varied from 0.05 to 0.95, using the proposed analytical approach illustrated in paragraph 3.
From the study, it was possible to detect, for each possible position of the fire in the tunnel, the air velocity (upstream of the fire), the critical speed above which the back-layering phenomenon does not occur, the velocity and the maximum distance reached by the fumes in the opposite direction to the vehicular flow, the temperature of the fumes.
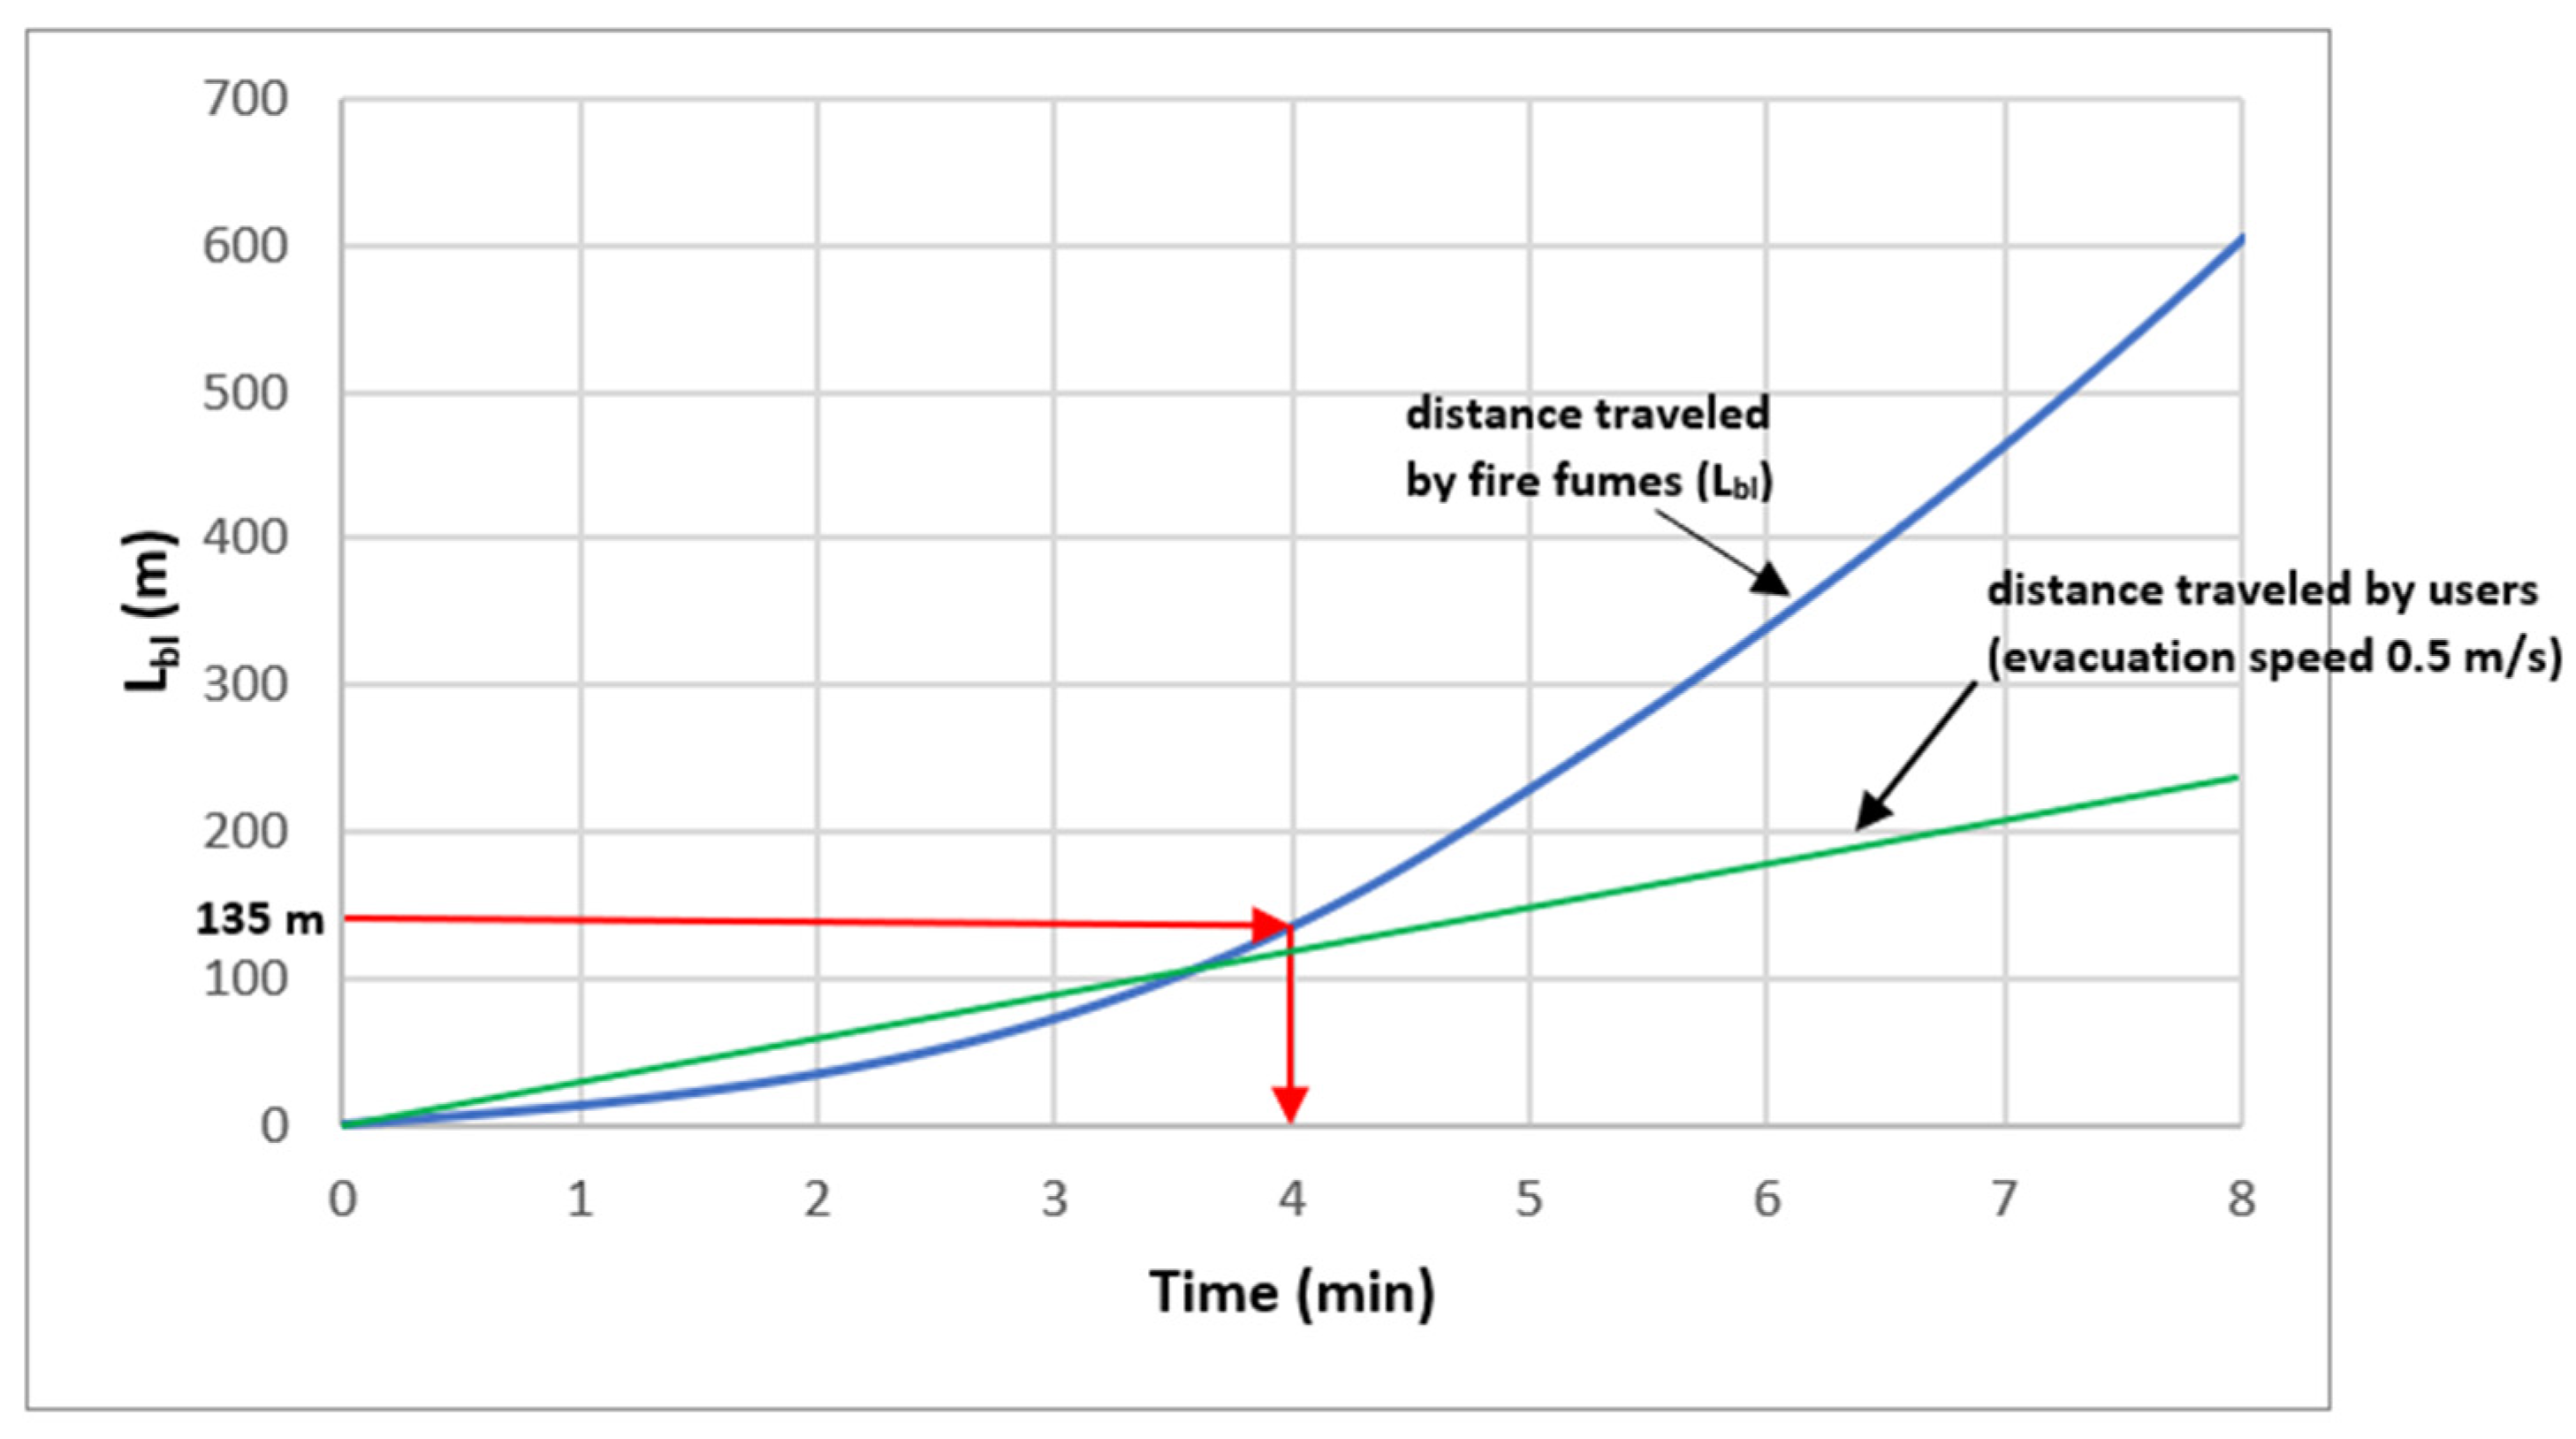
The calculation results were able to show how a fire located at a distance from the entrance less than the distance of the first pair of jet fans can have dramatic effects on people in the tunnel. In particular, in the studied case, if the fire is located at a distance of less than 135 m from the entrance, one should assume the absence of mechanical ventilation during the fire and, therefore, the dispersion of the fumes of the fire in the two directions (upstream and downstream) in equal measure (Equations (2) and (3)). In this case, a large fire would produce a quantity of fumes capable of saturating the entire section of the tunnel upstream of the ignition point in less than 4 min, and the maximum speed of the fumes could reach 1.3 m/s.
If, on the other hand, the fire is located at a distance from the entrance greater than that of the first pair of jet fans (β > 0.17), there would be the contribution of mechanical ventilation, capable of directing fumes mainly along the direction of travel of the vehicles, safeguarding the escape route upstream.
The back-layering phenomenon would occur only in the presence of a single pair of active fans (β between 0.17 and 0.5); with two pairs or three pairs of active fans (β > 0.5), the speed v of the air is such as to avoid back-layering and therefore allow all the fumes to follow the direction of the vehicular flow.
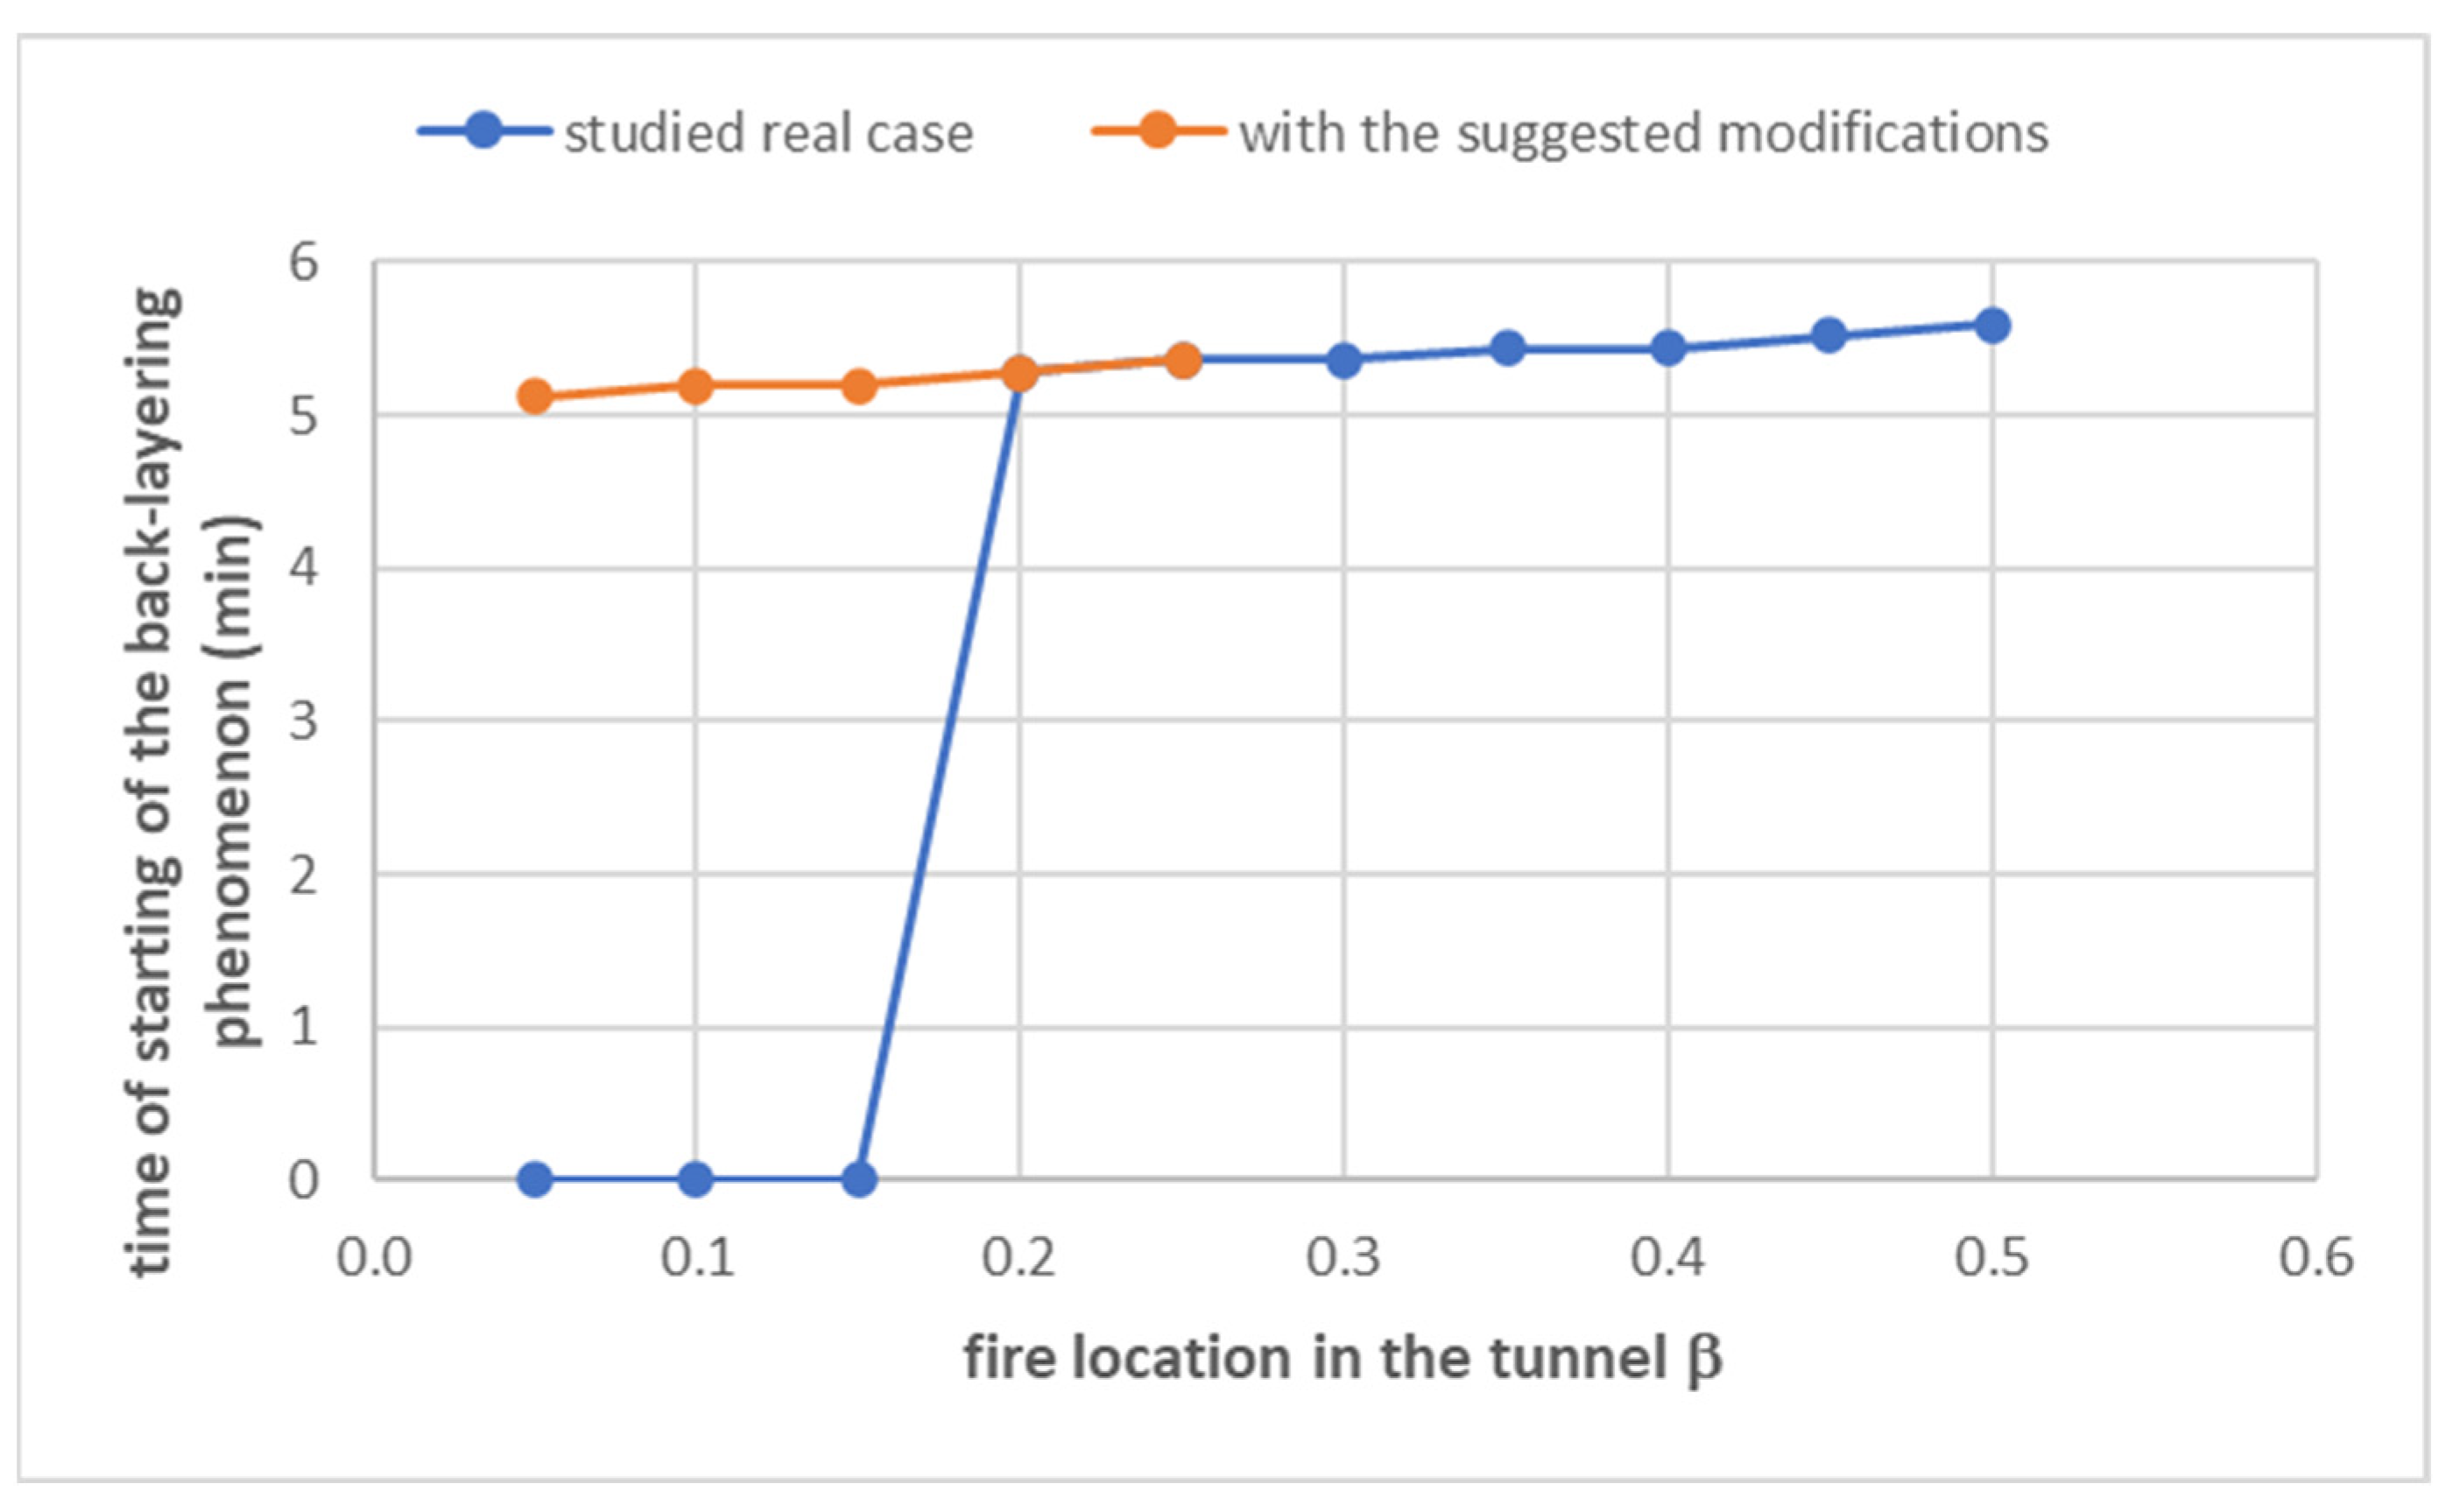
Figure 11 (studied real case) shows the time (from the start of the fire) of the beginning of the back-layering, depending on the parameter
β. This time is zero for
β < 0.17 and remains around 5 min when
β is between 0.17 and 0.5; however, it is well above the average time assumed for the start of the escape on foot (wake-up time) by tunnel users that are present upstream of the fire inside their vehicle. For large fires such as the one hypothesized (
HRRmax = 300 MW), the wake-up time is, in fact, estimated at 0.5–1.5 min [
11].
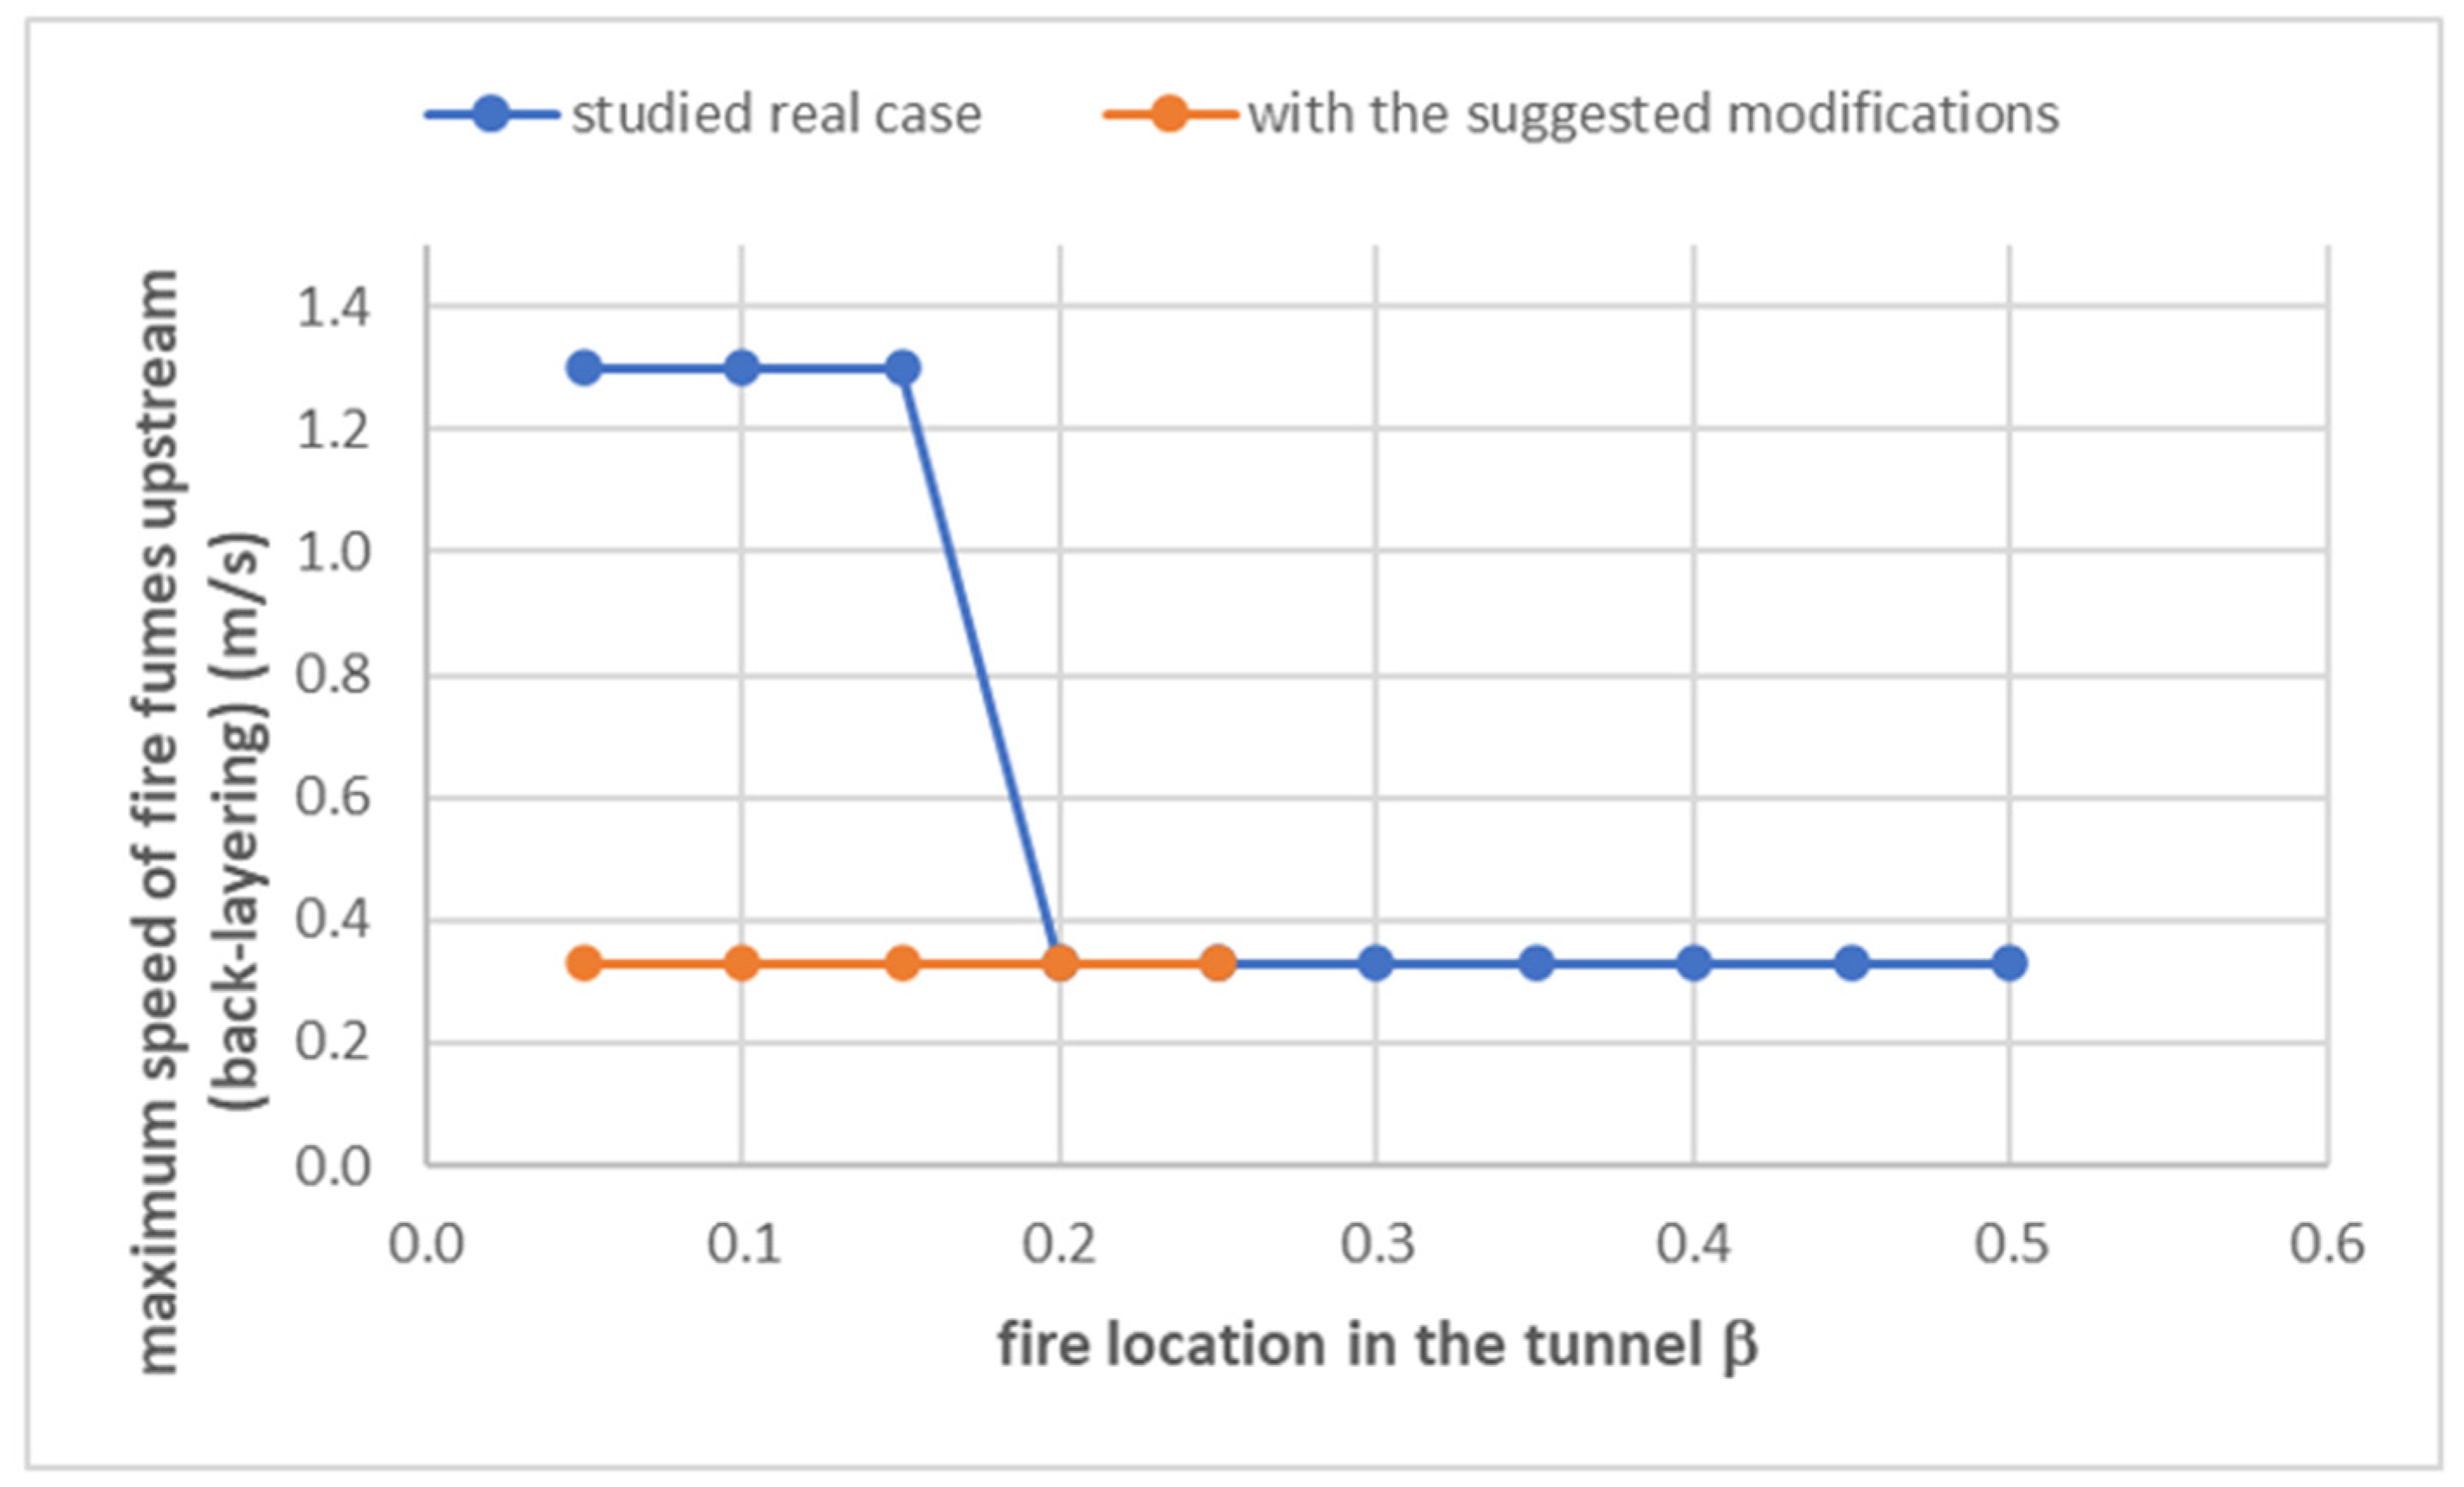
The speed of the counter-current fumes towards the entrance of the tunnel also plays a fundamental role in assessing the safety conditions during a fire. From
Figure 12, it is possible to evaluate this maximum speed as the position of the fire (
β) varies, only in cases where there is a fume flow in the opposite direction to the vehicular one. In actual conditions of the studied case, the maximum speed reaches 1.30 m/s for
β < 0.17 and is equal to about 0.34 m/s for the other values of
β (for
β > 0.5, the back-layering phenomenon does not occur). Considering that the average escape speed is generally estimated at 0.5–1 m/s, it is therefore particularly interesting to analyze the case of a fire located at a distance from the entrance of 135 m (
β = 0.17), with no fan assumed to be active because they are all positioned beyond the fire. In particular,
Figure 13 shows the trend of the distance reached by the fumes towards the entrance of the tunnel (
Lbl), as the time from the fire ignition varies.
It is possible to see from
Figure 13 how for a reduced escape speed of 0.5 m/s there could be a risk that users are reached by the fumes in the last meters of the escape route towards the entrance of the tunnel.
To eliminate this risk, a different arrangement of the three pairs of jet fans was hypothesized, concentrating them in the initial part of the tunnel, with the following distances from the entrance (
Figure 7b): 0 m, 200 m, 400 m.
With the new arrangement of the jet fans, a back-layering time of approximately 5 min is obtained, even for fires located near the entrance to the tunnel (case of “with the suggested modifications” in
Figure 11); the propagation speed of the counter-current fumes, moreover, never exceeds 0.34 m/s in all the cases in which the occurrence of the back-layering phenomenon is expected (
β ≤ 0.25) (
Figure 12). With this arrangement of the jet fans, without changing their technical characteristics, there would always be the possibility for users to save themselves without the risk of being reached by toxic fumes during a fire inside the tunnel.
Numerical modeling during the fire was also developed for this new hypothesis on the positioning of the jet fan pairs along the tunnel. The case of a fire at a distance of 360 m from the entrance of the tunnel was studied, with two pairs of active jet fans upstream of the fire. From the calculation, it was possible to detect how with this new arrangement the speed of the air upstream of the fire increases significantly compared to the case of the real arrangement of the jet fans, on average by about 40% during the entire period of development of the fire. This allows the air speed to be similar to the critical speed and to avoid or contain the back-layering phenomenon. The new arrangement of the jet fans also allows for a slight reduction in the temperature of the fumes in the section of the tunnel downstream of the fire: the numerical modeling made it possible to detect a decrease of about 5% of the temperature in the section located 20 m downstream of the fire, during the whole time of its development.
6. Conclusions
The fire of a passing vehicle is one of the main dangers present in road tunnels. During a fire, mechanical ventilation is crucial for both the safety of those already inside the tunnel and the secure entry of the rescue teams that have been called in to help.
A specific calculation procedure has been developed in order to obtain over time the speed of the air upstream of the fire, the distance reached by the fumes in the opposite direction to the airflow (back-layering phenomenon), the temperature of the fumes produced by the fire: the procedure is, therefore, able to describe the evolution of a fire in a one-way road tunnel in the presence of mechanical ventilation by jet fans.
The same procedure was then applied to a fire in an 800 m long one-way road tunnel in Northern Italy, ventilated with three pairs of jet fans. A numerical model was also developed to analyze the same fire in the tunnel, in order to compare the obtained results and to validate the proposed procedure.
Using the proposed procedure, it was possible to evaluate the consequences of a fire by changing its position inside the tunnel; risk situations related to the low speed of the air impressed by the jet fans when the fire is located at a small distance from the entrance were detected. Through the implemented calculation procedure, it was possible to verify how a simple different location of the three pairs of jet fans along the tunnel can make the fire not dangerous for the people present in the tunnel and intent on escaping towards the upstream entrance at the moment in which they perceive the dangerous situation.


