Article

Sand Sedimentation Mechanism in and around the Railway Culvert and Its Structural Optimization of Sediment Reduction

1
School of Railway Technology, Lanzhou Jiaotong University, Lanzhou 730070, China
2
Key Laboratory of Service Environment and Intelligent Operation & Maintenance of Rail Transit, Lanzhou Jiaotong University, Lanzhou 730070, China
3
Department of Mechanics, School of Civil Engineering and Mechanics, Lanzhou University, No. 222 South Tianshui Road, Lanzhou 730000, China
4
Key Laboratory of Mechanics on Disasters and Environment in Western China, The Ministry of Education of China, Lanzhou 730000, China
5
School of Mechanical Engineering, Xi’an Traffic Engineering Institute, Xi’an 710300, China
6
School of Mechanical Engineering, Lanzhou Jiaotong University, Lanzhou 730070, China
*
Author to whom correspondence should be addressed.
Appl. Sci. 2023, 13(9), 5585; https://doi.org/10.3390/app13095585
Submission received: 13 March 2023 / Revised: 20 April 2023 / Accepted: 27 April 2023 / Published: 30 April 2023

Abstract

:
A computational fluid dynamics (CFD) model of a railway culvert was established based on the two-phase flow theory to investigate wind-blown sand transport and sand sedimentation in and around a railway culvert. Then the flow field and the accumulation distribution of sand particles were analyzed through numerical simulation. The results show that the flow field around the culvert can be divided into deceleration, acceleration, and vortex areas. The curve of the horizontal wind speed along the central axis of the culvert had a W shape, indicating a significant increase in the wind speed inside the culvert. A large amount of sand accumulated at the culvert inlet because of the wing walls. The sand volume fraction in the culvert decreased with an increase in the inflow velocity, and there was almost no sand sedimentation when the inflow velocity was greater than 20 m/s. Three reasons for the sand accumulation in the culvert included the deflection by the wing walls, subgrade blocking, and a low inflow velocity. Based on the simulation results, straight and protruding culverts were designed to minimize sand accumulation. The straight culvert exhibited better performance than the protruding culvert and is recommended for use in railways. This work can provide theoretical support for designing railway culverts that minimize or prevent wind-blown sand accumulation.

1. Introduction

Several railways have been constructed in the deserts of Northwest China as part of the Belt and Road initiative [1]. Deserts and Gobi landforms are common in this region and are characterized by extensive wind-blown sand accumulation, threatening the safety of railway operations and facilities. Therefore, international researchers have focused on train operation safety and railway track maintenance in sandy environments [2,3,4,5,6]. Numerous studies were conducted on the prevention and control of railway wind-blown sand disasters, and many practical ideas and measures for sand prevention were put forward. Based on the concept of CWE, the prevention and control of wind-blown sand along the railway were deeply analyzed [7,8,9]. Then, the sand bed collision, sand transport and environmental characteristics in Gobi area were discussed from different angles by means of numerical simulation and wind tunnel experiment [10,11,12]. Meanwhile, the characteristics of wind-blown sand flow field, optimization design and protection effect of sand barriers were studied [13,14,15,16]. And starting from the characteristics of subgrade sand accumulation, the problem of sand disasters behind railway windbreak wall was investigated [17]. Overall, this kind of research focuses in this field is mainly on the protection of sand disaster along the railway, and the serious consequences of sand accumulation around the railway culvert are ignored.
Culverts are used to provide a passage for people, livestock, and vehicles to cross the railway, but they are adversely affected by sand accumulation in the culvert. Sand sedimentation hinders or prevents traffic through the culvert [18,19], as shown in Figure 1. Therefore, in-depth research is required on the sand sedimentation mechanism and formation reasons around railway and in culverts. Some studies have found that wind speed and direction [20], diversion dikes, and wing walls can change the airflow and minimize or prevent sand sedimentation at the culvert inlet. Li et al. studied the sand sedimentation mechanism around a slab culvert of the Jitong Railway in China using field measurements and pointed out that diversion dikes reduced the wind speed at the culvert inlet, minimizing sand [21]. Shi et al. used computational fluid dynamics simulation to analyze the wind-blown sand flow around the culvert and found erosion occurred near the wing walls at the culvert inlet, and the airflow fluctuation index decreased, increased, and decreased [22]. Yang et al. researched the wind-blown sand flow field around the culvert of the Qinghai-Tibet Railway and observed that the attenuation of the airflow caused sand sedimentation at the culvert inlet [23].
Above studies on the wind-blown sand flow near railway culverts have focused on the sedimentation and the reasons for sand deposition in front of the culvert inlet. However, few studies investigated the sand distribution inside the railway culvert. Most importantly, there few studies have focused on the optimization of the culvert structure to prevent sand sedimentation inside the culvert.
This study investigates the wind-blown sand flow based on the two-phase flow theory and establishes a CFD simulation model of the sand movement around the railway culvert. The sand sedimentation mechanism is analyzed according to the transport characteristics of wind-blown sand around the culvert. Two culvert designs are proposed, and their ability to minimize sand accumulation is evaluated. The results provide insights into designing railway culverts that prevent wind-blown sand accumulation.

2. Numerical Model

2.1. Theoretical Equations

The Euler two-fluid model was used to describe the wind-blown sand movement near the ground. It regards air and sand as the two phases of a continuous medium. The continuity equations and momentum equations of the air phase and sand phase can be expressed as [24]:
t α g ρ g + α g ρ g ν g = 0 ,
t α g ρ g u g + α g ρ g u g u g = α g p + τ g + α g ρ g g + f s g ,
t α s ρ s + α s ρ s ν s = 0 ,
t α s ρ s u s + α s ρ s u s u s = α s p p s + τ s + α s ρ s g + f s g ,
where t is the time, αg and αs are the volume fractions of the air and sand phases, respectively, where αg + αs = 1, and αs is 1.5%; ρg and ρs are the density of the air and sand phases, respectively, ρg = 0.752 kg/m3, and ρs = 2650 kg/m3; vg and vs are the velocity vectors of the air and sand phases; ug and us are the velocities of the air and sand phases; τg and τs are the surface stress tensors of the air and sand phases; p is the pressure of an ideal fluid; ps is the solid pressure of the sand phase; g is the acceleration of gravity (taken as −9.81 m/s²). fsg is the interaction force between the air and sand phases:
f s g = 3 C D α s α s ρ g 4 d u r u r α g 2.65
where, CD is the drag coefficient; d = 0.15 mm is the equivalent diameter of the sand particles; ur is the relative velocity between the air and sand phases.
A fluid flowing near the ground or over irregular terrain produces complex eddy currents, and multiple eddy currents form turbulence. Reynolds Average Navier-Stokes method (RANS), the most widely used in engineering, is adopted in the turbulence model in this paper. RANS could not only simulate fluid movement in complex geometric shapes, but also has a fast calculation speed and accurate simulation results, which provides a powerful tool for us to research the wind-blown sand disasters along the railway [13,14,17].The wind-blown sand two-phase flow can be described by the turbulent transport equations of the standard k-ε model [24]:
t α g ρ g k + x i α g ρ g k u g i = x j α g μ + μ t σ k k x j + α g G k + α g ρ g σ k + S d k ,
t α g ρ g ε + x i α g ρ g ε u g i = x j α g μ + μ t σ ε ε x j + α g ε k C 1 G k - C 2 ρ g ε + S d ε ,
where, k and ε are the turbulent kinetic energy and turbulent dissipation rate, respectively; ugi and ugj are the velocity components in the x-and y-directions; σk and σε are the Prandtl constant corresponding to the turbulent kinetic energy and turbulent dissipation rate (1.0 and 1.3, respectively); Gk denotes the turbulent kinetic energy caused by the average velocity gradient; S d k and S d ε are the turbulent kinetic energy and turbulent dissipation rate caused by particle motion; μt is the turbulent viscosity:
μ t = ρ g C μ k 2 ε
the following values are used as model constants: C1 = 1.44, C2 = 1.92 and Cμ = 0.09.

2.2. Railway Culvert Model

A railway culvert is composed of the culvert body, wing walls, and end faces. The culvert body is typically rectangular, the wing walls are isosceles trapezoid (top view), and the end faces are vertical skirt. The culvert structure and size in desert areas conform to the TB 10002-2017 Code for Design of Railway Bridges and Culverts [25]. A three-dimensional model of the railway culvert was established. The dimensions were 13.6 m (length) × 3 m (width) × 3 m (height), the subgrade was 22.7 m (length) × 36 m (width) × 6 m (height), and the slope was 1:1.75. The simulation domain was 142.7 m long, 36 m wide and 60 m high. The culvert was located 40 m from the start of the simulation domain to ensure a sufficient distance for wind-blown sand accumulation. The simulation domain, subgrade, and culvert model are shown in Figure 2.
The unstructured grids with tetra/mixed mesh type were used because of the complex structure and irregular shape of the inlet and outlet of the culvert model. The grids of the culvert inlet and outlet and the track were locally encrypted, and the number of grids was about 3.3 million. The Fluent software was chosen to simulate the wind-blown sand flow around the culvert. The turbulence intensity at the culvert inlet was 5%. The boundary conditions are shown in Figure 2a. A program was used to write to describe the logarithmic wind speed profile at the domain inlet:
u y = u * κ ln y y 0 ,
where, uy represents the horizontal wind speed at height y, u* represents the friction wind speed, κ is the Karman constant, 0.41, and y0 = 5.44 × 10⁻⁶ m is the surface roughness [10].
In addition, the Scalable Wall Functions are used near the wall of the flow field, the control equations and the boundary and initial conditions were discretized by the finite volume method, the SIMPLE pressure-velocity coupling algorithm is used to solve the linear equations to obtain the solution of the flow field [26]. The flux calculation adopts the Second Order Upwind format, which can retain second-order accuracy.

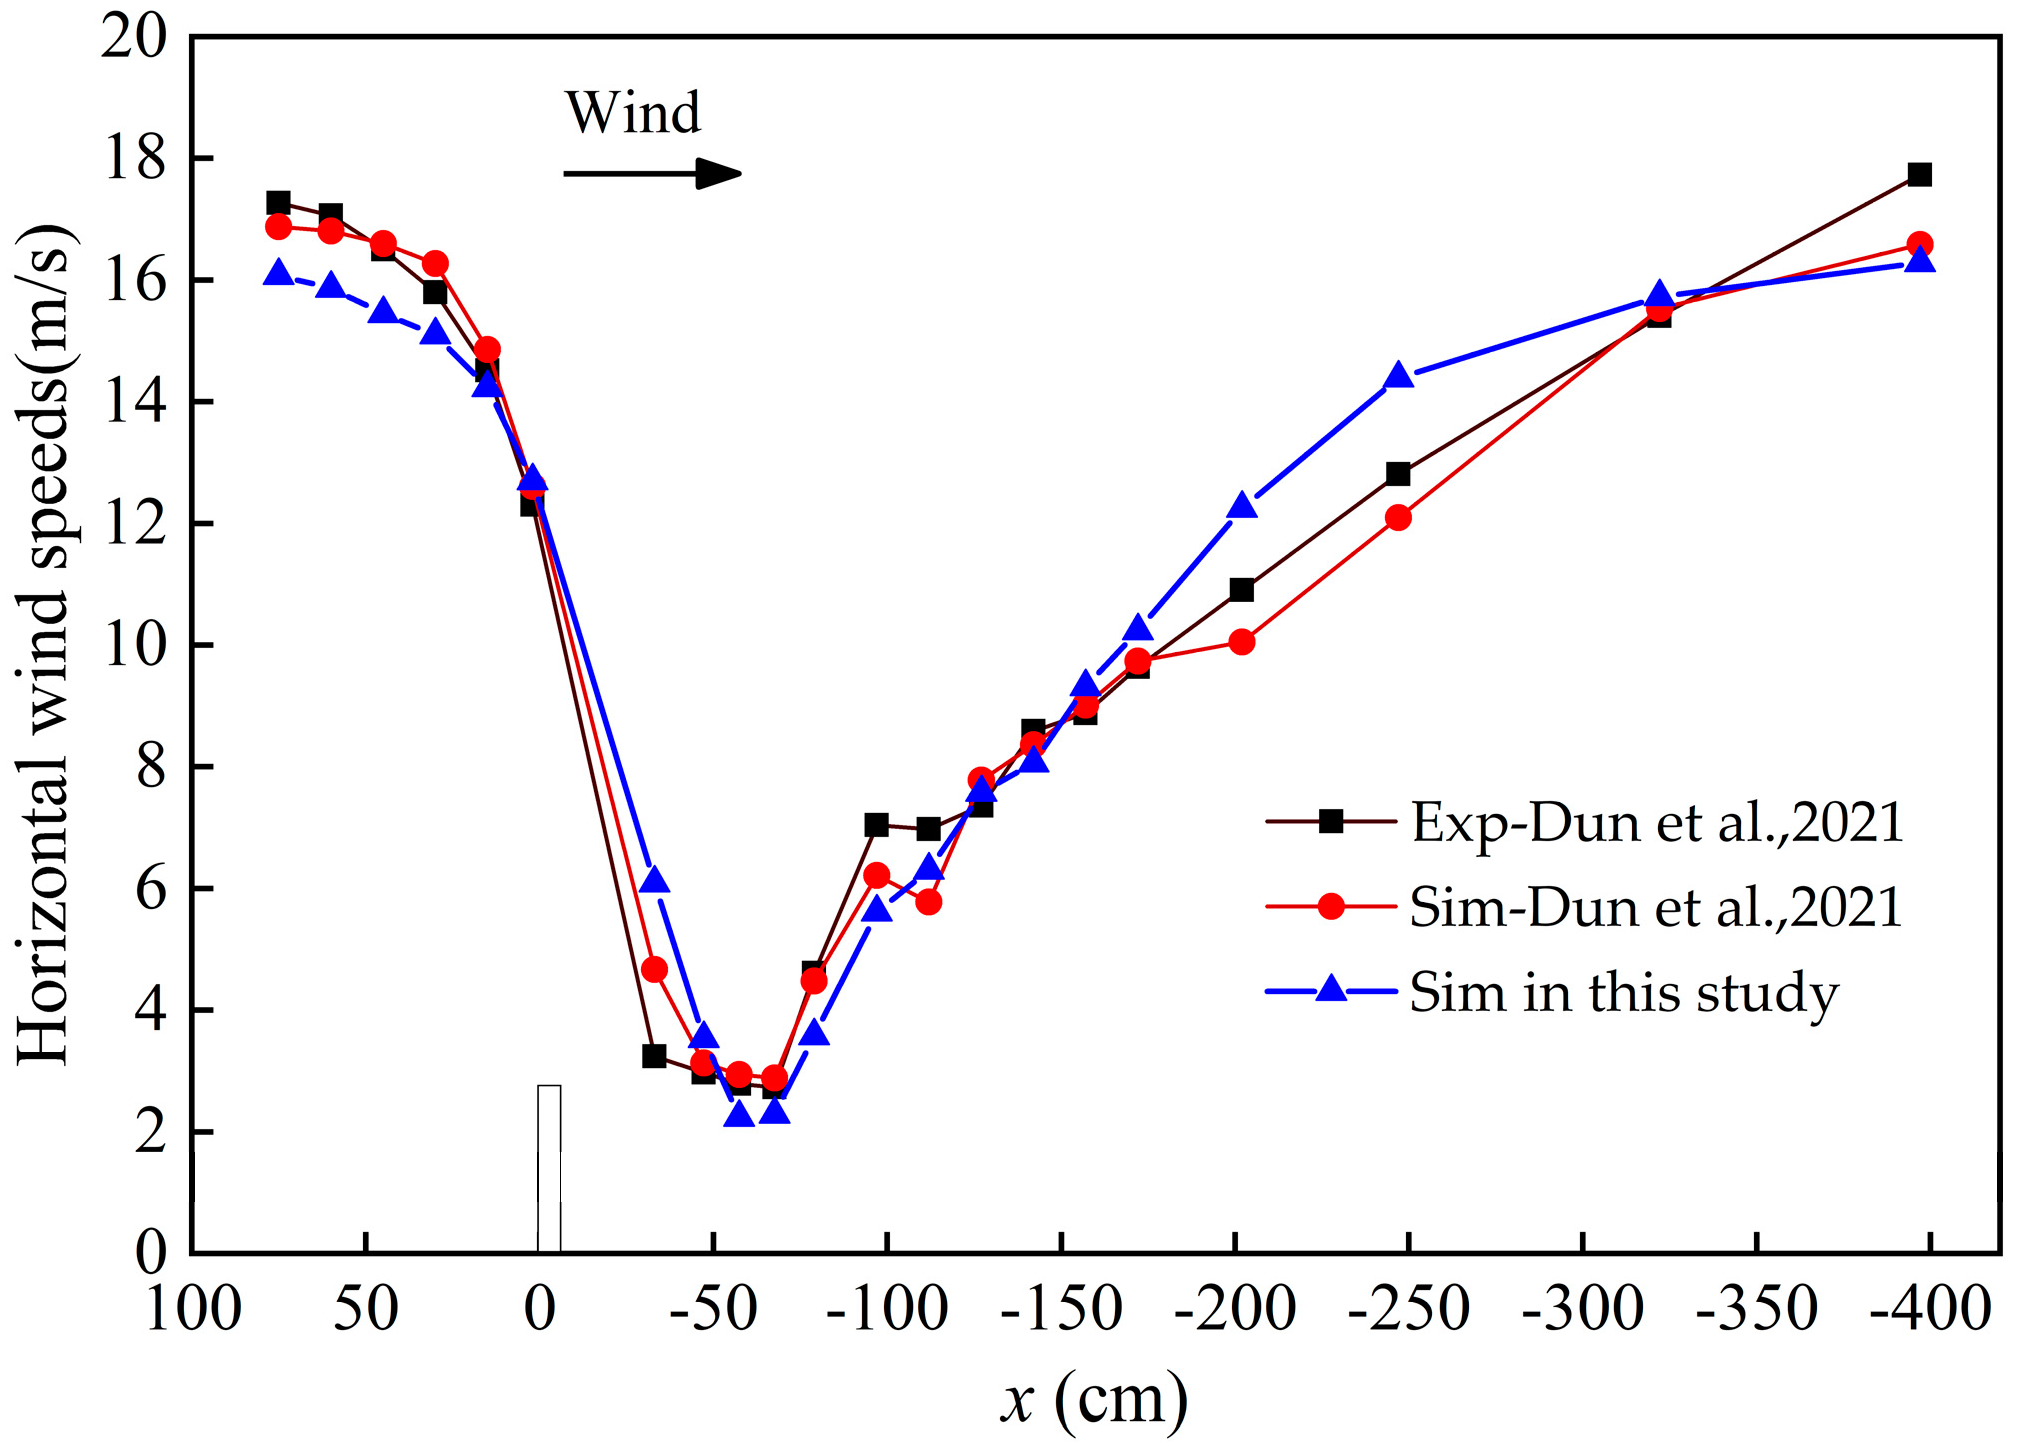
2.3. Model Verification

A calculation case of three-dimensional flow field of convex subgrade with wind-break walls was established, which was the same as the wind tunnel experiment in Dun et al. [27] to verify the accuracy of the parameter settings in the numerical model of the culvert. The horizontal wind speed around the subgrade at a height of 15 cm when the inflow wind speed is 20 m/s was compared and analyzed. As shown in Figure 3, the numerical simulation in this study was basically consistent with the experimental and simulation results in [27], indicating that the parameter settings of the numerical simulation were reliable. The simulation calculation of railway culvert was carried out with the same parameter setting.

3. Results

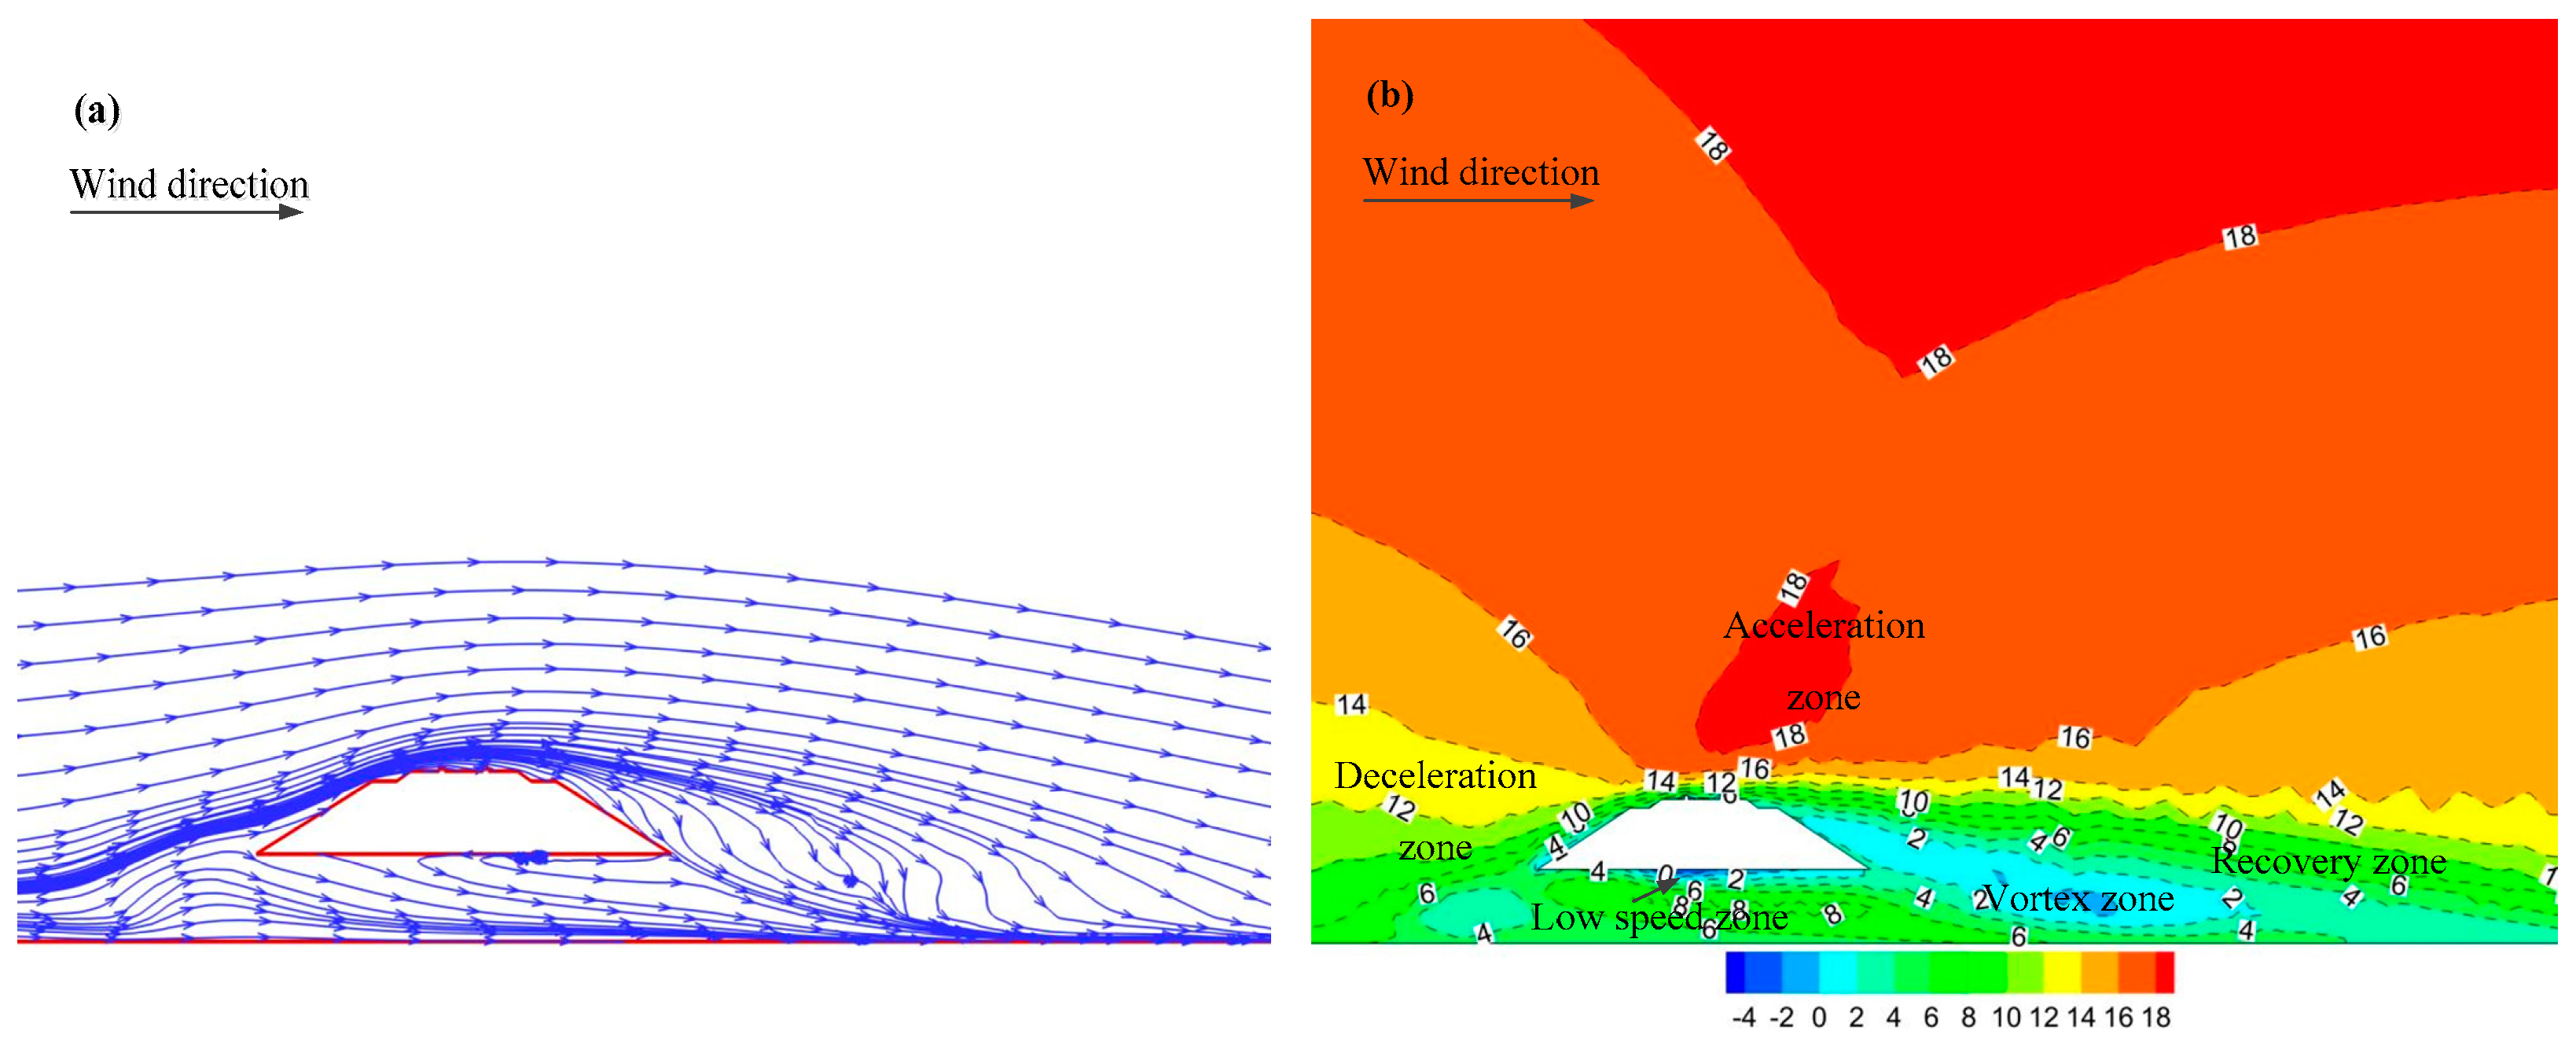
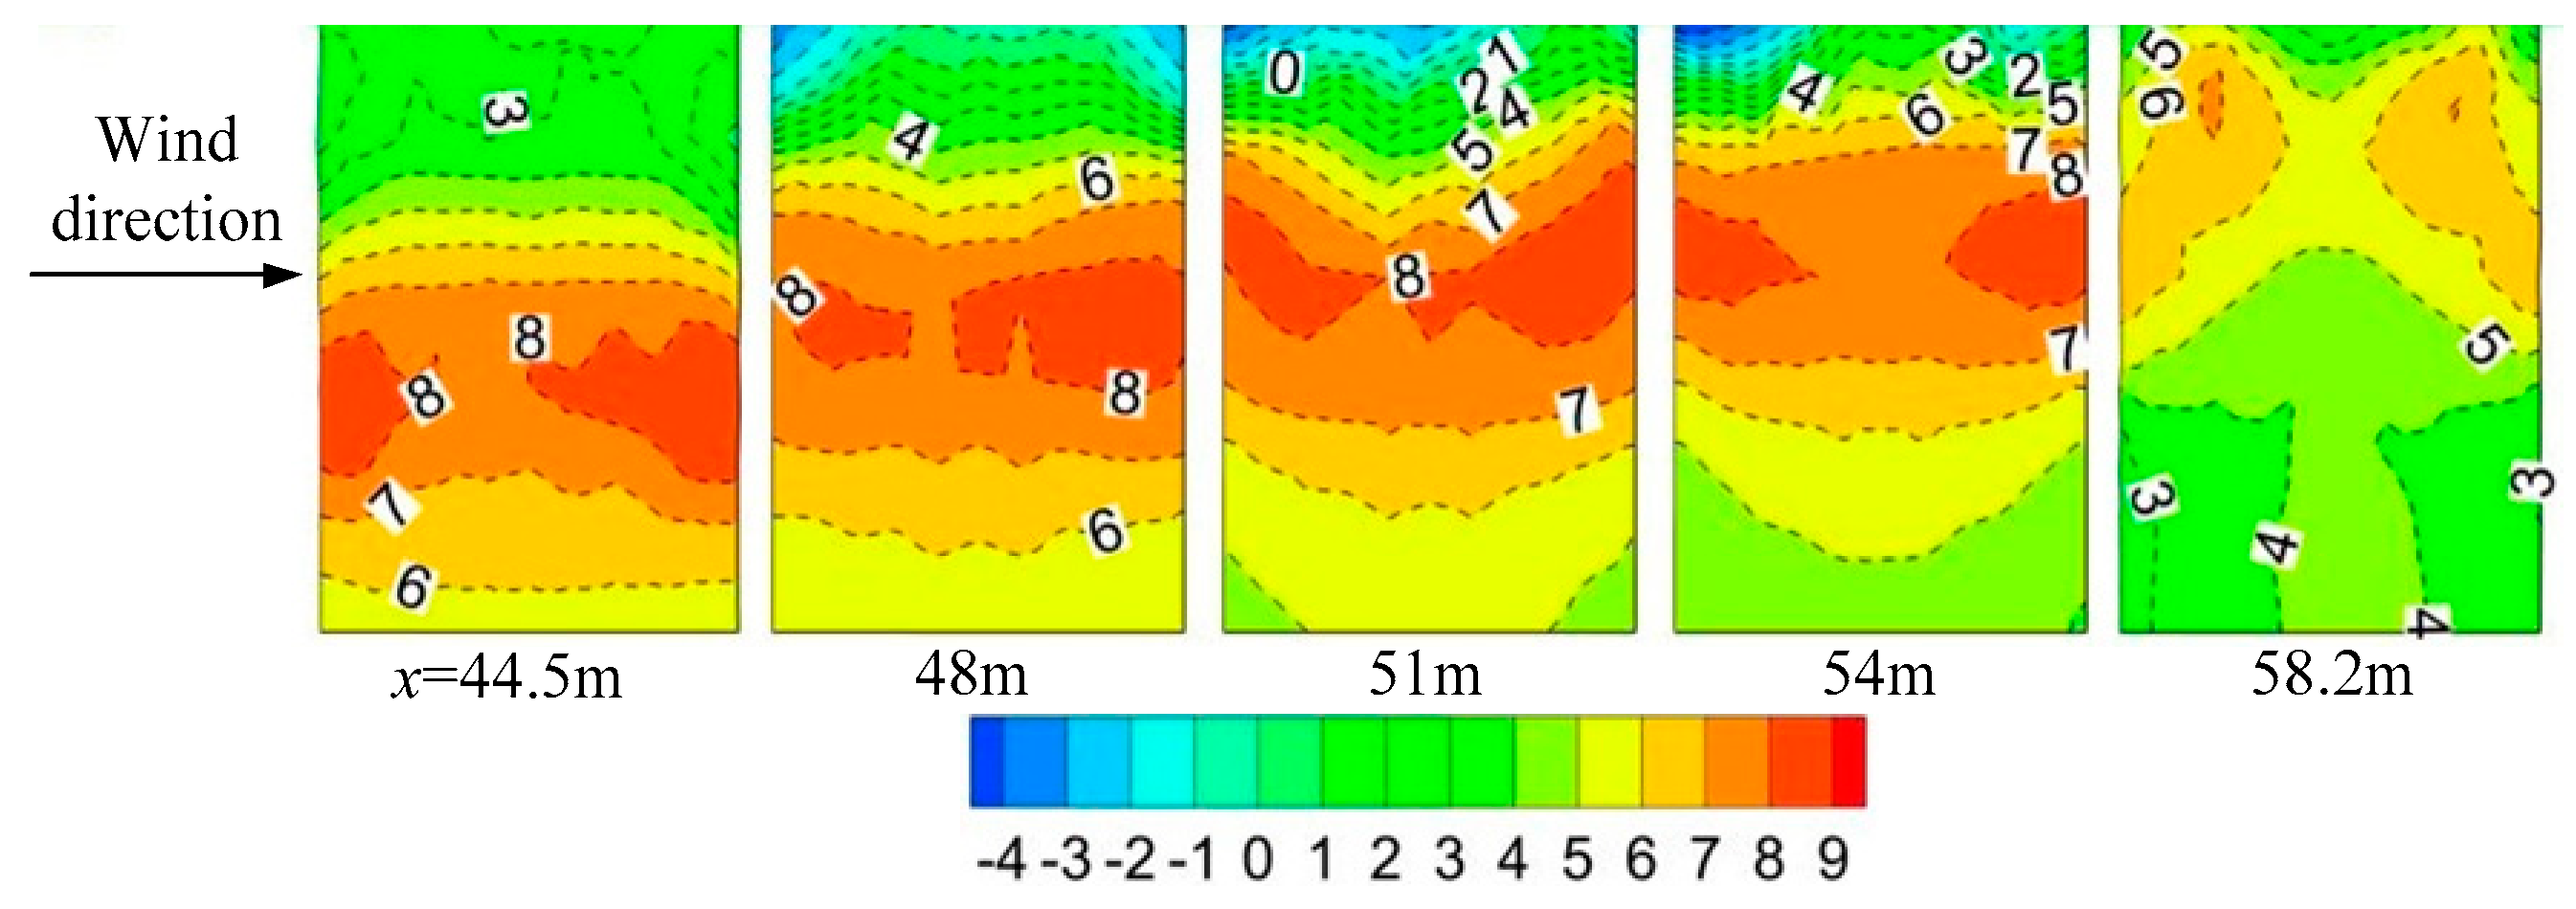
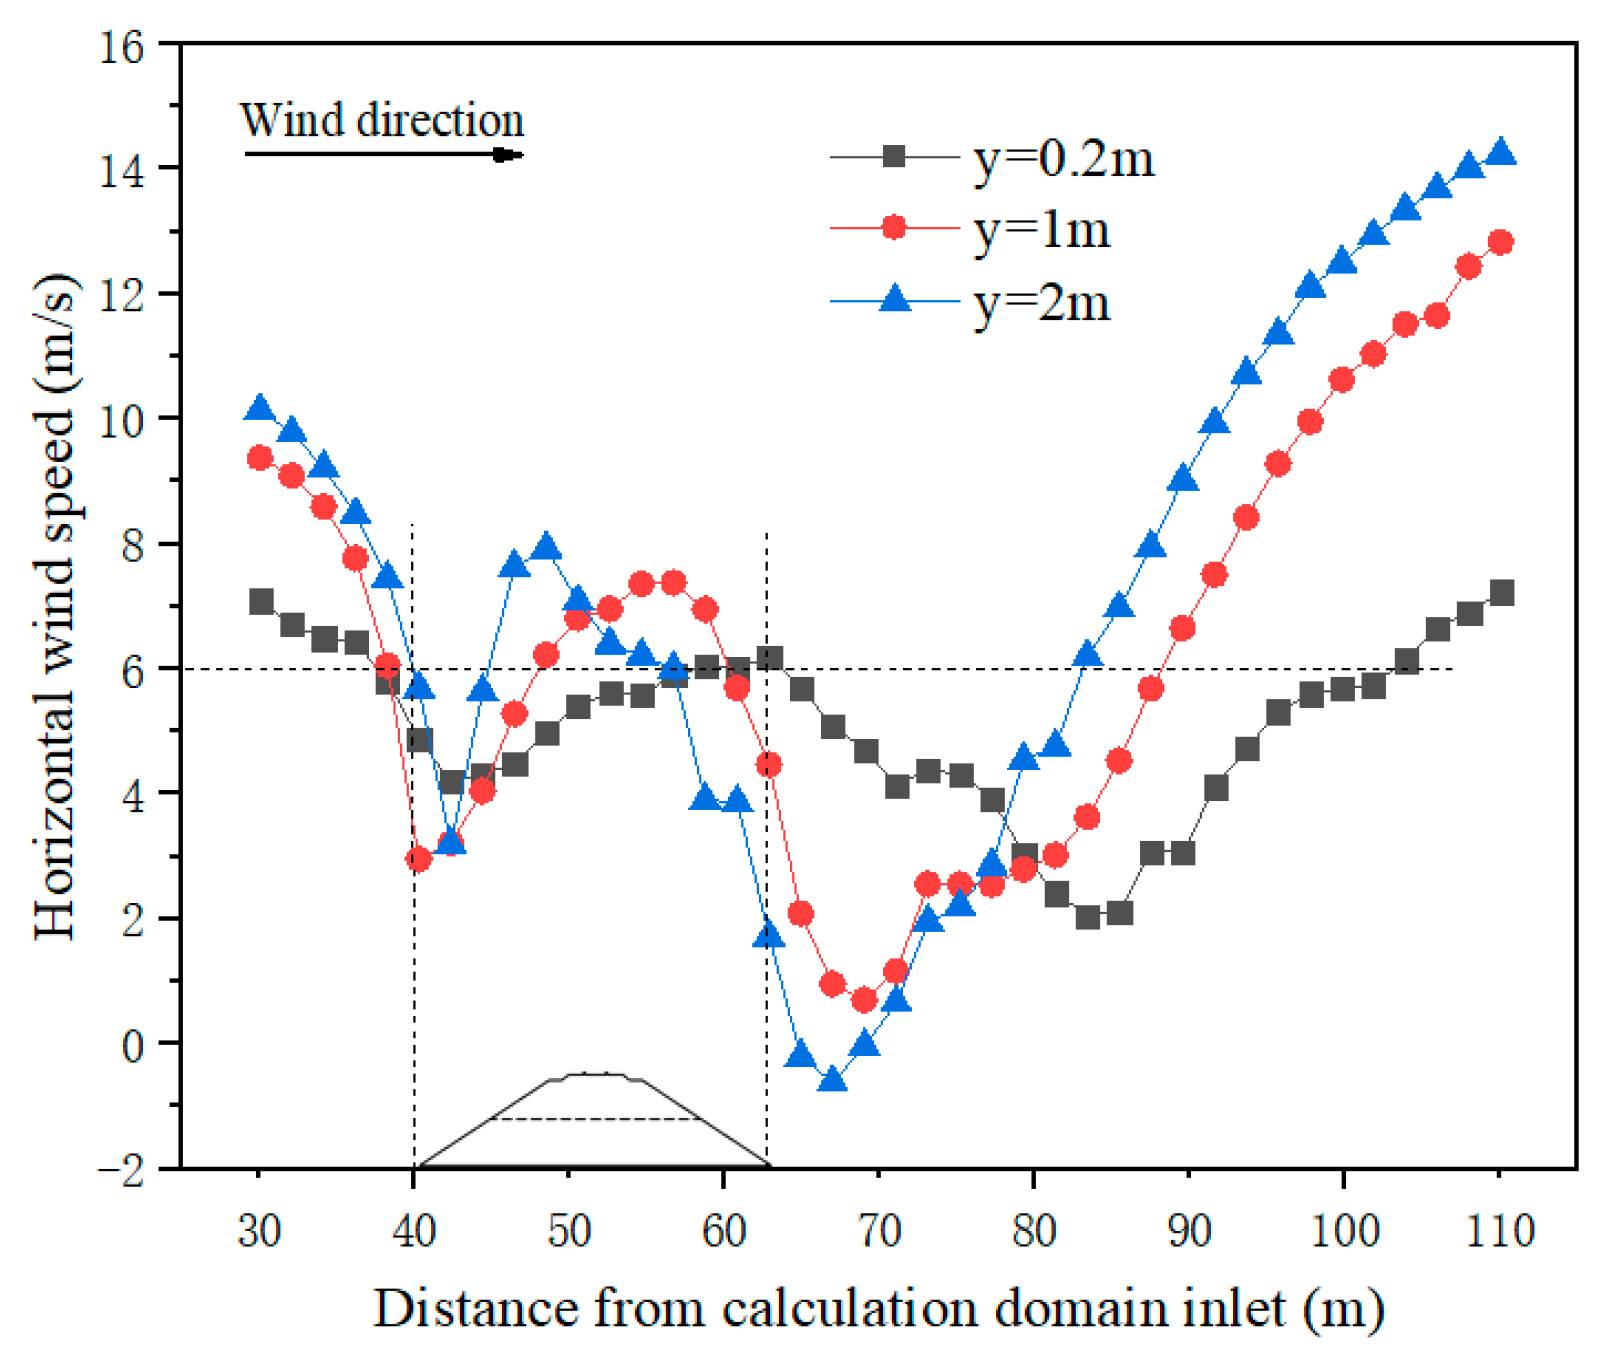
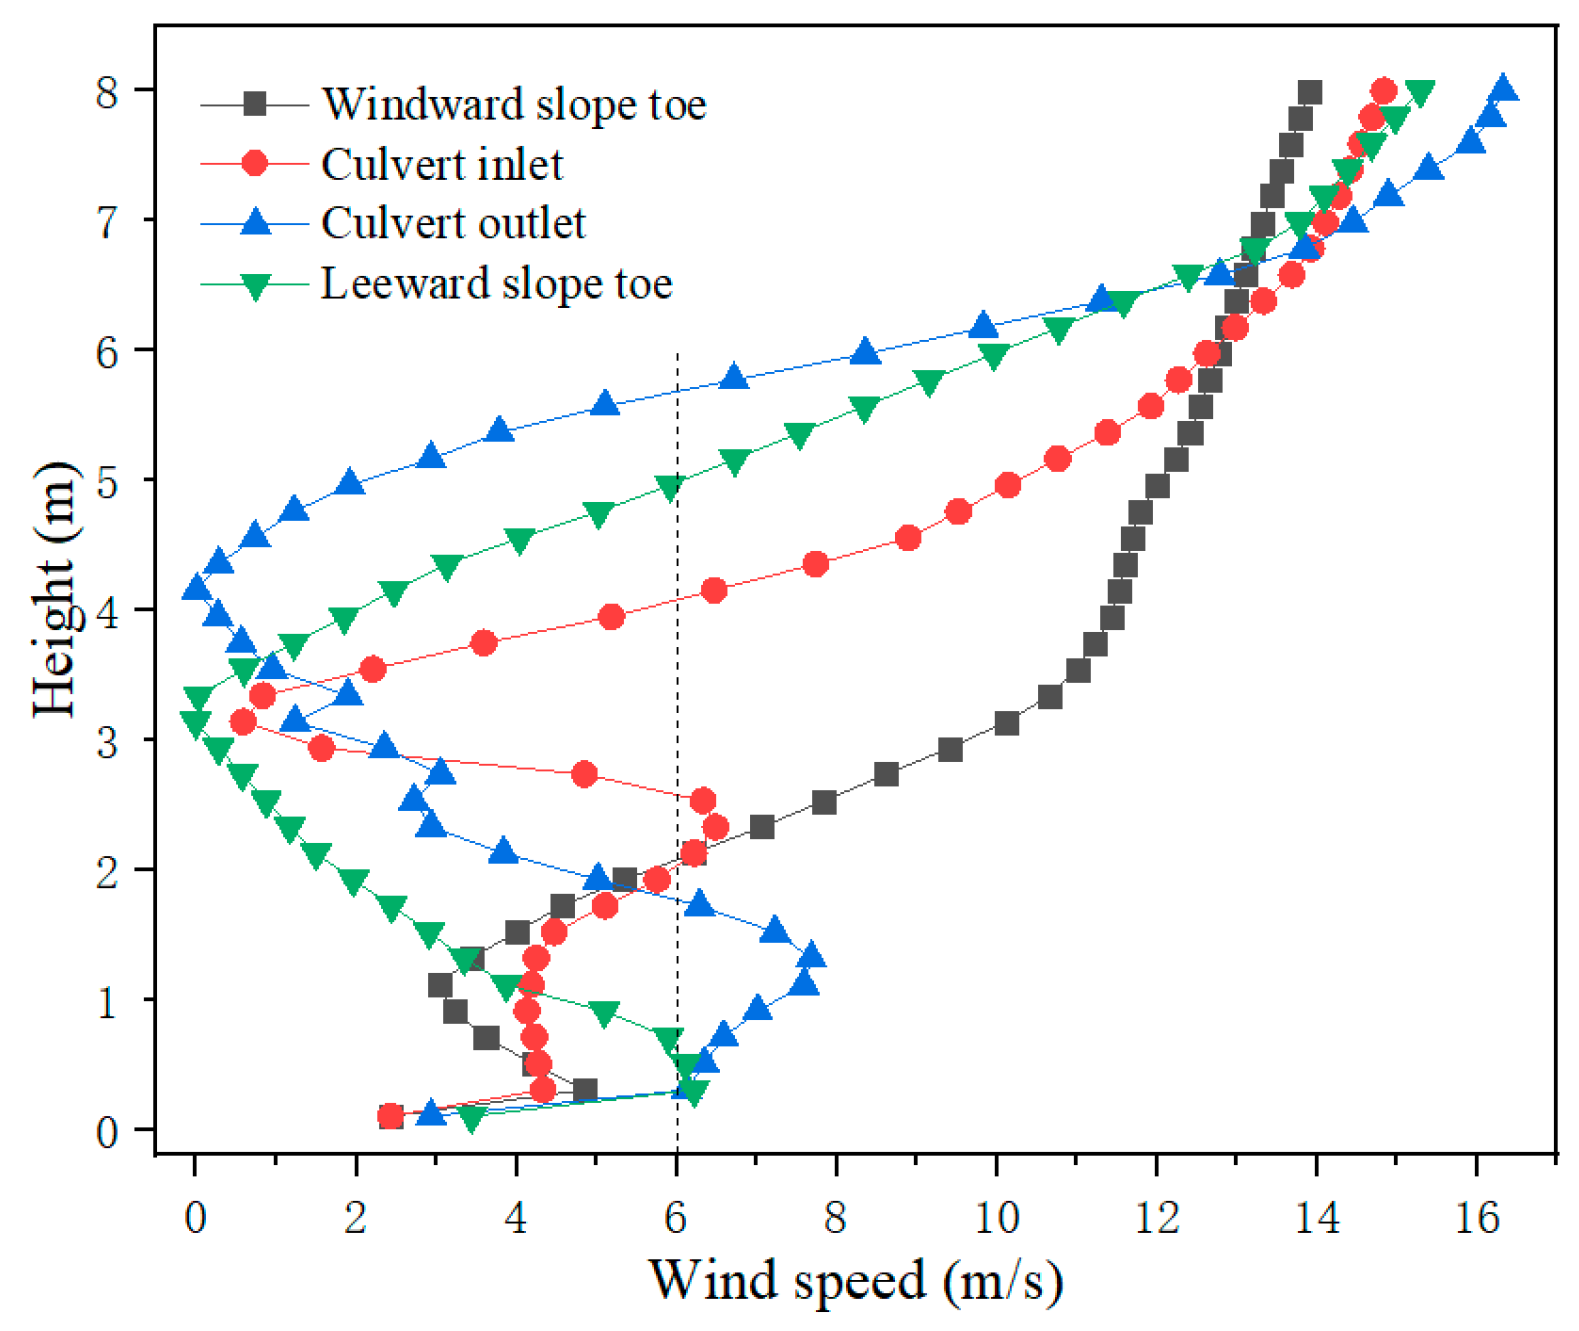
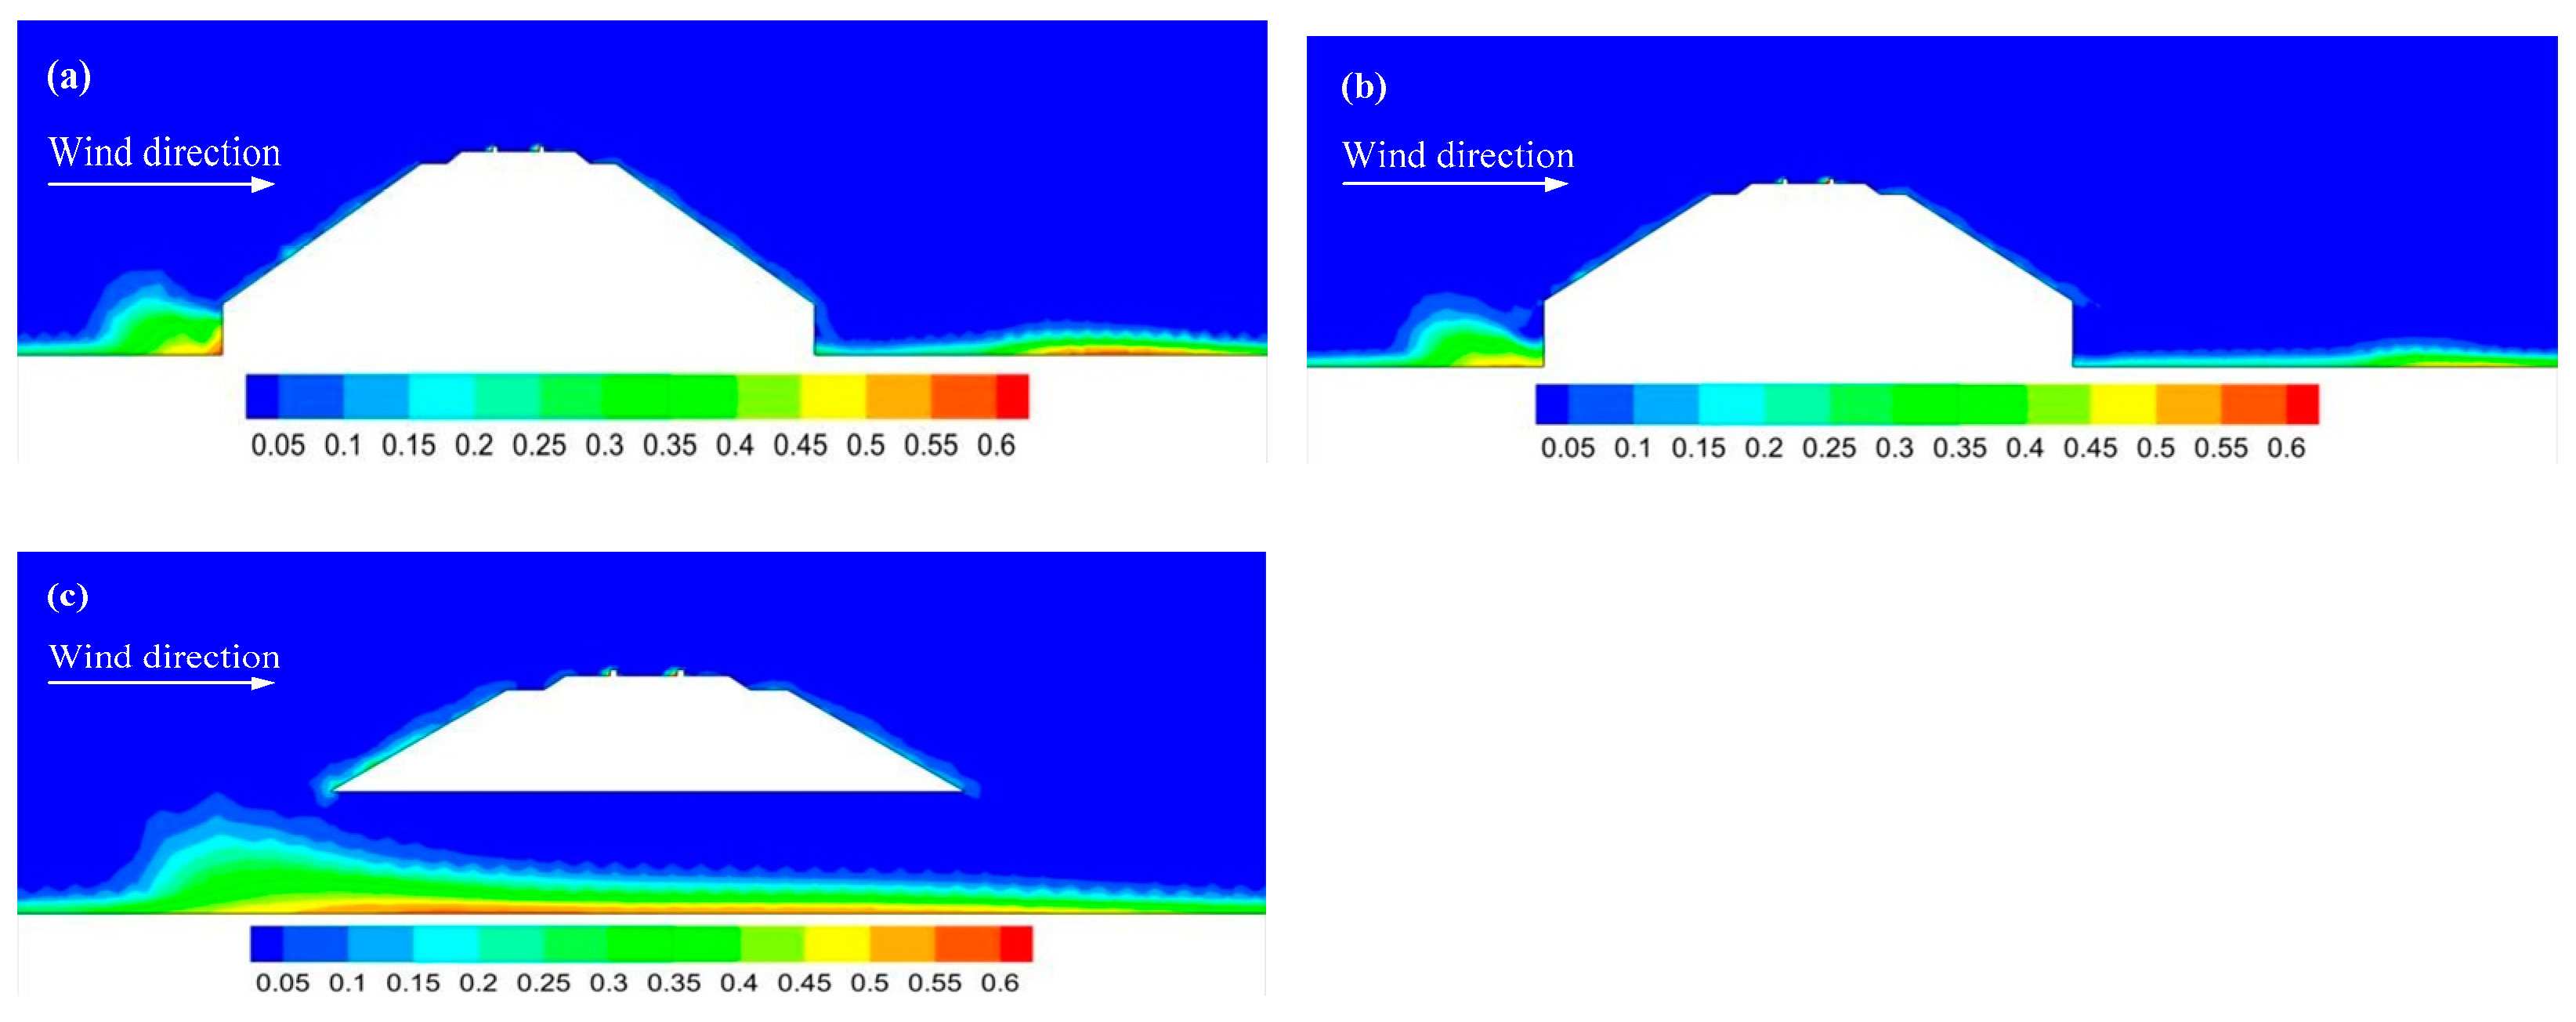
3.1. Flow Field Characteristics of Railway Culvert

The airflow is the power source of the sand movement and significantly influences the initiation of the sand, sand transport, and sand sedimentation. Figure 4 shows the flow field distribution on the axial plane (xy) of the culvert at an inflow velocity of v = 15 m/s.
Figure 4a shows that the airflow velocity on the windward side of the subgrade significantly decreases, creating a deceleration zone. The airflow was separated at the culvert inlet; one part moved upward along the windward side of the subgrade slope (the former), and the other part flowed into the culvert (the latter). The former converged on the windward side of the subgrade. The pressure increased, and the airflow passed rapidly over the railway track at the shoulder, forming an acceleration zone above the track. The pressure dropped, and a recovery zone formed in the far field as the airflow moved to the leeward side of the subgrade. Simultaneously, the airflow moved toward the ground due to gravity. The low-velocity airflow flowed towards the culvert outlet, creating a vortex due to the strong pressure resistance of the upper airflow. The latter was squeezed by the top surface of the culvert body, forming a local low-speed zone and then flowed through the culvert close to the ground. At this time, the airflow from the culvert outlet lifted the vortex away from the ground and reduced its intensity. However, a small vortex zone was formed because the low-velocity and low-pressure of the latter were not enough to resist the high-velocity and high-pressure of the former. The velocity cloud diagram of the axial plane in the culvert is shown in Figure 4b.
To make certain the horizontal wind velocity distribution and variation law of the vertical wind direction cross-section (3 m × 3 m) inside the culvert, Figure 5 shows the wind velocity cloud diagram at different positions of the culvert body in the x direction. It can be seen from Figure 5 that when x ≤ 54 m, the horizontal velocity had obvious stratification characteristics, and as the height increased, the velocity in the culvert body increased first and then decreased. The sequence is the airflow sub high speed zone, high speed zone, and low speed zone. The above phenomenon was fully consistent with the fluid boundary layer theory, that is, the viscous force of the airflow away from the culvert wall gradually decreased, the airflow velocity increased continuously, and finally the maximum velocity was reached in the middle of the hole. In addition, it was also found that as the position of the cross-section inside the culvert continuously shifted to the right, that is, the depth of the culvert body continued to increased, and the high-speed area of the airflow gradually moved up. When x = 58.2 m, the horizontal velocity at the culvert outlet was not stratified, and the airflow velocity was significantly lower than that of x = 54 m section. The main reason was that the wing walls structure of the culvert outlet increased the cross-sectional area, resulting in rapid decreased in airflow pressure and wind velocity.
Figure 6 shows the change in the horizontal wind speed from the windward side to the leeward side of the subgrade. The wind speed in the culvert had a range of 30–110 m at heights above the ground of y = 0.2, 1, and 2 m.
The curve of the horizontal wind speed along the culvert axis has a W shape, consistent with the results in Ref. [22]. At the height y = 0.2 m, the wind speed at the foot of the slope on the windward side decreased in the wind direction, increased after entering the culvert, and decreased at the culvert outlet. In the far field on the leeward side, the wind speed increased again. In general, the wind speed was less than 6 m/s. At heights of y = 1 m and 2 m, the wind speed at the foot of the windward side slope was 2.9 m/s and 3.2 m/s, respectively. It increased at the culvert inlet, indicating the acceleration effect of the culvert, consistent with the results in Ref. [21]. The greater the height, the faster the wind speed changed. The wind speed at the culvert outlet rapidly dropped to the minimum values of 0.7 m/s and −0.6 m/s at heights of 1 m and 2 m, respectively. The minimal value of wind speed at different heights occurred at the culvert inlet due to the blocking effect of the subgrade, which reduced the speed of the airflow near the ground.
Figure 7 shows the wind speed profiles at different positions of the culvert axis. In general, the wind speed increased, decreased, and increased as the height y increased. The lowest wind speed at the culvert inlet, outlet, and leeward side slope toe occurred at the height of 3–4 m, and were about zero. The main reason is that the airflow on the windward and leeward sides is blocked by the subgrade when y exceeds the culvert height. When y < 2 m, the wind speed at the other locations are less than 6 m/s, except at the culvert outlet, indicating that the culvert outlet is a high wind speed zone.

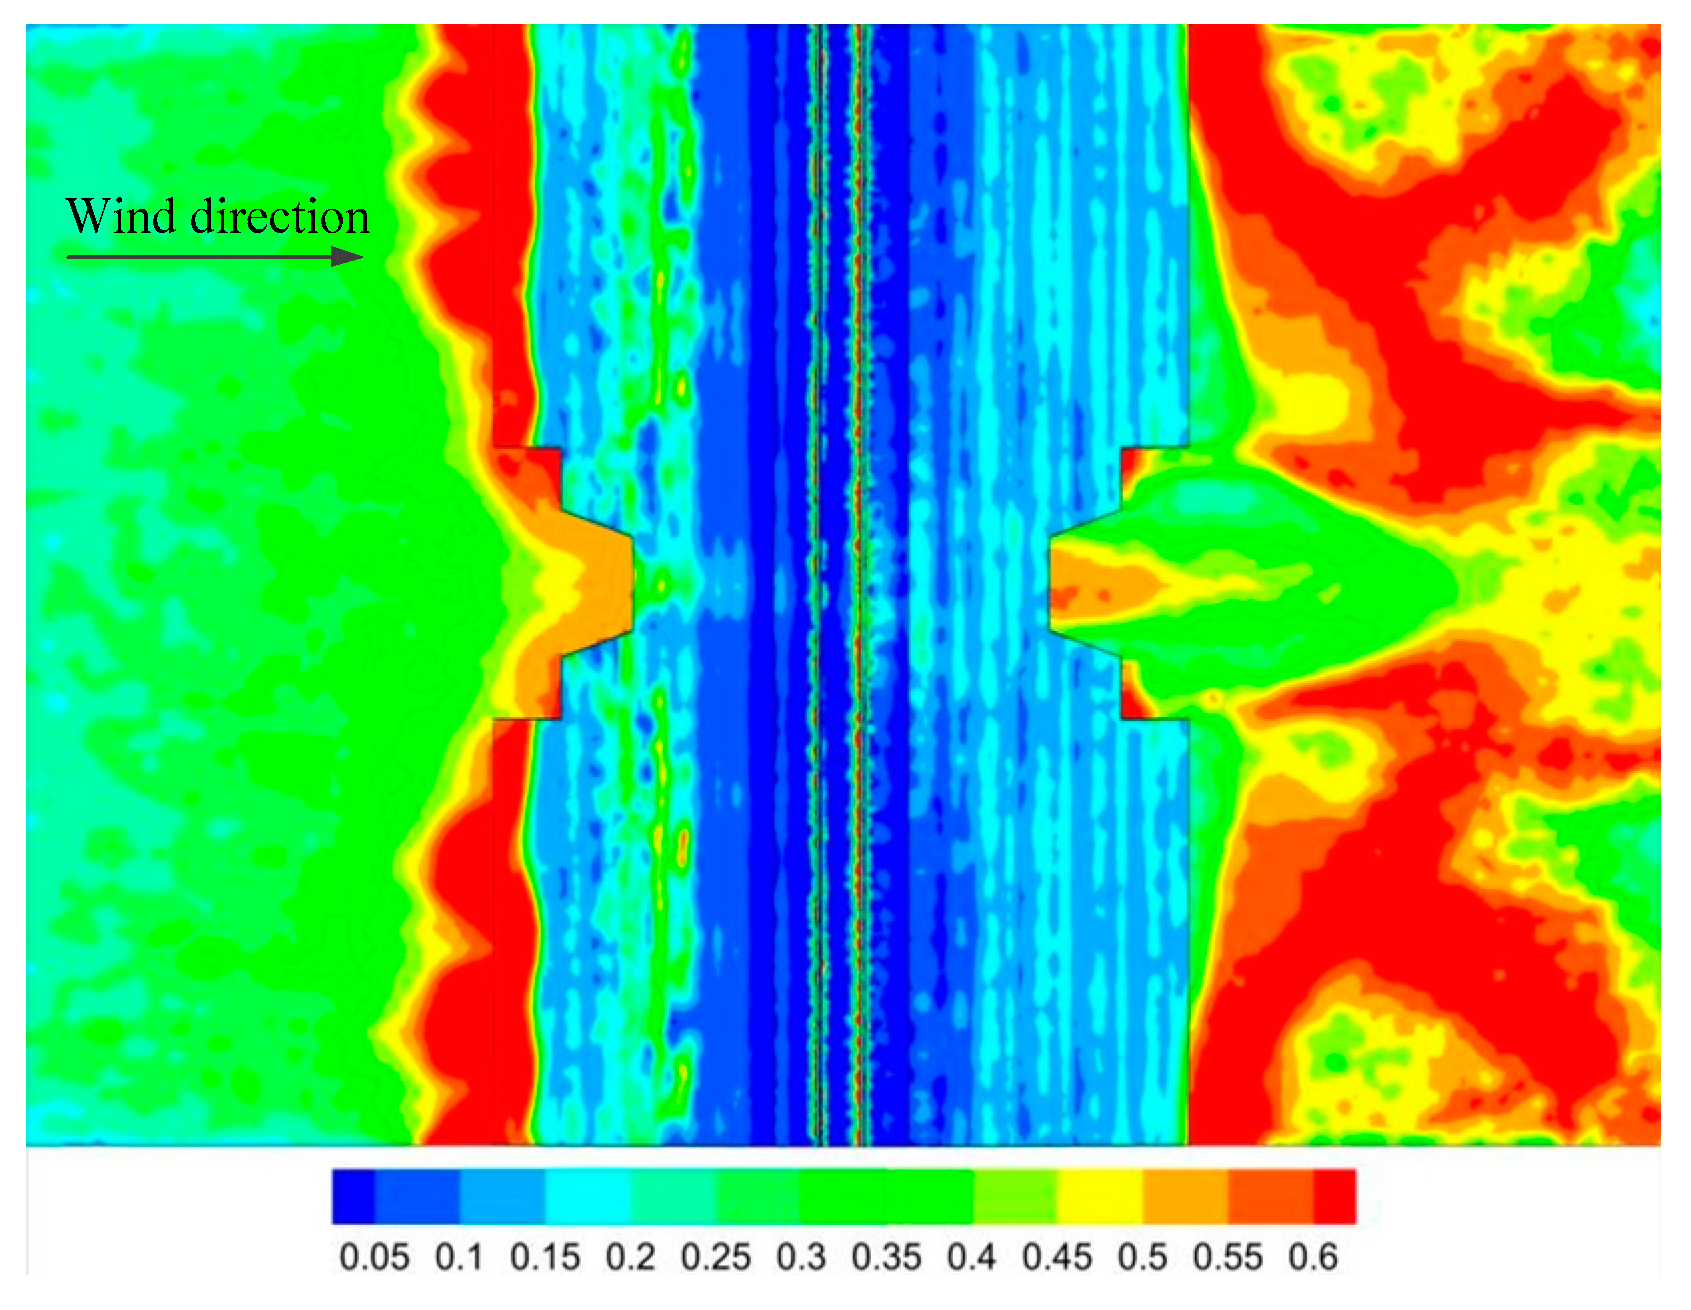
3.2. Sediment Transport Characteristics of Railway Culvert

The primary problem of wind-blown sand near railway culverts is the sand deposition. The sediment transport characteristics of the railway culvert are clarified by analyzing the sand deposition at different locations in the culvert. In the Euler two-fluid model, the sand volume fraction represents the sand concentration, reflecting the level of sand deposition. Figure 8 shows the cloud diagram of the sand volume fraction around the railway culvert (top view) at an inflow velocity of v = 15 m/s. The sand volume fraction was higher at the windward and leeward sides of the slope toe and the end faces than at the culvert inlet, outlet, and wing walls. In addition, the sand particles were moved from the end faces and wing walls to the culvert inlet due to the deflection by the wing walls. The sand was distributed symmetrically around the culvert’s central axis. Therefore, one side of the central axis of the culvert was selected for analysis.
Figure 9 shows the sand volume fraction at different locations of the culvert in the z-direction to reveal the accumulation of sand inside the culvert. As shown in Figure 9a, the end faces of the culvert inlet blocked the movement of the sand particles at z = 15 m. The sand volume fraction was high near the end faces. A small amount of sand deposition was observed near field of culvert outlet. At z = 16 m, the wing walls deflected the sand particles to the culvert inlet, and the sand deposition level was lower than at z = 15 m. At z = 18 m, a large amount of sand was deposited at the inlet and inside of the culvert.
In summary, the sand volume fraction was high at the end faces, low at the wing walls, and high inside the culvert. The sand deposition level was the lowest at the wing walls, indicating sand deflection by the walls. In other words, the sand particles were moved from the end faces to the wing walls and gathered at the culvert inlet due to the presence of the wing walls. As the airflow accelerated at the culvert inlet, the sand volume fraction and sand sedimentation level inside the culvert increased, adversely affecting passage through the culvert.

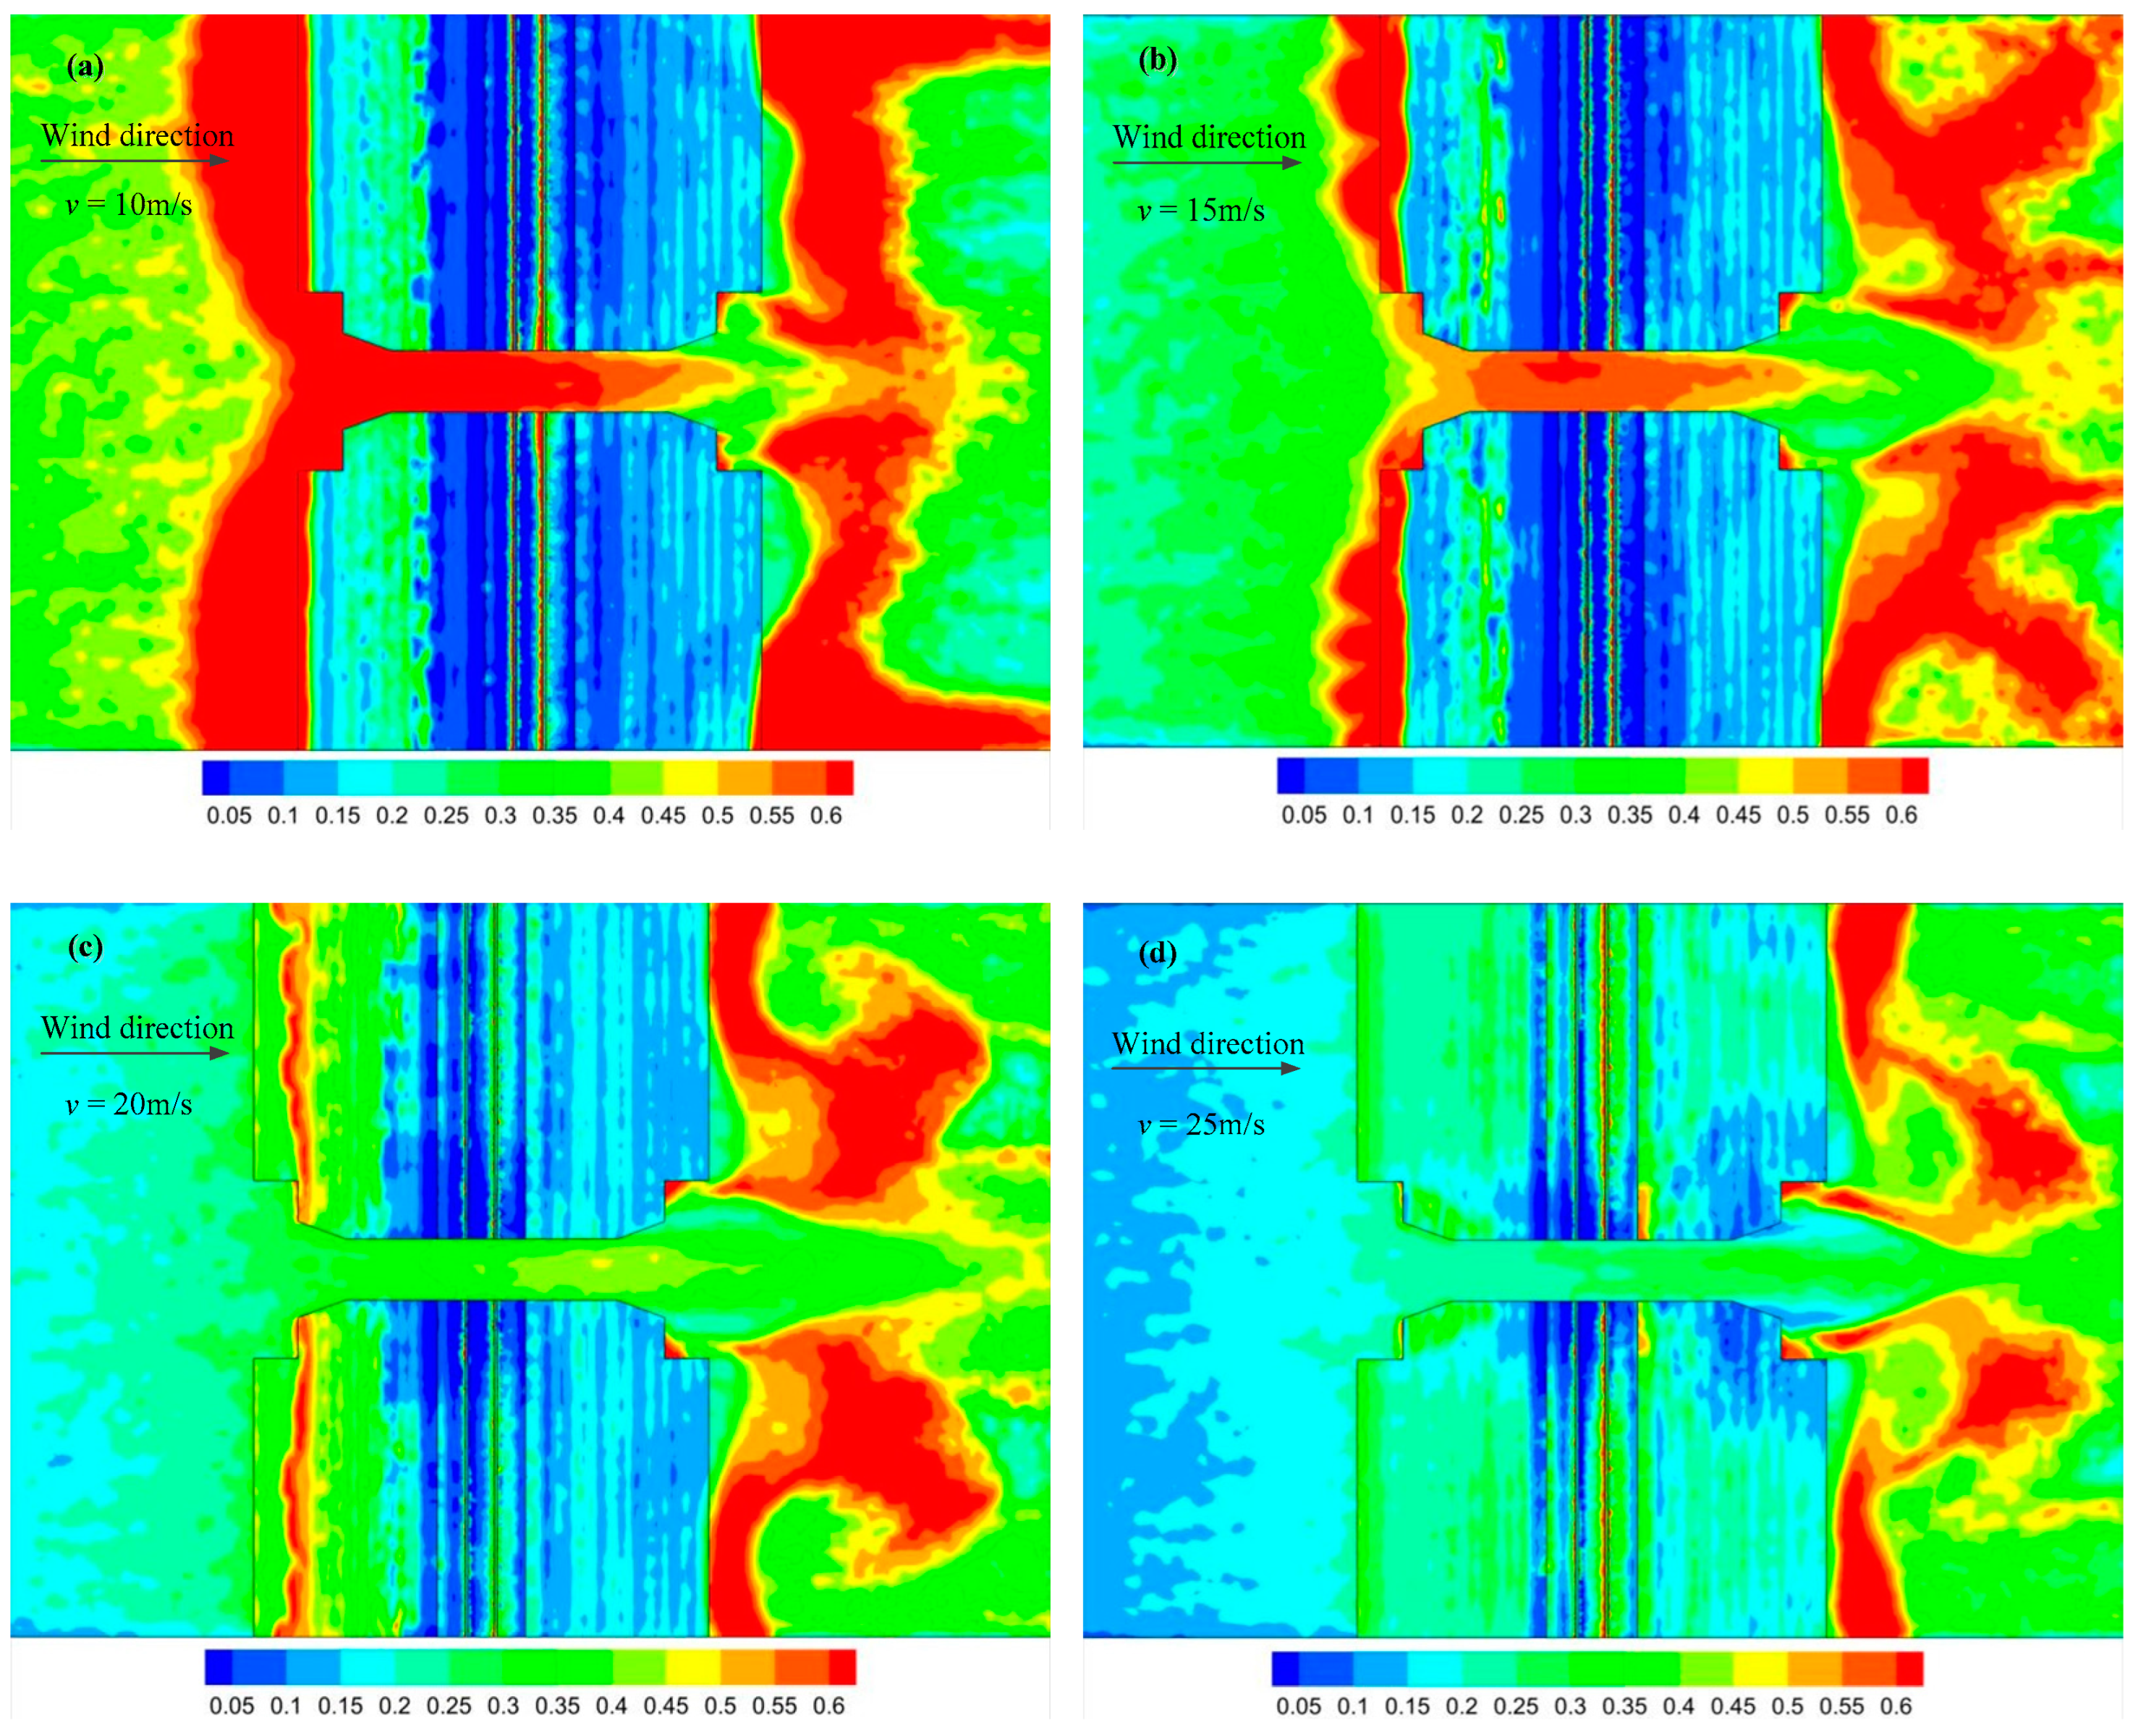
3.3. Influence of Inflow Velocity on Sand Distribution in Culvert

Figure 10 shows the sand volume fraction around the culvert (bottom view) at different inflow velocities. The kinetic energy of the airflow and the sand transport capacity were lower at v = 10 m/s than at v = 15 m/s (Figure 10b), resulting in a higher sand volume fraction on the windward side of the subgrade, the inlet and inside of the culvert, and the track. The kinetic energy of the airflow and the sand transport capacity were higher at v = 20 m/s than at v = 15 m/s. Most of the sand particles in front of the culvert were transported to the leeward side of the subgrade; thus, the sand volume fraction was low in the culvert. Moreover, a small amount of sand was transported to the middle of the windward slope of the subgrade and deposited in strips. The sand volume fraction on the windward side of the subgrade and inside the culvert was the lowest at v = 25 m/s. The sand at the leeward side was far away from the subgrade. In summary, an increase with the inflow velocity resulted in more sand being transported. The sand volume fraction in the culvert was lower at v ≥ 20 m/s than v ≤ 15 m/s, markedly.

4. Discussion

4.1. Sand Sedimentation Mechanism in the Railway Culvert

The systematic analysis of the flow field, sand volume fraction, and the influence of the inflow velocity on the sand sedimentation characteristics in the railway culvert indicate extensive sand deposition. The reasons were the deflection by the wing walls, the blocking effect of the subgrade, and a low inflow velocity.
First, the airflow in front of the culvert was the highest at the culvert inlet because of the angle of the wing walls. The airflow cross-section narrowed as the airflow moved from the near field to the inlet of the culvert, and the speed and pressure of the airflow crossing the culvert increased, resulting in an acceleration of the airflow. Numerous sand particles were carried by the airflow from the end faces to the wing walls and accumulated at the culvert inlet due to the deflection by the wing walls. Li and Shi et al. proposed that the culvert inlet and outlet are low-velocity sand accumulation areas or wind-drift areas to sand deposition [21,22]. The main reason is that the sudden decrease of the airflow velocity at the entrance of the culvert leads to sand accumulation, but the transport effect of the wing walls and the end faces on the wind-blown sand flow were not considered.
Second, the subgrade acted as a wind barrier in the flow field. The wind speed decelerated on the windward side of the subgrade, resulting in more sand deposition. The culvert’s acceleration effect caused the sand particles to be transported to the inlet and inside the culvert. As the wind speed decreased, a large amount of sand was deposited in the culvert.
Third, the airflow characteristics along railway were determined by geographic locations, unique environment and other factors. The inflow velocity is a critical factor affecting sand deposition, as confirmed by our results. Figure 10 shows the influence of the inflow velocity on the sand volume fraction of the culvert. It was found that more sand was deposited at v ≤ 15 m/s than at v ≥ 20 m/s, indicating that a low inflow velocity results in more sand sedimentation in the culvert.
The wing walls, the subgrade, and a low inflow velocity affected sand sedimentation in the culvert. However, the subgrade ensures the safe operation of the railway and can’t just be changed to mitigate sand sedimentation in the culvert. In addition, there are many railways in desert areas. The environmental conditions are changeable, the landforms are complex, and the flow field cannot be changed. Therefore, we propose an optimization of the culvert structure to minimize the deflection by the wing walls and decrease sand sedimentation in the railway culvert while extending the maintenance cycle and reducing costs.

4.2. Optimization and Design of Railway Culvert

Two culvert models are proposed: straight and protruding, as shown in Figure 11. They are designed to improve the structure of the original culvert and minimize sand accumulation. The straight culvert does not have wing walls or end faces. The protruding culvert includes a section that deflects the sand to the outside of the culvert. The same numerical simulation settings were used to evaluate the proposed culverts’ performances in reducing sand deposition.
Figure 12 shows the sand volume fraction of the two culverts (bottom view) at an inflow velocity of 15 m/s. The sand volume fraction of the new culverts was significantly lower than that of the original culvert (Figure 10b). The main reason is that the new culverts do not have wing walls, and the sectional area of the culvert inlet is smaller, reducing the possibility of sand sedimentation in the culvert. In addition, the sand volume fraction at the inlet was low for the new culverts, and there was almost no sand sedimentation at other places inside the culvert. The sand volume fraction was the lower inside the straight culvert. As shown in Figure 12a, the sand inside the straight culvert accumulated close to the inner wall of the culvert, and the sand sedimentation on the leeward side was far away from the slope toe. Figure 12b shows that the protruding culvert did to deflect the sand. Instead, the sand volume fraction was high at the culvert inlet. The likely reason is that the longer length of the protruding culvert changes the flow field distribution and reduces the airflow velocity at the culvert inlet, increasing the sand deposition level.
Figure 13 shows the distribution of the sand volume fraction on the central axis of the two proposed culvert models. The sand volume fraction and sedimentation level of the new culverts were substantially lower than that of the original culvert (Figure 9c). Moreover, the sand volume fraction at the inlet and inside the culvert was lower in the straight culvert than that of the protruding culvert.
In summary, the proposed culverts significantly reduced the sand volume fraction inside the culvert, demonstrating the impacts of the wing walls on the sand deposition in the culvert. The sand volume fraction was lower in the straight culvert than in the protruding culvert, indicating that these designs could increase the maintenance cycle and reduce costs. In addition, the straight culvert has a simple structure that is convenient for construction, reducing production costs. Therefore, using straight culvert may reduce problems related to sand accumulation in railway culverts.

5. Conclusions

A numerical simulation was conducted to analyze the horizontal wind speed and sand volume fraction around and in a railway culvert. Then we proposed some new culverts to reduce sand deposition. And comparisons of the sand sedimentation level between the original and proposed culverts were made.
The horizontal velocity had obvious stratification at different cross-sections of the culvert body, and the maximum velocity was reached in the middle. The curve of the horizontal wind speed along culvert axis had a W shape. The wind speed increased inside the original culvert, indicating a strong acceleration effect. The sand particles at the wing walls accumulated at the culvert inlet, increasing the sand volume fraction inside the culvert, demonstrating the deflection by the wing walls. As the inflow velocity increased, the sand accumulation potential decreased markedly. The sand volume fraction in the original culvert was the highest at v = 10 m/s.
It was found that the wing walls, subgrade blocking, and a low inflow are important reasons for sediment accumulation in the railway culvert through the analysis of formation mechanism of sediment accumulation. Based on this, we tried to improve the culvert structure and two culvert designs to reduce sand deposition were proposed. The sand volume fraction was significantly lower in the proposed culverts than in the original culvert, and the straight culvert provided the best performance.
The inflow direction may cause differences in the sand accumulation state at the entrance and inside of the culvert. And the wind tunnel experiments on the sand sedimentation mechanism around railway culvert could better verify and supplement the results of this paper. So they deserve our attention and are important research works we will be carried out in the future.

Author Contributions

Conceptualization, J.X.; methodology, J.X. and N.H.; software, J.X.; validation, H.D.; formal analysis, J.X.; investigation, G.S. and X.Z.; resources, N.H.; data curation, J.X.; writing—original draft preparation, J.X.; writing—review and editing, J.X. and H.D.; supervision, G.S. and X.Z.; project administration, N.H.; funding acquisition, N.H. and X.Z. All authors have read and agreed to the published version of the manuscript.

Funding

This work was funded by the State Key Program of National Natural Science Foundation of China (41931179), Key Research and Development Program of Gansu Province (22YF7FA019), Science and Technology Research Project of China National Railway Group Co. LTD (N2022G068), Scientific and Technological Research and Development Plan of China Railway Urumqi Bureau Group Co., Ltd. (WLMQ-KGHZGS-HRTLGGB-2020-0031), Natural Science Foundation of Gansu Province (22JR5RA344), and Youth Doctoral Foundation of Gansu Provincial Department of Education (2022QB-063).

Institutional Review Board Statement

This study did not involve humans or animals.

Informed Consent Statement

This study did not involve humans.

Data Availability Statement

This study did not report any data.

Conflicts of Interest

The authors declare no conflict of interest.

Nomenclature

CFDComputational fluid dynamics
CWEComputational wind engineering
αgvolume fractions of the air phase (%)
αsvolume fractions of the sand phase (%)
ρgdensity of the air phase (kg/m3)
ρsdensity of the sand phase (kg/m3)
vgvelocity vectors of the air phase
vsvelocity vectors of the sand phase
ugvelocity of the air phase (m/s)
usvelocity of the sand phase (m/s)
τgsurface stress tensors of the air phase (Pa)
τssurface stress tensors of the sand phase (Pa)
ppressure of an ideal fluid (Pa)
pssolid pressure of the sand phase (Pa)
gacceleration of gravity (m/s²)
fsginteraction force between the air and sand phases (N)
CDdrag coefficient
dequivalent diameter of the sand particle (m)
urrelative velocity between the air and sand phases (m/s)
RANSReynolds Average Navier-Stokes method
kturbulent kinetic energy
εturbulent dissipation rate
uivelocity components in the x-direction (m/s)
ujvelocity components in the y-direction (m/s)
σkPrandtl constant corresponding to the turbulent kinetic energy
σεPrandtl constant corresponding to the turbulent dissipation rate
Gkturbulent kinetic energy caused by the average velocity gradient
S d k turbulent kinetic energy caused by particle motion
S d ε turbulent dissipation rate caused by particle motion
μtturbulent viscosity
C1model constant
C2model constant
Cμmodel constant
u(y)horizontal wind speed at height y (m/s)
u*friction wind speed (m/s)
κKarman constant
y0surface roughness (m)
vinflow velocity (m/s)

References

  1. Niu, B.C.; Tan, L.H.; Zhang, X.C.J.; Qu, J.J.; An, Z.S.; Wang, J.Z.; Liu, B.L.; Wang, T.; Li, K.C. Targeted control of sand hazards for a railway in extremely arid regions using fingerprinting approaches. Geomorphology 2020, 361, 107189. [Google Scholar] [CrossRef]
  2. Paz, C.; Suarez, E.; Gil, C.; Concheiro, M. Numerical study of the impact of windblown sand particles on a high-speed train. J. Wind Eng. Ind. Aerodyn. 2015, 145, 87–93. [Google Scholar] [CrossRef]
  3. Shu, K.; Ding, H.H.; Mazzù, A.; Lin, Q.; Guo, J.; Meli, E.; Liu, Q.Y.; Wang, W.J. Effect of dynamic windblown sand environments on the wear and damage of wheel-rail under different slip ratios. Wear 2022, 500–501, 204349. [Google Scholar] [CrossRef]
  4. Deng, G.X.; Ma, W.; Peng, Y.; Wang, S.M.; Yao, S.; Peng, S. Experimental study on laminated glass responses of high-speed trains subject to windblown sand particles loading. Constr. Build. Mater. 2021, 300, 124332. [Google Scholar] [CrossRef]
  5. Mehdipour, R.; Baniamerian, Z. A new approach in reducing sand deposition on railway tracks to improve transportation. Aeolian Res. 2019, 41, 100537. [Google Scholar] [CrossRef]
  6. Xiao, H.; Zhang, Z.H.; Chi, Y.H.; Wang, M.; Wang, H.Y. Experimental study and discrete element analysis on dynamic mechanical behaviour of railway ballast bed in windblown sand areas. Constr. Build. Mater. 2021, 304, 124669. [Google Scholar] [CrossRef]
  7. Marko, H.; Luca, B.; Sami, K. Receiver Sand Mitigation Measures along railways: CWE-based conceptual design and preliminary performance assessment. J. Wind Eng. Ind. Aerodyn. 2022, 228, 105109. [Google Scholar] [CrossRef]
  8. Lorenzo, R.; Luca, B. Windblown sand action on civil structures: Definition and probabilistic modeling. Eng. Struct. 2019, 178, 88–101. [Google Scholar] [CrossRef]
  9. Lorenzo, R.; Luca, B. Windblown sand mitigation along railway megaprojects: A comparative study. Struct. Eng. Int. 2020, 30, 355–364. [Google Scholar] [CrossRef]
  10. Zhang, C.; Huang, N.; Dun, H.C. Experimental study on sand/bed collision over the Gobi surface. J. Geophys. Res. Atmos. 2022, 127, e2021JD035766. [Google Scholar] [CrossRef]
  11. Wang, T.; Qu, J.J.; Tan, L.H.; Gao, Y.; Zhang, K.; Shi, B.Y. Aeolian sediment transport over the Gobi with high gravel coverage under extremely strong winds in the Hundred Miles windy area along the Lanzhou-Xinjiang High-Speed Railway. J. Wind Eng. Ind. Aerodyn. 2022, 220, 104857. [Google Scholar] [CrossRef]
  12. Cheng, J.J.; Jiang, F.Q.; Xue, C.X.; Xin, G.W.; Li, K.C.; Yang, Y.H. Characteristics of the disastrous wind-sand environment along railways in the Gobi area of Xinjiang, China. Atmos. Environ. 2015, 102, 344–354. [Google Scholar] [CrossRef]
  13. Cheng, J.J.; Lei, J.Q.; Li, S.Y.; Wang, H.F. Disturbance of the inclined inserting-type sand fence to wind-sand flow fields and Its sand control characteristics. Aeolian Res. 2016, 21, 139–150. [Google Scholar] [CrossRef]
  14. Xin, G.W.; Huang, N.; Zhang, J.; Dun, H.C. Investigations into the design of sand control fence for Gobi buildings. Aeolian Res. 2021, 49, 100662. [Google Scholar] [CrossRef]
  15. Wang, T.; Qu, J.J.; Ling, Y.Q.; Liu, B.L.; Xiao, J.H. Shelter effect efficacy of sand fences: A comparison of systems in a wind tunnel. Aeolian Res. 2018, 30, 32–40. [Google Scholar] [CrossRef]
  16. Zhang, K.; Zhao, P.W.; Zhao, J.C.; Zhang, X.X. Protective effect of multi-row HDPE board sand fences: A wind tunnel study. Int. Soil Water Conse. 2021, 9, 103–115. [Google Scholar] [CrossRef]
  17. Huang, N.; Gong, K.; Xu, B.; Zhao, J.; Xin, G.W. Investigations into the law of sand particle accumulation over railway subgrade with wind-break wall. Eur. Phys. J. E 2019, 42, 145. [Google Scholar] [CrossRef]
  18. Cui, X.N. Study of Sand Damage in Culvert and Mechanism of Sand Blocking in New Sand Barrier Network of Geku Railway; Lanzhou Jiaotong University: Gansu, China, 2019. [Google Scholar]
  19. Luca, B.; Marko, H.; Lorenzo, R. Windblown sand along railway infrastructures: A review of challenges and mitigation measures. J. Wind Eng. Ind. Aerodyn. 2018, 177, 340–365. [Google Scholar] [CrossRef]
  20. Zhi, L.Y.; Cheng, J.J.; Wang, L.; Xin, L.G. Study on flow field around culvert of desert road and characteristics of sand accumulation. Railw. Stand. Des. 2018, 62, 62–67. [Google Scholar]
  21. Li, K.C.; Shi, L.; Zhang, F.; Jiang, F.Q. Research on the dynamic response of sand flow and railway culvert. J. Railw. Eng. Soc. 2015, 32, 14–17+48. [Google Scholar]
  22. Shi, L.; Jiang, F.Q.; Li, K.C.; Xue, X.C.; Kong, L.W. Three-dimensional simulation analysis of response law of wind-blown sand flow around the railway culvert. J. Railw. Eng. Soc. 2016, 33, 14–18. [Google Scholar]
  23. Yang, X.M.; Jia, H.F.; Zhou, Y.L. Numerical analysis on formation mechanism of sand damage around culvert of Qinghai Tibet Railway. Railw. Eng. 2021, 61, 109–111+133. [Google Scholar]
  24. Yuan, Z.L.; Zhu, L.P.; Geng, F.; Peng, Z.B. Gas Solid Two Phase Flow and Numerical Simulation; Southeast University Press: Nanjing, China, 2013; pp. 61–63, 68. [Google Scholar]
  25. TB 10002-2017; Code for Design of Railway Bridges and Culvert. National Railway Administration of the People’s Republic of China: Shenyang, China, 29 September 2017.
  26. Liu, S.M.; Pan, W.X.; Zhao, X.W.; Zhang, H.; Cheng, X.L.; Long, Z.W.; Chen, Q.Y. Influence of surrounding buildings on wind flow around a building predicted by CFD simulations. Build. Environ. 2018, 140, 1–10. [Google Scholar] [CrossRef]
  27. Dun, H.C.; Xin, G.W.; Huang, N.; Shi, G.T.; Zhang, J. Wind-tunnel studies on sand sedimentation around wind-break walls of Lanxin High-Speed Railway II and its prevention. Appl. Sci. 2021, 11, 5989. [Google Scholar] [CrossRef]
Figure 1. Sand sedimentation around railway culverts, (a) at entrance of a culvert on the Qinghai-Tibet Railway, and (b) inside a culvert on the Golmud-Korla Railway [18].
Applsci 13 05585 g001
Figure 2. The geometric model of railway culvert(Unit: m). (a)The schematic diagram of railway culvert model and its boundary condition setting, the specific structural dimensions are given in (b) the front view and (c) the right view of culvert.
Applsci 13 05585 g002
Figure 3. Comparison of horizontal wind speeds around wind-break wall [27].
Applsci 13 05585 g003
Figure 4. Flow field distribution of railway culvert. (a) Streamline diagram and (b) velocity cloud diagram of axial plane in the culvert.
Applsci 13 05585 g004
Figure 5. Wind velocity cloud maps of different cross-sections from culvert inlet to outlet.
Applsci 13 05585 g005
Figure 6. Variation curves of horizontal wind speed along culvert axis.
Applsci 13 05585 g006
Figure 7. Variation curves of wind speed profile at culvert axis.
Applsci 13 05585 g007
Figure 8. The sand volume fraction around the railway culvert (top view) (Unit: %). Red indicates the maximum sand volume fraction, and blue indicates the minimum sand volume fraction.
Applsci 13 05585 g008
Figure 9. Sand volume fraction at different locations of the culvert in the z-direction (Unit: %): (a) z = 15 m (end faces), (b) z = 16 m (wing walls), and (c) z = 18 m (culvert axis).
Applsci 13 05585 g009
Figure 10. The sand volume fraction inside the culvert (bottom view) (Unit: %), at an inflow velocity of (a) v = 10 m/s, (b) 15 m/s, (c) 20 m/s, and (d) 25 m/s.
Applsci 13 05585 g010
Figure 11. Schematic diagram of two culvert models of reducing sand deposition (Unit: m): (a) straight culvert and (b) protruding culvert.
Applsci 13 05585 g011
Figure 12. Bottom view of sand volume fraction (Unit: %): (a) straight culvert and (b) protruding culvert.
Applsci 13 05585 g012
Figure 13. Distribution of sand volume fraction (Unit: %): (a) straight culvert and (b) protruding culvert.
Applsci 13 05585 g013
Disclaimer/Publisher’s Note: The statements, opinions and data contained in all publications are solely those of the individual author(s) and contributor(s) and not of MDPI and/or the editor(s). MDPI and/or the editor(s) disclaim responsibility for any injury to people or property resulting from any ideas, methods, instructions or products referred to in the content.

