Abstract
Rain is an important factor influencing the instability of ecological slopes. There is little research on the inherent quantitative influence of substrate properties on slope runoff and water infiltration to support accurate ecological slope protection design. In this paper, the influence of substrate characteristics on slope runoff and water infiltration is quantitatively analyzed by constructing large physical models with different substrate characteristics for artificial rainfall simulations. The experimental results showed that the cumulative runoff volume and slope runoff rate were positively correlated with the cement content and substrate thickness in a 4 h, 60 mm/h artificially simulated rainfall. Specifically, the cumulative runoff volume increased by 2.06% for every 1% increase in cement content, and the cumulative runoff volume increased by 3.93% for every 1 cm increase in substrate thickness. The substrate inhibited the advance of the wetting front, and at different slope locations, the transport rate of the wetting front exhibited a mid-slope > upslope. Moreover, the transport rate of the wetting front showed a non-linear relationship with time as a power function V = a·tb, with the cement content showing a linear relationship with parameters a and b, and the substrate thickness showing a non-linear relationship with parameters a and b. The cumulative infiltration and infiltration rate were negatively correlated with cement content and substrate thickness, as shown by a 2.2% decrease in cumulative infiltration for every 1% increase in cement content and a 4.73% decrease in cumulative infiltration for every 1 cm increase in substrate thickness.
1. Introduction
Natural disasters such as landslides and debris flows caused by slope instability are among the most frequent and harmful to human activities considering all kinds of geological disasters [1]. Rainfall is an important factor influencing slope instability [2], and slope ecological protection is a common form of slope protection [3,4], which is widely used in various projects such as highways, railroads and water conservancy [5,6]; however, the relationship between rainfall infiltration and ecological slope instability is still poorly understood. Therefore, it is important to study the rainfall infiltration and runoff rules of ecological slopes and determine the quantitative analysis model for ecological slope design.
Slope instability landslides are influenced by many factors [7,8,9], such as rainfall intensity [10], rainfall duration [11], vegetation type [12], topography and initial slope conditions [13], and the purpose of parametric research is to understand the rainfall infiltration law of ecological slopes and to grasp the magnitude of the role played by various influencing factors [14]. In the 1970s, Japan began using small-scale physical models of slopes for experimental rainfall studies [15,16]. Laboratory experiments on landslide in a scaled physical model began in the 1980s in Canada [17]. Small-scale slope model tests were conducted in Japan and Canada with increased acceleration in geotechnical centrifuges [18,19]. However, in the case of centrifuge limitation, the scale effect of the small landslide physical model is significant [20]. Zhang Xia et al. [21] analyzed the characteristics and patterns of rainfall infiltration runoff, erosion and sedimentation on slopes under different vegetation types and their interrelationships through field simulated rainfall experiments. Y. Bamutaze et al. [22] conducted infiltration tests with a double-loop infiltrator to investigate the spatial variability of infiltration and found that steady-state infiltration rates generally increased with slope, independent of crop type, and that soil infiltration data were consistent with four commonly used water infiltration models. Zhu et al. [23] established an infiltration runoff model for mountain slopes and conducted field flow production and natural precipitation catchment tests; the experimental results were compared with the model to find that the model can better simulate runoff and infiltration, and the measured and simulated values were in good agreement. Yun Que et al. [24] proposed a joint approach using a dual infiltration model and a kinematic wave model, performed laboratory tests and found that the presence of macropores greatly facilitated the movement of rainwater on the slope surface. Chao Zhang et al. [25] conducted model experiments to find how the groundwater table, which generates pore water pressure, is affected by infiltration time lag, surface runoff and lateral flow. Martina Vivoda Prodan et al. [26] constructed a small slope model for artificial rainfall tests and showed that rainfall infiltration leads to an increase in the volumetric water content of the slope and the dissipation of the suction of the initial partially saturated material, resulting in a decrease in effective stress and shear strength, which in turn leads to the occurrence of slope movement and damage. H. Moriwaki et al. [27] conducted a rainfall landslide test using loose sandy soils and measured and analyzed the dynamic processes associated with landslide movement and groundwater pressure fluctuations during the damage process. The study showed that the increase in water pressure on the upper slope was due to the collapse of the loose soil structure during translational sliding, while the increase in water pressure on the lower and horizontal portions of the slope was due to compression and shearing of the soil by the sliding body. Vedran Jagodnik et al. [28] constructed a physical model of sandy slopes to simulate the process of landslides occurring on slopes under rainfall and earthquake conditions, and compared the relevant experimental results with the results of numerical analysis of rainfall infiltration and limit equilibrium stability analysis. Shurong Yang et al. [29] conducted artificial rainfall tests using a slope model to investigate the effects of rainfall intensity, initial moisture content and relative compaction on the infiltration and damage behavior of rainfall-infiltrated unsaturated soil slopes. The test results showed that the relative compaction was the most important factor affecting water infiltration. Xueyun Wei et al. [30] conducted artificial rainfall tests on swelling soil slopes after opening out to reveal the stage deformation damage pattern of unstable landslides on swelling soil slopes under the action of rainfall infiltration.
It should be noted that the above studies have not considered the influence of substrate characteristics on rainfall infiltration in ecological slopes. The semirigid substrate layer created by the substrate can create fertility conditions for slope plant reproduction and increase the carbon sequestration capacity of ecosystems and the carbon sink capacity of forests and grasses [31]. Based on the existing research results [32,33], in this paper a large-scale ecological slope model with different substrate characteristics is constructed and artificially simulated rainfall tests are conducted to obtain the effects of cement content and thickness of ecological slope substrate on slope runoff, wetting front and infiltration under the rainfall effect.
2. Materials and Methods
2.1. Slope Model Design
The slope model site was built in Wuhan city, and the design size of the model is 3500 mm long, 2000 mm high and 1500 mm wide, with a slope ratio of 1:1.75, as shown in Figure 1. The slope model is built with brick and concrete structure, and the test fill is clay, which is taken from the suburbs of Wuhan city, with a yellowish-brown color overall; its basic properties are shown in Table 1. The clay is dried, crushed and sieved after retrieval, and is configured to have the optimal moisture content before filling. The permeability coefficients of the substrates are shown in Table 2.
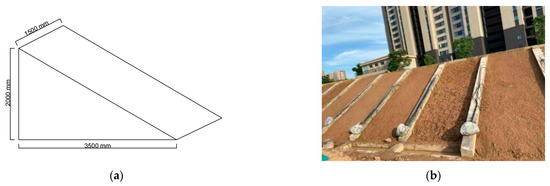
Figure 1.
Side slope model drawing: (a) side slope diagram; (b) realistic view of the slope.

Table 1.
Basic properties of soil.
Table 2.
Permeability coefficient of the substrate.
2.2. Artificial Simulated Rainfall Device
To meet the requirements of achieving full coverage of the upper surface of the slope and uniform rainfall in the slope rainfall test, the artificial simulated rainfall device of this test contains: an inlet pipe; rain intensity controller; fogging nozzle; composition; fogging nozzle fixed on the supporting steel frame; and a 3500 mm steel frame parallel to the ground, with a slope height of 1500 mm. The rainfall device is shown in Figure 2.
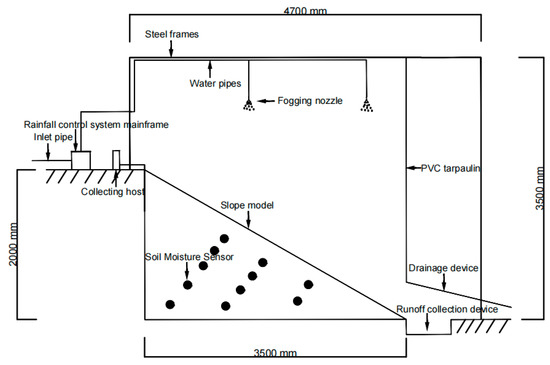
Figure 2.
Schematic diagram of the rainfall device.
2.3. Water Content Sensor Deployment
The detection instrument used to detect the change of water content is the LS-DL1 collection host and SWR-100 soil moisture sensor developed by Hebei Redden Electronic Technology Company as shown in Figure 3. The collection interval range of the collection host is 1 s/time–24 h/time, and the accuracy of the sensor is 0.1%. Each slope is equipped with 11 water content sensors, which are divided into 4 equal points along the slope, and the slope is divided into 3 directions: on the slope, in the slope and under the slope. A total of 5 sensors are installed on the slope, 4 sensors are installed in the slope and 2 sensors are installed under the slope. The specific layout is shown in Figure 3 and Figure 4.
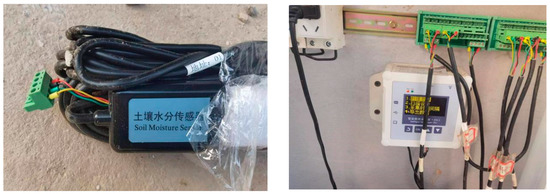
Figure 3.
SWR-100 soil moisture sensor and collection host.
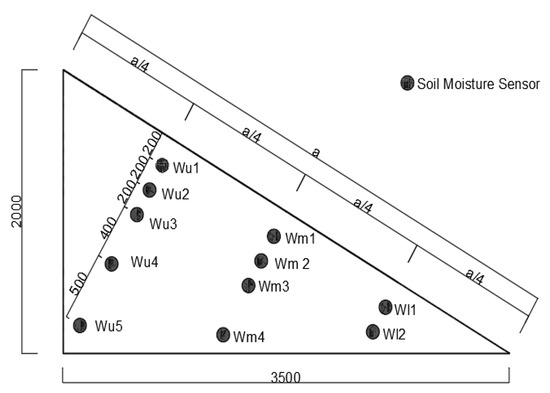
Figure 4.
Sensor arrangement diagram.
2.4. Ecological Substrate Matching Ratio
The two influencing factors studied in this test were cement content and substrate thickness. An amount of 8 ecological slopes were made, where the cement content was taken as 0%, 1%, 3% and 5% and the substrate thickness was taken as 0 cm, 1 cm, 3 cm and 5 cm, respectively. The slope designs are shown in Table 3. In order to avoid the influence of other factors on this test, conditions such as the amount of plant seeding, maintenance conditions, soil compaction and initial soil moisture content were kept consistent.
Table 3.
Characteristics of the test slope substrates.
2.5. Experimental Scheme
The simulated rainfall intensity of artificial rainfall in this experiment is 60 mm/h, the rainfall duration is 4 h and the selected plants are dogwood root (herb) and multiflowered magnolia (shrub). The artificial simulated rainfall experiment is shown in Figure 5; the sensor reading interval is set to 1 min/time before the rainfall starts. After the start of the rainfall, the rainwater collected by the runoff device is observed and the start of the runoff is noted when there is a continuous flow of water into the basin. The mass of water in the basin is weighed after 5 min of collection; the interval between each collection is 3 min. The runoff collection device is shown in Figure 6.
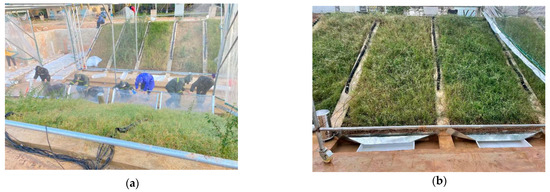
Figure 5.
Artificially simulated rainfall test map. (a) Top view; (b) Flat view.
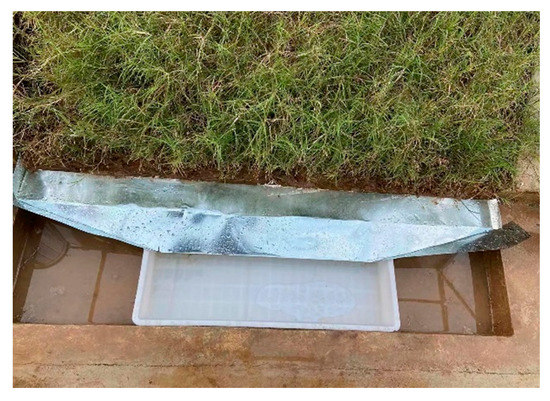
Figure 6.
Runoff collection devices.
3. Results and Analysis
3.1. Law of Slope Runoff
3.1.1. Law of Influence of Cement Content on Slope Runoff
Figure 7 shows that the slope runoff volume increases rapidly within 30 min after the production of flow, increases slowly within 30~100 min and tends to be stable after 100 min. The main reason for this change in runoff volume in the rainfall process is that, within a short period of time after the start of rainfall, the infiltration capacity of the soil is greater than the rainfall intensity and all the rainfall infiltrates into the soil, with no runoff produced on the surface. With rainfall, the water content of the surface soil increases, and the infiltration capacity of the soil rapidly decreases to less than the rainfall intensity due to the effect of raindrop striking and the filling of soil pores by fine particles, and the slope surface starts to produce runoff. The intensity of runoff increases rapidly. When the rainfall lasts for 30~100 min, the infiltration rate of soil tends to stabilize due to the changes in soil water content and soil surface pore condition, and the change in runoff volume tends to moderate. Combined with Table 4, it can be seen that when the thickness of the substrate is 3 cm, the presence of cement greatly affects the slope runoff generation time, runoff rate, average runoff rate and cumulative runoff rate. When the substrate is equipped with cement, the cement content increases by 1%, the runoff generation time decreases by 0.45 min, the steady state runoff rate increases by 51 mL·min−1, the average runoff rate increases by 42.5 mL·min−1 and the cumulative runoff rate increases by 10.18 L.
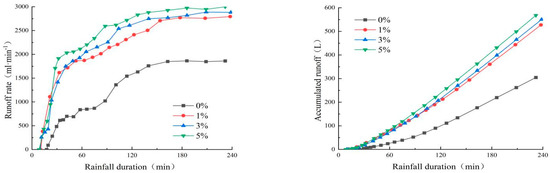
Figure 7.
Variation process of runoff and accumulated runoff under different cement content.
Table 4.
Values of each parameter without cement contents.
The time of slope runoff generation mainly depends on two factors: one is the average soil infiltration rate ia ≤ rainfall intensity p on the slope surface; and the other is the amount of water potential energy accumulated on the soil surface. In the early stage of rainfall, due to the role of plant retention, the actual effect of rainfall intensity on the slope surface p < average soil infiltration rate ia1. With the continuous effect of rainfall, the surface substrate gradually becomes wet, and as the surface substrate moisture content increases, the infiltration rate ia rapidly decreases until the infiltration rate ia2 ≤ in rainfall intensity p. At this time, the slope surface produces water and the water potential energy and the slope reaches a certain critical value. When a critical value is reached between the potential energy of ponding water and the slope, runoff is generated on the slope. In this test, the slope ratio of all experimental slopes is 1:1.75, and the rainfall intensity is 60 mm/h. Therefore, the time required for slope runoff generation actually depends on the size of the infiltration rate ia1. Obviously, as the cement content increases, the infiltration coefficient of the substrate decreases, the time required for the infiltration rate of the substrate from ia1 to ia2 decreases, and the time required for slope runoff generation is shorter.
3.1.2. Influence Law of Substrate Thickness on Slope Runoff
From Figure 8, it can be seen that the slope runoff volume increases rapidly within 30 min after the production of flow, increases slowly from 30 min to 160 min, and stabilizes after 160 min. The main reason for this change in runoff volume in the rainfall process is that, within a short period of time after the start of rainfall, the infiltration capacity of the soil is greater than the rainfall intensity and all the rainfall infiltrates into the soil, with no runoff produced on the surface. As rainfall progresses, the water content of the surface soil increases, the infiltration capacity of the soil rapidly decreases to less than the rainfall intensity due to the effect of raindrop strikes and the filling of soil pores by fine particles, and the slope surface starts to produce runoff. The variability in runoff volume with different substrate thicknesses is because the increase in substrate thickness leads to a decrease in rainwater volume through the substrate per unit time. As shown in Table 5, when the cement content in the substrate is 3%, the runoff generation time decreases by 0.53 min for each 1 cm increase in substrate thickness, the steady-state runoff volume increases by 158.5 mL·min−1, the average runoff volume increases by 123 mL·min−1 and the cumulative runoff rate increases by 22.17 L.
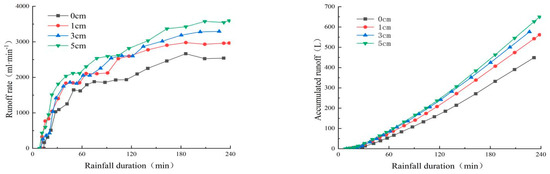
Figure 8.
Variation in runoff and cumulative runoff under different substrate thicknesses.
Table 5.
Parameter values without substrate thickness.
The variability of flow production time on slopes with different substrate thicknesses is due to the variability of rainwater permeation time through the substrate. Due to the different substrate thicknesses, the amount of water per unit time that rainwater permeates through the substrate and enters the subsoil is different, and the time required for the substrate infiltration rate to decrease to ia ≤ rainfall intensity p is also different. Obviously, in this test, as the substrate thickness increases, the shorter the time that is required for the substrate infiltration rate to decrease to ia ≤ rainfall intensity p, the shorter the time that is required for slope runoff generation.
3.2. Migration Law of Wetting Front
3.2.1. Influence Law of Cement Content on Wetting Front
The wetting front, as a uniformly wetted infiltration layer and completely non-infiltrated soil layer to separate the interface, can reflect the characteristics of the soil wetting body. The experiment will be a rapid increase in the soil moisture sensor moment recorded as the time of arrival of the wetting front. Different cement contents of the wetting front in the slope body in the direction of two positions to advance the distance and time relationship are shown in Figure 9. From the figure, with the increase in infiltration time, the slope wetting front’s rate of advancing distance becomes slower, and due to the formation of slope runoff and under the action of gravity, the advancing rate of the wetting front on the slope and in the slope is different, i.e., in the slope > on the slope. At any point in the whole observation time, the wetting advance distance of the slope decreases with increasing cement content.
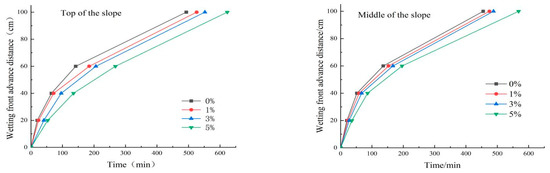
Figure 9.
The relationship between the distance and time of advancing the wetting front with different cement content.
The relationship between the migration rate of wetting fronts with different cement contents and time is shown in Figure 10, from which it can be seen that the migration rate of wetting fronts decreases rapidly from 0 to 150 min for each slope, the trend of decreasing migration rate of wetting fronts slows down from 150 min to 240 min and the migration rate of wetting fronts tends to be stable after 240 min.
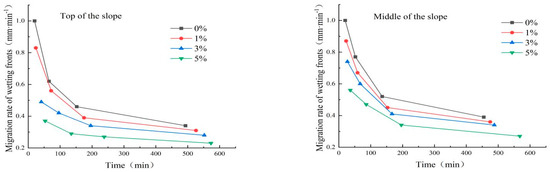
Figure 10.
Transport rate versus time for wetting fronts with different cement contents.
To further investigate the correspondence between the wetting front transport rate and time, the power function V = a·tb pair is fitted (a, b are constants), where V is the wetting front transport rate and t is time. The results of fitting the wet front transport rate versus time for different cement content slopes are shown in Table 6.
Table 6.
Fitted table of wetting front transport rate V versus time t.
The fitted coefficient of determination R2 is greater than 0.9721, which indicates that the transport rate of wetting fronts at different locations of slopes with different cement contents has a good power function relationship with time and shows the law that the parameter a decreases and the parameter b increases when the cement content increases, and the linear function y = m·x + n is used to fit the parameters a, b (m, n are constants), y is the power function parameters a and b and x is the cement content. The fitting results of different cement contents with power function parameters are shown in Table 7.
Table 7.
Fitting table of different cement contents with power function parameters.
As shown in Table 5, the fitting results of the relationship between different cement contents and power function parameters show that the fitted coefficient of determination R2 is greater than 0.9285, indicating that there is a strong linear relationship between cement content and power function parameters a and b. That is, the higher the cement content, the linearly decreasing parameter a and the linearly increasing parameter b. Combined with the previous functional relationship, the higher the cement content, the slower the migration rate of wetting fronts. Therefore, in the design of ecological slope substrates, increasing the cement content will help to inhibit the migration of wetting fronts. At the same time, using this linear relationship combined with the non-linear relationship between the migration rate of wetting fronts on the slope and time, the migration characteristics of wetting fronts can be predicted, which will be beneficial to the conservation of ecological slopes.
3.2.2. Influence Law of Substrate Thickness on Wetting Front
The relationship between the advancing distance and time of wetting fronts of different substrate thicknesses in the direction of two positions of the slope is shown in Figure 11. It can be seen from the figure that the rate of advancing distance of wetting fronts of each slope becomes slower as the infiltration time increases, and the advancing rate of wetting fronts on the slope and in the slope is different due to the formation of slope runoff and under the action of gravity, i.e., middle of slope > top of slope. At any moment throughout the observation time, the wetting advance distance of the slope decreases with increasing cement content.
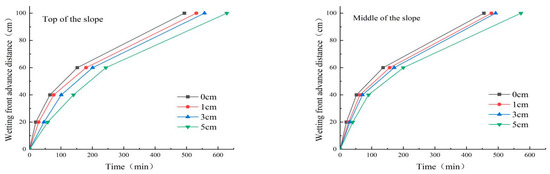
Figure 11.
Different substrate thickness wetting front advance distances versus time.
The relationship between the migration rate of wetting fronts and time for different substrate thicknesses is shown in Figure 12, from which it can be seen that the migration rate of wetting fronts decreases rapidly from 0 to 130 min for each slope, the trend of decreasing migration rate of wetting fronts slows down from 130 min to 240 min and the migration rate of wetting fronts tends to stabilize after 240 min.
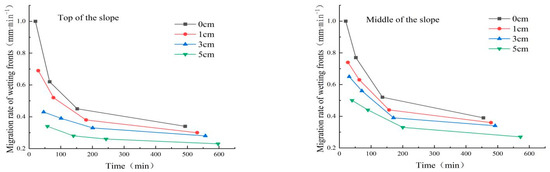
Figure 12.
The transport rate of wetting fronts with different substrate thicknesses versus time.
The power function V = a·tb pair was fitted (a and b are constants), where V is the wetting front transport rate and t is time. The results of fitting the wetting front transport rate versus time without the cement content slope are shown in Table 8.
Table 8.
Fitted table of wetting front transport rate V versus time t.
As shown in Table 6, the V-t relationship is fitted with a coefficient of determination R2 greater than 0.9605, which indicates that the wetting front transport rate has a good power function relationship with time at 2 positions on the slope and in the slope for different substrate thicknesses; moreover, there is a law that parameter a decreases and parameter b increases with increasing substrate thickness. The power function y = m·xn is used to fit the parameters a and b (m and n are constants), y is the power function parameters a and b and x is the thickness of the substrate. The results of fitting the relationship between different substrate thicknesses and power function parameters are shown in Table 9.
Table 9.
Fitting of different substrate thicknesses with power function parameters.
As shown in Table 9, the fitted results for the relationship between the different substrate thicknesses and the power function parameters show that the fitted coefficient of determination R2 is greater than 0.8263, indicating a non-linear relationship between the cement content and the power function parameters a and b. That is, as the thickness of the substrate increases, parameter a non-linearly decreases and parameter b non-linearly increases. In conjunction with the previous functional relationship, the thicker the substrate thickness, the slower the rate of wetting front migration. Therefore, in the design of ecological slope substrate, an appropriate increase in substrate thickness will help to suppress the migration of wetting fronts if it is beneficial to plant growth; at the same time, using this non-linear relationship combined with the non-linear relationship between the migration rate and time of wetting fronts on the slope, the migration characteristics of wetting fronts can be predicted, which will be beneficial to the protection of ecological slopes.
3.3. Influence Law of Substrate Characteristics on Water Infiltration Performance
3.3.1. Influence Law of the Cement Content on the Water Infiltration Performance of Ecological Slopes
After the soil infiltration process reaches stable infiltration, the stable infiltration rate can be used to characterize the soil infiltration capacity; however, before reaching stable infiltration, the cumulative infiltration volume is usually used to characterize the soil infiltration capacity, and the cumulative infiltration volume refers to the total amount of water infiltrated into the soil per unit surface area within a certain time period. From Figure 13, it can be seen that the variability of the accumulated infiltration volume of slopes with different cement contents in the range of 0–30 min is not significant, and the accumulated infiltration volume of soil increases rapidly with the rainfall time from 30 min to 150 min in the process of soil infiltration. The difference in cement content on the accumulated infiltration volume gradually appears, and the growth rate of accumulated infiltration volume shows a trend of 0% > 1% > 3% > 5%. After the soil infiltration is greater than 150 min, the cumulative infiltration curve of each slope reaches the stable infiltration stage, and the cumulative infiltration volume increases evenly with the rainfall calendar. The cumulative infiltration volume at the end of the rainfall is 0% > 1% > 3% > 5%, which is mainly because with the increase in cement content, the infiltration coefficient of the substrate decreases, the water infiltrated into the soil from the surface area per unit time decreases, and the infiltration capacity of the soil. This indicates that the increase in cement content in the substrate can significantly reduce the cumulative infiltration volume of the soil and the infiltration capacity of the soil, and the infiltration capacity of the soil decreases with the increase in cement content.
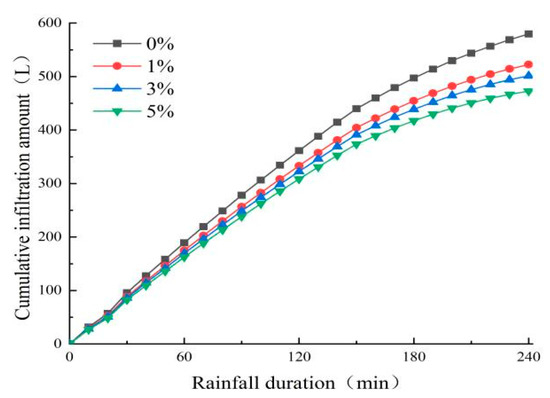
Figure 13.
Cumulative infiltration with rainfall time curve.
The soil infiltration rate is also one of the important indicators used to characterize the infiltration capacity of soil. From Figure 14, it can be seen that the infiltration rate of soil decreases rapidly within 0–150 min. After 150 min, the infiltration rate of soil does not change significantly with increasing infiltration time and is close to the stable state—that is, the infiltration time is identified as reaching the stable infiltration rate at approximately 150 min. The infiltration rate showed 0% > 1% > 3% > 5% at any time within 240 min, which means that the infiltration resistance of the slope increased with increasing cement content, and the initial infiltration rates of the 1%, 3% and 5% cement content slopes were 94.86%, 92.29% and 89.20% of the 0% slope, respectively, and the final infiltration rates were 87.36%, 81.04% and 73.45% of the 0% slope, respectively.
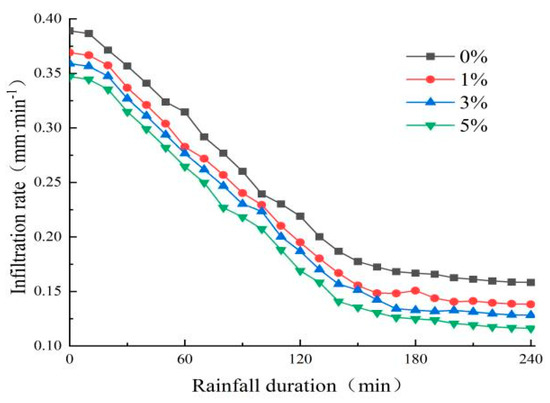
Figure 14.
Infiltration rate with rainfall time curve.
As demonstrated earlier, cement content is negatively correlated with the infiltration coefficient of the substrate. The infiltration pattern of soil water is highly dependent on the infiltration coefficient—that is, the higher the cement content, the lower the infiltration coefficient, the lower the rate of water infiltration and the lower the amount of infiltration. Therefore, in the design of ecological slope substrates, within the range that plants can adapt to growth, an appropriate increase in cement content will help the slope’s resistance to water infiltration and improve the stability of the slope.
3.3.2. Influence Law of Substrate Thickness on the Water Infiltration Performance of Ecological Slopes
From Figure 15, it can be seen that the variation in the accumulated infiltration volume of slopes with different substrate thicknesses in the range of 0–30 min is not significant, and the accumulated infiltration volume of soil in the process of soil infiltration increases rapidly after 30 min of rainfall time. The difference in substrate thickness on the accumulated infiltration volume gradually appears, and the growth rate of accumulated infiltration volume shows the trend of 0 cm > 1 cm > 3 cm > 5 cm. After the infiltration time of soil is more than 150 min, the cumulative infiltration curve of soil on each slope tends to stabilize the infiltration stage, and the growth rate of cumulative infiltration becomes slower with the rainfall calendar time. The result of cumulative infiltration at the end of rainfall is 0 cm > 1 cm > 3 cm > 5 cm, which is mainly because the water permeability of soil is much larger than the water permeability of substrate, and with the increase in substrate thickness, the water infiltrated from the surface of slope to soil in unit time decreases. With the increase in substrate thickness, the water infiltrated from the slope surface to the soil decreases within a unit time, which means that the increase in substrate thickness can obviously reduce the accumulated infiltration of soil and the water infiltration capacity of the slope.
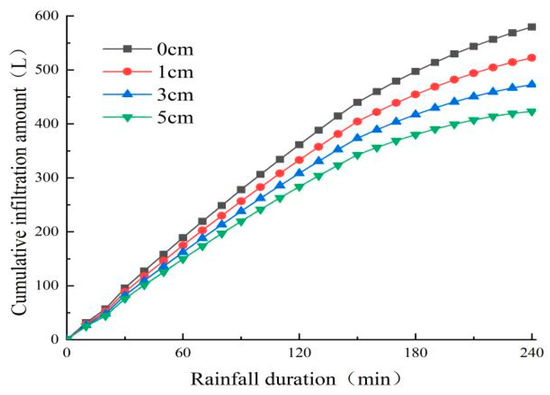
Figure 15.
Cumulative infiltration with rainfall time curve.
Figure 16 shows the change curve of infiltration rate of slope with rainfall calendar time without substrate thickness, from which it can be seen that the infiltration rate of soil decreases rapidly within 0–130 min. After 130 min, the infiltration rate of soil does not change significantly with the increase of infiltration time, and it is close to the stable state—that is, the infiltration time reaches the stable infiltration rate at approximately 130 min. The infiltration rate of each slope in the whole rainfall calendar is 0 cm > 1 cm > 3 cm > 5 cm, which indicates that the infiltration rate of slope decreases with the increase of substrate thickness, and the initial infiltration rate of 1 cm, 3 cm and 5 cm slopes are 94.86%, 91% and 87.15% of 0 cm slopes, respectively, and the final infiltration rate is 89.62%, 79.90% and 70.17% of 0 cm slopes, respectively.
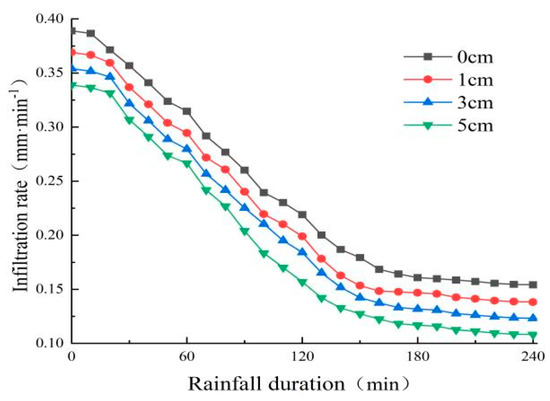
Figure 16.
Infiltration rate with rainfall time curve.
As mentioned earlier, the coefficient of permeability of the substrate is much lower than that of the soil, so the infiltration of water into the slope depends on the coefficient of permeability of the substrate. The coefficient of permeability is the same for different thicknesses of the substrate, but due to the increase in thickness, less water per unit time penetrates the slope through the substrate. Therefore, as the thickness of the substrate increases, the infiltration rate decreases and the amount of infiltration decreases. Therefore, in the design of the ecological slope substrate, it is beneficial to increase the thickness of the substrate to the extent that the plants can adapt to the growth, so that the slope can resist water infiltration and improve the stability of the slope.
4. Conclusions
This paper investigates the effects of different cement contents and substrate thicknesses on slope runoff, wetting front migration and infiltration on ecological slopes through artificial rainfall simulations with a large slope model. The test results show that the cumulative runoff volume and slope runoff rate are positively correlated with the cement content and substrate thickness during a continuous 4 h, 60 mm/h artificially simulated rainfall; specifically, the cumulative runoff volume for a 5% cement content slope is 185.51% of that for a 0% cement content slope, and the cumulative runoff volume for a 5 cm substrate thickness slope is 145.09% of that for a 0 cm slope.
The substrate inhibits the advance of the wetted front and the inhibition of the advance of the wetted front increases progressively with increasing cement content and substrate thickness. The transport rate of the wetting front at different locations on the slope shows that the middle of the slope > the top of the slope. The relationship between the wetting front migration rate and rainfall ephemeris can be expressed using the non-linear function V = a·tb, while the cement content is linearly related to parameters a and b, and the substrate thickness is non-linearly related to parameters a and b. Using these findings, it is possible to predict the wetting front transport characteristics of ecological slopes with different substrate characteristics in practical projects.
The substrate significantly reduces water infiltration into the slope, with the cumulative infiltration volume and infiltration rate decreasing with increasing cement content and substrate thickness. Specifically, the cumulative infiltration and stabilized infiltration rates for 5% cement content slopes are 81.58% and 73.45% of those for 0% slopes, while the cumulative infiltration and stabilized infiltration rates for 5 cm substrate thickness slopes are 73.01% and 70.17% of those for 0 cm slopes.
In practical engineering applications, increasing the cement content and substrate thickness in the substrate is beneficial to increase the infiltration resistance and stability of the slope, but as excessive cement content and substrate thickness can adversely affect the growth of plants, more research is needed to determine the optimal substrate mix ratio for engineering applications. The results of this study can facilitate the application of substrate design in slope ecological restoration projects.
Author Contributions
Validation, S.H. and X.Z.; Writing—original draft, Y.C.; Writing—review & editing, G.T. and H.X. All authors have read and agreed to the published version of the manuscript.
Funding
This work was supported by the National Natural Science Foundation of China (No. 52078195), the Joint Funds of the National Natural Science Foundation of China (No. U22A20232).
Informed Consent Statement
The study not involving humans.
Data Availability Statement
All data during the study were obtained through experiments and fitting equations in the paper.
Conflicts of Interest
The authors declare no conflict of interest.
References
- Westen, C.; Rengers, N.; Terlien, M.; Soeters, R. Prediction of the occurrence of slope instability phenomenal through GIS-based hazard zonation. Geol. Rundsch. 1997, 86, 404–414. [Google Scholar] [CrossRef]
- Cho, S.E.; Lee, S.R. Instability of unsaturated soil slopes due to infiltration. Comput. Geotech. 2001, 28, 185–208. [Google Scholar] [CrossRef]
- Wan, J.; Zhu, J.; Xiao, H.; Ma, Q. Study on Mechanical and Ecological Properties of Fly Ash Substrate for Ecological Slope Protection. Adv. Civ. Eng. 2019, 2019, 8095219. [Google Scholar] [CrossRef]
- Lou, G.; Zhong, Q.; Xie, J. Nanometer Montmorillonite Modified Fly Ash Ecological Slope Protection Material and Its Preparation and Application. J. Chem. 2020, 2020, 6953594. [Google Scholar] [CrossRef]
- Su, H.; Wu, D.; Lu, Y.; Peng, X.; Wang, X.; Chen, W.; Wang, S. Experimental and numerical study on stability performance of new ecological slope protection using bolt-hinge anchored block. Ecol. Eng. 2021, 172, 106409. [Google Scholar] [CrossRef]
- Huang, X.; Chen, X.; Lu, L.; Liu, J.; Xu, J. Application and Evaluation Methods of Vegetation Slope Protection Techniques of Channels. Environ. Sci. Technol. 2010, 33, 191–196. [Google Scholar]
- Taherynia, M.H.; Mohammadi, M.; Ajalloeian, R. Assessment of Slope Instability and Risk Analysis of Road Cut Slopes in Lashotor Pass, Iran. J. Geol. Res. 2014, 2014, 763598. [Google Scholar] [CrossRef]
- Huang, G.; Zheng, M.; Peng, J. Effect of Vegetation Roots on the Threshold of Slope Instability Induced by Rainfall and Runoff. Geofluids 2021, 2021, 6682113. [Google Scholar] [CrossRef]
- Terhorst, B.; Damm, B. Slope Stability and Slope Formation in the Flysch Zone of the Vienna Forest (Austria). J. Geol. Res. 2009, 2009, 589037. [Google Scholar] [CrossRef]
- Defersha, M.B.; Melesse, A.M. Effect of rainfall intensity, slope and antecedent moisture content on sediment concentration and sediment enrichment ratio. Catena 2012, 90, 47–52. [Google Scholar] [CrossRef]
- Yan, Y.; Dai, Q.; Yuan, Y.; Peng, X.; Zhao, L.; Yang, J. Effects of rainfall intensity on runoff and sediment yields on bare slopes in a karst area, SW China. Geoderma 2018, 330, 30–40. [Google Scholar] [CrossRef]
- Ng, C.; Zhan, L.T. Comparative study of rainfall infiltration into a bare and a grassed unsaturated expansive soil slope. Can. Geotech. J. 2011, 47, 207–217. [Google Scholar] [CrossRef]
- Kirkby, M.; Bracken, L.; Reaney, S. The influence of land use, soils and topography on the delivery of hillslope runoff to channels in SE Spain. Earth Surf. Process. Landf. 2002, 27, 1459–1473. [Google Scholar] [CrossRef]
- Frauenfeld, B.; Truman, C. Variable Rainfall Intensity Effects on Runoff and Interrill Erosion From Two Coastal Plain Ultisols in Georgia. Soil Sci. 2004, 169, 143–154. [Google Scholar] [CrossRef]
- Kutara, K.; Ishizuka, H. Seepage flow in the embankment and stability of slope furing rain. Soil Found. 1982, 30, 37–43. [Google Scholar]
- Oka, H. Impacts by the “artificial landslide”: Re-examine the rage of nature. Kagaku Asahi 1972, 32, 152–153. [Google Scholar]
- Hunger, O.; Morgenstern, N.R. Experiments on the flow behaviour of granular materials at high velocity in an open channel. Geotechnique 1984, 34, 405–413. [Google Scholar] [CrossRef]
- Kimura, T.; Takemura, J.; Suemasa, N.; Hiro-Oka, A. Failure of fills due to rain fall. Centrifuge 1991, 91, 509–518. [Google Scholar]
- Take, W.A.; Bolton, M.D.; Wong, P.C.P.; Yeung, F.J. Abridged translation of the paper from “Landslides”: Evaluation of landslide triggering mechanisms in model fill slopes. Landslides 2005, 42, 267–268. [Google Scholar] [CrossRef][Green Version]
- Iverson, R.M. Scaling and design of landslide and debris-flow experiments. Geomorphology 2015, 244, 9–20. [Google Scholar] [CrossRef]
- Zhang, X.; Yu, G.Q.; Li, Z.B.; Li, P. Experimental Study on Slope Runoff, Erosion and Sediment under Different Vegetation Types. Water Resour. Manag. 2014, 28, 2415–2433. [Google Scholar] [CrossRef]
- Bamutaze, Y.; Tenywa, M.M.; Majaliwa, M.; Vanacker, V.; Bagoora, F.; Magunda, M.; Obando, J.; Wasige, J.E. Infiltration characteristics of volcanic sloping soils on Mt. Elgon, Eastern Uganda. Catena 2010, 80, 122–130. [Google Scholar] [CrossRef]
- Zhu, H.; Wang, G.; Yinglan, A.; Liu, T. Ecohydrological effects of litter cover on the hillslope-scale infiltration-runoff patterns for layered soil in forest ecosystem. Ecol. Eng. 2020, 155, 105930. [Google Scholar] [CrossRef]
- Que, Y.; Lin, P.; Lin, D. Integrative Analysis of Surface Runoff and Macropore Flow for Slopes under Rainfall Conditions. Math. Probl. Eng. 2018, 2018, 9458410. [Google Scholar] [CrossRef]
- Zhang, C.; Shao, W.; Yue, F.; Saffari, P.; Nie, W. Physical Tank Experiment Investigation on Rainfall Producing Groundwater Level in Homogeneous Material Slopes. Geofluids 2019, 2019, 5368765. [Google Scholar] [CrossRef]
- Prodan, M.V.; Peranić, J.; Pajalić, S.; Arbanas, Ž. Physical Modelling of Rainfall-Induced Sandy and Clay-Like Slope Failures. Adv. Mater. Sci. Eng. 2023, 2023, 3234542. [Google Scholar]
- Moriwaki, H.; Inokuchi, T.; Hattanji, T.; Sassa, K.; Ochiai, H. Failure processes in a full-scale landslide experiment using a rainfall simulator. Landslides 2004, 1, 277–288. [Google Scholar] [CrossRef]
- Jagodnik, V.; Perani, J.; Arbanas, E. Mechanism of Landslide Initiation in Small-Scale Sandy Slope Triggered by an Artificial Rain. In Understanding and Reducing Landslide Disaster Risk; Springer: Cham, Switzerland, 2021. [Google Scholar]
- Yang, S.-R.; Huang, L.-J. Infiltration and Failure Behavior of an Unsaturated Soil Slope under Artificial Rainfall Model Experiments. Water 2023, 15, 1599. [Google Scholar] [CrossRef]
- Wei, X.; Gao, W.; Hu, R.; Gao, W.; Qiu, Y.; Li, Y. Forecasting the Failure Time of an Expansive Soil Slope Using Digital Image Correlation under Rainfall Infiltration Conditions. Water 2023, 15, 1328. [Google Scholar] [CrossRef]
- Chang, Z.; Luo, J.; Tang, Q.; Zeng, L.; Zhang, H.; Li, Y.; Yang, G.; Zhang, L. Ecological Protection Technology of Spraying Vegetation Concrete on Carbonaceous Rock Slope Experimental Research and Application. Adv. Civ. Eng. 2022, 2022, 2557131. [Google Scholar] [CrossRef]
- Tohari, A.; Nishigaki, M.; Komatsu, M. Laboratory Rainfall-Induced Slope Failure with Moisture Content Measurement. J. Geotech. Geoenvironmental Eng. 2007, 133, 575–587. [Google Scholar] [CrossRef]
- Greco, R.; Guida, A.; Damiano, E.; Olivares, L. Soil water content and suction monitoring in model slopes for shallow flowslides early warning applications. Phys. Chem. Earth Parts A/B/C 2010, 35, 127–136. [Google Scholar] [CrossRef]


Disclaimer/Publisher’s Note: The statements, opinions and data contained in all publications are solely those of the individual author(s) and contributor(s) and not of MDPI and/or the editor(s). MDPI and/or the editor(s) disclaim responsibility for any injury to people or property resulting from any ideas, methods, instructions or products referred to in the content. |
© 2023 by the authors. Licensee MDPI, Basel, Switzerland. This article is an open access article distributed under the terms and conditions of the Creative Commons Attribution (CC BY) license (https://creativecommons.org/licenses/by/4.0/).