Abstract
Cotton cationization with low molecular weight or polymeric cationic modifiers allows the effective dyeing of cotton substrates with reactive dyes under salt-free and more environmentally friendly conditions. The current work focuses on the spectroscopic study of the intermolecular interactions, which dictate the physicochemical process associated with fabric dyeing. Water-soluble cationic copolymers of vinyl benzyl chloride (VBC) and vinyl benzyl triethylammonium chloride (VBCTEAM) have been used as cellulose cationic modifiers. Dye uptake was assessed using Remazol Brilliant Blue R and Novacron Ruby S-3B dyes. The study involves ATR-FTIR, UV-Vis, fluorescence, and XPS spectroscopy. The results of binary polymer-rich dye-polymer aqueous solutions or dye-polymer precipitates at stoichiometric charge-ratio revealed that the sulfonate/sulfate anions of the dyes interact with the cationic VBCTEAM units of the polymer via electrostatic interactions. Moreover, the comparative study of dye application on modified and unmodified fabrics suggests that, unlike the latter, where dyes are chemically bound to cellulose, electrostatic forces dominate the interaction of modified fabrics with dye molecules.
1. Introduction
Currently, dyeing cotton fabrics is performed using mostly reactive dyes. These dyes, such as Novacron Ruby S-3B and Remazol Brilliant Blue R (Scheme 1a,b), contain reactive groups able to form covalent bonds with cellulose under alkaline conditions and they are preferred for cotton dyeing applications due to the improved wash-fastness properties and ease of application [1,2]. However, reactive dyes are usually anionic and a large amount of electrolytes is needed to screen the repulsive forces between the negative charges of both cotton and dye molecules under dyeing conditions; this leads to low dye retention (~50%) and to hydrolysis of a significant amount of the remaining dye. In addition, this process raises environmental concerns, because of the discharge of a highly colored and saline dye bath [2,3].
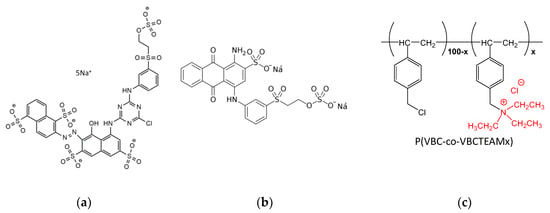
Scheme 1.
Chemical structure of (a) Novacron Ruby S-3B, (b) Remazol Brilliant Blue R, and (c) the cationic modifiers P(VBC-co-VBCTEAMx).
In the past 20 years, numerous efforts were focused on the cationization of cotton before the dyeing process [4,5,6,7,8]. Most of these studies used low molecular weight cationic compounds, such as 3-chloro-2-hydroxypropyl trimethylammonium chloride, and CHPTAC [1,9,10,11,12,13,14,15,16]. Cationization of cotton results in the charged inversion of the cotton surface and the dye is now attracted electrostatically. Though the cationization of cotton with low molecular weight compounds is a very important process in terms of cost and environmental impact (since the use of salt is avoided), it has significant drawbacks, such as uneven dyeing and poor thermal stability [17], in addition to toxicity or unpleasant odor.
Cationic polyelectrolytes have been also proposed as cationic cotton modifiers [18,19,20,21,22,23,24]. In most cases, covalent attachment of polymer onto the cellulose surface is assured through cellulose-initiated polymerizations [25,26,27,28,29,30] and rarely on the reaction of cellulose with cationic copolymers bearing reactive units, like glycidyl methacrylate (GMA) [6].
We have recently shown [31] that properly designed cationic copolymers based on 4-vinyl benzyl chloride (VBC) may be effectively used as cationic cotton modifiers. In fact, the partial cationization of VBC with triethylamine, TEAM, leads to bifunctional cationic copolymers P(VBC-co-VBCTEAMx) of VBC with 4-vinyl benzyl triethylammonium chloride, VBCTEAM (Scheme 1c). The bifunctional operation of these polymers allows their partial chemical bonding with cellulose through the VBC units and ensures; on the other hand, they have strong dyeing capabilities through the cationic VBCTEAM units. Hence, the molar ratio between VBCTEAM and VBC segments designates dye uptake of the modified fabric and modifier grafting on cellulose accordingly. Polymers offer additional properties with respect to other low molecular weight cationic modifiers not only by assuring more uniform dyeing, lower processing costs, and stability but because their structure may be manipulated in order to accomplish grafting/dye uptake/other, e.g., antimicrobial properties with optimal performance.
To further improve cotton dyeing processes, a major challenge is to get a deeper understanding of cationic modifier—dye interactions. To this end, we took advantage of a variety of spectroscopic techniques, such as UV-Vis and fluorescence spectroscopies, ATR-FTIR vibrational spectroscopy, and X-Ray Photoelectron spectroscopy (XPS), for the study of binary dye-polymer mixtures both in aqueous solution and in a solid state, as well as of cationized cotton substrates dyed with reactive dyes. To elucidate the influence of the charge density of the cationic modifier, the homopolymer poly(4-vinyl benzyl triethylammonium chloride), PVBCTEAM (Scheme 1c, x = 0), and the copolymer P(VBC-co-VBCTEAM53) containing 53% mol VBCTEAM units (Scheme 1c, x = 53) were selected. Moreover, in order to explore the importance of the charge density of the dye, the reactive dyes Novacron Ruby S-3B and Remazol Brilliant Blue R bearing two and five negatively charged groups, respectively, were chosen for the study.
2. Materials and Methods
2.1. Materials
The homopolymer poly(4-vinyl benzyl triethylammonium chloride), PVBCTEAM, and the copolymer P(VBC-co-VBCTEAM53), containing 53% mol VBCTEAM units, were synthesized and characterized as mentioned elsewhere [31]. The reactive dyes: Remazol Brilliant Blue R (C.I 61200/CAS 2580-78-1) and Novacron Ruby S-3B (C.I reactive red mixture-89157-03-9; 718619-88-6) were purchased from Huntsman International LLC. The composition of the second dye mixture is not exactly known; however, our XPS data indicate a major contribution of the 718619-88-6 component. Cotton fabrics were kindly granted from COLORA S.A. Double jersey knitted (Rib 1 × 1 alignment, knot length 4.4 mm) pure cotton fabrics have been used, avoiding the application of alkali bleaching. The NaCl and NaOH were both purchased from Sigma-Aldrich (Steinheim, Germany). Ultrapure water was obtained by a Milli-Q RG apparatus water purification unit.
2.2. Sample Preparation
2.2.1. Binary Systems
Aqueous stock solutions of the polymers and the dyes were initially prepared. Appropriate volumes of polymer and dye solutions were then mixed to achieve the desired dye/polymer charge ratio, D−/P+. All four dye-polymer combinations were examined. For low D−/P+ charge ratios (excess of polymer charges), the solutions remained homogeneous for a sufficient period allowing the UV-Vis and fluorescence spectroscopic investigation. Representative photos of the solutions are given in Figure S1.
For D−/P+ charge ratios close to the stoichiometry, precipitation occurred immediately and left to proceed for 24 h. The colored solid precipitates were collected using a 0.2 μm porous filter and were characterized by ATR-FTIR and XPS spectroscopy. The Whatman® Anodisc inorganic filter (diameter 25 mm, pore size 0.2 μm, no autoclavable) used for this purpose, as well as the Whatman® plastic filter holders (Swin-Lok Holder, diameter 25 mm) were purchased from Merck Chemical Company. The binary systems investigated are summarized in Table 1.

Table 1.
The binary systems investigated.
2.2.2. Ternary Systems
Focusing on the surface modification of cotton substrates with cationic polymers and then on the subsequent dyeing of these fabrics, in Sections S1 and S2 the used protocols are given, which have been already mentioned elsewhere [31]. Four dyed fabrics were obtained. Two samples were modified with the homopolymer PVBCTEAM and dyed with either Remazol Brilliant Blue R or Novacron Ruby S-3B. Similarly, two samples were modified with the copolymer P(VBC-co-VBCTEAM53) and dyed with the two dyes. For comparison, the dyeing of unmodified cotton fabrics with the same protocol, in the absence or presence of NaCl, was also performed and studied (Section S2).
2.3. Analytical Techniques
2.3.1. Scanning Electron Microscopy (SEM)
High-resolution field-emission scanning electron microscopy (FE-SEM) revealed the morphological features of the materials. A Zeiss SUPRA 35VP system operating at 5 kV voltage was used for this purpose.
2.3.2. Attenuated Total Reflection Fourier Transform Infrared Spectroscopy (ATR-FTIR)
The ATR-FTIR spectra of solid samples were recorded on an Alpha-II Diamond ATR Spectrometer of Bruker Optics GmbH (Ettlingen, Germany).
2.3.3. X-ray Photoelectron Spectroscopy (XPS)
X-ray photoelectron spectroscopy measurements were performed in UHV (Pressure ~5 × 10⁻¹⁰ mbar) system equipped with a hemispherical electron analyzer (SPECS, Phoibos 100-1D-DLD) and a non-monochromatized dual-anode Mg/Al X-ray gun. Survey and narrow scans of C 1s, O 1s, N 1s, S 2p, Na 1s, and Cl 2p spectra were recorded by using the X-ray source MgKα at 1253.6 eV photon energy. Two analyzer pass energies were used, 10 eV and 20 eV, giving a full width at half maximum (FWHM) of 0.85 eV and 1.0 eV for the Ag3d5/2 line, respectively. Spectra were accumulated and fitted using commercial software (SpecsLab Prodigy; Specs GmbH, Berlin, Germany). The XP core level peaks are deconvoluted with a mixed Gaussian–Lorentzian function after a Shirley background subtraction. Novacron Ruby S-3B and Remazol Brilliant Blue R dyes have been characterized after being drop cast. Each dye was dissolved in triple distilled water and dried on a glass substrate, which had a coating of Indium–Tin Oxide (ITO) on its surface. The coating offered electrical conductivity to the substrate, reducing the chances of electrical charging occurring when measuring the samples.
2.3.4. UV-Vis and Fluorescence Spectroscopy
The interaction of dye–polymer binary systems in an aqueous solution was studied by UV-Vis spectroscopy using a Hitachi U-3000 spectrophotometer (Hitachi High-Technologies Europe GmbH, Mannheim, Germany). All UV-Vis measurements were performed in air using quartz cuvettes. Fluorescence measurements were obtained by a Cary Eclipse Fluorescence Spectrophotometer G9800A (Agilent Technologies, Burlington, VT, USA). Excitation was set at 240 nm and the collection was at 90° from a cuvette filled with the aqueous solution of the binary mixture that has been stirred for a few minutes. Both UV-Vis and fluorescence measurements were performed in the air using quartz cuvettes.
3. Results and Discussion
3.1. Characterization of Reactive Dyes
The XPS spectra collected from Novacron Ruby S-3B reactive dye in the spectral range of C1s, Cl2p, N1s, Na1s, and S2p orbitals are shown in Figure 1. The C1s spectral region may be fitted using three major peaks: (i) one attributed to C atoms participating in the benzene/naphthalene rings (284.5 eV), (ii) a second peak attributed to the C-S bond (285.2 eV), and (iii) a third one associated with C atoms attached to the quaternary nitrogen atom, the O atom or/and the Cl0 atom (286.2 eV) [32,33,34]. The N1s spectral region can be fitted with two peaks of non-quaternized nitrogen atoms. The main peak is attributed to either C-N-C or/and C=N-C and is found at 400 eV, while the weaker one attributed to either NH2 or N=N is observed at ~398.9 eV [35,36].
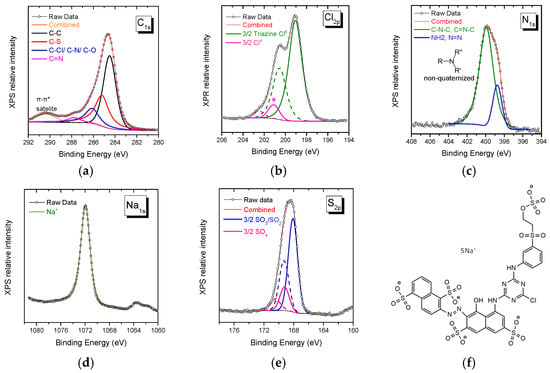
Figure 1.
XPS spectra of Novacron Ruby S-3B in the spectral region of: (a) C1s, (b) Cl2p, (c) N1s, (d) Na1s, and (e) S2p. The molecular structure of the reactive dye is given in (f). The doublet of weak Cl peaks in (b) denoted by * had to be included in the fitting and may be explained as in reference [37].
The sodium counterions are observed in the Na1s spectral region (1071.9 eV), while in both Cl2p and S2p regions, doublets are recorded. The first doublet at ~199.0 eV is assigned to Cl0 attached to the triazine ring, while in the sulfur 2p spectral region, a twin doublet is assigned to -SO2-/SO3− contribution at 168 eV and to SO4− at 169.2 eV [14,15]; the intensity ratio of the two peaks is ~4/1, in close agreement with the chemical structure of the dye, Figure 1f.
XPS spectra of Remazol Brilliant Blue R reactive dye of C1s, S2p, N1s, Na1s, and O1s orbitals’ characteristic spectral regions are shown in Figure 2. For this dye, as for the previous one, the stoichiometry derived from peak intensity ratios is close to the corresponding structure at the molecular level. Notice that there is no signal in the Cl2p spectral region and for the S2p doublets the intensity ratio of the -SO2-/SO3− to -SO4- species is ~2/1, in agreement with the structure given in Figure 2f.
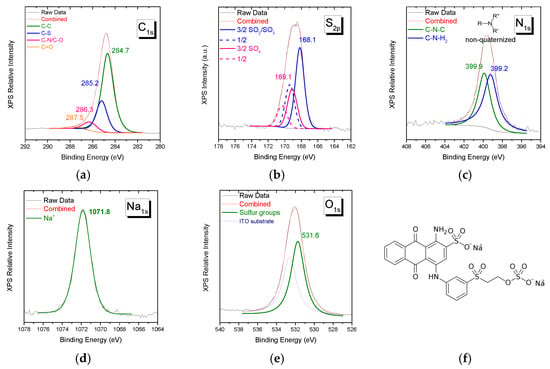
Figure 2.
XPS spectra of Remazol Brilliant Blue R in the spectral region of (a) C1s, (b) S2p, (c) N1s, (d) Na1s, and (e) O1s. The molecular structure of the reactive dye is given in (f).
The characteristic ATR-FTIR vibrational bands of both reactive dyes in the solid phase can be identified in Figure 3. The spectral contribution of major structural groups, such as benzene/naphthalene/anthraquinone rings, chloro-triazine, and sulfone/sulfonate/sulfate is found in the 950–1650 cm−1 region; the most characteristic of them are listed in Table 2.
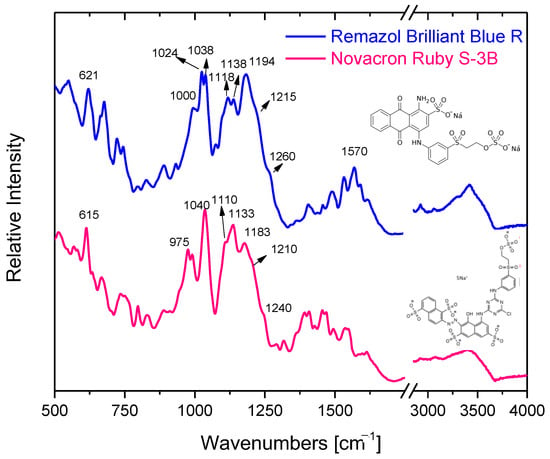
Figure 3.
ATR-FTIR spectra of the reactive dyes Novacron Ruby S-3B and Remazol Brilliant Blue R.

Table 2.
Suggested ATR-FTIR band assignment for the dyes Novacron Ruby S-3B and Remazol Brilliant Blue R.
The bands at 1040 cm−1 and 1183 cm−1 (1038 cm−1 and 1194 cm−1 for Remazol Brilliant Blue R) can be assigned as symmetric and antisymmetric stretching vibration of the sulfonate (SO3−) group, respectively. In the same manner, the symmetric stretching vibration of the O=S=O group, which can be found separated or/and in the sulfate SO4− group, is found at 1110 cm−1, while the antisymmetric one at 1210 cm−1 (1118 cm−1 and 1215 cm−1 for Remazol Brilliant Blue R).
3.2. Interaction between the Cationic Modifiers and the Reactive Dyes
3.2.1. Investigation of Dye-Polymer Aqueous Solutions through UV-Vis and Fluorescence Spectroscopy
Intermolecular interactions may affect the electronic properties of the molecular moieties with an apparent alteration of their optical absorption as well as fluorescence spectra [44,45,46,47]. Both reactive dyes used in the current study contain anionic SO3− and SO4− groups, able to interact electrostatically with the cationic VBCTEAM units of the polymers. The dye with the most available interactive sites with the VBCTEAM units of the polymers is Novacron Ruby S-3B; five sites versus two for the case of Remazol Brilliant Blue R. However, for all dye-polymer combinations, homogeneous solutions were obtained for sufficiently low D−/P+ charge ratios. Therefore, we have chosen a fixed charge ratio for all binary systems, D−/P+ = 1/5, (the nominal dye negatively charged sites equal 20% of the cationic polymer sites). The absorbance and fluorescence spectra were recorded from these solutions and compared with the respective spectra of the solutions of the individual constituents.
Figure 4a depicts the UV-Vis spectra of aqueous solutions of PVBCTEAM, Novacron Ruby S-3B dye, and the respective binary system with D−/P+ = 1/5. The polymer absorption bands at 224 and 261 nm are only hardly resolved in the binary system spectra. Concerning the absorption bands of the dye, these are shifted to higher wavelengths in the binary system; depending on the transition, this redshift varies (2–15 nm), having a greater value for the n-π* type of transition(s) observed at ~500–550 nm. Alterations in the relative intensity of the bands can be resolved; however, they are not significant. Respective spectra were acquired for all dye-polymer combinations. Similar trends were noticed in all cases.
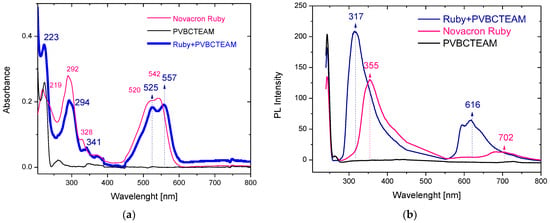
Figure 4.
UV-Vis (a) and fluorescence (b) spectra of aqueous solutions of PVCTEAM, Novacron Ruby S-3B, and their binary system.
In agreement with the absorption spectra, the fluorescence spectra (Figure 4b) of the corresponding systems exhibit spectral shifts as well. In this case, however, blueshifts are observed along with a considerable intensity increase. Hence, shifts in the range of 35–90 nm were observed in the binary system of Novacron Ruby S-3B and PVBCTEAM along with an intensity increase of the fluorescent peaks by ~65%. Similar observations were noticed for all dye-polymer combinations.
3.2.2. Investigation of Dye-Polymer Precipitates through ATR-FTIR Spectroscopy
From the previous discussion, it is evident that the electronic properties of the binary mixture deviate from those of the dye itself, which in turn suggests that any relevant experimental technique will in principle indicate the existence of the interaction between the reactive dye and the cationic polymer. Alterations in the respective vibrational modes may exist as well. To perform vibrational studies, such as ATR-FTIR spectroscopy, solid samples were obtained by setting the mixing dye/polymer charge ratio, D−/P+, equal to unity. Under these conditions, as mentioned, a colored solid precipitate is formed, readily recovered through filtration.
Figure 5a shows the ATR-FTIR spectra of the Novacron Ruby S-3B reactive dye, the cationic polymer P(VBC-co-VBCTEAM53), and their binary system, all in the solid state. The spectra are rather complicated; however, the bands in the 1400–1500 cm−1 spectral range, are attributed to benzene/naphthalene and triazine ring deformations. Since these modes are expected to be less affected by the intermolecular interactions with the cationic polymer (at least compared to the vibrational modes attributed to the anionic sites of the reactive dyes), these bands were considered reference bands. After the normalization of the spectra, the most interesting changes are the relative intensity of the symmetric stretching vibrations of SO3− (1040 cm−1) and SO4− (1110 cm−1) with respect to the asymmetric ones (1183 cm−1 and 1205 cm−1) observed in detail in Figure 6a. Similar results were obtained for the binary system of NR-homo, Figure 5b and Figure 6b.
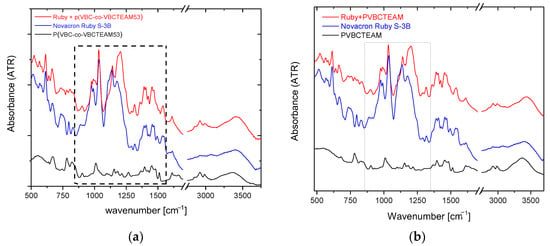
Figure 5.
ATR-FTIR spectra of the dye-polymer precipitate of the binary systems of (a) P(VBC-co-VBCTEAM53) and (b) PVBCTEAM with Novacron Ruby S-3B. The spectra of the constituents are also given for comparison.
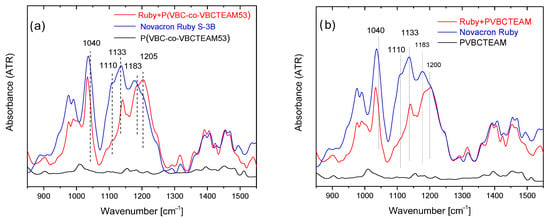
Figure 6.
Detailed ATR-FTIR spectra of the dye-polymer precipitate of the binary systems of (a) P(VBC-co-VBCTEAM53) and (b) PVBCTEAM with Novacron Ruby S-3B in the 900–1500 cm−1 spectral region. The spectra of the constituents are also given for comparison.
Identical spectral behavior can be observed referring to the P(VBC-co-VBCTEAM53) or PVBCTEAM and Remazol Brilliant Blue R precipitate (Figure 7). Both intensities of the symmetric stretching vibrations of SO3− and SO4- groups have decreased (1038 cm−1 and 1120 cm−1, respectively), with respect to the intensity of the asymmetric vibrations at 1194 cm−1 and 1215 cm−1.
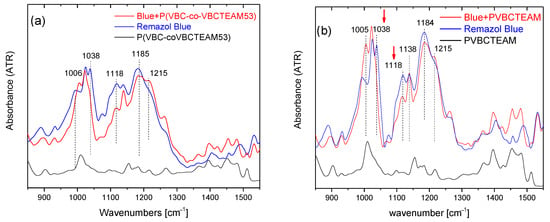
Figure 7.
ATR-FTIR spectra of the dye-polymer precipitate of the binary systems of (a) P(VBC-co-VBCTEAM53) and (b) PVBCTEAM with Remazol Brilliant Blue R. The spectra of the constituents are also given for comparison.
All these spectral differentiations may lead to the early conclusion that changes happen in the counterion of the sulfate/sulfonate anionic groups of the dye molecules. The Na+ counterions of the dyes probably have been replaced by the quaternary N+ groups of VBCTEAM units of the polymers; the latter induces changes in the symmetry of these sulfate/sulfonate species affecting their vibrational behavior.
The work of Shishlov and Khursan [48] focuses on the comparison between experimental and calculated vibrational spectra of benzenesulfonate salts, which are molecular units similar to some of the most characteristic ones of the reactive dyes in the current work; therefore, their findings may be applied on the study of pristine dyes and their binary system with cationic polymers. The authors stated that bidentate species introduce splitting of the asymmetric SO3- vibrational band with the two generated modes well separated by >150 cm−1. On the contrary, in more symmetric species, such as tridentate or dimers, the corresponding splitting is not so profound. The authors also described that for the organic sulfonic species, the coordination of sulfate/sulfonate ions with cationic counterparts is complex and depends on the environment. Considering the complexity of the dye molecules and their FTIR spectra it is ambiguous to explain the spectral alterations. Nevertheless, it is evident that the interaction of the reactive dyes with the cationic polymers involves an exchange of the cationic counterpart Na+ with the quaternary N+ groups of VBCTEAM units, which in turn critically affects the symmetry of the sulfate/sulfonate species.
3.2.3. Investigation of Dye-Polymer Precipitates through XPS Spectroscopy
The estimation of the ratio between the species of dyes and the VBCTEAM units in the solid precipitates is of importance since it evaluates the number of dye molecules that each polymeric chain can uptake. This factor is not straightforward, and it is critical in terms of both scientific knowledge and applications since each dye possesses different active sites and may pose specific steric hindrances when interacting with the polymer chains.
The solid precipitates obtained at a mixing dye/polymer charge ratio fixed at D−/P+ = 1 were investigated through XPS spectroscopy. Figure 8 depicts the N1s spectral region of the XPS spectrum of the NR-copo precipitate. The accumulated spectrum consists of bands assigned to both quaternary and non-quaternary nitrogen atoms. The non-quaternary nitrogen contribution at 399.5 eV is attributed to the dye Novacron Ruby S-3B, a band that is well separated from the respective one of the quaternized nitrogen of VBCTEAM units located at a binding energy of 402 eV. This separation can be useful not only for qualitative but also for quantitative analysis in the case of binary system study or/and the study of dyed cotton (see Section 3.3). Regarding this particular binary system, an almost equal amount of nitrogen contribution can be detected (N+/N~1.2/1). Considering that this dye contains seven nitrogen atoms, whereas the VBCTEAM unit contains only one nitrogen atom, this result indicates a ratio of one Novacron Ruby S-3B dye molecule for every ~5.8 VBCTEAM units, namely close to stoichiometric charge ratio, since the dye contains five negatively charged units. The same ratio value was estimated for the binary system of the same dye with PVBCTEAM (NR-homo) after the calculation of the corresponding intensity ratio in the spectrum shown in Figure S2.
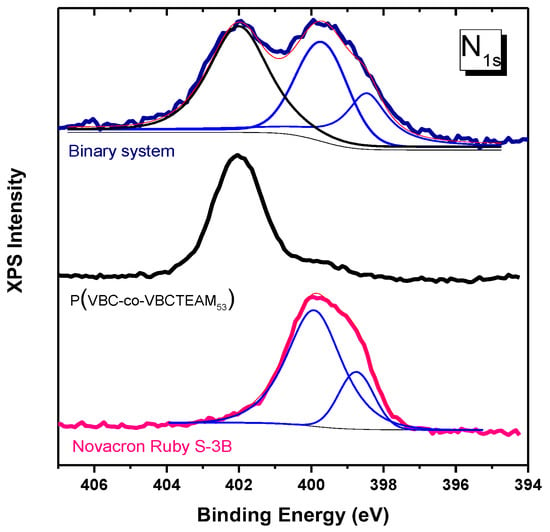
Figure 8.
XPS spectra of Nitrogen orbital 1 s for the copolymer, the dye Novacron Ruby S-3B and the binary system. Thin lines represent constituent peaks after a fitting process (blue colored) and their sum (pink colored).
Sulfonates (SO3−) and sulfate (SO4−) of the Novacron Ruby S-3B molecule in Figure 9a have some noticeable differences when compared to the corresponding spectrum of Remazol Brilliant Blue R binary system. These slight changes are attributed to the differentiation of the chemical environment of the anionic groups, after the electrostatic interaction. In this direction, 0.2–0.3 eV increase at FWHM of the overall sulfur peak can be justified, while the peak position remains constant. These changes are mainly found in the Novacron Ruby S-3B system that contains four sulfonate groups, in which some may not interact due to steric hindrance.
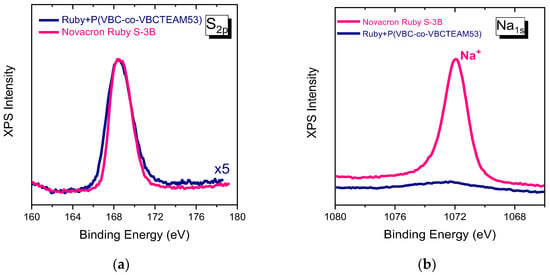
Figure 9.
XPS spectra of Sulfur orbital 2p (a) and Sodium 1 s (b) for Novacron Ruby S-3B dye and the binary system.
The sodium 1s orbital peak at 1072 eV, in Figure 9b, is particularly strong in the Novacron Ruby S-3B spectrum indicating the counterions of the existing five anionic sites, while it is very weak in the case of the binary system.
In the chlorine 2p orbital peak in Figure 10, there are multiple contributions of chlorines Cl0 of both the Novacron Ruby S-3B dye (199 eV) and VBC units for the case of the cationic copolymer (200 eV), while the chlorine counterions Cl- of VBCTEAM units are observed at 197 eV. In the case of the binary system, the Cl- contribution is severely depressed.
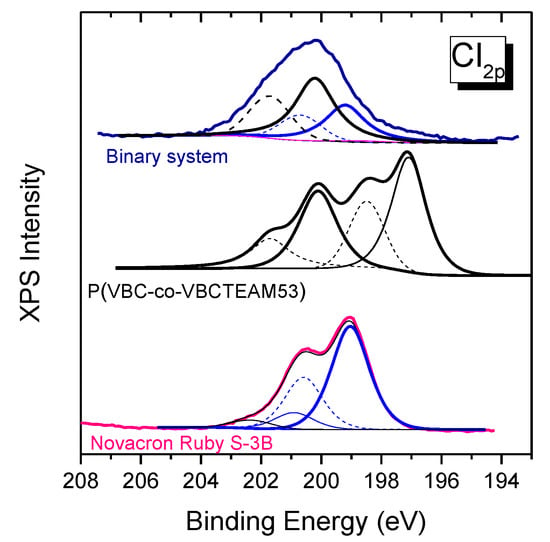
Figure 10.
XPS spectra of the chlorine orbital 2p for the copolymer, the Novacron Ruby S-3B dye and the dye-polymer precipitate. Peaks in solid lines, obtained after fitting, correspond to the modifier (black color) and the dye (blue color) Cl 2p3/2 peaks. Dashed lines represent the Cl 2p1/2 for each case.
This disappearance of both sodium (dye) and chlorine (polymer) counterions indicates the strong tendency for the cationic polymer to interact with the reactive dye through electrostatic interactions. The replacement of Na+ ions with the cationic units of the polymer in the binary system is in agreement with the ATR-FTIR spectroscopic results that indicate alterations in the local environment of the sulfonate/sulfate groups.
The same arguments hold for all the different binary systems studied. It is interesting to note that for the case of Remazol Brilliant Blue R, from the respective spectra of Figure S2 it is calculated that the ratio of VBCTEAM units per dye molecule is ~3.5 when binding with PVBCTEAM and ~2 when binding with P(VBC-co-TEAM53). The lower ratio values for Remazol Brilliant Blue R, compared to the respective values for Novacron Ruby S-3B, can be explained by the different number of anions in their structure (2 for Remazol Brilliant Blue R and 5 for Novacron Ruby S-3B) as well as by the difference in the size of the dye molecules.
3.3. Role of the Cationic Modifier in the Dyeing Process of Cotton
The general reaction mechanism of reactive dyes with unmodified cellulose surfaces consists of two major steps. First, the physical contact of the molecules through the sorption of dyes from the dye bath on the cotton fiber, and second, the chemical reaction with the cellulose. The reaction proceeds only in the presence of an alkaline bath which is used to activate the cellulose reactive site (fixation phase) [49,50]. Vinyl sulfone is the reactive group of both dyes used in the present study. In fact, during the dyeing process, the masking sulfate group is removed by a 1,2-trans elimination reaction, to form the free vinyl sulfone group, able to react with fiber nucleophiles by the Michael addition reaction [33]. Vinyl sulfone dyes are applicable at the range of 40–60 °C [51]. Novacron Ruby S-3B is bifunctional since it contains also one chloro-triazine reactive site, able to react with cellulose through the classical SN2 bimolecular substitution from a nucleophilic attack of the electron-rich oxygen in the cellulosate anion on electron-deficient carbon atoms in the triazine heterocycle (chlorine leaving group). The most important disadvantage of this dye category is the increased requirement of alkaline concentration (sodium carbonate) and temperature (80 °C) in the dye bath [49,50,51].
When investigating the role of cationic modification of cotton, it is necessary to understand the effect on increasing the retention of dye. To demonstrate the capabilities of cotton modification with the present cationic modifiers, we applied the same dyeing protocols on modified and unmodified fabrics. The protocol involved high and low temperatures with and without salt (Section S2). Cationization resulted in fibers characterized by a thin modified layer. The thickness of the modified layer is so small that spectroscopic techniques, such as FTIR and Raman scattering with a penetration depth of very few microns, offer marginal information, and extremely sensitive surface techniques, such as XPS, could identify and provide insight into the physical chemistry associated with the modification process. This argument is also supported by scanning electron microscopy images (Figure S1), where the morphology of untreated, dyed untreated, and dyed treated fibers remains similar in the scale of hundred nm. This observation indicates that both modifier and dye are covering just a few nm of the fibers’ surface, which is similar to the order of XPS electron escape depth.
The quantity of dye retained on the cellulose fibers’ surface can be qualitatively extracted by XPS and more clearly in the carbon 1s spectral region. XPS spectra obtained from the samples after the dyeing process (using Novacron Ruby S-3B) in this particular spectral region can be seen in Figure 11. The most characteristic peak of cotton is the one at 286.6 eV; we use this peak as an internal standard in order to semi-quantify the degree of modification as well as of dyeing, taking into account that both modifier and dyes exhibit a characteristic band at ~285 eV. We thus observe a small intensity increase of the latter band after dyeing unmodified cotton at ambient temperatures. This small intensity increase agrees well with the macroscopic poor fabric color intensity (Figure 12), while similar color intensity is observed in the modified fabrics with the copolymer. Modified fabrics exhibit strong contributions in the ~285 eV band indicating grafting of the cationic polymer to the cellulose fibers, while subsequent dyeing of the modified fabric resulted in a further increase of the same band intensity. The ability of the XPS to semi-quantify the quantity of dye on fabrics may be furthermore demonstrated in the inset of Figure 11 where small differentiation of the 285 eV intensity is resolved for fabrics dyed with and without salt at ambient temperatures, the first of which was characterized by slightly better retention of dye.
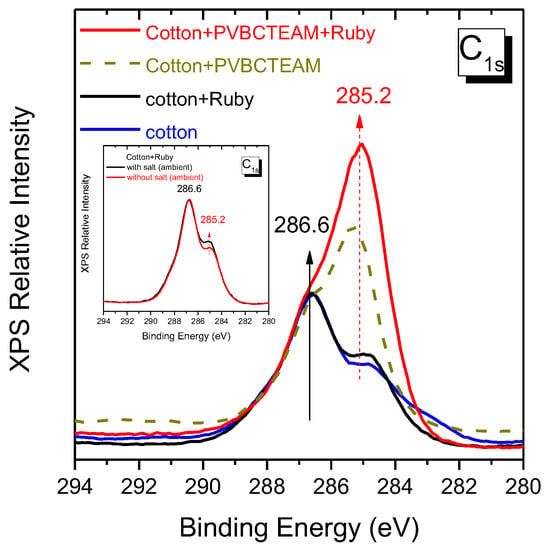
Figure 11.
XPS spectra of carbon orbital 1s of the untreated fabric substrate, low-temperature dyed cotton fabric (Novacron Ruby S-3B), modified fabric with PVBCTEAM, and low-temperature dyed modified fabric. Inset: low-temperature dyed fabric with and without adding salt in the dyeing bath.

Figure 12.
Dyed cotton fabric at low temperatures with (a) Novacron Ruby S-3B and (b) Remazol Brilliant Blue R. Comparison of the color intensity for samples with and without modification is unambiguous. For the modified fabrics the dyeing protocol without salt (S2.1) was followed.
The ability of this surface technique further demonstrates the potential of the cationic modification process to retain large quantities of dye (more than an order of magnitude compared to the unmodified cotton) even at low temperatures. The higher degree of dyeability caused by the presence of the cationic modifier on the cotton surface is clearly resolved in Figure 12. Unmodified fabrics dyed using the typical procedure with and without salt exhibit low dyeability at low temperatures; the presence of salt results in a slightly higher dyeability. In comparison, modified fabrics exhibit high dyeability at low temperatures even without the presence of salt. Apart from being more vivid, the color of these fabrics is also particularly uniform. Extensive colorimetric studies performed on dyed fabrics modified by a series of cationic modifiers similar to the ones used in the current study can be found in [52]. In the next paragraphs, the XPS study of the pair of dyed fabrics depicted in Figure 12 will be given as a case study. The results of all other possibilities are comparable and lead to the same conclusions.
The N1s spectral region in the XPS spectra can be used to verify the coexistence of the components (quaternary VBCTEAM units and non-quaternary species of dyes), while the Cl2p one to reveal the interactions involved between cellulose, cationic polymer, and dye.
The nitrogen existing in the dyed fabric is a combination of cotton residues and dye, as indicated by the peak at ~400 eV in the N1s spectral region of the XPS spectra (Figure 13a); the cotton residues contribution is considered much less than that of the dye. For the case of modified dyed fabrics, two peaks are resolved, at ~400 eV assigned mainly to the dye and at ~402 eV assigned to the VBCTEAM units. From the signal to noise ratio, it is clear that the dye retention is significantly increased after treatment, in agreement with the respective findings from the carbon 1s spectral region.
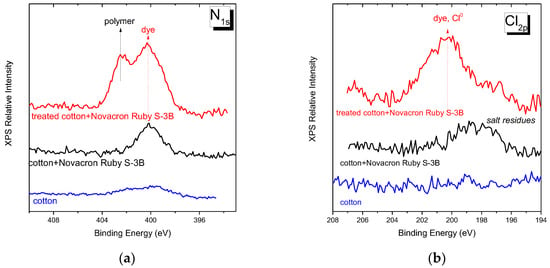
Figure 13.
XPS spectra of (a) nitrogen orbital 1s and (b) chlorine 2p orbital for untreated cotton fabric, untreated dyed cotton, and modified dyed cotton fabric with Novacron Ruby S-3B dye.
The Cl2p spectral region, Figure 13b, is indicative of the chloro-triazine sites when dyeing with the Novacron Ruby S-3B dye (at ~199 eV). This chemical unit is one of the two sites of potential direct interaction of this particular dye molecule with cotton. In the same spectral region, the Cl atoms of the polymers containing VBC units also contribute (~200 eV). However, as already shown [31], their contribution to the modified fabrics cannot be observed in the XPS spectra; the latter was explained as an indication of polymer grafting on cellulose through this reactive site. Finally, the Cl2p spectral region is characteristic of Cl- at ~198 eV.
Our results reveal that no Cl2p bands are observed in the fabric, nor in the unmodified dyed fabric. The latter may be explained either by the low quantities of dye molecules retained at low-temperature processes and/or by the direct grafting of the dye to cellulose. The weak band of chlorine ions observed (at ~198 eV) in the spectra of unmodified fabric is possibly attributed to small salt residues after the dyeing process performed in alkaline 1M NaCl solutions. The clearly resolved neutral chlorine band observed in the spectra of modified-dyed fabrics suggests a considerable fraction of unreacted dye sites. In the same spectra, the Cl- ion contribution is minimal and may explain either to salt residues or as a small number of counterions to the cationic VBCTEAM units that did not interact with dye molecules.
The question of whether the typical reactive dye process of grafting on cellulose, i.e., through vinyl sulfone and chlorine sites, is participating in the dyeing process of modified fabrics is difficult to answer. As explained above, for Novacron Ruby S-3B dye it appears that its reaction with cellulose is not fully performed (Cl band intensity in Figure 13b). As far as the masking sulfate groups are concerned, the XPS sulfur spectral region, which in principle offers the ability to extract the information, requires the fitting of the respective band with two bands (namely SO3− and SO4− groups), a difficult task, especially for spectra of low signal to noise ratio. Observation of the width of the band for the untreated dyed fabric (Figure 14) indicates that there exists a narrowing of the bandwidth (FWHM = 2.3) if compared to the pristine dye band (FWHM = 2.7). The XPS spectrum of pristine Novacron Ruby S-3B dye can be fitted with two doublets in the S2p spectral region as shown in Figure 1e. For the unmodified dyed cotton, a fitting is satisfactory by incorporating only the SO3− pair of peaks (main peak at 168 eV) indicating consumption of the SO4− species during the dyeing process of cotton. The spectra of pristine Novacron Ruby S-2B and the modified-dyed cotton are compared in the inset of Figure 14. The similarity in the peak profiles and peak widths indicates that SO4− site is still present, suggesting that the dye has not been bonded to cellulose through the vinyl sulfone mechanism.
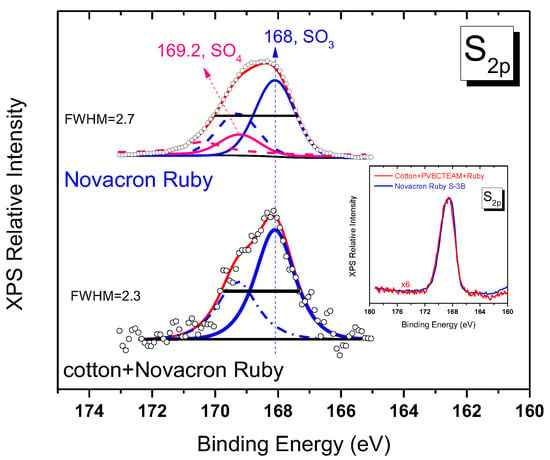
Figure 14.
Fitted XPS spectra for the sulfur orbital 2p of pristine Novacron Ruby S-3B and untreated dyed cotton. Blue peaks denote the SO3− doublet (corresponding to 2p3/2/2p1/2 lines solid/dashed lines respectively) while pink curves denote the contribution of the SO4− doublet (absent in the untreated dyed cotton). Inset demonstrates the similarity of the spectra between pristine Novacron Ruby S-3B and the modified dyed cotton.
4. Conclusions
The role of cationic modification of cotton fabric with P(VBC-co-VBCTEAMx) polymers during the dyeing process is explored in the present work at the molecular scale. Several spectroscopic techniques were applied, and detailed information related to the interaction of the reactive dye molecules with the cationic polymer modifiers at the molecular level was acquired. Two differently structured reactive dyes were used: (a) Novacron Ruby S-3B possessing five negatively charged sulfonate/sulfate groups and two possible reactive sites with cellulose (vinyl sulfone and chloro-triazine) and (b) Remazol Brilliant Blue R possessing two negatively charged sulfonate/sulfate groups and one possible reactive site with cellulose (vinyl sulfone). Regarding the number of available cationic sites in the modifier, its effect was investigated by using the two extreme values for the cationic content x that secure solubility in water (x = 53 and x = 100). Binary dye-polymer aqueous solutions (when a polymer is in large excess), as well as precipitates (at stoichiometric charge ratio), were studied. UV-Vis spectroscopy indicates dye-polymer interactions in the aqueous solutions of the binary systems by measurable small redshifts in the dye absorption bands. In addition, noticeable blueshifts in the dye bands are observed in analogous fluorescence experiments. In the precipitates of the binary systems, experimental evidence for the coupling of sulfonate/sulfate anions with N+ is provided by ATR-FTIR and XPS spectroscopy. Furthermore, XPS enabled the extraction of the ratio of the number of VBCTEAM units per dye molecule for each of the binary systems studied. Finally, for the modified dyed fabrics, XPS indicates a considerable portion of sulfate and chloro-triazine dye reactive sites, which indicates that the main mechanism of dye molecules attached to the fiber is through dye-modifier electrostatic interactions. As a result, the cationic modifier containing both VBC and VBCTEAM units acts as a connecting linkage of cellulose and dye molecules. Understanding the different interactions involved in the proposed dying process may assist in the upscaling and optimization of the process as well as give insight into alternative structures of polymer chains that offer additional properties to the modified cotton fabrics. Furthermore, it triggers additional research required to justify the problem of dye release during fabric washing while exploitation of applying the use of the proposed modifiers with other non-reactive dyes may be also reasonable.
Supplementary Materials
The following supporting information can be downloaded at: https://www.mdpi.com/article/10.3390/app13095530/s1, Figure S1: “Aqueous solutions of (a) polymer modifier PVBCTEAM, (b) Remazol Brilliant Blue R/PVBCTEAM, (c) Novacron Ruby/PVBCTEAM and (d) Remazol Blue/PVBCTEAM binary mixture at stoichiometric charge ratio after 24 h; clearly visible is the phase separation of the insoluble precipitate. Similar result has been observed after 24 h for Novacron Ruby also.”; Figure S2: “XPS spectra in the N1s spectral region of the precipitates of all binary system at stoichiometric charge ratios. Calculation of the peak integrals of the non-quaternized nitrogen (attributed to the dye) and quaternized nitrogen (attributed to VBCTEAM units), enabled the extraction of ratio value indicating the number of VBCTEAM units per dye molecule.”
Author Contributions
Material preparation, data collection, and analysis were performed by: C.A., K.P. and L.S.; Funding acquisition: G.A.V., Conceptualization: K.S.A.; Supervision: K.S.A., G.A.V. and G.B.; Validation: L.S. and K.S.A.; Writing—review and editing: K.S.A. and G.B. All authors have read and agreed to the published version of the manuscript.
Funding
This work was implemented under the “Action for the Strategic Development on the Research and Technological Sector”, funded by the Operational Programme “Competitiveness, Entrepreneurship and Innovation—I” (NSRF 2014–2020) and co-financed by Greece and the European Union (European Regional Development Fund), as Τ1ΕDΚ-03073 project with the acronym ChromaSurf.
Institutional Review Board Statement
Not applicable.
Informed Consent Statement
Not applicable.
Data Availability Statement
Not applicable.
Conflicts of Interest
The authors declare no conflict of interest.
References
- Acharya, S.; Abidi, N.; Rajbhandari, R.; Meulewaeter, F. Chemical cationization of cotton fabric for improved dye uptake. Cellulose 2014, 21, 4693–4706. [Google Scholar] [CrossRef]
- Siddiqua, U.H.; Ali, S.; Iqbal, M.; Hussain, T. Relationship between structure and dyeing properties of reactive dyes for cotton dyeing. J. Mol. Liq. 2017, 241, 839–844. [Google Scholar] [CrossRef]
- Bhargava, R.; Mehta, S.; Tripathi, Y.; Shivankar, V.S.; Raichurkar, P.P. Eco-friendly cationized dyeing of cellulosic fabric: A review. Colourage 2019, 31–38. [Google Scholar]
- Mu, B.; Liu, L.; Li, W.; Yang, Y. High sorption of reactive dyes onto cotton controlled by chemical potential gradient for reduction of dyeing effluents. J. Environ. Manag. 2019, 239, 271–278. [Google Scholar] [CrossRef] [PubMed]
- Hauser, P.J.; Tabba, A.H. Improving the environmental and economic aspects of cotton dyeing using a cationised cotton. Color. Technol. 2001, 117, 282–288. [Google Scholar] [CrossRef]
- Niu, T.; Wang, X.; Wu, C.; Sun, D.; Zhang, X.; Chen, Z.; Fang, L. Chemical Modification of Cotton Fabrics by a Bifunctional Cationic Polymer for Salt-Free Reactive Dyeing. ACS Omega 2020, 5, 15409–15416. [Google Scholar] [CrossRef]
- Gupta, D.; Haile, A. Multifunctional properties of cotton fabric treated with chitosan and carboxymethyl chitosan. Carbohydr. Polym. 2007, 69, 164–171. [Google Scholar] [CrossRef]
- Wang, L.; Ma, W.; Zhang, S.; Teng, X.; Yang, J. Preparation of cationic cotton with two-bath pad-bake process and its application in salt-free dyeing. Carbohydr. Polym. 2009, 78, 602–608. [Google Scholar] [CrossRef]
- Montazer, M.; Malek, R.; Rahimi, A. Salt free reactive dyeing of cationized cotton. Fibers. Polym. 2007, 8, 608–612. [Google Scholar] [CrossRef]
- Fu, S.; Hinks, D.; Hauser, P.; Ankeny, M. High efficiency ultra-deep dyeing of cotton via mercerization and cationization. Cellulose 2013, 20, 3101–3110. [Google Scholar] [CrossRef]
- Arivithamani, N.; Giri, D.V.R. Salt-free reactive dyeing of cotton hosiery fabrics by exhaust application of cationic agent. Carbohydr. Polym. 2016, 152, 1–11. [Google Scholar] [CrossRef]
- Arivithamani, N.; Giri, D.V.R. Sustainable bulk scale cationization of cotton hosiery fabrics for salt-free reactive dyeing process. J. Clean. Prod. 2017, 149, 1188–1199. [Google Scholar] [CrossRef]
- Arivithamani, N.; Giri, D.V.R. Characterization and comparison of salt-free reactive dyed cationized cotton hosiery fabrics with that of conventional dyed cotton fabrics. J. Clean. Prod. 2018, 183, 579–589. [Google Scholar] [CrossRef]
- Zhai, S.; Li, Y.; Don, W.; Zhao, H.; Ma, K.; Zhang, H.; Wang, H.; Zhao, Y.; Li, X.; Cai, Z. Cationic cotton modified by 3-chloro-2- hydroxypropyl trimethyl ammonium chloride for salt-free dyeing with high levelling performance. Cellulose 2022, 29, 633–646. [Google Scholar] [CrossRef]
- Pruś, S.; Kulpiński, P.; Zgondek, E.M.; Wojciechowski, K. Eco–friendly dyeing of cationised cotton with reactive dyes: Mechanism of bonding reactive dyes wit CHPTAC cationised cellulose. Cellulose 2022, 29, 4167–4182. [Google Scholar] [CrossRef]
- Wang, L.; Xie, G.; Mi, X.; Kang, X.; Zhu, Q.; Yu, Z. A single-step pad-steam cationisation and dyeing process for improving dyeing properties of cotton fabrics. Color Technol. 2022, 138, 509–521. [Google Scholar] [CrossRef]
- Fang, K.; Zhao, H.; Li, J.; Chen, W.; Cai, Y.; Hao, L. Salt-free dyeing of cotton fabrics modified with cationic copolymer nanospheres using an acid dye. Fibers Polym. 2017, 18, 400–406. [Google Scholar] [CrossRef]
- Dehabadi, V.A.; Buschmann, H.J.; Gutmann, J.S. Durable press finishing of cotton fabrics with polyamino carboxylic acids. Carbohydr. Polym. 2017, 89, 558–563. [Google Scholar] [CrossRef]
- Ma, W.; Wang, T.; Li, H.; Zhang, S. Cotton fabric modification through ceric (IV) ion-initiated graft copolymerisation of 2- methacryloyloxyethyltrimethyl ammonium chloride to enhance the fixation of reactive dyes. Cellulose 2015, 22, 4035–4047. [Google Scholar] [CrossRef]
- Wang, L.; Hu, C.; Yan, K. A one-step inkjet printing technology with reactive dye ink and cationic compound ink for cotton fabrics. Carbohydr Polym. 2018, 197, 490–496. [Google Scholar] [CrossRef]
- Yang, H.; Fang, K.; Liu, X.; An, F. High-Quality Images Inkjetted on Different Woven Cotton Fabrics Cationized with P(St-BA-VBT) Copolymer Nanospheres. ACS Appl. Mater. Interfaces 2019, 11, 29218–29230. [Google Scholar] [CrossRef] [PubMed]
- Song, Y.; Fang, K.; Bukhari, M.N.; Ren, Y.; Zhang, K.; Tang, Z. Green Efficient Inkjet Printing of Cotton Fabrics Using Reactive Dye@Copolymer Nanospheres. ACS Appl. Mater. Interfaces 2020, 12, 45281–45295. [Google Scholar] [CrossRef] [PubMed]
- Janhom, S.; Watanesk, R.; Watanesk, S.; Griffiths, P.; Arquero, O.A.; Naksata, W. Comparative study of lac dye adsorption on cotton fibre surface modified by synthetic and natural polymers. Dyes Pigments 2006, 71, 188–193. [Google Scholar] [CrossRef]
- Zhang, F.; Chen, Y.; Lin, H.; Lu, Y. Synthesis of an aminoterminated hyperbranched polymer and its application in reactive dyeing on cotton as a salt-free dyeing auxiliary. Color Technol. 2007, 123, 351–357. [Google Scholar] [CrossRef]
- Shin, H.; Ueda, M.; Burkinshaw, S.M. New methods of obtaining patterned dyeings on cellulosic fibres with anionic dyes: Photomodification using a methacryloyl quaternary ammonium compound. Dyes Pigments 1999, 41, 11–17. [Google Scholar] [CrossRef]
- Srikulkit, K.; Larpsuriyakul, P. Process of dyeability modification and bleaching of cotton in a single bath. Color Technol. 2006, 118, 79–84. [Google Scholar] [CrossRef]
- Ma, W.; Du, S.; Yan, S.; Yu, X.; Zhang, Z.; Zhang, S. Salt-Free Dyeing of Modified Cotton through Graft Polymerization with Highly Enhanced Dye Fixation and Good Strength Properties. Polymers 2020, 12, 462. [Google Scholar] [CrossRef]
- Ramamoorthy, A.; Helmy, H.M.; Rajbhandari, R.; Hauser, P.J.; El-Shafei, A. Plasma Induced Graft Polymerization of Cationic and Fluorocarbon Monomers into Cotton: Enhanced Dyeability and Photostability. Ind. Eng. Chem. Res. 2016, 55, 8501–8508. [Google Scholar] [CrossRef]
- Goel, N.K.; Rao, M.S.; Kumar, V.; Bhardwaj, Y.K.; Chaudhari, C.V.; Dubey, K.A.; Sabharwal, S. Synthesis of antibacterial cotton fabric by radiation-induced grafting of [2-(Methacryloyloxy)ethyl]trimethylammonium chloride (MAETC) onto cotton. Radiat. Phys. Chem. 2009, 78, 399–406. [Google Scholar] [CrossRef]
- Dong, W.; Zhou, M.; Li, Y.; Zhai, S.; Jin, K.; Fan, Z.; Zhao, H.; Zou, W.; Cai, Z. Low-salt dyeing of cotton fabric grafted with pH-responsive cationic polymer of polyelectrolyte 2-(N,N-dimethylamino)ethyl methacrylate. Colloids Surf. A Physicochem. Eng. Asp. 2020, 594, 124573. [Google Scholar] [CrossRef]
- Tsimpouki, L.; Papapetros, K.; Anastasopoulos, C.; Sygellou, L.; Soto-Beobide, A.; Andrikopoulos, K.S.; Voyiatzis, G.A.; Bokias, G.; Kallitsis, J.K. Water-soluble quaternized copolymers as eco-friendly cationic modifiers of cotton fabrics for salt-free reactive dyeing applications. Res. Sq. 2022. [Google Scholar] [CrossRef]
- Topalovic, T.; Nierstrasz, V.A.; Bautista, L.; Jocic, D.; Navarro, A.; Warmoeskerken, M.M.C.G. XPS and contact angle study of cotton surface oxidation by catalytic bleaching. Colloids Surf. A Physicochem. Eng. Aspects 2007, 296, 76–85. [Google Scholar] [CrossRef]
- Moulder, J.F.; Stickle, W.F.; Sobol, P.E.; Bomben, K.D. Handbook of X-Ray Photoelectron Spectroscopy; Perkin Elmer Corporation: Eden Prairie, MN, USA, 1992. [Google Scholar]
- Wang, L.; Wen, X.; Zhang, X.; Yuan, S.; Xu, Q.; Fu, F.; Diao, H.; Liu, X. Durable antimicrobial cotton fabric fabricated by carboxymethyl chitosan and quaternary ammonium salts. Cellulose 2021, 28, 5867–5879. [Google Scholar] [CrossRef]
- Briggs, D. Surface Analysis of Polymers by XPS and SIMS; Clarke, D.R., Suresh, S., Ward FRS, I.M., Eds.; Cambridge University Press: Cambridge, UK, 1998. [Google Scholar]
- Kovac, J. Surface Characterization of polymers by XPS and SIMS. Mater. Technol. 2011, 45, 191–197. [Google Scholar]
- Kim, M.; Kim, J.; Cho, J.; Kim, H.; Lee, N.; Choi, B. A study of the characteristics of indium tin oxide after chlorine electro-chemical treatment. Mater. Res. Bull. 2016, 82, 115–121. [Google Scholar] [CrossRef]
- Socrates, G. Infrared and Raman Characteristic Group Frequencies, 3rd ed.; Wiley: West Sussex, UK, 2001. [Google Scholar]
- Larkin, P. Infrared and Raman Spectroscopy Principles and Spectral Interpretation, 1st ed.; Elsevier: Oxford, UK, 2011. [Google Scholar]
- Andreassen, E. Infrared and Raman Spectroscopy of Polypropylene; Karger-Kocsis, J., Ed.; Kluwer Publishers: Dordrecht, The Netherlands, 1999. [Google Scholar]
- Podstawka, E.; Światłowska, M.; Borowiec, E.; Proniewicz, L.M. Food additives characterization by infrared, Raman, and surface-enhanced Raman spectroscopies. J. Raman Spectrosc. 2007, 38, 356–363. [Google Scholar] [CrossRef]
- Sperline, R.; Song, Y.; Freiser, H. Fourier Transform Infrared Attenuated Total Reflection Linear Dichroism Study of Sodium Dodecylbenzenesulfonate adsorption at the alumina/water interface using Al2O3-coated optics. Langmuir 1994, 10, 37–44. [Google Scholar] [CrossRef]
- Arivithamani, N.; Giri, D.V.R. Cationization of cotton for industrial scale salt-free reactive dyeing of garments. Clean Technol. Environ. Policy 2017, 19, 2317–2326. [Google Scholar] [CrossRef]
- Lo, M.; Diaw, A.K.D.; Gningue-Sall, D.; Oturan, M.A.; Chehimi, M.M.; Aaron, J.-J. A novel fluorescent sensor based on electrosynthesized benzene sulfonic acid-doped polypyrrole for determination of Pb(II)and Cu(II). Luminescence 2019, 34, 489–499. [Google Scholar] [CrossRef]
- Bauer, C.; Jacques, P.; Kalt, A. Investigation of the interaction between a sulfonated azo dye. Chem. Phys. Lett. 1999, 307, 397–406. [Google Scholar] [CrossRef]
- Jevavijayan, S. Spectroscopic (FTIR, FT-Raman), molecular electrostatic potential, NBO and HOMO-LUMO analysis of sulfonyl chloride based on DFT calculations. Spectrochim. Acta A Mol. Biomol. Spectrosc. 2015, 136, 890–899. [Google Scholar] [CrossRef] [PubMed]
- Mabrouk, K.B.; Kauffmann, T.; Aroui, H.; Fontana, M. Raman study of cation effect on sulfate vibration modes in solid state and in aqueous solutions. J. Raman Spectrosc. 2013, 44, 1603–1608. [Google Scholar] [CrossRef]
- Shishlov, N.M.; Khursan, S.L. Effect of ion interactions on the IR spectrum of benzenesulfonate ion.Restoration of sulfonate ion symmetry in sodium benzenesulfonatedimer. J. Mol. Struct. 2016, 1123, 360–366. [Google Scholar] [CrossRef]
- Lewis, D.M. The chemistry of reactive dyes and their application process. In Handbook of Textile and Industrial Dyeing; Clark, M., Ed.; Woodhead Publishing: Cambridge, UK, 2011; pp. 303–364. [Google Scholar]
- Chattopadhyay, D.P. Chemistry of dyeing. In Handbook of Textile and Industrial Dyeing; Clark, M., Ed.; Woodhead Publishing: Cambridge, UK, 2011; pp. 150–183. [Google Scholar]
- Broadbent, A.D. Basic Principles of Textile Coloration; Society of Dyers and Colourists: Bradford, UK, 2001; p. 26. [Google Scholar]
- Lada, Z.G.; Mathioudakis, G.N.; Pavlidou, S.; Goulas, G.; Anastasopoulos, C.; Bokias, G.; Andrikopoulos, K.S.; Voyiatzis, G.A. Comparative Assessment of the Dyeing Process for Pristine and Modified Cotton Fabrics towards the Reduction of the Environmental Fingerprint. Sustainability 2023, 15, 3144. [Google Scholar] [CrossRef]
Disclaimer/Publisher’s Note: The statements, opinions and data contained in all publications are solely those of the individual author(s) and contributor(s) and not of MDPI and/or the editor(s). MDPI and/or the editor(s) disclaim responsibility for any injury to people or property resulting from any ideas, methods, instructions or products referred to in the content. |
© 2023 by the authors. Licensee MDPI, Basel, Switzerland. This article is an open access article distributed under the terms and conditions of the Creative Commons Attribution (CC BY) license (https://creativecommons.org/licenses/by/4.0/).