Abstract
A molten-salt reactor (MSR), in which the nuclear waste can be separated and taken away from the liquid fuel through online chemical treatment, has remarkable advantages in safety and economics. To ensure the safe operation of an MSR plant, it is necessary to carry out a controller design and stability analysis of the whole system. In this work, a nonlinear distributed-parameter model of an MSR plant with a graphite-moderated liquid core was established and verified by the reference model. By applying a joint feedforward and feedback control strategy, the power controller and steam temperature controller were designed to adjust the plant load. The Nyquist criterion was used to assess the stability of the control system. The system responses to four different perturbations at the nominal power level were simulated, and the results show that the designed controllers have good reliability. In addition, the control performance was tested in two load change cases: a step load reduction and a linear load change. The dynamic response characteristics of the system parameters show that the developed control system based on the nonlinear distributed-parameter model is capable of fast and accurate regulation.
1. Introduction
The molten-salt reactor (MSR), which uses liquid molten salt as not only the reactor fuel but also a coolant, was originally proposed by Oak Ridge National Laboratory (ORNL) in order to design nuclear-powered aircraft [1]. At ORNL, a 2.5 MW Aircraft Reactor Experiment was conducted to support the feasibility study for applying molten fluoride fuels [2]. The 8MW Molten-Salt Reactor Experiment (MSRE) was conducted in the 1960s, which was maintained as critical for operations. Several more MSR concept designs, such as thermal and fast-spectrum reactors and single- and two-fluid loops, were proposed on the basis of the experience gained from the MSRE [3,4]. MSR systems can operate with very low excess reactivity requirements since online fuel processing allows the continuous removal of fission products, unlike in conventional solid-fueled reactors. High-level radioactive waste can be separated and taken away from the liquid fuel in the main circuit through online chemical treatment. It is worth mentioning that in serious accidents, ultra-hot fuel automatically flows into a safety storage tank [5]. The operational pressure can be designed to be close to atmospheric pressure with a high boiling point of fuel salt. In addition, because of the higher heat capacity of the molten fluoride fuel compared to the coolant of conventional reactors, the core has the potential to reach a higher density, and a more compact design is thus feasible [6]. Considering its safety features and economic advantages, the MSR was selected as one of six most promising reactor options in the GIF nuclear energy systems [7].
Over the last few years, numerical and experimental investigations of the MSR have been growing across many countries. Researchers from the United States proposed a high-temperature reactor, a fluoride-salt-cooled reactor that used coated particle fuel and was cooled by the salt, and conceptually and experimentally investigated the core design [8,9]. A liquid-salt microreactor (MARS) was designed in Russia for space exploration [10]. Feasibility and safety assessments of liquid-fuel fast-reactor systems (EVOL and SAMOFAR) have been performed in the Euratom framework project, and the fast-spectrum MSR concept (MSFR) was developed to investigate the feasibility of applying the MSR for fuel breeding and nuclear waste transmutation [11,12,13,14]. The iMAGINE was proposed for both energy production and nuclear waste management in an integrated system [15]. The cycle of thorium–uranium fuel was investigated in the SPHINX project in the Czech Republic, with experiments on the reactor physics, chemistry reprocessing technology, and structural materials [16]. The Dual-Fluid Reactor (DFR) concept was presented at the IFK Institute by Huke et al. [17], in which two fluids exist in the core: molten salt as the fuel and liquid lead as the coolant. The neutronic and thermal-hydraulic behaviors of the DFR concept were preliminarily investigated [18,19], and the smaller modular concept (SMDFR) was proposed by Liu et al. [20]. A hybrid MSR system was proposed by Furukawa et al. [21] in Japan, in which the nuclide of is produced by the accelerator spallation target. The Chinese Academy of Science launched the Thorium Molten Salt Reactor (TMSR) project to utilize thorium resources and produce hydrogen [22]. For the development of MSR concepts all over the world, the safety of the operation and power control of the reactor is always an important concern in the technology roadmap and engineering implementation.
The MSR has many differences from conventional solid-fuel reactors, since the delayed neutron precursor drift, caused by the flow of the liquid fuel in the primary circuit, plays an important role in its dynamic behavior. Considering the unique dynamic characteristics, a dedicated control strategy for the MSR has to be developed and applied for a high control performance. Based on this fact, a real-time dynamic model with high accuracy has to be developed for the control system design and the performance assessment. In the present study, an investigation of control systems of MSR concepts was conducted based on a simplified dynamic model developed by several researchers. A lumped-parameter system model was developed by Sides Jr [23] to preliminarily investigate the transient behavior and control strategy of a single-fluid Molten-Salt Breeder Reactor (MSBR). Singh et al. [24] developed a point-reactor coupled with a heat transfer model of the MSBR core for a temperature control investigation. Zarei [25] applied a classic PID controller for the power control system based on a nonlinear dynamic model. Fuzzy-PID control with a linear MSBR core model was proposed by Zeng et al. [26], and the performance of the PID controller was improved by applying the Internal Model Control (IMC) method [27]. Tripodo et al. [28] presented different control strategies for an MSFR power plant based on a linearized model. However, the transient behaviors represented by the space distribution of the system parameters cannot be captured by simplified lumped-parameter models, and more deviations are expected when the linearization procedure is conducted. Thus, the control performance and precision are limited. Meanwhile, these studies mainly focused on the control of the thermal power of this reactor, and the entire plant system was not modeled to take into account the coupling effect between different circuits, which has a large influence on the system behavior. In addition, the input saturation and the dead zone have to be considered during the design process of the controllers, as is needed for engineering realization.
In this study, an MSR plant, consisting of a reactor with liquid fuel and moderated by graphite, a heat exchanger, and a steam generator, was selected as the system to be modeled. Based on the 2250 MW MSR concept presented by Robertson [29], a nonlinear distributed-parameter model was established. Taking into account its dynamic characteristics, a new control system was designed to achieve the load-following capability of the whole plant, which is the objective of this study. A real-time nonlinear model of the whole system was established, and the system operation scheme was proposed. A joint feedforward and feedback scheme was applied as a novel control strategy. In addition, the amplitude-limiting block and dead zone block were integrated into the control system, consisting of the power controller and the steam temperature controller, to ensure stable control performance under various engineering circumstances. The developed nonlinear system model was verified by comparing its transient responses with those from the reference data [30]. A stability analysis of the power and steam temperature control systems was performed with the Nyquist criterion, and system simulations were carried out with four different perturbations at the nominal power level. In addition, two types of load changes were selected for the investigation of the load-following capability: a 10% load step reduction and a linear load change at a speed of 5% FP/min.
2. Nonlinear Distributed-Parameter Model of the MSR Plant
ORNL proposed the design of the MSR plant with a nominal power of 2250 MW, which employed molten salt composed of U-Th fluoride as the fuel and coolant [29]. This MSR plant was selected as the research subject to be modeled for the control system design in this paper. The schematic of the whole system is illustrated in Figure 1. It can be observed that the following components play a key role in the process of heat generation and energy transfer: the reactor core moderated by graphite, the tubular heat exchanger, and the supercritical steam generator. Referring to the ORNL design, two zones exist in the core: the inner zone and the outer zone; the two zones separate the molten salt flowing through the graphite into two parts [30]. By employing the online fuel processing system, fission products and high-level radioactive wastes in the molten-salt fuel are separated and removed from the reactor core. In addition, as a safety feature, the fuel salt is discharged into emergency dump tanks without any active measures when it overheats under severe accident conditions, in which the reactor could always be shut down spontaneously, and the risk of the release of radioactive material is minimized. In the primary loop, the fuel salt flows into the core from the bottom and then travels upward through the channels inside the graphite. Afterward, it leaves the core from the top and then enters the tubes of the heat exchanger. The heat released by fission is carried by the fuel salt and then transferred to the salt of the secondary circuit, which is located on the shell side of the heat exchanger. Finally, the heat is transferred to the feedwater of the tertiary circuit in the horizontal U-tube steam generator, by which the feedwater is transformed into superheated steam and then sent to the steam turbine for the generation of electricity.
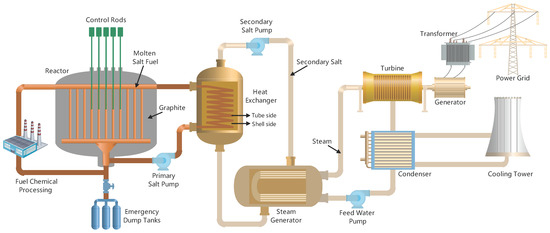
Figure 1.
Overall schematic diagram of the whole MSR plant.
A nonlinear distributed-parameter model was established for the entire system, including the reactor core, heat exchangers, and steam generators. The schematic diagram of the discretized system model is shown in Figure 2. The primary salt and graphite in the core region are divided into N nodes axially and 2 zones radially. In the radial direction, the mass flow rate is distributed such that 81.4% is in the central zone and 18.6% is in the outer zone [30] according to the power distribution to achieve a uniform temperature rise. The heat transfer coefficient is assumed to be a function of the mass flow rate and the temperature. The axial nodalization scheme is also applied to the fuel salt, secondary salt, and tube wall of the heat exchanger. In the steam generator, the secondary salt, the tube wall, and the feedwater/steam are also discretized into N nodes as for the core and heat exchanger. The technique of backward differentiation formulas (BDFs) is applied to solve the nonlinear time-dependent differential equations of the computer model [31].
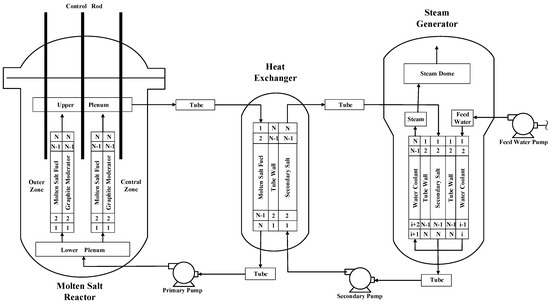
Figure 2.
The schematic diagram of the discretized system model.
2.1. Modeling of the Reactor Core
2.1.1. Neutron Kinetics Model
The nonlinear model of the core is established based on the point-reactor kinetics in Equations (1) and (2). The drifting effect of the delayed neutron precursors is considered by the two additional terms (the third and fourth terms) on the right-hand side of Equation (2): one for the precursor loss by leaving the core and another for the precursor gain by re-entering the core [29].
The term for overall reactivity includes the initial reactivity, the reactivity introduced by temperature variations in the fuel salt and graphite, and the reactivity inserted by the control rod:
The consideration of steady state in the system makes the terms representing the rate of change with respect to time in both Equations (1) and (2) go to zero, so the initial reactivity can be obtained by using the following equation:
The overall thermal power is considered to be proportional to the neutron density calculated using the point-reactor kinetic equations, and the core power distribution is assumed to have a cosine shape with an extrapolated distance of 2.4 m [30]. The relative heat deposited in the fuel salt is 91.9%, and the rest is given to graphite [29].
2.1.2. Thermal-Hydraulic Model
The fission heat is absorbed by the primary salt. After leaving the core, the heat is transferred to the secondary salt in the primary heat exchanger. To represent the spatial temperature distribution, an axial and radial nodalization scheme of N nodes and 2 nodes, respectively, is applied to the core modeling process. Applying mass conservation and energy conservation, the one-dimensional heat transfer equation for the fuel salt is:
The one-dimensional heat transfer model for the central graphite in the core is:
The heat transfer process between the primary salt and graphite for the outer zone of the core is modeled in a similar manner. In the upper plenum, the liquid fuel from the central region and the outer region is mixed, and its outlet temperature is calculated by:
2.2. Modeling of the Primary Heat Exchanger
A shell-and-tube heat exchanger was adopted in this work. The primary salt (fuel) enters the bundle of tubes and flows downward, while the secondary salt is pumped upward in the shell. To represent the spatial temperature distribution, an axial nodalization scheme of N nodes of the primary salt, the tube wall, and the secondary salt is applied to the modeling process of the primary heat exchanger. The heat transfer process is then modeled by applying the energy conservation law.
For the primary salt:
For the heat exchange process of the tube wall:
For the heat exchange process of the secondary salt:
2.3. Modeling of the Supercritical Steam Generator
A U-tube supercritical steam generator was adopted in this work. The secondary salt flows into the shell, while the feedwater is pumped through the U-tubes and transformed into superheated steam by the heat transferred by the secondary salt. This process of heat transfer is modeled by the following equations.
For the secondary salt:
For the U-tube wall:
For the feedwater/steam side:
2.4. Transit Time between Components
Since the fluids from different regions/components are connected by the piping system, the resulting transit time has to be considered in the computer model. The transit time from the core to the heat exchanger for the primary salt is described as:
The delay times and are assumed to be constant, and values of 2 s and 2.3 s, respectively [30], were used in this work.
The transit time between the heat exchanger and the steam generator for the secondary salt is described as:
where the delay times and are assumed to be constant, and values of 14.5 s and 11.9 s, respectively [30], were used in this work.
3. Control System Design of the MSR Plant
3.1. Operation and Control Scheme
Before designing the control system, it is necessary to determine the temperature and mass flow rate curves for each subsystem of the MSR plant in steady-state operation. In this work, the system operation parameters were determined by performing numerical simulations under steady-state operating conditions at partial loads. The major system parameters of this plant are listed in Table 1. The set value of the outlet temperature of the super-heated steam is constant at 810.9 K, and the inlet temperature of the feedwater is also set to be constant at 644.3 K so that the corrosion of turbine blades by droplets from steam is minimized. The outlet temperature of the primary salt in the reactor core varies linearly with power, while the inlet temperature is unchanged until the power is increased to 50% full power (FP), and then the temperature is increased from 810.9 K to 838.7 K for a further increase in power (from 50% FP to 100% FP). The inlet and outlet temperatures of the secondary salt in IHX are derived by applying the energy conservation law at steady state. To minimize the neutronic fluctuation resulting from the drifting effect of the delayed neutron precursors, the transit times of fuel salt inside and outside the core, and , are set to be constant under transients. To achieve this, the primary salt flow rate is set to be constant at its nominal value. The relation between the secondary salt flow rate and the load is described by a fitting function, which was determined by performing numerical simulations under steady-state operating conditions with various loads.

Table 1.
Major system parameters of the whole plant [30].
An innovative control system consisting of two load-tracking control modules—the thermal power controller and the steam temperature controller—was developed in this work for the realization of the desired operation scheme. The thermal power controller was optimized for a fast load transient response performance, which means that the overall thermal power should follow the load variation with as low a latency as possible so that the fission energy generated in the reactor core is maximized and the system stability is ensured. The objective of the steam temperature controller is to maintain a constant outlet temperature (810.9 K) of the steam for the steady-state operation and as low as possible fluctuation under transients so that the steam provided to the turbine has a stable quality and less damage to the blades of the turbine is expected. The schematic of the entire control system is illustrated in Figure 3. The measurements of the neutron flux (as an indicator of the power) and the outlet temperature of the primary salt are compared with the set values corresponding to the real-time load demand (desired values). Keeping the mass flow rate of the primary salt constant, the set values of the reactor power are a function of the outlet temperature during the transient process. The deviation signal of the neutron density () and the outlet temperature () are processed and then passed to the control rod servo to introduce the desired reactivity. Meanwhile, a feedforward control scheme of the secondary pump is applied so that the temperature of the secondary salt is adjusted through the regulation of its mass flow rate corresponding to the desired power. Steam temperature control is realized by regulating the mass flow rate of the feedwater to ensure that the steam temperature is constant.
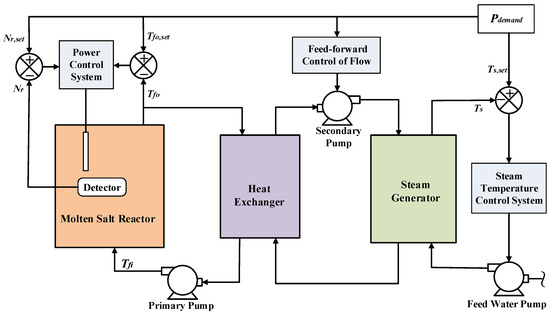
Figure 3.
Control schematic diagram of the whole plant system.
3.2. Controller Design
The Matlab/Simulink program is a mature simulation code package that has been applied widely in industrial fields, especially for system simulations and the development of control systems. The nonlinear distributed-parameter model of the MSR plant with the corresponding control system was established using the Matlab/Simulink program, and the achieved simulation platform is illustrated in Figure 4. In this system model, five major parts are considered: the reactor core model, the IHX model, the SG model, the power controller, and the steam temperature controller. Since it is unavoidable that some errors will be introduced during the model linearization process, the nonlinear model is directly solved by numerical solvers. The dynamic system behaviors can be observed through the simulation of various transients conducted with this simulation platform. The fast load-following feature of the MSR plant is achieved by applying the combined feedforward and feedback control strategy, which is implemented in the designed control system with two controllers: one for the total power and another for the steam temperature.
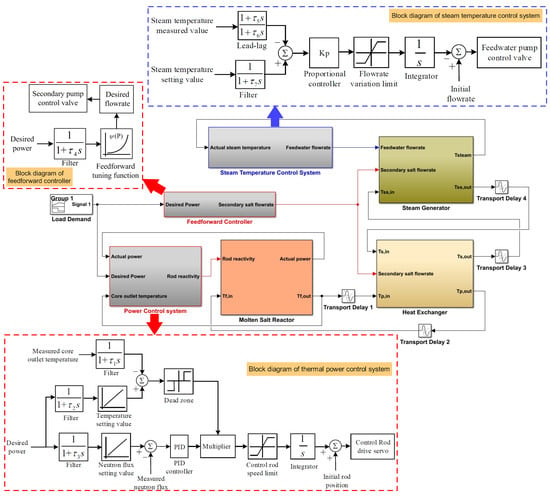
Figure 4.
Schematic of the simulation platform of the MSR plant with control systems.
3.2.1. Controller for the Thermal Power
The controller for the thermal power has three inputs and one output. The schematic of the working principle is illustrated in Figure 4. Based on the demand from the grid, the desired power is determined and then transformed into the corresponding neutron flux as the set value. The flux error (between the desired value and the measurement) is transmitted to the PID controller as an input to be processed. Then, the output signal is transmitted to the controller of the control rod for the determination of the movement (speed and direction) of the control rods. Finally, the signal of movement is given to the control rod drive servo to execute the desired movement. The proportional gain (), integral term (), and derivative term () of the PID controller are set to 0.025, 0.0079, and 0.0028, respectively. Taking into account the criticality of safety, the speed of the introduced reactivity should be bounded by ±10 pcm/s. To prevent the frequent execution of the control rod servo caused by noise or tiny deviations, a dead zone is introduced to avoid the unnecessary movement of the control rod. If the error between the measurement and the desired value is less than the threshold defined by the dead zone, the control system is locked by a special signal to make the controller output value zero so that the unnecessary execution of the control rod drive servo is prevented.
The deviation between the measurement and set values of the outlet temperature is converted to a 0-1 switch signal, which is used to control the output signal of the PID controller. Since the mass flow rate of the secondary salt is adjusted based on the calculations of the governing equations under various loads, the heat transfer capability of the secondary circuit is fixed at various loads. Based on this fact, the core outlet temperature (operating temperature) is also fixed at various loads, which means that if the core outlet temperature reaches the desired value, the power must be equal to the desired power. So, once a new set value of power is given, a desired outlet temperature is given. This desired outlet temperature is then compared to the measured temperature, and this error is used to switch on the output of the PID controller to insert the reactivity by moving the control rod to regulate the thermal power. Once the temperature error is smaller than ±0.05 K, which means that the system has already reached the desired state, the PID controller will be locked (setting its output value to zero) to prevent unnecessary movement of the control rod so that its drive servo can have a longer service life. In the process of thermal power control, the feedforward controller is used to adjust the secondary salt flow rate to avoid temperature hysteresis based on the feedforward tuning function, as illustrated in Figure 4.
3.2.2. Controller for the Steam Temperature
During the transients of the load adjustment, the steam outlet temperature is influenced by the changed conditions of the secondary salt in the steam generator. However, the steam temperature has to be kept constant, as mentioned earlier, so the measured temperature is compared to its desired value. This deviation is then provided to the controller as an error signal. The error signal is transmitted to a proportional controller, where the signal is processed for the execution of the feedwater pump servo, as shown in Figure 4. A flow limiter is integrated right after the controller to prevent the oscillation of the feedwater flow and its temperature as a consequence of the rapid change in the mass flow rate. The parameter is set to 0.006, while the boundaries of the flow limiter are ±0.5%/s. In addition, a lead–lag controller is integrated into the control system to compensate for the lagging effect because of thermal inertia, which effectively increases the responsiveness of the steam temperature controller. The parameters of the lead–lag controller, and , are set to 20 and 1, respectively. The processed signal for the adjustment of the mass flow rate is transmitted to the pump drive servo to maintain a constant outlet steam temperature.
4. Results and Discussion
4.1. Plant Model Verification
To verify the nonlinear model of the whole plant, two cases of perturbation transients without the control system were simulated, including reactivity perturbation in the core and flow-rate perturbation in the secondary loop. The value of ‘N’ is 20 in this research, which is the result of a comprehensive selection considering two factors: the simulation accuracy and real-time calculation speed. The transient response results of the established nonlinear model are compared with those of the reference model described by Sides [30]. In the first case, a negative reactivity of −50 pcm is introduced at t = 20 s, and the control system is not activated during the transient. The transient responses of the reactor thermal power and system temperature parameters for uncontrolled reactivity insertion are illustrated in Figure 5. In the second case, the mass flow rate is reduced by 10% in the secondary salt loop at t = 20 s, and the control system is also not activated.
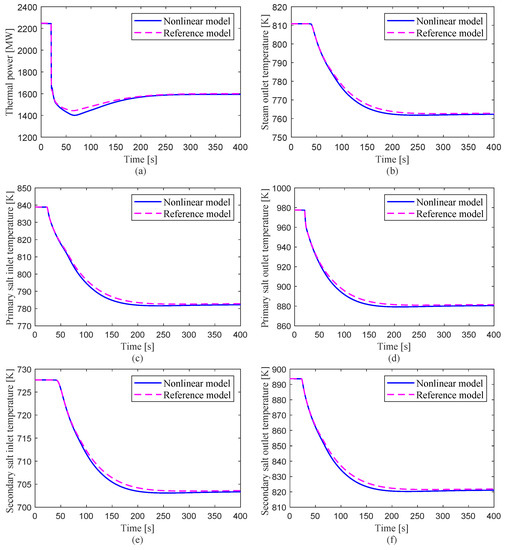
Figure 5.
The transient responses of the nonlinear model and reference model for 50 pcm negative reactivity perturbation without the control system.
The response results of the reactor power and temperature parameters for the uncontrolled flow-rate reduction are illustrated in Figure 6. The simulation results calculated by the nonlinear model are consistent with those of the reference model, and the maximum deviation is less than 1.8% due to the effects of slightly different model assumptions. This small deviation is mainly because of the different degrees of refinement of these two models and the difference in the numerical solution algorithm. The nonlinear distributed-parameter model adopted in this paper is a one-dimensional transient equation, which is superior to the lumped-parameter model used in the reference. The comparison results show that the developed model could be accurately used for the system dynamic simulation of the MSR plant.
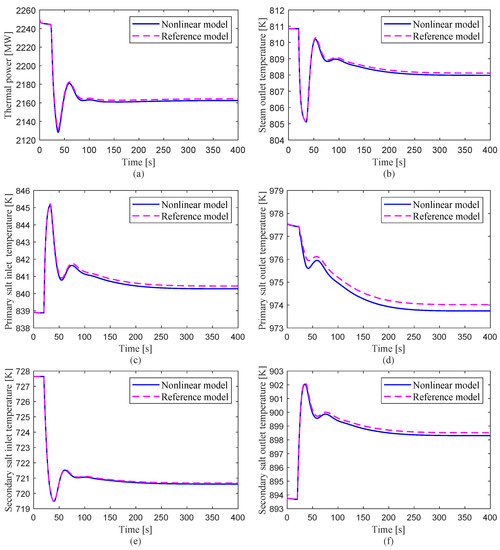
Figure 6.
The transient responses of the nonlinear model and reference model for a flow-rate reduction of 10% in the secondary salt loop without the control system.
4.2. Stability Analysis of Control System
4.2.1. Nyquist Stability Criterion
In this work, a mixed feedforward/feedback control mechanism is proposed, and its performance was assessed in two typical scenarios: a step load change and a linear load change. However, since load following is a nonlinear tracking process, the stability of this control scheme has to be verified carefully. For the power control system, since the open-loop transfer function does not have a pole on the right-hand side of the Gauss plane (P = 0) and it does not encircle the point (−1 + j0) (Z = 0), according to the Nyquist stability criterion (N = 0), this power control system is stable in theory, as shown in Figure 7. For the steam temperature control system, since the open-loop transfer function does not have a pole on the right-hand side of the Gauss plane (P = 0) and it encircles the point (−1 + j0) once clockwise and encircles the point (−1 + j0) once counterclockwise (Z = 1 − 1 = 0), according to the Nyquist stability criterion (N = 0), this steam temperature control system is stable in theory, as shown in Figure 8. As the two control systems are proven to be stable, the stability of the whole control scheme proposed in this work is verified according to the Nyquist stability criterion.
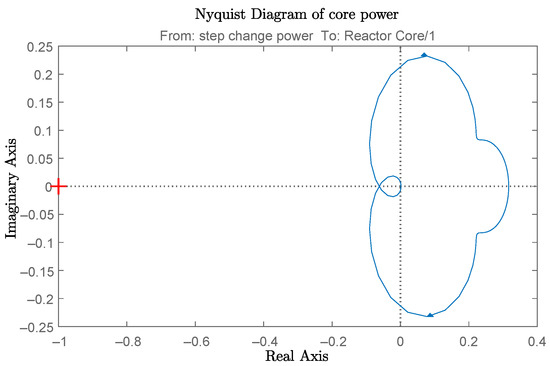
Figure 7.
Nyquist diagram of the power control system after linearization.

Figure 8.
Nyquist diagram of the steam temperature control system after linearization: (a) full view; (b) zoomed in (−1, 0).
4.2.2. Perturbation Stability Test
In order to verify the stability of the designed control system, the system responses under four different transient perturbations at the nominal power level are investigated: positive and negative reactivity insertion, and an increase and decrease in the fuel mass flow rate.
Perturbation case 1: The system responses to a positive reactivity insertion transient are shown in Figure 9. At t = 50 s, as a positive reactivity of 30 pcm is inserted into the core, the thermal power is increased by 19%, and then the control rod is inserted into the core by the servo to introduce negative reactivity to compensate for the inserted positive reactivity. In addition, as the fuel temperature rises due to higher thermal power, extra negative reactivity is introduced due to the negative feedback coefficient of the fuel temperature. At t = 53 s, as the thermal power becomes lower than the nominal power, the control system withdraws the control rod to introduce positive reactivity in order to increase the thermal power. After 20 s, the system reaches a new steady state, and the steam outlet temperature is almost constant during the whole transient. The inserted reactivity is compensated by that introduced by the control rod. There is no significant change in the fuel temperature.
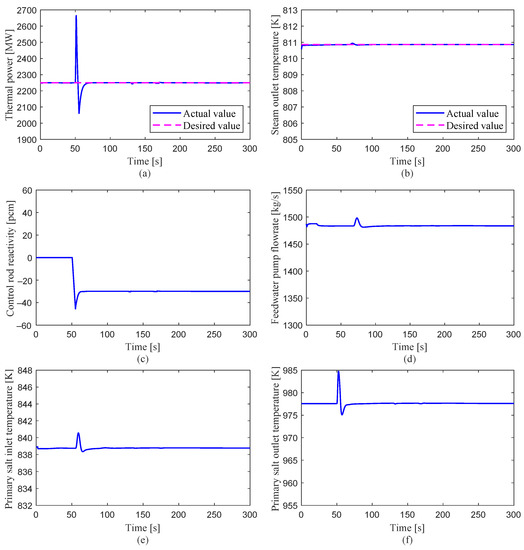
Figure 9.
System responses to a positive reactivity perturbation transient: 30 pcm.
Perturbation case 2: The system responses to a negative reactivity insertion transient are shown in Figure 10. At t = 50 s, as a negative reactivity of −30 pcm is inserted into the core, the thermal power is reduced by 14%, and the control rod is moved up by the servo to introduce positive reactivity to compensate for the inserted negative reactivity. In addition, extra positive reactivity is introduced due to the decreased fuel temperature. The control system works in a similar way to the previous case and adjusts the system to the steady state, which has the same thermal power and steam temperature as those before the transient.
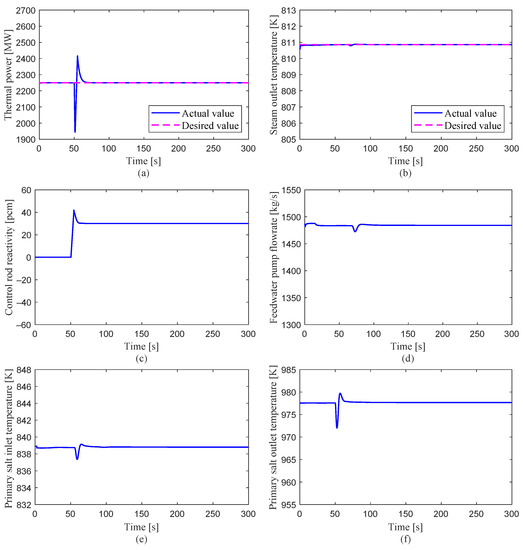
Figure 10.
System responses to a negative reactivity perturbation transient: −30 pcm.
Perturbation case 3: The system responses to a transient triggered by increasing the fuel mass flow rate by 10% are shown in Figure 11. At t = 50 s, as the fuel mass flow rate is increased by 10%, the fuel temperature is slightly decreased, which introduces positive reactivity due to the negative feedback coefficient. In order to counteract this effect, the control system starts to bring in negative reactivity. The inlet temperature is increased by 7 K, and the outlet temperature is 7 K lower compared to its value before the transient. The decreased temperature difference ensures that the same amount of heat can be removed by the salt with a higher mass flow rate.
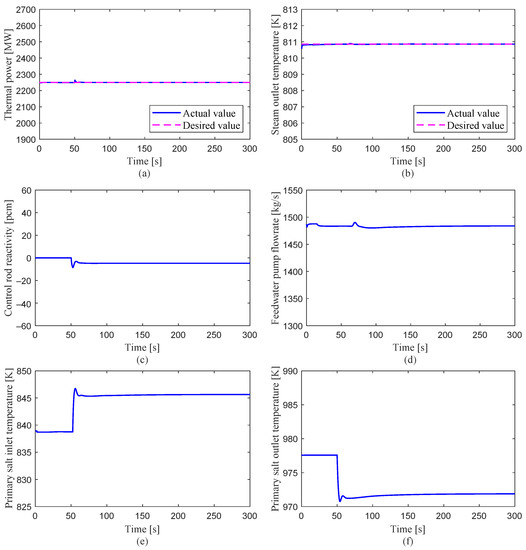
Figure 11.
System responses to an increased fuel mass flow perturbation: 10%.
Perturbation case 4: The system responses to a transient triggered by decreasing the fuel mass flow rate by 10% are shown in Figure 12. At t = 50 s, the fuel mass flow rate is decreased by 10%. In a similar way, the system reaches a new steady state after 20 s. There is a higher temperature difference between the inlet and outlet temperatures, which ensures an equal heat removal capacity with a lower mass flow rate.
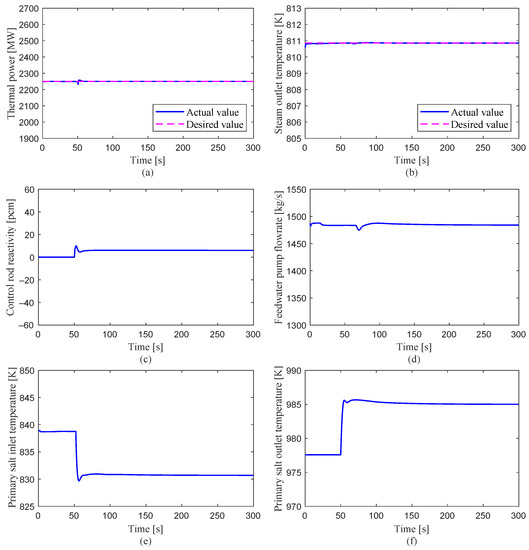
Figure 12.
System responses to an decreased fuel mass flow perturbation: −10%.
4.3. Control Performance Analysis
By simulating the MSR plant using the nonlinear system model, a control system was established and integrated into the simulation platform. The goal of control is to adjust the thermal power following the load and maintain a constant steam outlet temperature. To verify the feasibility of this control strategy and assess the performance of the control system, two representative transients were selected and simulated: a step decrease in power from 100% FP to 90% FP and a linear load variation between 100% FP and 50% FP at a rate of 5% FP/min. Based on the system responses observed in the simulation, the performance of the control system under these two transients was analyzed.
4.3.1. Step Load Change
In this load variation transient, the electrical grid load demand was stepped down by 10% at t = 50 s after the steady-state operation with nominal power. The control system was actuated because of the mismatch between the actual power and the desired value. The transient behaviors of key system parameters and the control process are presented in Figure 13. The load signal, as the desired power, was transmitted to the control system to adjust the thermal power. The deviations of the measured values from the set values, and , were transmitted to the control system as error signals. Then, they were processed into a control signal and forwarded to the servo to drive the control rods. As shown in Figure 13a,c, the insertion of negative reactivity decreased the reactor power to around 87% FP in several seconds. As the fuel salt was less heated by the decreased power, an insertion of positive reactivity caused by the negative temperature feedback coefficient of the fuel salt took place, which increased the power up to around 90% FP. This coupling effect resulted in the fluctuation of the thermal power until it reached a new equilibrium point. Simultaneously, a feedforward scheme, which was achieved by adjusting the secondary salt flow rate, was integrated into the control system. The secondary salt flow rate was assumed to be determined by the load. The reactor outlet temperature was decreased due to the reduced power, and the reactor inlet temperature was increased for the first stage because of the reduction in heat transferred to the secondary salt due to the decrease in its mass flow rate, and then it decreased as a consequence of the reduced power, as can be observed in Figure 13e,f. In addition, the load signal transmitted to the control system was also used to maintain a constant steam outlet temperature. To achieve this purpose, the mass flow rate of the feedwater was adjusted to limit the temperature variation, as shown in Figure 13d. In the first stage of the transient, the steam temperature decreased quickly due to the reduction in the heat absorbed by the feedwater in the steam generator. As a consequence, the deviation of the steam temperature was transmitted to the control system as an error signal, which was then processed and sent to the pump servo to change the feedwater flow rate. As Figure 13b shows, the steam outlet temperature dropped rapidly with the reduction in thermal power and then rose gradually since the feedwater flow rate was reduced until it reached its set value.
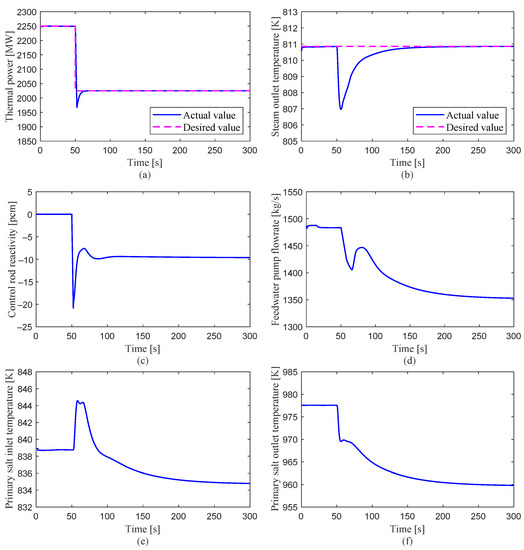
Figure 13.
System responses to a step decrease in load demand: from 100% FP to 90% FP.
As illustrated in Figure 13a, a high consistency between the actual value and the desired value (control target value) is observed, which means that, in this case, a suitable load-following capability was achieved. During the control process, the overshoot was lower than 2.6%, and a settling time of around 15 s was observed. The steam temperature was able to follow its set value within a difference of less than 4 K, as shown in Figure 13b, and this is acceptable from an engineering point of view. The reactivity inserted by the control rod was within a range of −20 pcm at a speed bounded by ±10 pcm/s, so it is achievable by the control rod servo. As the mass flow rate of the feedwater is approximately proportional to the transferred heat according to the energy balance, the final mass flow rate is around 90% of its nominal value. The inlet and outlet temperature changed within a range of 20 K as a consequence of the power change and heat balance. These results show that the control systems have an excellent performance for this step load reduction transient.
4.3.2. Linear Load Change
The load-following performance was investigated by using the linear power change transient, in which the plant load is reduced from 100% FP to 50% FP at a rate of 5% FP/min, remains constant at 50% FP for 600 s, and then goes back to 100% FP at the same rate. The load signal, as the desired power, was sent to the control system, and the deviations of the measured values from the set values, and , were transmitted to the control system as error signals. Then, they were processed into a control signal and forwarded to the servo to drive the control rods.
As shown in Figure 14a,c, the insertion of negative reactivity was achieved by the insertion of the control, which was executed by the control system, and then the thermal power was reduced following the desired value. Once the power reached the desired value of 50% FP at t = 650 s, the control system stopped the movement of the control rod, and then the power was kept constant for 600 s. After that, the power started to rise because of the extraction of the control rod, which was also executed by the control system, until it reached 100% FP. The reactor inlet and outlet temperatures were following the thermal power, as can be observed in Figure 14e,f. In addition, the load signal sent to the control system was also used to maintain a constant steam outlet temperature. To achieve this purpose, the mass flow rate of the feedwater was adjusted to limit the temperature variation, as shown in Figure 14d. For the power reduction stage, since the power was reduced, less energy was transferred to the feedwater. So, the mass flow rate was reduced by the control system to maintain a constant steam outlet temperature. In the power increase stage, the mass flow rate was increased by the control system to extract more power from the reactor core with an unchanged steam outlet temperature. As illustrated in Figure 14, both the power and steam outlet temperature are highly consistent with the desired value. For the thermal power, the curve of the actual values almost overlapped with that of the desired values, and the steam outlet temperature was able to follow its set value within a difference of less than 1 K for the whole transient. A similar shape to that of the thermal power is observed for reactivity insertion by the control rod, since the thermal power is mainly adjusted by inserting positive or negative reactivity. The mass flow rate of the feedwater also has a similar shape, as the mass flow rate is approximately proportional to the transferred heat according to the energy balance. The inlet temperature changed within a range of 20 Km and the outlet temperature varied within a range of 90 K as a consequence of the power variation and heat balance, and the system parameters did not oscillate during the entire transient. The load-following capability of the control system is verified by the simulation results, as the thermal power is always capable of following its set value, and a constant steam temperature is maintained with a fluctuation of less than 1 K.
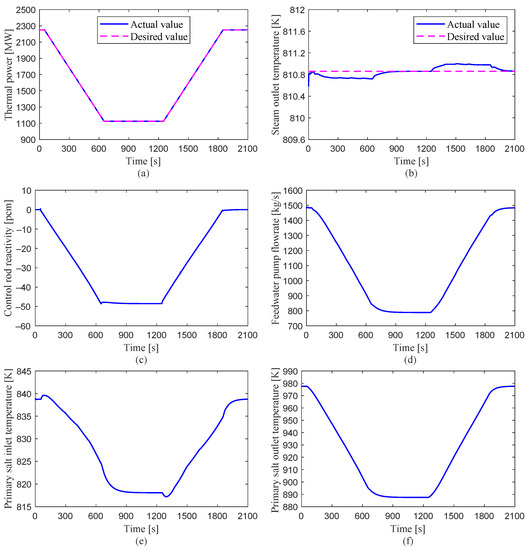
Figure 14.
System responses of the load-following change at a rate of 5%/min: from 100% FP to 50% FP.
5. Conclusions
In this work, a controller design and stability analysis of an MSR plant were carried out, in which graphite is used as the moderator and an intermediate circuit with salt is implemented to transfer heat from the core to the steam generator in the tertiary circuit. To achieve this purpose, a nonlinear distributed-parameter model consisting of these three circuits was developed. In order to eliminate the error introduced by the simplification and approximation during linearization, the nonlinear and time-dependent system model was directly solved by numerical solvers. Two types of transients without the control system were simulated to verify the developed nonlinear model: reactivity insertion and flow rate variations in the secondary circuit. It is observed from the calculation results that the system responses demonstrated by the nonlinear model are highly consistent with those of the reference model, and the deviations in both cases are within 1.8%. From this comparison, the developed model is verified to be capable of the dynamic analysis of the MSR plant.
By using the developed nonlinear distributed-parameter model, a novel control strategy implementing the combined feedforward and feedback scheme was proposed. Input–output saturation and dead zone blocks were applied in the control systems—for the power and for the steam temperature—so that the load variation under engineering circumstances was considered. The whole control system was analyzed and proven to be stable by applying the Nyquist criterion. The system responses to four different perturbations at the nominal power level were simulated, and the results show that the designed controllers have good reliability. To assess the performance of the designed controllers in the process of load changes, two typical load change transients were simulated: a step decrease in power from 100% FP to 90% FP and a linear load change from 100% FP to 50% FP at a rate of 5% FP/min. Concerning the transient of the step load change, the power was well adjusted to follow the desired load demand, in which the relative overshoot was lower than 2.6%, and the settling time was around 15 s. The steam temperature controller also achieved good control performance, as its temperature was maintained within a deviation of 4 K from its design point of 810.9 K through the adjustment of the feedwater flow rate. For the linear load change, the actual value of the reactor power was highly consistent with the desired value, and a constant steam temperature was maintained with a fluctuation of less than 1 K. The achieved results indicate that a fast load-following capability and a high control performance were obtained by applying the developed control system.
Author Contributions
Conceptualization, C.X. and R.L.; methodology, C.X. and R.L.; data curation, C.X. and R.L.; writing—original draft preparation, C.X. and R.L.; writing—review and editing, S.T.R. and T.Y.; project administration, R.L. and T.Y.; funding acquisition, C.X. and R.L. All authors have read and agreed to the published version of the manuscript.
Funding
This research is supported by the Scientific Research Foundation of the Education Department of Hunan Province, China (Grant No. 22A0315); the Scientific Research Foundation of the Education Department of Hunan Province, China (Grant No. 22A0307); the Hunan Provincial Natural Science Foundation of China (Grant No. 2022JJ50156); and The Science and Technology Innovation Program of Hunan Province (Grant No. 2020RC4053).
Institutional Review Board Statement
Not applicable.
Informed Consent Statement
Not applicable.
Data Availability Statement
Data are contained within the article; further inquiries can be directed to the corresponding authors.
Conflicts of Interest
The authors declare no conflict of interest.
Nomenclature
The following symbols are used in this manuscript:
| t | time |
| introduced reactivity | |
| N | neutron density |
| total fraction of delayed neutrons | |
| fraction of the j-th group of delayed neutrons | |
| concentration of the j-th group of delayed neutron precursors | |
| decay constant of the j-th group of delayed neutron precursors | |
| mean neutron generation time | |
| transit time of fuel salt inside the reactor core | |
| transit time of fuel salt outside the reactor core | |
| Doppler feedback coefficient | |
| mean temperature of the primary salt | |
| temperature feedback coefficient of the graphite moderator | |
| mean temperature of the graphite moderator | |
| control-rod-introduced reactivity | |
| initial reactivity | |
| fuel mass of node i inside the core | |
| average specific heat capacity of the fuel salt of node i inside the core | |
| temperature of the fuel of node i in the core | |
| mass flow rate through the inner area | |
| average heat transfer coefficient between fuel salt and graphite moderator in the core | |
| heat transfer area between fuel salt and graphite of node i in the core | |
| fraction of deposited fission energy in fuel of node i in the core | |
| overall thermal power of the core | |
| mass of the graphite moderator of node i | |
| average specific heat capacity of the graphite moderator of node i | |
| temperature of the graphite moderator of node i | |
| fraction of deposited fission energy in the graphite moderator of node i | |
| fractional mass flow rate of the fuel salt in the inner zone of the core | |
| fuel temperature of the last node (node N) of the inner region | |
| fuel temperature of the last node (node N) of the outer region | |
| fuel mass of node i of the primary heat exchanger | |
| average specific heat capacity of the fuel of node i of the primary heat exchanger | |
| fuel temperature of node i of the primary heat exchanger | |
| mass flow rate of the primary salt | |
| average heat transfer coefficient between the fuel and wall in the primary heat exchanger | |
| heat transfer area between the fuel and wall in the primary heat exchanger | |
| piping wall mass of node i of the primary heat exchanger | |
| average specific heat capacity of the wall in node i of the primary heat exchanger | |
| temperature of the wall in node i of the primary heat exchanger | |
| mass of the secondary salt in node i of the primary heat exchanger | |
| average specific heat capacity of the secondary salt of node i of the primary heat exchanger | |
| secondary salt temperature of node i of the primary heat exchanger | |
| mass flow rate of the secondary salt | |
| secondary salt and wall heat transfer coefficient in the primary heat exchanger | |
| secondary salt and wall heat transfer area in the primary heat exchanger | |
| mass of the secondary salt of node i of the steam generator | |
| average specific heat capacity of the secondary salt of node i of the steam generator | |
| secondary salt temperature of node i in the steam generator | |
| mass flow rate of the secondary salt | |
| secondary salt and wall heat transfer coefficient in the steam generator | |
| heat transfer area between the salt and wall in the steam generator | |
| U-tube wall mass of the steam generator | |
| average specific heat capacity of the wall of node i of the steam generator | |
| U-tube wall temperature of the steam generator | |
| mass of the water/steam of node i of the steam generator | |
| average specific heat capacity of the feedwater/steam of node i of the steam generator | |
| water/steam temperature of steam generator | |
| mass flow rate of the water/steam | |
| average heat transfer coefficient between the steam and wall in the steam generator | |
| heat transfer area between the steam and wall in the steam generator | |
| inlet temperature of the primary salt in the core | |
| outlet temperature of the primary salt in the core | |
| inlet temperature of the primary salt in the heat exchanger | |
| outlet temperature of the primary salt in the heat exchanger | |
| delay time for the primary salt from the core outlet to the heat exchanger inlet | |
| delay time for the primary salt from the heat exchanger outlet to the core inlet | |
| inlet temperature of the secondary salt in the heat exchanger | |
| outlet temperature of the secondary salt in the heat exchanger | |
| inlet temperature of the secondary salt in the steam generator | |
| outlet temperature of the secondary salt in the steam generator | |
| delay time for the secondary salt from the heat exchanger outlet to the steam generator inlet | |
| delay time for the secondary salt from the steam generator outlet to the heat exchanger inlet |
References
- Cottrell, W.; Hungerford, H.; Leslie, J.; Meem, J. Operation of the Aircraft Reactor Experiment; Technical Report; Oak Ridge National Laboratory: Oak Ridge, TN, USA, 1955. [Google Scholar]
- Bettis, E.; Cottrell, W.; Mann, E.; Meem, J.; Whitman, G. The aircraft reactor experiment—Operation. Nucl. Sci. Eng. 1957, 2, 841–853. [Google Scholar] [CrossRef]
- Robertson, R.; Briggs, R.; Smith, O.; Bettis, E. Two-Fluid Molten-Salt Breeder Reactor Design Study (Status as of January 1, 1968); Technical Report; Oak Ridge National Laboratory: Oak Ridge, TN, USA, 1970. [Google Scholar]
- Taube, M.; Ligou, J. Molten plutonium chlorides fast breeder reactor cooled by molten uranium chloride. Ann. Nucl. Sci. Eng. 1974, 1, 277–281. [Google Scholar] [CrossRef]
- Luzzi, L.; Di Marcello, V.; Cammi, A. Multi-Physics Approach to the Modeling and Analysis of Molten Salt Reactors; Nova Science Publishers, Inc.: Hauppauge, NY, USA, 2012. [Google Scholar]
- LeBlanc, D. Molten salt reactors: A new beginning for an old idea. Nucl. Eng. Des. 2010, 240, 1644–1656. [Google Scholar] [CrossRef]
- Locatelli, G.; Mancini, M.; Todeschini, N. Generation IV nuclear reactors: Current status and future prospects. Energy Policy 2013, 61, 1503–1520. [Google Scholar] [CrossRef]
- Varma, V.K.; Holcomb, D.E.; Peretz, F.J.; Bradley, E.C.; Ilas, D.; Qualls, A.; Zaharia, N.M. AHTR Mechanical, Structural, and Neutronic Preconceptual Design; Technical Report; Oak Ridge National Laboratory: Oak Ridge, TN, USA, 2012. [Google Scholar]
- Yoder, G.L., Jr.; Aaron, A.; Cunningham, B.; Fugate, D.; Holcomb, D.; Kisner, R.; Peretz, F.; Robb, K.; Wilgen, J.; Wilson, D. An experimental test facility to support development of the fluoride-salt-cooled high-temperature reactor. Ann. Nucl. Energy 2014, 64, 511–517. [Google Scholar] [CrossRef]
- Alekseev, P.; Belov, I.; Ponomarev-Stepnoi, N.; Kukharkin, N.; Subbotin, S.; Udyanskii, Y.N.; Chibinyaev, A.; Shchepetina, T.; Fomichenko, P. MARS low-power liquid-salt micropellet-fuel reactor. At. Energy 2002, 93, 537–546. [Google Scholar] [CrossRef]
- Brovchenko, M.; Kloosterman, J.L.; Luzzi, L.; Merle, E.; Heuer, D.; Laureau, A.; Feynberg, O.; Ignatiev, V.; Aufiero, M.; Cammi, A.; et al. Neutronic benchmark of the molten salt fast reactor in the frame of the EVOL and MARS collaborative projects. Eur. Phys. JN 2019, 5, 2. [Google Scholar] [CrossRef]
- Sheu, R.; Chang, C.; Chao, C.; Liu, Y.W. Depletion analysis on long-term operation of the conceptual Molten Salt Actinide Recycler & Transmuter (MOSART) by using a special sequence based on SCALE6/TRITON. Ann. Nucl. Energy 2013, 53, 1–8. [Google Scholar]
- Fiorina, C.; Aufiero, M.; Cammi, A.; Franceschini, F.; Krepel, J.; Luzzi, L.; Mikityuk, K.; Ricotti, M.E. Investigation of the MSFR core physics and fuel cycle characteristics. Prog. Nucl. Energy 2013, 68, 153–168. [Google Scholar] [CrossRef]
- Beils, S.; Gérardin, D.; Uggenti, A.C.; Carpignano, A.; Dulla, S.; Merle, E.; Heuer, D.; Allibert, M. Application of the lines of defence method to the molten salt fast reactor in the framework of the SAMOFAR project. Epj Nucl. Sci. Technol. 2019, 5, 18. [Google Scholar] [CrossRef]
- Merk, B.; Detkina, A.; Litskevich, D.; Drury, M.; Noori-kalkhoran, O.; Cartland-Glover, G.; Petit, L.; Rolfo, S.; Elliott, J.P.; Mount, A.R. Defining the Challenges—Identifying the Key Poisoning Elements to Be Separated in a Future Integrated Molten Salt Fast Reactor Clean-Up System for iMAGINE. Appl. Sci. 2022, 12, 4124. [Google Scholar] [CrossRef]
- Uhlíř, J.; Juříček, V. Current czech r&d in thorium molten salt reactor (msr) technology and future directions. In Thorium Energy for the World; Springer: Berlin/Heidelberg, Germany, 2016; pp. 139–144. [Google Scholar]
- Huke, A.; Ruprecht, G.; Weißbach, D.; Gottlieb, S.; Hussein, A.; Czerski, K. The Dual Fluid Reactor–A novel concept for a fast nuclear reactor of high efficiency. Ann. Nucl. Energy 2015, 80, 225–235. [Google Scholar] [CrossRef]
- Wang, X.; Macian-Juan, R. Steady-state reactor physics of the dual fluid reactor concept. Int. J. Energy Res. 2018, 42, 4313–4334. [Google Scholar] [CrossRef]
- Wang, X.; Liu, C.; Macian-Juan, R. Preliminary hydraulic analysis of the distribution zone in the Dual Fluid Reactor concept. Prog. Nucl. Energy 2019, 110, 364–373. [Google Scholar] [CrossRef]
- Liu, C.; Li, X.; Luo, R.; Macian-Juan, R. Thermal Hydraulics Analysis of the Distribution Zone in Small Modular Dual Fluid Reactor. Metals 2020, 10, 1065. [Google Scholar] [CrossRef]
- Furukawa, K.; Arakawa, K.; Erbay, L.B.; Ito, Y.; Kato, Y.; Kiyavitskaya, H.; Lecocq, A.; Mitachi, K.; Moir, R.; Numata, H.; et al. A road map for the realization of global-scale thorium breeding fuel cycle by single molten-fluoride flow. Energy Convers. Manag. 2008, 49, 1832–1848. [Google Scholar] [CrossRef]
- Jiang, M.; Xu, H.; Dai, Z. Advanced fission energy program-TMSR nuclear energy system. Bull. Chin. Acad. Sci. 2012, 27, 366–374. [Google Scholar]
- Sides, W., Jr. Control Studies of a 1000-Mw (e) MSBR; Technical Report; Oak Ridge National Laboratory: Oak Ridge, TN, USA, 1970. [Google Scholar]
- Singh, V.; Lish, M.R.; Chvála, O.; Upadhyaya, B.R. Dynamics and control of molten-salt breeder reactor. Nucl. Eng. Technol. 2017, 49, 887–895. [Google Scholar] [CrossRef]
- Zarei, M. Nonlinear dynamics and control in molten salt reactors. Nucl. Eng. Des. 2018, 332, 289–296. [Google Scholar] [CrossRef]
- Zeng, W.; Jiang, Q.; Xie, J.; Yu, T. A fuzzy-PID composite controller for core power control of liquid molten salt reactor. Ann. Nucl. Energy 2020, 139, 107234. [Google Scholar] [CrossRef]
- Zeng, W.; Zhu, W.; Hui, T.; Chen, L.; Xie, J.; Yu, T. An IMC-PID controller with Particle Swarm Optimization algorithm for MSBR core power control. Nucl. Eng. Des. 2020, 360, 110513. [Google Scholar] [CrossRef]
- Tripodo, C.; Lorenzi, S.; Cammi, A. Definition of model-based control strategies for the Molten Salt Fast Reactor nuclear power plant. Nucl. Eng. Des. 2021, 373, 111015. [Google Scholar] [CrossRef]
- Robertson, R.C. Conceptual Design Study of a Single-Fluid Molten-Salt Breeder Reactor; Technical report; Oak Ridge National Laboratory: Oak Ridge, TN, USA, 1971. [Google Scholar]
- Sides, W. MSBR Control Studies: Analog Simulation Program; Oak Ridge National Laboratory: Oak Ridge, TN, USA, 1971. [Google Scholar]
- Shampine, L.F.; Reichelt, M.W.; Kierzenka, J.A. Solving index-1 DAEs in MATLAB and Simulink. SIAM Rev. 1999, 41, 538–552. [Google Scholar] [CrossRef]
Disclaimer/Publisher’s Note: The statements, opinions and data contained in all publications are solely those of the individual author(s) and contributor(s) and not of MDPI and/or the editor(s). MDPI and/or the editor(s) disclaim responsibility for any injury to people or property resulting from any ideas, methods, instructions or products referred to in the content. |
© 2023 by the authors. Licensee MDPI, Basel, Switzerland. This article is an open access article distributed under the terms and conditions of the Creative Commons Attribution (CC BY) license (https://creativecommons.org/licenses/by/4.0/).