Abstract
In this paper, a strategic approach is provided for simultaneously assessing the verification and validation (V&V) test results and the reliability information during product development based on the perspective of the partially accelerated degradation test (PADT) scheme. This approach addresses the obstacle of obtaining prior information on the model parameters for conducting PADT while minimizing the asymptotic variance of the acceleration model parameters. The strategic advantages and characteristics of the PADT, which do not exist in the classical accelerated test (AT) and partially accelerated test (PAT), are presented. In addition, the advantages and suitability of adopting the PADT instead of the partially accelerated life test (PALT) for effectively assessing the reliability information during product development are investigated through illustrative examples.
1. Introduction
The Fourth Industrial Revolution, characterized by the widespread use of smart factories and three-dimensional (3D) printers and scanners, has led to the release of new products within short development times. To ensure product quality, there are various types of tests that need to be conducted, such as conformity, performance, and operational feasibility checks, among others. However, some of these tests can cause damage to the product prototype during environmental testing, while others do not. Additionally, the number of prototypes available is generally insufficient, placing the designer or engineer in a situation where they need to strategize for the efficient use of prototypes in practice. At the same time, the requirements for product reliability and safety are higher than ever, making it challenging to obtain reliable information within a relatively short development period. To address this challenge and obtain precise reliability information that satisfies the requirements quickly, AT plans are widely used in practice.
Although ATs are implemented along with the abovementioned strengths, they have some limitations in practical product development. At first, ironically, prior reliability information on the parameters of the acceleration model is necessary to plan an accelerated test for obtaining the reliability information of the product (see Lim and Yum [1], Sung and Yum [2], and Kim and Sung [3]). However, a newly developed product may not have enough prior reliability information for designing optimal AT plans. Prior information is essential for designing classical accelerated test plans, as the accuracy of the reliability information depends on the quality of the prior information. To solve this issue of prior information, the pre-estimation method is introduced in [1,2,3]. However, there is no clear method provided for selecting the stress levels, test durations, and allocation ratio for each stress level to address this issue.
Second, with respect to the optimization of AT plans, the determined stress levels commonly exceed the normal use conditions. Additionally, it is also challenging to determine the suitable maximum level of stress variables in practice. Furthermore, when more than two stress levels are required, the reliability test requires a relatively large number of test units that cannot be used for other purposes at the same time due to the nature of the reliability test. Normally, the reliability test causes damage to the product and cannot be used to test the product for other purposes. Therefore, a strategic approach is required to solve these practical limitations. That is, the lowest stress level is fixed as the usage condition to address the issue of the unrealistic high stress levels of AT plans. PATs can be a solution to this problem. In the PAT concept, the lowest stress level is set as the normal use condition, enabling the acquisition of reliability information, as well as other general V&V test information, which is conducted under the normal use condition.
In addition, some environmental tests are basically conducted at severe stress levels rather than under the normal use conditions. These environmental tests are well defined in the representative standards or specifications of the product field (e.g., high-temperature operating life (HTOL) tests in JEDEC). In the memory business, the HTOL specification is widely used, and the HTOL test for memory chips is conducted at high temperatures, with the test unit required to survive for a fixed period of time at a minimum. This provides a clue for resolving the limitation of AT plans. Specifically, the temperature specified in the HTOL specification can be considered the maximum stress level of AT plans.
This research provides a strategic approach for simultaneously obtaining the V&V test result and the reliability information, as well as a realistic solution to address the obstacle of obtaining prior information on model parameters, which hinders the application of classical accelerated test plans. While prior information is essential for designing classical accelerated test plans, this research presents a method for obtaining prior information on the lifetime model parameters while also obtaining V&V test results and reliability information on the product. The degradation path and acceleration models with standardized stress variables related to this research are presented through illustrative examples, utilizing existing PADT articles [4,5,6,7].
2. Characteristics of ATs
ATs can be classified into accelerated life test plans (ALTs) and accelerated degradation test plans (ADTs) (see Lim and Yum [1]). These two methods can be categorized by the kind of data collected to estimate the lifetime of products. ALTs observe information on failure times and test censoring times, whereas ADTs obtain degradation information related to the product performance or failure. In other words, an ALT collects direct information concerning the lifetime of a product, while an ADT measures the amount of the degradation of products. However, failures may be rare or nonexistent during a test due to the fact that product reliability is currently high. Thus, ALTs may provide insufficient estimation results. ADTs, on the other hand, provide more precise reliability information, because the degradation data can be observed without failure.
The lowest stress level of the optimal design of a classical AT is generally greater than the use condition. On the other hand, PATs (PALT plans and PADT plans) involve a constraint that the lowest stress level is fixed as the normal use condition. The other characteristics are analogous to the classical AT.
Under PALT plans, this unique characteristic leads to a situation where a proportion of the test units examined under the use condition are very hard to observe for sufficient failures. Therefore, the disadvantage of the ALT is succeeded to PALT that if there are few or no failures, the estimated information may be poor. On the other hand, the PADT properly uses the degradation data to assess the reliability information without failure. The research articles that have utilized this advantage are Lim et al. [4], Kim and Sung [5], and Kim et al. [6].
In addition, the stress loading method plays an important role in building the test plans, because a mathematical model for varying stress levels is required when the stress level is changed during the test period. That is, the cumulative effect model (for details, see Nelson [8]) is required for the (b) step-stress, (c) progressive-stress, and (d) cyclic-stress loading methods, except for the (a) constant-stress loading method, shown in Figure 1. In constant-stress loading, each test unit is subject to a constant stress level. In step-stress loading, an initial low stress level is applied to all test units, and then the stress level is increased to a higher level at a prespecified stress level change time. This is repeated until a prespecified stress level is reached. Progressive-stress loading allows for a test unit to experience a continuously increasing stress level during the test. The progressive-stress loading method has the advantage that the potential stress shocks that may occur in the constant- and step-stress loading can be avoided. The cyclic-stress loading method utilizes an on–off stress pattern to evaluate the product lifetime information. In this study, (a) constant- and (b) step-stress loading methods were used to address the issues of the limitations of classical AT plans, because there is currently no articles on (c) progressive-stress and (d) cyclic-stress loading PADTs.
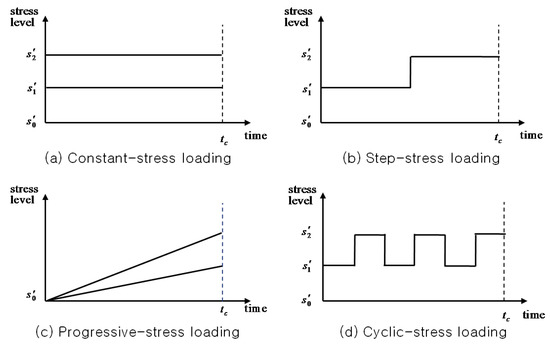
Figure 1.
Stress loading method.
3. Strategical Approach
Most prototypes and/or test samples during the product development are restricted to being used in several tests, such as a various design conformity check, performance requirement test, or other performance- or design-related general tests. These V&V tests play a key role in making important decisions, such as whether to continue or stop the product development project, make design changes, manage yields, redesign or optimize processes, and plan for process control. The decisions that are influenced by the results of V&V tests are often regarded as more critical than those related to a reliability assessment or improvement. In addition, a reliability test generally incurs high costs and takes a long time. Therefore, the reliability test is often given lower priority.
Moreover, the additional reliability test is required for a newly developed product without prior reliability information, because conducting an AT without prior information can result in very poor accuracy of the reliability information; that is, more prototypes may be consumed for estimating the reliability information.
However, with an increasing focus on product liability laws and safety concerns, there is a growing demand for high levels of product reliability. Therefore, a strategic approach that can efficiently conduct a multiple purpose test and estimate the prototype reliability with a small and limited number of test units and a shorter duration of test is required in modern industry.
The strategic approach is as follows: During the product development period, the number of prototypes is limited, and test samples must be efficiently allocated for use in multiple purpose tests, which include various design conformity checks, performance requirement tests, and other performance- and design-related general tests and environmental tests (e.g., HTOL) shown in Figure 2. The goal is to maximize the utility of the test samples and extract as much reliability information as possible, even with limited or no prior information. In the product development stage, most V&V tests are conducted under normal use conditions, but some tests are conducted under harsh condition, such as the HTOL and HTSL. If the HTOL stress level is considered the maximum stress level of ATs, the requirement of conducting PADTs can be satisfied. Therefore, multiple purposes are satisfied by conducting V&V tests as usual and gathering degradation data to obtain reliability information simultaneously.
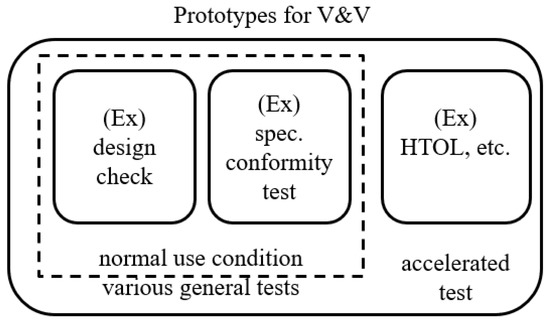
Figure 2.
Usage of prototypes: a strategic approach.
Figure 3 shows an example of the structure of the test time under the constant-stress loading method. The V&V tests are conducted until (a), under the normal use condition, as they generally require a short test duration. An additional test continues until (d) in order to gather the degradation data, since the amount of degradation at (a) is insufficient to analyze the product reliability. At an HTOL stress level, the HTOL test is completed at (b), but the test continues until (c) to collect the reliability data that minimize the asymptotic variance of the model parameters. In other words, there are data from two levels of degradation: one from the normal use condition and one from the severe condition; the maximum likelihood estimation method can be used to estimate the parameters of the degradation path model. Two more factors to consider when developing a strategic approach are the stress loading scheme and the degradation path model. Depending on the type of stress loading method, the test procedures are slightly different. The degradation path model provides the background of the numerical results.
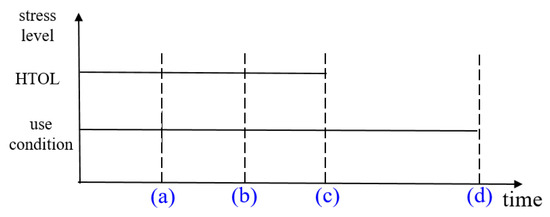
Figure 3.
Test period for each stress level under the constant-stress loading method.
3.1. Stress Loading Scheme
The constant-stress loading method involves subjecting each test unit to a constant-stress level. Normally, the optimal design of a classical constant-stress ADT generally has two different accelerated stress levels (Figure 1a), while three stress levels are applied to check the validity of the parameter–stress relationship (for details, see Sung and Yum [2]). To implement this scheme, an allocation ratio for the test unit to each stress level and a corresponding test time for each stress level are required.
While in the step-stress loading scheme, the applied stress level is changed during the test. Therefore, a mathematical model to describe the effect of changing the stress level during the test is required. The representative model is the cumulative exposure (CE) model, which assumes that the cumulative damage depends only on the current stress level (for details, see Nelson [8]). Figure 4 shows the degradation path model based on the CE model. There are three different levels of stress: normal use condition, maximum, and intermediate stress levels, as shown in Figure 4a. The normal use condition is applied to the multipurpose general tests, the maximum stress level is used for environment tests such as the HTOL, and the intermediate stress level is used to check the model’s validity. For the case of the step-stress loading scheme, the mathematical model for the test plans of Kim and Sung [5] are used to develop the strategic approach. All test units are located in the same chamber, if possible, and the test starts at the normal use condition. After, the stress level increases to the maximum stress level; finally, the intermediate stress level is loaded at the end of the test. An advantage of step-stress loading over constant-stress loading is that it can further reduce the test time or resources. For example, let us assume that there is only one test chamber that is large enough to load all test units. In this case, the experimenter would need to perform at least two consecutive tests using the constant stress loading method. However, if the step-stress loading method is applied, it would take half the time, because the test is finished with a single test. In addition, in this paper, the proportion of the prototypes for each stress level was not required, such as in the constant-stress loading method. By adopting step-stress loading, all prototypes were tested under the same stress pattern, eliminating the need for prior information.
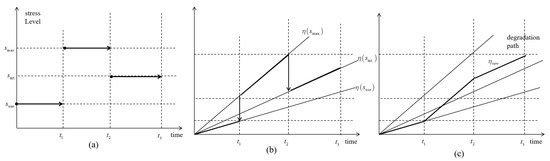
Figure 4.
Test period for each stress level under the step-stress loading method.
3.2. Degradation Path and Acceleration Model
For estimating the reliability information, a specific statistical model is required. If lucky, there is prior reliability information for the statistical model of the product or the prototype. In many practical cases, however, the prior reliability information is not available. To address this limitation, in this study, a degradation path model based on the Wiener process was introduced (for details, see Sung and Yum [2]). The Wiener process is widely adopted for its mathematical tractability and simplicity. Based on these advantages, the Wiener degradation path model is recommended for estimating reliability information with no prior information. The Wiener degradation path model, W(t), with a drift, η, and diffusion constant, σ2, has the following properties:
- (1)
- W(0) = 0;
- (2)
- {W(t)|t ≥ 0} has stationary and independent increments;
- (3)
- For 0 ≤ t1 < t2, the increment, ∆W (=W(t2) − W(t1)), is normally distributed with the mean η(t2 − t1) and variance σ2(t2 − t1).
Let Y(t) be the degradation characteristic at time t, and define y(t) = Y(t) − Y(0). In this research, y(t) is modeled as the degradation quantity from the Wiener degradation path, and it is assumed that the drift, η, depends only on the current stress level. Based on the Wiener degradation path model and the assumption of the CE model, the different segments of the degradation increment in Figure 4b can be merged in the single degradation path shown in Figure 4c. To estimate the degradation quantity from the degradation path for the different stress levels, an acceleration model is required for calculating the mean degradation quantity. When dealing with a single variable and a constant- or step-stress loading scheme, acceleration models, such as the Arrhenius law, exponential law, and power law, can be standardized using a simple linear form. For example, Meeker et al. [9] and Tseng and Wen [10] adopted temperature as a stress variable and analyzed ADT data based on the Arrhenius model. Padgett and Tomlinson [11] considered the power model in analyzing ADT data for fatigue crack.
- Arrhenius model: ;
- (Inverse) power model: ;
- Exponential model: .
To simplify the acceleration model without losing generality, the stress level is standardized as follows (e.g., see Lim and Yum [1]):
where and mean the normal use condition and the maximum stress level, respectively. Applying the above standardization results in the following: s0 = 0, sM = 1, and 0 ≤ si ≤ 1 for i = 1 and 2 for the two-stress case and i = 1, 2, and 3 for the three-stress case. The drift at stress level can then be re-expressed in terms of si, as follows:
where:
for the Arrhenius model;
for the power model;
for the exponential model.
In the case of two stress variables, the generalized Eyring model, which can easily be standardized by a simple linear form, is utilized as the acceleration model. For instance, Chang [12], Tang and Chang [13], and Tseng and Peng [14] employed the generalized Eyring model for the relationship between a parameter and the two stress variables in analyzing ADT data.
- Generalized Eyring model:
In this acceleration model, and represent the different stress variables. To simplify the acceleration model without the loss of generality, the stress levels of each variable, and , were standardized as Sa,i and Sb,j, respectively. The drift can be rewritten in terms of Sa,i and Sb,j, as follows:
where , , , and . Equation (2) is a modified drift of the Wiener degradation path that organizes by , , , and . Note that , , +, and are always positive, since , , , and .
3.3. Two-Phase Approach for Estimation
Based on the degradation path and the acceleration model, a two-phase approach has been developed to provide a strategic solution for obtaining the V&V test result and the reliability information simultaneously, as well as to address the obstacle of obtaining prior reliability information on the model parameters. The basic idea behind this two-phase approach is simple: to maximize the utilization of the fixed settings of the V&V tests.
These V&V tests can be categorized by the stress level they apply, such as the normal use condition and the harsh condition. These stress levels and the number of test units for each stress level are predetermined, because these tests are related to the performance and quality of the product either before or during the development period. As a result, the normal use condition and the highest harsh condition can be regarded as s0 and sM, respectively. That is, during the V&V tests, the additionally observed degradation data and the loaded stress levels are used to analyze the reliability information. The test durations for these two stress levels are extended, because the duration of V&V tests are generally shorter than the required duration for the reliability estimation. This constitutes the first phase. In addition, based on the D-optimality criteria, the small number of test units are additionally added to the harsh condition, because, generally, the number of tests under the normal use condition is greater than the number of tests under the harsh condition.
In consideration of the number of test units used in the first phase, the second phase is designed. The main purpose of the reliability test in the second phase is to perform compromise tests to minimize the asymptotic variance and to verify the presence of possible curvature effects in the relationship between the parameters and stress variables. In ATs, the number of test units at the low stress level is greater than the number of test units at the maximum stress level. However, in the first phase, due to the D-optimality condition, the number of test units under the normal use condition and the maximum stress level is the same. Therefore, based on the first-phase reliability information, a different number of test units are added to each stress level, and the new stress level and the number of test units for the compromise test are determined to minimize the asymptotic variance. That is, the additional number of test units for each stress level and the new stress level are the decision variables in conducting this strategic approach.
4. Illustrative Examples
In this section, four examples based on the different test scenarios are illustrated in the field of semiconductor business. In semiconductor business, there are special characteristics where enough semiconductor chips are available, the test temperature is well known and regarded as the stress variable, and the temperature level of the HTOL mentioned in the JEDEC standard JESD-47 is considered the maximum stress level. Based on these characteristics, Table 1 shows a brief description of each example.

Table 1.
Description of the examples.
4.1. Example: Single Variable and Constant-Stress Loading
Let us assume that there are 100 semiconductor prototypes at the development stage, and there is no prior reliability information about the developed products. The degradation characteristic is repeatedly observed, and the failure mechanism is assumed to follow the Arrhenius model. The maximum level and use condition are specified as 125 °C and 55 °C, respectively, by the test specification. That is, by Equation (1), the temperature levels 125 °C and 55 °C are standardized as s0(=0) and sM(=1), respectively. The available test time is 504 h, and the measurements are conducted 21 times at equally spaced intervals.
In this example, in the first phase of estimating the prior reliability information, 10 of the 100 units (as planned by the stakeholder department) are used for the design check under the normal use condition. In addition, eight units (as specified in the test document) are used for the HTOL test with a planned duration of three days, as stated in the internal specifications of the private electronic company. In addition to the above 18 units used, 2 units are additionally loaded into the HTOL test chamber to meet the D-optimality condition of Lemma 1, as in Lim et al. [4]. This three-day test is regarded as the test for estimating the prior reliability information. The degradation data are available, and the model parameters for selecting the PADT design for the second phase are estimated using the MLE method. Then, a reliability engineer selects an additional seven days of testing to obtain precise reliability information. According to the test plan presented in Lim et al. [4], it is assumed that 54 units are additionally loaded at the normal use condition and 1 unit is additionally allocated to the maximum stress level (125 °C). Furthermore, 25 units are tested at the intermediate stress level (95.1 °C) for checking the model’s validity. Figure 5 outlines the example.
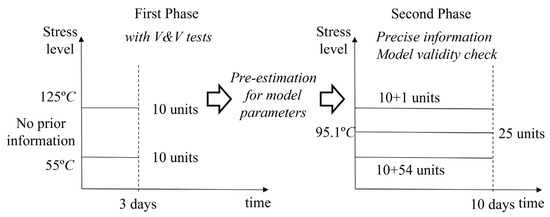
Figure 5.
Strategic approach: single variable and constant-stress loading case.
According to Equation (1), the drifts of the mean degradation path model under the normal use condition and the maximum stress level are and , respectively. Then, the drift ratio between the maximum stress level and the normal use condition, , is calculated as exp(δ1). In the example by Lim et al. [4], δ1 is equal to three, and it is known that the drift ratio is calculated as 20.09. This means that the degradation increment at the maximum stress level is approximately 20 times greater than the normal use condition.
4.2. Example: Two Variables and Constant-Stress Loading
There are 3000 samples from a prototype of a semiconductor. The degradation path model depends on the temperature, Sa,i, and the voltage stress, Sb,j. Therefore, the generalized Eyring model for the accelerated model is assumed between the parameter and the stress relationship. Both the maximum and the normal use conditions of the temperature and the voltage stress are specified as 130 °C and 45 °C and 4.4 V and 3.8 V, respectively.
According to Lemma 1 in Kim et al. [6], 20 units are allocated to the V&V tests under the normal use condition, the high-temperature operating life (HTOL) under the maximum temperature and the normal use voltage, the voltage limit tests under the normal use temperature and maximum voltage, and the biased highly accelerated stress test (HAST) for the combination of the maximum stress levels. In other words, 80 units among the 3000 samples are used to estimate the prior information for the acceleration model parameters. Thus, the prior information can be obtained by using the degradation data from the above tests with 80 units. Based on the estimated results, four units are added to the V&V tests under the normal use condition and 457, 557, and 92 units are allocated for the voltage limit test, the HTOL, and the HAST, respectively. A total of 1810 units are tested under the middle-stress levels, which are calculated based on model assumption 4 in Kim et al. [6]. In the semiconductor area, qualification tests should be used to verify the various item requirements. In particular, the HTOL and the HAST are included in the qualification tests along with 231 and 75 units, respectively. Therefore, the units for the tests and the reliability information can be more effectively applied during the qualification. Figure 6 shows an overview of this test.
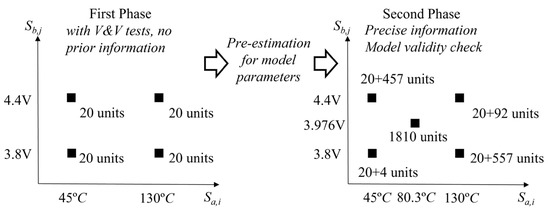
Figure 6.
Strategic approach: two variables and constant-stress loading case.
According to Equation (2), the drifts of the mean degradation path model at the combination of the normal use conditions and the maximum stress levels are and , respectively. Then, the drift ratio between the combination of the maximum stress levels and the normal use conditions, , is calculated as exp(δ1 + δ2 + δ3). In the example by Kim et al. [6], the δ1, δ2, and δ3 are equal to 5, 6, and −3, respectively, and it is known that the drift ratio is calculated as 2980.95. This means that the degradation increment at the maximum stress level is approximately 2981 times greater than the normal use condition. Note that the term δ3 means the negative curvature effect between the temperature and the voltage in this example.
4.3. Example: Single Variable and Step-Stress Loading
It is assumed that 20 prototypes of a semiconductor are available for the V&V tests at the end of development. The electrical performance characteristic is dependent on the temperature. The maximum and normal use conditions are specified as 125 °C and 55 °C, respectively. Additionally, the acceleration model is not clearly known, but based on the experience of the experimenter, the Arrhenius model is adopted as the acceleration model. The total available test time is 480 h, and important tests, such as the operation feasibility, HTOL, and reliability tests, must be completed in 20 days. To conduct the test, 21 measurements are selected every 24 h, and measurement times of 10, 4, and 6 days are chosen for the normal use condition, maximum stress level, and intermediate stress level, respectively. These stress loading patterns are shown in Figure 7. These decisions depend on the experimenter’s experience and the time required for the V&V tests. For example, the internal specifications of the private electronic company state that the HTOL test duration is to be set to 96 h; therefore, four measurement times are selected. Based on the previous experience and knowledge from the reliability test, the experimenter knows that the normal stressed operation test requires more time than the HTOL test. Thus, the experimenter can choose a test duration of 4 to 16 days under the normal use condition. Here, it is assumed that the experimenter finally selects 10 days. Then, to check the curvature effect and the acceleration model validity, the units are tested over the remaining 6-day period. That is, one of the decision variables in a classical AT, the test time, does not need to be solved by the mathematical models. There is only one decision variable to calculate, which is the intermediate stress level for the compromise concept plan. Kim and Sung [5] provide the intermediate stress level as 94.6 °C.
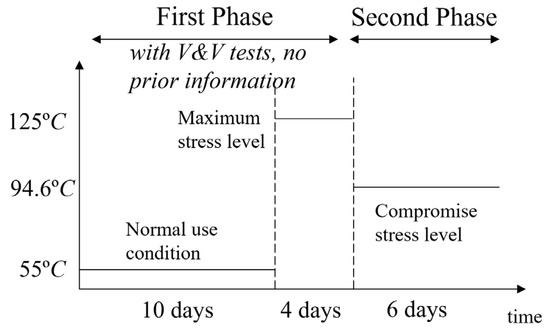
Figure 7.
Strategic approach: single variable and step-stress loading case.
4.4. Example: Two Variables and Step-Stress Loading
This example is taken from Kim et al. [8]. It is assumed that there are 300 prototypes of a semiconductor available for the test, and the experimenter wants to obtain the results of the HTOL (at the maximum temperature and the normal use voltage) and HAST (at the maximum temperature and the maximum voltage) tests. The total test duration is given as 28 days, and the generalized Eyring model is selected for the acceleration model, since it is assumed that the degradation path model is dependent on the temperature and voltage stresses. For the temperature stress, the maximum and normal use conditions are specified as 130 °C and 45 °C, respectively. For the voltage stress, 4.4 V and 3.8 V are determined as the maximum and normal use conditions for the voltage stress, respectively. According to the experience and time required for the V&V tests, the experimenter allocates the measurement times of 8 (mid-intermediate condition) and 5 days (the other condition). By using the step-stress loading method, it is not necessary to find the allocation ratio of the prototypes, and the test design of the second phase is simpler than the constant-stress loading method. This is decided depending on the HTOL test and durations of at least 96 h based on the JEDEC standard of the semiconductor manufacturer. In addition, a longer test duration is applied under the normal use conditions.
In the first phase, the units are tested under the normal use condition, HTOL test condition, voltage limit test condition (at the normal use temperature and the maximum voltage), and HAST condition, in that order, for 20 days. The tests begin at time 0, and initially, 300 samples are tested for the V&V under the normal use condition. In addition, the degradation increment is observed every 24 h from time 0. After 5 days, all samples are placed in a test chamber with a power supply installed and exposed under the voltage limit test condition. The HTOL test is then conducted for the next 5 days (until day 15). Finally, the HAST condition is applied to the units until the end of the first phase. Upon completion of the HAST condition test, the parameters of the acceleration model can be estimated based on the reliability information from the aforementioned tests. The compromise concept conditions are determined as and , respectively. To identify the curvature effect, the test continues for the remaining duration, 8 days (), during the second phase. The outline of the proposed test strategy is illustrated in Figure 8.
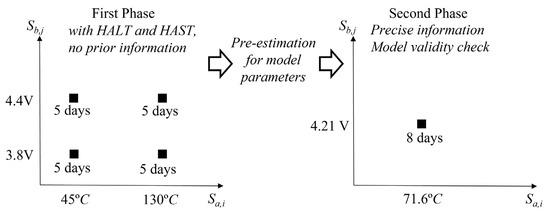
Figure 8.
The test conditions based on the proposed strategy.
5. Conclusions
This study provides a strategic approach for simultaneously conducting V&V tests and assessing the reliability information based on the various PADT schemes. In many cases during the development of new products, it is not desirable to rely solely on prototype creation to obtain precise reliability information, either to save on costs or product development time. In addition, with a strategic approach, the environmental variable levels required to estimate the reliability information of a newly developed product can be reused from the levels of environmental conditions in various V&V tests. In other words, it is shown that the PADT scheme is suitable approach for addressing the lack of prior information in a classical AT. The illustrative examples, such as the constant- and step-stress loading methods with a single and two stress variables, are provided based on articles on the PADT [4,5,6,7].
One fruitful area of future research may be to extend the present study to the gamma degradation path PADT model. In addition, a statistical model for three-stress variable PADT plans may be developed. Finally, PADT plans in which the progressive-stress loading method is employed may be considered.
Funding
This work was supported by a Kyonggi University Research Grant 2020.
Conflicts of Interest
The author declares no conflict of interest.
References
- Lim, H.; Yum, B. Optimal design of accelerated degradation tests based on Wiener process models. J. Appl. Stat. 2011, 38, 309–325. [Google Scholar] [CrossRef]
- Sung, S.; Yum, B. Optimal design of step-stress accelerated degradation tests based on the Wiener degradation process. Qual. Technol. Quant. Manag. 2016, 13, 367–393. [Google Scholar] [CrossRef]
- Kim, S.; Sung, S. Optimal design of cyclic-stress accelerated life tests for lognormal lifetime distribution. Qual. Technol. Quant. Manag. 2023, 20, 236–255. [Google Scholar] [CrossRef]
- Lim, H.; Kim, Y.; Bae, S.; Sung, S. Partial accelerated degradation test plans for Wiener degradation processes. Qual. Technol. Quant. Manag. 2019, 16, 67–81. [Google Scholar] [CrossRef]
- Kim, Y.; Sung, S. Practical lifetime estimation strategy based on partially step-stress-accelerated degradation tests. In Proceedings of the Institution of Mechanical Engineers, Part O: Journal of Risk and Reliability; Sage Publications: Newbury Park, CA, USA, 2017; Volume 231, pp. 605–614. [Google Scholar]
- Kim, S.; Lim, H.; Sung, S.; Kim, Y. Planning of Partially Accelerated Degradation Test with Two Stress Variables for Practical Lifetime Estimation. Appl. Sci. 2018, 8, 2162. [Google Scholar] [CrossRef]
- Kim, S.; Sung, S.; Kim, Y. Practical design of partially accelerated degradation test with two stress variables under step-stress loading scheme. Submitted to publication.
- Nelson, W. Accelerating Test: Statistical Models, Test Plans and Data Analysis; John Wiley & Sons: New York, NY, USA, 2009. [Google Scholar]
- Meeke, W.; Escobar, L.; Lu, C. Accelerated degradation tests: Modeling and analysis. Technometrics 1998, 40, 89–99. [Google Scholar] [CrossRef]
- Tseng, S.; Wen, Z. Step-stress accelerated degradation analysis for highly reliable products. J. Qual. Technol. 2000, 32, 209–216. [Google Scholar] [CrossRef]
- Padgett, W.; Tomlinson, M. Inference from accelerated degradation and failure data based on gaussian process models. Lifetime Data Anal. 2004, 10, 191–206. [Google Scholar] [CrossRef] [PubMed]
- Chang, D. Analysis of accelerated degradation data in a two-way design. Reliab. Eng. Syst. Saf. 1993, 39, 65–69. [Google Scholar] [CrossRef]
- Tang, L.; Chang, D. Reliability prediction using nondestructive accelerated-degradation data: Case study on power supplies. IEEE Trans. Reliab. 1995, 44, 562–566. [Google Scholar] [CrossRef]
- Tseng, S.; Peng, C. Stochastic diffusion modeling of degradation data. J. Data Sci. 2007, 5, 315–333. [Google Scholar] [CrossRef] [PubMed]


Disclaimer/Publisher’s Note: The statements, opinions and data contained in all publications are solely those of the individual author(s) and contributor(s) and not of MDPI and/or the editor(s). MDPI and/or the editor(s) disclaim responsibility for any injury to people or property resulting from any ideas, methods, instructions or products referred to in the content. |
© 2023 by the author. Licensee MDPI, Basel, Switzerland. This article is an open access article distributed under the terms and conditions of the Creative Commons Attribution (CC BY) license (https://creativecommons.org/licenses/by/4.0/).