Abstract
In this work, hourly measurements of global solar irradiances obtained from pyranometers and sunshine duration data using either Kipp & Zonen CSD3 automatic sensors or Campbell–Stokes sunshine recorders were assessed through an extensive quality control procedure and statistical analysis on the measured and derived solar parameters for all the actinometric stations installed in various locations over the island of Cyprus, covering mainly the period 2019–2021. This information is useful for engineers concerning the solar energy capture systems and energy efficiency who can therefore take knowledge of the local radiation levels. Monthly mean hourly values of global radiation and sunshine duration are calculated and shown through isoline diagrams. During June or July, daily global irradiations ranged between 25 MJ/m2 and 30 MJ/m2, with the lowest occurring in the mountainous locations. On the other hand, in January or December, they ranged between 6.5 MJ/m2 and 10.5 MJ/m2. The total annual number of hours of sunshine duration ranged between 2500 and 3500, with the lowest values recorded at the mountainous sites. The clearness index and relative sunshine duration were used for the classification of the weather conditions over the island. Furthermore, the interrelationships between the said indices were used for the estimation of global radiation. This work has specifically contributed to the characterization and analysis of hourly and daily solar global radiation. Furthermore, the measurements on the ground level could be compared with satellite observations in order to improve the geographical distribution of global radiation, especially in areas where no measurements exist. The analysis could be also extended for the other shortwave radiation components (Direct, Diffuse and Photosynthetic Active Radiation (PAR)) in order to assess the solar radiation regime over the island.
1. Introduction
Solar radiation is the main source of energy that affects the atmospheric environment [1], climate [2] and ecosystems [3]. The knowledge of the local solar radiation profile is important for the design solar energy systems. Information on solar energy is used in many applications that seek to optimize the capture of solar energy, so that it is possible to reach energy savings and carry out sustainable energy consumption [4,5,6]. Furthermore, solar radiation data are essential for applications in meteorology, agriculture, crop modeling as well as in the health sector [3,7]. Two elements of solar radiation components are the most popular elements registered by weather stations: (i) global irradiance data measured on a horizontal surface and (ii) sunshine duration (SD). The SD is recorded as long the direct normal solar irradiance exceeds the value of 120 W/m2. However, the sunshine duration is a parameter of secondary significance in the determination of the climatology at a site, while the prime parameters are temperature, humidity, wind, precipitation, and solar radiation [8,9,10,11]. Nevertheless, sunshine duration is important in estimating solar radiation [11]. Additionally, solar radiation fractions, such as the direct and diffuse fractions to global radiation, are required for several applications. For example, the direct component is a basic input to predict the performances and to design concentrating solar plants [8]. Different models can be found in the literature to estimate these two components.
The solar radiation intensity is affected by the presence of the atmospheric constituents [12,13,14], the variations in the amount and texture of clouds as well as by the Sun-Earth geometry [1]. Therefore, clouds and aerosols are the main factors that play a significant role in determining the solar radiation climate at a site. These factors vary over space and time, causing an analogous variability in solar radiation.
The estimation of global irradiance and the prediction of its components, i.e., direct, diffuse and reflected radiation, has been widely discussed in the literature. Since the pioneer contribution by Liu and Jordan [15], several models and comparative analyses have been presented and discussed. An extensive review of the measurements and modeling of all shortwave radiation components has been given by Badescu [11] and more recently by Wald [16]. Generally, two categories of solar radiation models can be distinguished. In the first category belong models that are based on meteorological data, such as cloudiness, sunshine duration, and turbidity of the atmosphere [17,18,19,20,21]. Details about the computation procedure of the said models are given by Myers [22]. In the second category belong models that use the decomposition method where the global irradiance is split into its direct and diffuse components and are basically based on clearness index and diffuse or direct fractions. In this category, we could classify the models of Orgill and Hollands [23], Erbs et al. [24], Skartveit et al. [25], and Boland et al. [26] could be classified, to mention just some of them. The separation models are still highly popular [27]. They are often described as site-dependent in the literature because they are essentially empirical in nature. The Bolland model was found to perform satisfactorily at different sites of the world. Furthermore, in order to cover wide areas on Earth, satellite observations are supplied [28,29].
The solar radiation climate provides the levels, trends, and frequencies of global radiation and its components. Indicative studies for different parts of the world have been published in the literature. For example, Diabatė et al. [30] presented the solar climate of Africa, while Kambezidis [5] reported the solar climate of Athens. More recently, Kambezidis [2] presented the solar climate and the sky-status climatology of Greece [31]. The first study was based on the hourly values of solar parameters obtained from typical meteorological years (TMYs) for 43 locations in Greece. In his second study, he investigated the sky conditions climatology based on the clearness index (kt) and diffuse fraction (kd). For this purpose, he defined the following limits for sky conditions: for clear 0 < kd < 0.26, for intermediate 0.26 < kd < 0.78, and for overcast skies 0.78 < kd < 1. In a recent paper, Kambezidis et al. [32] developed a mathematical method to determine the said limits, using 14 sites from different locations around the world. Another recent study that describes the solar radiation climatology for Camagüey of Cuba was presented by Antuña-Sánchez et al. [33]. Apeh et al. [34] studied the variation of the radiation indices in Alice of South Africa in order to characterize the solar climate of the area.
Regarding Cyprus, an assessment of the solar radiation climate was presented by Jacovides et al. [35], while a number of works were published in the last five years that investigate the statistics of various shortwave and longwave solar radiation components based on measurements at two locations [6,36]. An attempt was made by the project Solargis [37] to present an annual map of the island with respect to the average global and direct horizontal radiation, based mainly on satellite data. However, no such study has been conducted for the whole island using ground surface measurements. Therefore, the present work provides an analysis of the global radiation and sunshine duration as well as the classification of sky types based on clearness index. The measurement sites were classified into four categories according to their elevation and their distance from the coast, i.e., coastal (0–300 m], inland plain (0–300 m], semi-mountainous (300 to 800 m] and mountainous (>800 m) locations. The first objective of this work was to assess the measurements obtained by pyranometers and sunshine duration sensors through an extensive quality control procedure and perform statistical analysis on the measured and derived parameters. This information will be useful to engineers concerned to solar energy capture systems and energy efficiency who can therefore take knowledge of the local radiation levels. Furthermore, global radiation can be used to estimate other radiation components such as UV, Reflected, and PAR radiation [36].
The paper is organized as follows: Section 2 describes the materials and methods that were used to estimate extraterrestrial irradiances, including the quality control procedure that was followed for both hourly and daily values. Section 3 presents a detail statistical analysis of global radiation and the derived radiation indices for both hourly and daily values. The analysis covers the daily variation, the monthly variability, the statistical relationships between global radiation and sunshine duration, as well as the geographical distribution of the relevant parameters through isoline diagrams. Section 4 concludes this paper and provides suggestions for future research.
2. Materials and Methods
Hourly data of global horizontal irradiance (G) were obtained from automatic weather stations located in different parts of the island, covering mainly the period 2019–2021. Most of the pyranometers were supplied by the Kipp & Zonen Company. For the sunshine duration data, Kipp & Zonen CSD3 sunshine duration sensors were used. The sensors faced south with a slope (β) of 35° (local latitude) from the horizontal plane. The sunshine duration sensor, at the same time, measures the direct normal irradiance (Bn) in W/m2. The measured normal irradiance is less accurate than the value obtained by pyrhiliometers, which are installed on a solar tracker system. The experimental error of CSD3 recorders for direct normal irradiance ranged between 5% and 10% (Kipp and Zonen, personal communication).
The photosynthetic active radiation was measured by the PAR-LITE Quantum Sensor of Kipp & Zonen company in μmol/s/m2 with an experimental error of about 5%. This measurement represents the number of photons between 400 and 700 nm incidents on a square meter per second. The conversion factor of 4.57 μmol/J proposed by McCree [38] was used to convert the Photosynthetic Photon Flux Density (PPFD) into its energy alternative (PAR) in W/m2. All sensors were factory calibrated. Additionally, the stations were equipped with air temperature and relative humidity sensors, which are installed at the screen level of 1.2 m above the surface. Also, wind speed and direction are measured at a height of 10 m. The coordinates of the stations, the type of the models of the radiation equipment and their calibration factors, as well as their period of measurements are presented in Table 1a, while the position of the stations is also shown in Figure 1. Table 1b shows the meteorological stations equipped with Campbell–Stokes sunshine recorders operated in different periods. Recently, no stations are operated with this type of sunshine recorder. The stations were classified into coastal, plain (0 to 300 m], semi-mountainous (300 to 800 m], and mountainous (800 to 1750 m). The geographical distribution of the stations was considered satisfactory.
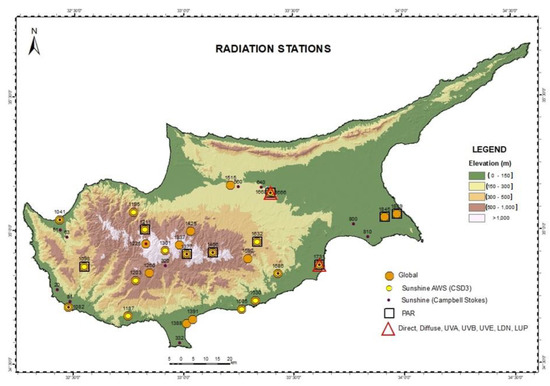
Figure 1.
Map of Cyprus showing the location of the actinometric stations.
Regarding the climate, Cyprus has an intense Mediterranean climate with the typical seasonal rhythm strongly marked in respect of temperature and rainfall. Hot and dry summers last from mid-May to mid-October and mild, rainy, rather changeable, winters last from November to mid-March, separated by short autumn and spring seasons. Periodically, the island is under the effect of the Saharan Air Layer, which is characterized by high content of mineral dust. Dust conditions are more frequent in spring and autumn, although they are observed in some cases in winter and summer.
The annual mean temperature for Cyprus varies from year to year, from 16.1 °C to 19.7 °C, with an average of 17.5 °C. Daily temperatures during the hottest months of July and August ranged between 30 °C on the central plain and 24 °C on the Troodos Mountains. The average maximum temperatures for these two months ranged between 27 °C in the mountains areas and 38 °C in plain areas. In January, the coolest month, the indicative daily temperature was 10 °C on the central plain and 3 °C on the higher parts of the Troodos Mountains, while the average minimum temperatures were 5 °C and 0 °C, respectively. The mean annual precipitation varied from year to year and from place to place. The lowest mean annual precipitation for Cyprus was 213 mm in 1972–1973 and the highest was 759 mm in 1968–1969. The mean annual precipitation for the period 1961–1990 was 503 mm. The wettest months are normally December, January, and February and the driest are July, August, and September. Statistical analysis of rainfall reveals a decreasing trend of rainfall amounts in the last 30 years.
The annual average daily global radiation was 19.5 MJ/m2 for the coastal stations, about 19.0 MJ/m2 for the inland plain and semi-mountainous areas, while for the mountainous areas it was about 17.5 MJ/m2. The mean annual daily sunshine duration was about 8.8 h in coastal and inland plain areas, while in the mountainous areas it was about 7.5 h. Over the whole summer, six months have an average of 11.5 h of bright sunshine per day, while in winter this was reduced to 5.5 h in the cloudiest months, of December and January.
2.1. Estimation of Global Solar and Extraterrestrial Irradiances on a Horizontal Surface
The irradiance falling on a plain at normal incidence at the top of the atmosphere (G0n) can be estimated from the following equation [16]:
where dn is the day of the year (1.365) and Gsc is the solar constant (1367 W/m2). Then, the irradiance on a horizontal plain at the top of the atmosphere can be estimated by the following equation:
where θz is the solar zenith angle (SZA), which is given by:
ϕ is the latitude of the location, δ is the solar declination angle (deg), and ω is the hour angle (deg). The solar declination and hour angles are estimated by the following equations:
where t is the hour of the day.
The daily total global irradiation, which is obtained by a horizontal plain at the top of the atmosphere (G0d), is given by the following equation:
where ωs is the sunset hour angle and is given by:
The daily values of the radiation components are obtained from the sums of the hourly values. Furthermore, the astronomical day length (S0d), which is the computed time during which the center of the solar disk is above an altitude of zero degrees (without allowance for atmospheric refraction), is given by:
The clear-sky irradiance was estimated using the Haurwitz [39] model, which is a function of the zenith angle. This model was tested by Ianetz [40] in Israel showing high performance. The equation involved in the said model is shown below:
Almost a similar equation was obtained using the maximum values of global irradiances of the actinometric station of Farmakas:
The horizontal beam irradiance (B) can be calculated from the normal beam irradiance (Bn) from the following equation [16]:
Then, the hourly diffuse irradiance (D) is the difference of global (G) and direct horizontal irradiance (B):
Estimation of Radiation Indices and Classification of the Sky Conditions
For the classification of the sky conditions, we use the clearness index (kt), which is defined as the ratio of global irradiance (G) to the extraterrestrial irradiance (G0) both measured on horizontal surfaces:
The upper bound of the kt ratio is 1, although it can be slightly higher than 1 during partially cloudy conditions, when total irradiance may be enhanced due to the reflection of solar irradiance from the base of the clouds and from the scattering of direct irradiance due to cloud particles. Such periods of enhanced solar irradiance may last from several seconds to some minutes depending on the cloud motion [41].
Four sky categories have been proposed by Pashiardis et al. [6], based on the relation between hourly irradiances of global, direct and diffuse radiation, and the clearness index (kt), as well as the relative sunshine duration (σ = Sd/S0d):
Class I: Cloudy: kt ≤ 0.35 or σ ≤ 0.3
Class II: Partially cloudy with predominance of diffuse component: 0.35 < kt ≤ 0.55 or 0.3 < σ ≤ 0.6
Class III: Partially cloudy with predominance of direct component: 0.55 < kt ≤ 0.65 or 0.6 < σ ≤ 0.85
Class IV: Clear sky: kt > 0.65 or σ > 0.85
For the stations equipped with the CSD3 sunshine sensors, the following radiation indices can be also calculated:
2.2. Quality Control Process
2.2.1. Quality Control of Hourly Values
Fingerprint plots demonstrating the variation of each radiation component are used to check for any major problems with the data before testing every single variable. In these plots, the x-axis represents a day in the year and the y-axis represents an hour of the day, with a color scale from blue to red showing the various levels of the presented variables. The graphs of all the stations do not show any major problem with the measurements.
The quality control procedures for the solar irradiances are based on checking whether the measurements are within certain limits, such as physically possible limits (PPL) and extremely rare limits (ERL) as proposed by BSRN network [42]. The PPL process checks extremely large errors in radiation data, while the ERL process identifies cases that exceed the rare limits over very short time periods. The lower bound of the limits is naturally zero, although BSRN suggests −4 W/m2 for PPL and −2 W/m2 for ERL lower limits of the radiation components. The upper bound of these limits is shown in Table 2.

Table 2.
The upper bounds for the “physically possible” (PPL) and “extremely rare” (ERL) limits as proposed by BSRN group, which are used for checking the radiation parameters.
The following plot illustrates the various tests outlined in the preceding paragraphs based on the hourly measurements. Figure 2 shows the highest limits of global irradiances as a function of solar zenith angle, at Pentakomo (coastal location). Similar graphs were obtained from the other locations. The analysis shows that all the data are within the proposed limits. Lefkara Dam and Zygi were excluded from the analysis because they did not pass these quality control limits.
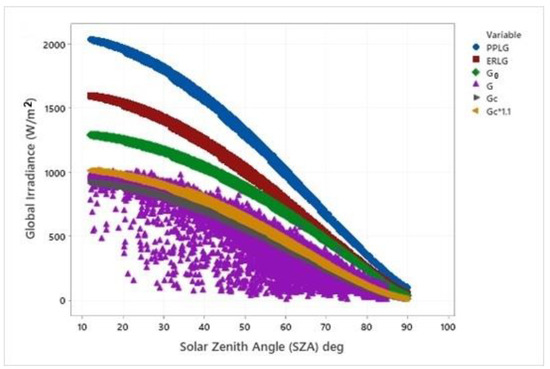
Figure 2.
Hourly global irradiances (W/m2) as a function of solar zenith angle (SZA) with their PPL and ERL limits at Pentakomo (coastal location).
The comparison tests were concentrated on the ratios of kb, kd, and kt. The ratio kb is always lower than 1. The upper bound of the kd ratio is 1, although it can be slightly higher than 1 (i.e., 1.15). This usually occurs in the morning after sunrise or in the afternoon before sunset when the solar elevation angle is low, and the diffuse irradiance is slightly higher than that of global irradiance due to the cosine effect of the lower sun angles. Therefore, to avoid this problem, cases of diffuse irradiances below 5° of sun elevation angle were excluded from the dataset [43]. Only few observations were considered invalid when low kd values are associated with low kt values. This occurs when the sensor was covered with environmental debris.
The step test was based on time consistency, which compares the difference between successive measurements. If the difference exceeds an allowed value, then both observations are flagged as suspects. Estevez et al. [44] proposed the following values for different variables: for hourly global irradiance, the limit was 555 W/m2, and for hourly temperature, it was set to 7 °C, while for relative humidity he suggested the value was 45%. The dataset confirmed the limits of the above variables.
Finally, the persistency test was applied to check the variability of the measurements. When a sensor fails, it will often report a constant value. No days have been detected with a constant value.
2.2.2. Quality Control of Daily Values
The quality control process was also extended to the daily sums of global solar irradiation and daily sunshine duration values. Firstly, the daily values of global irradiation (Gd) were checked against the extraterrestrial daily irradiation (G0d). The daily values of Gd should be lower than G0d, but they should be higher than the lower limit of during overcast conditions [45]. As can be seen in Figure 3, Gd is lower than the upper limit of G0d and it is generally higher than the lower limit.
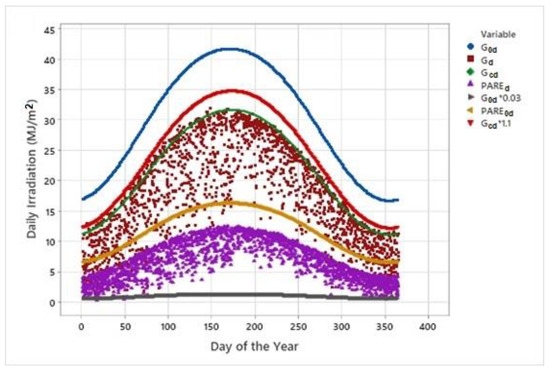
Figure 3.
Daily totals of global irradiation (MJ/m2) compared to the respective extraterrestrial and clear-sky irradiation at Athalassa.
The second test was a comparison test between the extreme values of daily sums of global irradiation and the respective daily sums on clear days. The daily sums should only exceed the clear-sky values with high atmospheric transparency by a small amount, i.e., .
Finally, the daily sums of sunshine duration (Sd) should not exceed the daylength (S0d) i.e., . All the values passed this test (Figure 4). Similar graphs were obtained from the other locations.
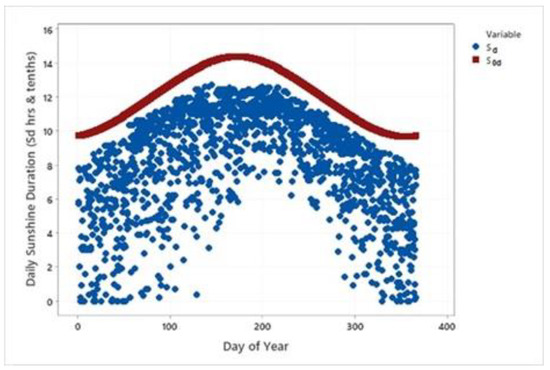
Figure 4.
Daily totals of sunshine duration (Sd, h, and tenths) compared to the respective daylength (S0d) at Agros.
The time series plots of the daily irradiation in MJ/m2 and daily sunshine duration for the selected stations are shown in Figure 5. The highest daily global irradiation reached the value of 31.9 MJ/m2 at Kambos, while at the rest stations it was slightly below 31 MJ/m2. Athalassa recorded the highest daily sunshine duration reaching the value of 13.9 h, while it was lower at the mountainous site reaching the value of 12.7 h.
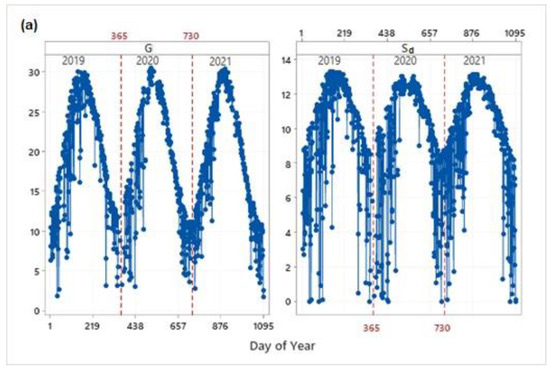
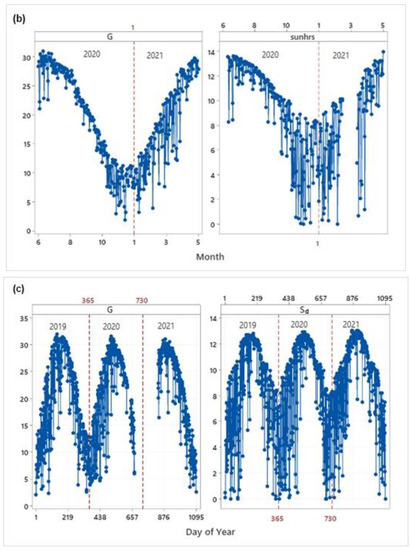
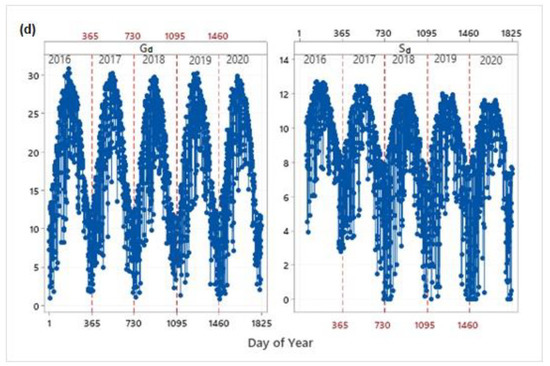
Figure 5.
Time series plots of the daily irradiation values of global in MJ/m2 and daily sunshine duration in hours and tenths. (a) Pentakomo, (b) Athalassa, (c) Kambos, (d) Agros. The doted red lines represent the end of each year.
3. Results and Discussion
3.1. Daily Values
3.1.1. Monthly Mean Daily Global Irradiation and Mean Daily Sunshine Duration
Daily global solar radiation was analyzed and compared in this study. Figure 6 shows the temporal evolution of daily global irradiation at the selected stations. The data revealed a common evolution shape with maxima in summer and minima in winter, due to the daily minimum solar zenith angle and daylength (astronomical factors) variation during the year. Large fluctuations occurred in spring and autumn during the transition from cold to warm weather and vice versa. The lowest values were recorded at Prodromos, which is located at an elevation of 1380 m. The highest differences between the stations were observed during the summer months (about 5 MJ/m2), while during the winter months they were generally lower than 4 MJ/m2. Table 3 presents the monthly mean daily values in MJ/m2 of all the measurement stations. The highest mean daily global solar horizontal irradiation was recorded in June or July and it was almost 29 MJ/m2 in the coastal areas and about 28 MJ/m2 in inland plain and semi-mountainous areas. In contrast, it was about 26 MJ/m2 in the mountainous areas. The geographical distribution of the mean daily global irradiation for the four seasons of the year, as well as for the annual mean daily for the island of Cyprus, is presented in Figure 7. The contour lines on the map were based on the spline method using the ArcGIS software. Spring consisted of the months March, April, and May, while summer comprises June, July, and August. The months in autumn were September, October, and November, while winter consisted of December, January, and February. In winter, the average daily irradiation ranged from 8 MJ/m2 (in the mountainous sites) to 11 MJ/m2 (in plain and coastal sites). In summer, it ranged from 24 MJ/m2 to 28 MJ/m2, while the annual daily average ranged from 17 to 20 MJ/m2.
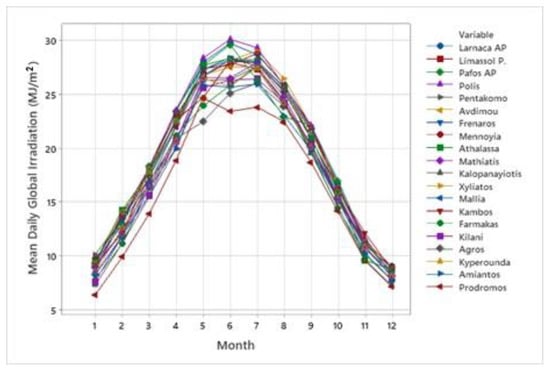
Figure 6.
Monthly mean daily global irradiation in MJ/m2 for the measurement stations.
Table 3.
Monthly mean daily global irradiation and monthly mean daily values (MJ/m2) in the four seasons of the year for the four groups of stations.
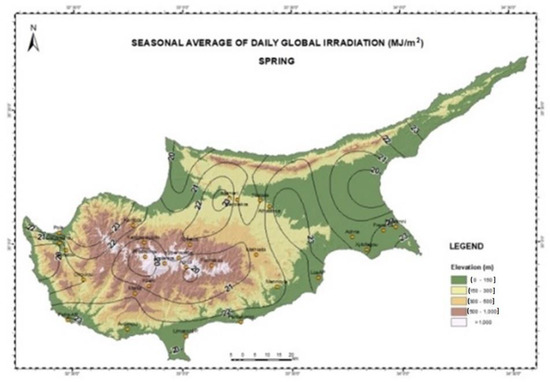
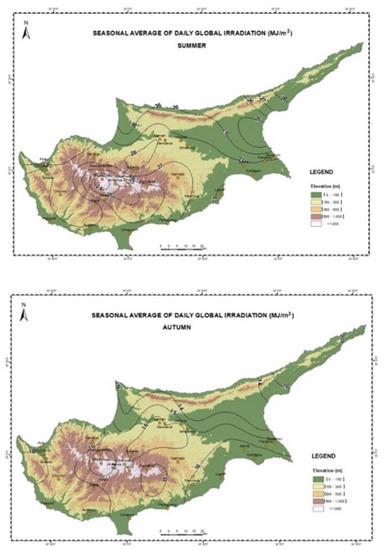
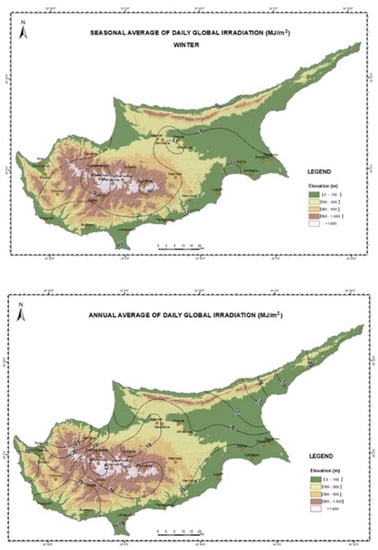
Figure 7.
Geographical distribution of the seasonal and annual mean daily global irradiation (MJ/m2).
Figure 8 shows the monthly mean daily sunshine duration in hours and tents for all stations. The lowest values were recorded in the mountainous stations with an annual average of 7.5 h. The highest differences between the stations were observed during the summer months (about 3 h), while during the winter months they were generally lower than 2 h. Table 4 presents the monthly mean daily values in hours and tenths of all the measurement stations. The highest mean daily sunshine duration was recorded in June or July, and it was almost 12.5 h in the coastal areas and about 12 h in inland plain and semi-mountainous areas. In contrast, it was about 10 h in the mountainous areas. The geographical distribution of the mean daily sunshine duration for the four seasons, as well as for the annual mean daily values for the island of Cyprus, is presented in Figure 9. In winter, the average daily sunshine duration ranged between 4 and 5 h/d, while it was around 6 h/d in coastal and inland plain areas. In summer, it ranged between 10 and 11 h/d in the mountainous areas, while it ranged between 12 and 13 h/d in the coastal and inland plain areas.
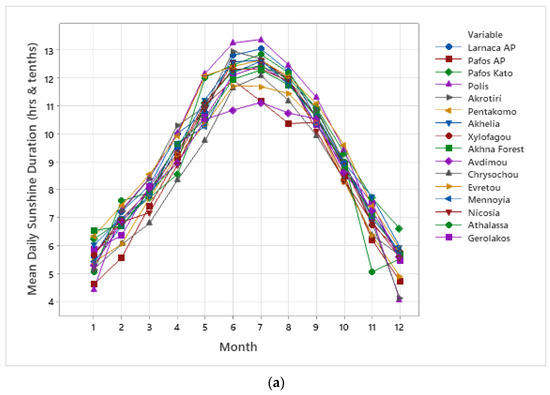
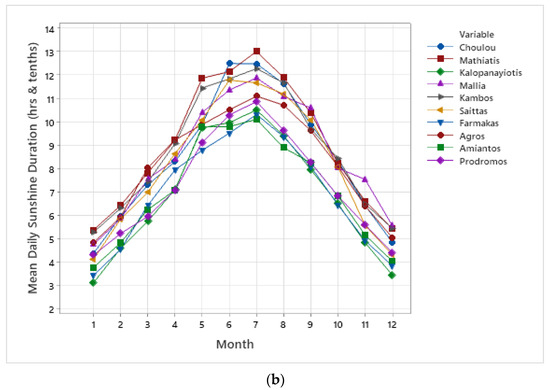
Figure 8.
(a) Mean daily sunshine duration (hours) for coastal and plain stations for each month of the year. (b) Mean daily sunshine duration (hours) for semi-mountainous and mountainous stations for each month of the year.
Table 4.
Monthly mean daily and seasonal sunshine duration in hours for the four groups of stations.
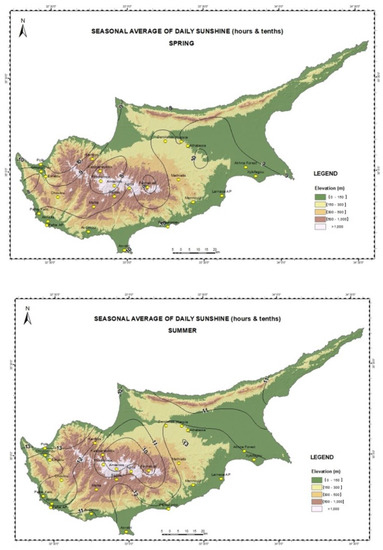
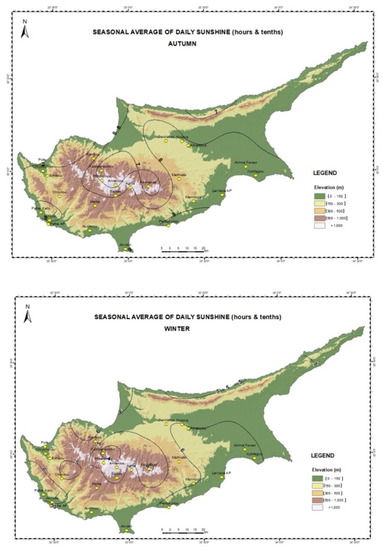
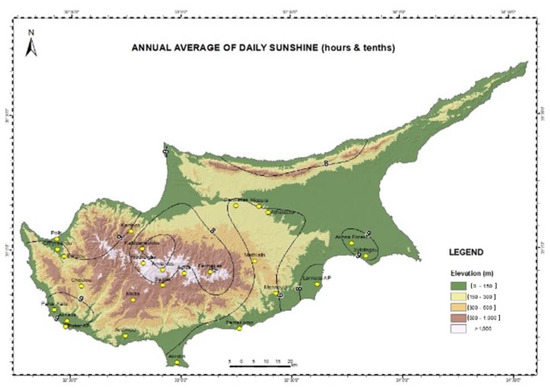
Figure 9.
Geographical distribution of seasonal and annual mean daily sunshine duration.
As is indicated from the above tables and the geographical distribution of monthly mean daily global radiation and mean daily sunshine duration, both elements decreased with the elevation. Figure 10 shows the relationships between the seasonal and yearly mean values of global irradiation with the elevation. The slopes of the regression lines ranged from −0.0010 in autumn to −0.0021 in spring. The slope in summer (−0.0019) was close to that in spring, while in winter it was −0.0014. The yearly slope was −0.0016. Generally, the Pearson correlation coefficients were higher than 0.70, indicating strong relationships between the mean daily global irradiation and the elevation.
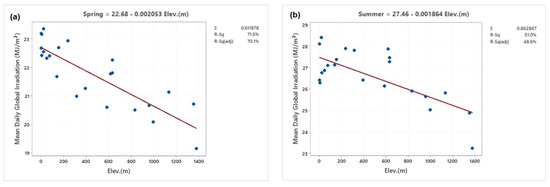
Figure 10.
Seasonal and yearly relationships of mean daily global irradiation (MJ/m2) with elevation (m): (a) Spring, (b) Summer, (c) Autumn, (d) Winter, (e) Year.
The respective seasonal and yearly relationships of the mean daily sunshine duration and the elevation are presented in Figure 11. Spring and winter showed similar slopes (−0.0013), while summer and autumn showed a slope around −0.0017. The yearly slope was −0.0012.
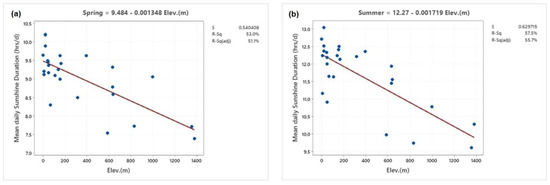
Figure 11.
Seasonal and Yearly relationships of mean daily sunshine duration (h/d) with elevation (m): (a) Spring, (b) Summer, (c) Autumn, (d) Winter, (e) Year.
3.1.2. Monthly Variability of Daily Global Radiation and Sunshine Duration
The variability of the daily values of global radiation and sunshine duration was also demonstrated through the boxplots of each month of the year (Figure 12). The boxplots present the mean and median, the IQR, as well as the outliers of each variable. The smooth curve represents the mean daily values of each month of the year. As it is indicated from the length of the boxplots, the spring, autumn, and winter seasons showed the greatest variability. Outliers were observed mainly in the summer months. As it can be seen, the daily irradiation ranged mainly between 3 and 32 MJ/m2.
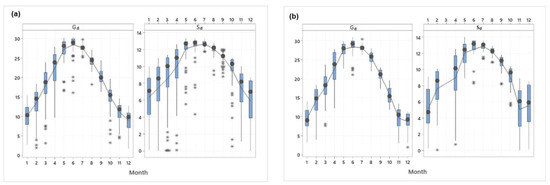
Figure 12.
Monthly boxplots of daily global irradiation (MJ/m2) and daily sunshine duration (h and tenths): (a) Pentakomo, (b) Athalassa, (c) Kambos, (d) Agros. The asterisks represent the outliers.
Table 5 shows the mean daily values and their standard deviations as well as the percentiles of the daily global irradiation for each month of the year for the whole period of measurements. The highest daily global irradiation was almost 32 MJ/m2 and it was recorded at Kambos, while it was about 31 MJ/m2 at the rest stations. The median (50 percentile) was about 27 MJ/m2 at the mountainous site, and about 29 MJ/m2 at the rest of the sites in June.
Table 5.
Basic descriptive statistics and percentiles of the daily global irradiation (MJ/m2) for each month of the year for the selected stations: (a) Pentakomo, (b) Athalassa, (c) Kambos, (d) Agros.
3.1.3. Daily Clearness Index and Relative Sunshine Duration
The clearness index (KT) for a particular time interval is defined as the ratio of the global radiation to the extraterrestrial radiation. It is an objective measure of the influence of cloud cover on the solar radiation flux. In this analysis, clearness index is classified in four groups, as it was earlier stated.
The monthly averages of the clearness index for all the stations are illustrated in Figure 13a. Generally, the coastal and inland plain stations showed higher KT values throughout the year. The annual average of KT of the first group was 0.617 and the second group was 0.583. The average values of the daily clearness index ranged between 0.495 in January and 0.685 in July for the first group, while they ranged between 0.445 in January and 0.668 in July for the second group of the stations. The linear relationship between the annual mean KT and elevation is demonstrated in Figure 13b. As it is indicated, the annual mean KT decreased with elevation.
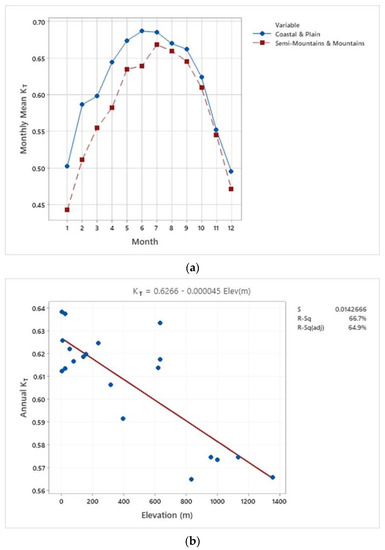
Figure 13.
(a). Monthly averages of clearness index (KT) summarized by their location: group of coastal and inland plain stations and the group of semi-mountainous and mountainous stations. (b). Annual averages of clearness index (KT) as a function of elevation (m).
Table 6 shows the monthly average of global irradiation and the number of days in each month of the year according to the above classification. The average global irradiation was almost similar in both groups. The annual average of global irradiation was about 7 MJ/m2 on cloudy days and about 21 MJ/m2 on clear days. However, the annual number of cloudy days was 21 (about 6%) for the first group and almost twice (39) for the second group representing 11% of the annual number of days. The respective number for partially cloudy days was 121 and 149 days, while the days that were classified as clear days were 208 (57%) and 166 (45%), respectively. As it can be seen, the summer months were classified mainly as clear days. The discrepancy between the numbers of days in the corresponding to the four types of the days was a result of the fact of the different missing days in each of the month.
Table 6.
(a) Monthly daily average of global irradiation (MJ/m2) according to the classification of the daily clearness index (KT). (b) Monthly number of days according to the classification of the daily clearness index (KT). The asterisk denotes a missing value.
The monthly average frequency of days according to their type gives an initial indication of the relative viability of different solar collector types. For example, concentrating solar collectors operate best under clear day conditions and, to a much lesser extent, under partially cloudy days. The major difference between day types was the significant reduction in the beam radiation, which also affects the global irradiation level. Regarding the global radiation, the reduction factor for partially cloudy days to that on clear days ranged from 0.73 to 0.78. Almost similar figures were obtained by Kudish and Ianetz [46] at Beer Sheva in Israel.
The monthly means and their standard deviations of the relative sunshine duration (σ) of four stations are presented in Table 7. The monthly means of the coastal and inland plain areas ranged between 0.510 and 0.920. The respective means for semi-mountainous stations ranged between 0.530 and 0.880, while at the higher locations they ranged between 0.485 and 0.810. Generally, the annual average decreased from 0.793 to 0.688 with an increase in elevation.
Table 7.
Monthly means and standard deviation of relative sunshine (σ) of stations representing the four classification groups.
3.1.4. Statistical Relationships
The linear relationship between the daily clearness index (KT) and the daily relative sunshine duration (σ) for Kambos is shown in Figure 14a, while the relationship between the daily global radiation (Gd) and the daily sunshine duration (Sd) is also expressed as a quadratic equation as shown in Figure 14b. Similar relationships were obtained for the other stations that measure global and sunshine duration. Both equations are associated with high coefficients of determination (Table 8a). The residuals (the difference between the observed and estimated data) are normally distributed and the plots of residuals versus the fitted values show no obvious patterns or clusters suggesting that the assumption of constant variance has not been violated (not shown here). The standard error of the residuals (S) is shown on the legend of the graph. In the case of the linear equations (KT vs. σ), the intercept ranged between 0.100 and 0.280, while the slopes ranged between 0.455 and 0.700. The sum of the intercept and the slope indicates the amount of global radiation reaching the ground on a clear day. The average sum of the constants of all the sites was 0.788. Table 8b presents the linear equations of the monthly means of daily values.
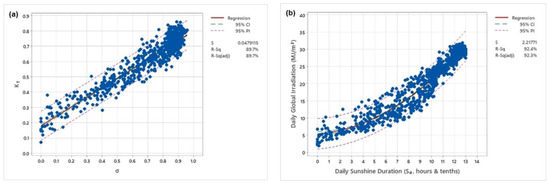
Figure 14.
(a) Linear relationship between the daily clearness index (KT) and the daily relative sunshine duration (σ) and (b) quadratic relationship between the daily global radiation (Gd) and the daily sunshine duration (Sd) for Kambos.
Table 8.
(a) Linear (KT vs. σ) and quadratic equations (Gd vs. Sd) for the estimation of daily global irradiation (MJ/m2). (b) Linear equations between KT vs. σ and Gd vs. Sd for the estimation of mean monthly daily global irradiation (MJ/m2).
3.2. Hourly Values
3.2.1. Hourly Global Irradiances as a Function of Solar Zenith Angle and Clearness Index
The variation of the hourly measured global radiation with the solar zenith angle and the associated clearness index is illustrated in Figure 15 for the station of Pentakomo. Similar graphs were obtained from the other stations. High global irradiances are associated with high clearness index. Global irradiance decreased almost exponentially with increasing the SZA for a given kt interval. The top three layers of kt show the clear-sky conditions. This relationship can be expressed as:
where Gmax is the maximum global irradiance for each kt interval and b describes how G changes with the cosine of the SZA. The dependence of Gmax on kt can be described by the cubic equation as:
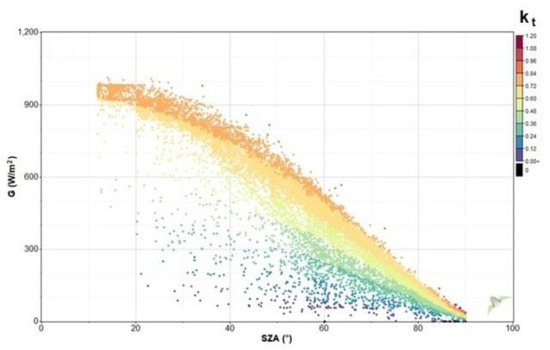
Figure 15.
Solar global irradiances as a function of solar zenith angle and clearness index for Pentakomo.
In the second step, b was obtained from analyzing the relationship between hourly G and the cosine of the zenith angle using a non-linear statistical method. The value of b was estimated to range between 0.8 and 0.9 for all the sites.
3.2.2. Diurnal Variation of Hourly Global Irradiances
The daily variation of the average hourly global irradiance for the selected stations is shown in Figure 16. The figure shows that the hourly average global irradiance fluctuates between 400 W/m2 in January and 950 W/m2 in July at local noon. Slightly lower values were observed at Agros (mountainous site). The curves of each month of global irradiances were symmetrical around the local noon. As it can be seen, the curves can be classified in five groups with similarities with respect to their variation. Starting from the top curves, the first group represents the summer months (June, July, and August) and slightly below it is the second with the months of April, May, and September. March and October compose the third group, which is followed by the group of the months of February and November, and the last group is the winter months of January and December.
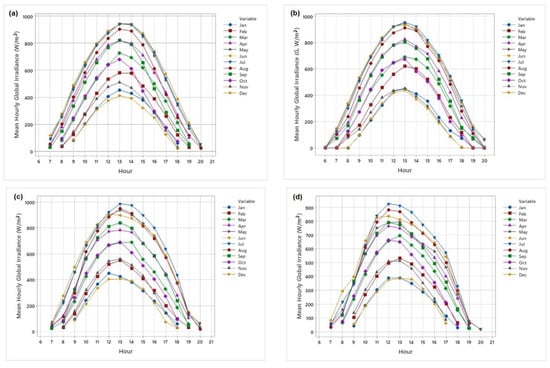
Figure 16.
Diurnal variation of global irradiance (W/m2) at selected sites: (a) Pentakomo, (b) Athalassa, (c) Kambos, and (d) Agros.
3.2.3. Monthly Variability
The variability of the four shortwave hourly irradiances is demonstrated with the graph of boxplots for each month of the year (Figure 17). The smooth line represents the mean values of irradiances for each month of the year. As can be seen, no outliers were observed for the hourly global irradiances. In all cases, the median values were very close to the means. The highest variability was observed in the summer months, as is indicated by the length of the boxes. The highest values of the coastal and inland plain sites reached the value of 1000 W/m2, while in the mountainous sites they exceed the value of 1100 W/m2 during the summer months. The highest monthly mean values of the hourly irradiances were recorded in June or July and the lowest in December or January. Generally, the monthly mean hourly global irradiances range between 250 and 550 W/m2.
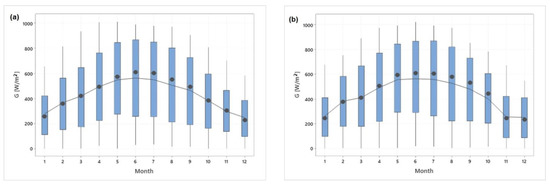
Figure 17.
Monthly variation of global irradiance (W/m2) at selected sites: (a) Pentakomo, (b) Athalassa, (c) Kambos, and (d) Agros.
3.2.4. Frequency Distribution of Global Irradiances
The annual histograms and the cumulative density frequency curves (CDF) for the global irradiances for Pentakomo are shown in Figure 18. The sites show a similar pattern with respect to their frequency distribution. Regarding the CDF curves, the percentiles of the global irradiances can be obtained from the graph. For example, the 70 percentile represents a value of 600 W/m2 for the hourly global irradiances. The figures indicate that, in 70% of the hourly irradiances, these are less than above values.
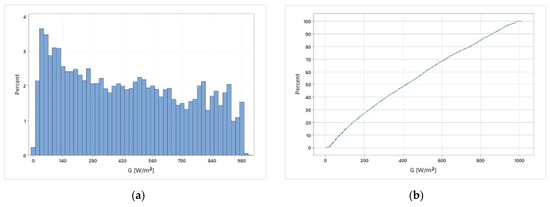
Figure 18.
Annual histogram (a) and (b) cumulative density function (CDF) curve of the hourly global irradiances (W/m2) at the coastal site of Pentakomo.
3.2.5. Hourly Clearness Indices (kt)
The monthly variability of each index for the four selected stations is presented in Figure 19. Monthly means of kt ranged mainly between 0.5 and 0.65 with the highest occurring in summer. Slightly lower values were observed at the mountainous sites (0.4 to 0.6). All graphs show the lowest variability during the summer season. On the other hand, outliers were recorded mainly during the summer season.
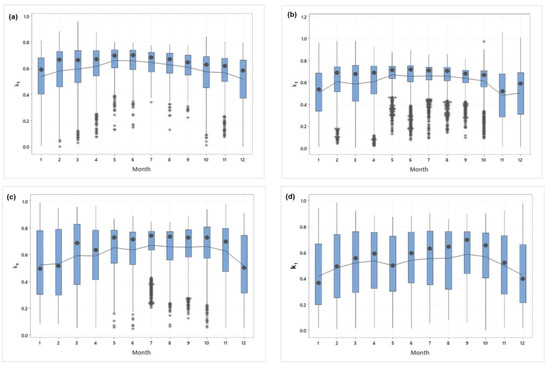
Figure 19.
Monthly variation of clearness index (kt) at selected sites: (a) Pentakomo, (b) Athalassa, (c) Kambos, and (d) Agros. The asterisks represent the outliers.
The monthly statistics of the classification of the different sky conditions defined by the selected intervals of the clearness index (kt) are presented in Table 9. The table indicates that global irradiances ranged between 500 and 750 W/m2 during clear-sky conditions, while during partially cloudy conditions they ranged between 200 and 400 W/m2. In contrast, they ranged between 100 and 200 W/m2 during cloudy conditions. However, at the mountainous site, they were slightly higher than 100 W/m2 during overcast conditions throughout the year. Regarding the case of all sky conditions, they ranged mainly between 250 and 550 W/m2.
Table 9.
Monthly statistics of global irradiance under all and different sky conditions for the four selected sites. The asterisk denotes a missing value.
3.2.6. Annual Sky Status
Figure 20 shows the annual hours of the stations for the duration of overcast skies (DOS), intermediate skies (DIS), and for clear skies (DCS). The stations were arranged according to their elevation. It can be seen that the hour ranges for the three types of skies were [296–1479 h], [789–1901 h], and [1075–2359 h] for DOS, DIS, and DCS. The average values for the three types of skies were 840.7 ± 368.4 h, 1239.7 ± 276.6 h, and 1819.8 ± 323.2 h, respectively. These results show that the intermediate and clear-sky conditions over Cyprus prevailed all over the year. The effect of elevation toward the annual hours of the duration of each sky type is demonstrated in Figure 21. As is expected, the figure shows that the hours of overcast skies (DOS) increased at high elevation sites. On the other hand, the annual hours of DIS and DCS slightly decreased with elevation. This indicates that intermediate and clear sky conditions prevailed over the whole island, while overcast conditions were more frequently expected in the mountainous areas. The coefficient of determination (R2) for the DOS conditions was 0.64, which was higher than the respective values of the other two sky conditions.
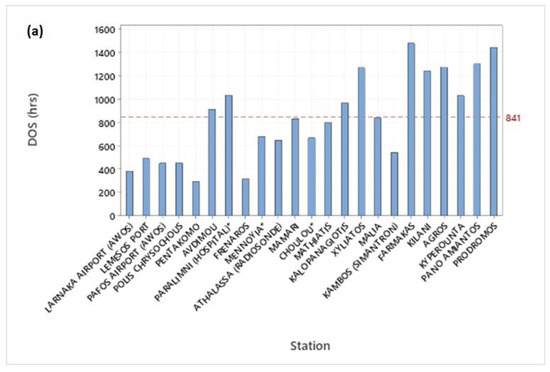
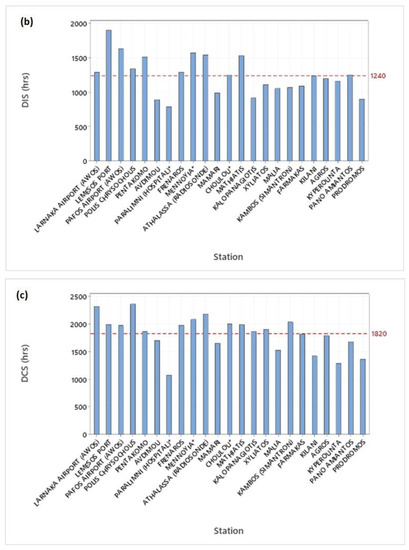
Figure 20.
Variation in the total annual hours for (a) overcast (DOS), (b) intermediate (DIS), and (c) clear (DCS) skies across the 23 sites. The red dashed lines represent the average over all sites.
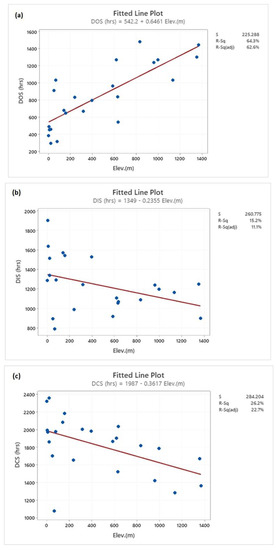
Figure 21.
Variation in the total annual hours for (a) overcast (DOS), (b) intermediate (DIS), and (c) clear (DCS) skies across the island as a function of the elevation. The red line represents the average value of all stations of the given sky conditions.
4. Conclusions
Hourly data of global horizontal irradiance (G) were obtained from the automatic weather stations of Cyprus, covering mainly the period 2019–2021. Mostly, Kipp & Zonen pyranometers were used for the measurement of global radiation. For the sunshine duration measurements, Kipp & Zonen CSD3 sunshine duration sensors were used. The sensors, at the same time, measured the direct normal irradiance (Bn) in W/m2, which, however, was less accurate than the measurements of this variable through the pyrhiliometers that are installed on solar tracking systems. Generally, the data of 28 automatic weather stations that were either in operation or closed, measuring the global radiation, were used for the assessment of solar radiation data. Furthermore, 18 stations equipped with Campbell–Stokes sunshine recorders, operating in different periods, were used to estimate global radiation. The stations were classified according to their location and their elevation, as coastal, inland plain, semi-mountainous, and mountainous stations. The first objective of the study was the assessment of the hourly and daily measurements of global solar radiation and sunshine duration data. For this purpose, the data underwent an extensive quality control process for both hourly and daily values, which was followed by a statistical analysis of the global radiation and the derived indices. In this way, the geographical distribution of global radiation over the island of Cyprus was assessed.
A detail quality control procedure was implemented on the radiation components, which are based on the suggested limits proposed by the BSRN group. The tests include physically possible limits (PPL) and extremely rare limits (ERL). Additionally, the data were tested according to the values of the clearness index of kt, which is always lower than 1. Finally, step and persistency tests were applied on the hourly dataset. The daily values were also tested against the extraterrestrial irradiation and the estimated highest daily sums on clear days as well as by comparing the daily global radiation with the daily sunshine duration. Generally, all data are within the specified limits. However, the data of two stations (Lefkara Dam and Zygi) were excluded from the analysis because most of the data were outside the PPL and ERL limits, either due to problems of wrong installation or to the presence of trees in the surrounding area, which thus affected the incidence of global irradiance. The statistical analysis was demonstrated mainly through the graphs of boxplots, where the basic statistics of each location are presented and, at the same time, the stations can be compared on a monthly basis.
From this investigation, the following results can be highlighted:
Monthly mean daily values of global irradiation either measured or estimated from the daily sunshine duration are shown by means of isolines diagrams. These values are considered representative of the solar radiation behavior along a typical year and can be useful for exploiting solar energy applications. Seasonal analysis allows the highlighting of the differences between summer and winter irradiation conditions. June and July were found to be the months with the highest values of mean daily global radiation. During these months, daily global irradiation ranged between 25 MJ/m2 and 30 MJ/m2, with the lowest occurring in the mountainous locations. On the other hand, in January or December, they ranged between 6.5 MJ/m2 and 10.5 MJ/m2. Regarding the annual variation of the mean daily global irradiation, it is shown that it ranged between 16 MJ/m2 and 20 MJ/m2. The maximum of daily global solar horizontal irradiation was reached in June or July and it was almost 32 MJ/m2.
The annual daily average of sunshine duration ranged between 7.0 h and 9.5 h with the lowest values occurring in the mountainous locations. The monthly mean daily values ranged between 3 and 6.5 h in January, while they ranged between 10 and 13.5 h in June or July. The maximum daily value was almost 14 h and it occurred in the summer months. The total annual number of hours of sunshine duration ranged between 2500 and 3500, with the lowest values recorded at the mountainous sites.
The monthly mean daily relative sunshine duration in the coastal and inland plain locations ranged between 0.5 in January and 0.9 in July. Slightly lower values were recorded in the mountainous sites. Linear relationships were established between the daily clearness index (KT) and the daily relative sunshine duration (σ), while quadratic relationships were established between the daily global radiation (Gd) and the daily sunshine duration (Sd). Both equations are associated with high coefficients of determination. In the case of the linear equations (KT vs. σ), the intercept ranged between 0.100 and 0.280, while the slope ranged between 0.455 and 0.700. The sum of the intercept and the slope indicates the amount of global radiation reaching the ground on a clear day. The average sum of the constants of all the sites was 0.788.
Generally, the coastal and inland plain stations showed higher KT values than the mountainous sites, throughout the year. The annual average of KT of the first group was 0.617 and the second group was 0.583. The average values of the daily clearness index ranged between 0.495 in January and 0.685 in July for the first group, while they ranged between 0.445 in January and 0.668 in July for the second group of the stations. A linear relationship between the annual mean KT and elevation showed the decrease in the annual mean KT with elevation.
The average global irradiation was almost similar in both groups of stations. The annual average of global irradiation was about 7 MJ/m2 on cloudy days and about 21 MJ/m2 on clear days. However, the annual number of cloudy days was 21 (about 6%) for the first group and almost twice (39) for the second group, representing 11% of the annual number of days. The respective number for partially cloudy days was 121 and 149 days, while the days that are classified as clear days were 208 (57%) and 166 (45%), respectively. As can be seen, the summer months were classified mainly as clear days. The monthly average frequency of days according to their type gives an initial indication of the relative viability of different solar collector types. For example, concentrating solar collectors operate best under clear day conditions and to a much lesser extent, under partially cloudy days. The major difference between day types was the significant reduction in the beam radiation, which also affects the global irradiation level. Regarding the global radiation, the reduction factor for partially cloudy days to that on clear days ranged from 0.73 to 0.78.
The monthly means of hourly clearness indices (kt) ranged mainly between 0.5 and 0.65 with the highest occurring in summer. Slightly lower values were observed at the mountainous sites (0.4 to 0.6). During clear-sky conditions, global irradiances ranged between 500 and 750 W/m2, while during partially cloudy conditions they ranged between 200 and 400 W/m2. In contrast, they ranged between 100 and 200 W/m2 during cloudy conditions. However, at the mountainous sites, they were slightly higher than 100 W/m2 during overcast conditions throughout the year. Regarding the case of all sky conditions, they ranged mainly between 250 and 550 W/m2.
Regarding the duration of the annual hours of the stations during overcast skies (DOS), they ranged between 296 and 1479 h, for intermediate skies (DIS) they ranged between 789 and 1901 h, while for clear skies (DCS) they ranged between 1075 and 2359 h. The average values for the three types of skies were 840.7 ± 368.4 h, 1239.7 ± 276.6 h, and 1819.8 ± 323.2 h, respectively. These results show that the intermediate and clear sky conditions over Cyprus prevailed throughout the year, while overcast conditions were more frequently expected in the mountainous areas.
This work has specifically contributed to the characterization and analysis of hourly and daily solar global radiation. Furthermore, the measurements on the ground level could be compared with satellite observations in order to improve the geographical distribution of global radiation, especially in areas where no measurements exist. The analysis could be also extended for the other shortwave radiation components (Direct, Diffuse and Photosynthetic Active Radiation (PAR)) in order to assess the solar radiation regime over the island. The results of this paper are of the utmost importance to scientists and engineering working in the field of solar energy, which includes both solar thermal collectors and systems and photovoltaic systems. The input power to these systems is solar radiation, and therefore knowing this with some accuracy is very important. With the knowledge of global solar radiation on horizontal surfaces, we can estimate the solar radiation on inclined surfaces [8], and therefore we can assess more accurately the efficiency of photovoltaic systems.
Author Contributions
Methodology, S.P.; Investigation, S.P.; Resources, A.P.; Supervision, S.A.K. All authors have read and agreed to the published version of the manuscript.
Funding
This research received no external funding.
Institutional Review Board Statement
Not applicable.
Informed Consent Statement
Not applicable.
Data Availability Statement
The data used in this paper come from the Meteorological Department of Cyprus and are not publicly available.
Acknowledgments
The authors would like to thank the Meteorological Department of Cyprus for providing the solar radiation data used in this study.
Conflicts of Interest
The authors declare no conflict of interest.
Nomenclature
| B | Hourly horizontal beam irradiance (W/m2) |
| Bn | Hourly normal beam irradiance (W/m2) |
| BSRN | Baseline Surface Radiation Network |
| CDF | Cumulative Density Function |
| CS | Campbell–Stokes sunshine recorder |
| CSD3 | Kipp & Zonen Sunshine Duration sensor |
| dn | Day number of the year (1.365) |
| D | Hourly diffuse horizontal irradiance (W/m2) |
| DCS | Clear skies |
| DIS | Intermediate skies |
| DOS | Overcast skies |
| ERL | Extremely Rare Limits |
| G | Hourly global solar irradiance (W/m2) |
| Gcld | Global irradiance under cloudy sky conditions |
| Gpc | Global irradiance under partly cloudy sky conditions |
| Gclr | Global irradiance under clear-sky conditions |
| Gd | Daily global solar irradiation (MJ/m2) |
| G0 | Hourly Extraterrestrial horizontal irradiance (W/m2) |
| G0n | Normal irradiance at the top of the atmosphere (W/m2) |
| G0d | Daily extraterrestrial irradiation (ETR) (MJ/m2) |
| Gc | Clear-sky global solar irradiance (W/m2) |
| Gsc | Solar constant (1367 Wm2) |
| Gmax | Highest daily global solar irradiance (W/m2) |
| IQR | Interquartile Range |
| kb | Fraction of Direct Horizontal to Global irradiance (B/G) |
| kd | Fraction of Diffuse to Global irradiance (D/G) |
| kt | Hourly clearness index (G/G0) |
| KT | Daily clearness index (Gd/G0d) |
| LF | Conversion factor for PAR irradiance (4.57 μmol s−1 W−1) (McCree, 1972) |
| n | Number of observations |
| N | Number of days |
| PAR | Photosynthetic Active Radiation (W/m2) |
| PPFD | Photosynthetic Photon Flux Density (μmol/s/m2) |
| PPL | Physically Possible Limits |
| Q1 | First Quartile |
| Q3 | Third Quartile |
| R2 | Coefficient of determination |
| S | Standard deviation of residuals |
| SD | Sunshine Duration |
| Sd | Daily sunshine duration (hours) |
| S0d | Astronomical day length (hours) |
| StDev | Standard deviation (Std) |
| t | Local time (hour) |
| TMY | Typical Meteorological Year |
| z | Station’s elevation (m) |
| Greek: | |
| αs | Solar altitude angle (degrees) |
| δ | Solar declination angle (degrees) |
| ε | Correction factor to mean solar distance |
| θz | Solar zenith angle (SZA) (degrees) |
| λ | Longitude of the station in degrees (East positive) |
| σ | Relative sunshine duration (Sd/S0d) |
| ϕ | Latitude of the station in degrees |
| ω | Hour angle (degrees) |
| ωs | Sunset hour angle (degrees) |
References
- Monteith, J.L.; Unsworth, M. Principles of Environmental Physics. Plants, Animals, and the Atmosphere; Elsevier Science: Amsterdam, The Netherlands, 2014. [Google Scholar]
- Kambezidis, H. The Solar Radiation climate of Greece. Climate 2021, 9, 183. [Google Scholar] [CrossRef]
- Liang, S.; Wang, K.; Zhang, X.; Wild, M. Review on Estimation of Land Surface Radiation and Energy Budgets from Ground Measurement, Remote Sensing and Model Simulations. IEEE J. Sel. Top. Appl. Earth Obs. Remote Sens. 2010, 3, 225–240. [Google Scholar]
- Kambezidis, H.D. The solar resource. In Comprehensive Renewable Energy; Elsevier: Amsterdam, The Netherlands, 2012; Volume 3. [Google Scholar]
- Kambezidis, H.D. The solar radiation climate of Athens: Variations and tendencies in the period 1992-2017, the Brightening Era. Sol. Energy 2018, 173, 328–347. [Google Scholar]
- Pashiardis, S.; Kalogirou, S.A.; Pelengaris, A. Shortwave Radiation on Horizontal and Incline Surfaces-One Year of Solar Radiation Measurements at Athalassa, an Inland Location in Cyprus. Appl. Sci. 2022, 12, 11035. [Google Scholar] [CrossRef]
- Gueymard, C. The sun’s total and spectral irradiance for solar energy applications and solar radiation models. Sol. Energy 2004, 78, 423–453. [Google Scholar]
- Muneer, T. Solar Radiation and Daylight Models; Elservier: Amsterdam, The Netherlands, 2004. [Google Scholar]
- WMO. The Global Climate Observing System 2021: The GCOS Status Report 2021; GCOS 240; WMO: Geneva, Switzerland, 2021. [Google Scholar]
- Bojinski, S.; Verstraete, M.; Peterson, T.C.; Richter, C.; Simmons, A.; Zemp, M. The concept of essential climate variables in support of climate research, applications and policy. Bull. Am. Meteorol. Soc. 2014, 95, 1431–1443. [Google Scholar]
- Badescu, V. Modeling Solar Radiation at the Earth’s Surface. Recent Advances; Springer: Berlin/Heidelberg, Germany, 2008. [Google Scholar]
- Forster, P.M. Inference of climate sensitivity from analysis of earth’s energy budget. Annu. Rev. Earth Planet Sci. 2016, 44, 85–106. [Google Scholar]
- Achilleos, S.; Mouzourides, P.; Kalivitis, N.; Katra, I.; Kloog, I.; Kouis, P.; Middleton, N.; Mihalopoulos, N.; Neophytou, M.; Panayiotou, A.; et al. Spatio-temporal variability of desert dust storms in Eastern Mediterranean (Crete, Cyprus, Israel) between 2006 and 2017 using a uniform methodology. Sci. Total Environ. 2020, 714, 136693. [Google Scholar] [CrossRef] [PubMed]
- Fountoulakis, I.; Kosmopoulos, P.; Papachristopoulou, K.; Raptis, I.-P.; Mamouri, R.-E.; Nisantzi, A.; Gkikas, A.; Witthuhn, J.; Bley, S.; Moustaka, A.; et al. Effects of aerosols and clouds on the levels of surface solar radiation and solar energy in Cyprus. Remote Sens. 2021, 13, 2319. [Google Scholar] [CrossRef]
- Liu, B.Y.H.; Jordan, R.C. The interrelationship and characteristic distribution of direct, diffuse and total solar radiation. Sol. Energy 1960, 4, 1–19. [Google Scholar]
- Wald, L. Fundamentals of Solar Radiation; CRC Press: Boca Raton, FL, USA, 2020. [Google Scholar]
- Bird, R.E.; Hulstrom, R.L. Reviews, evaluation and improvements of direct irradiance models. J. Sol. Energy Eng. 1981, 103, 182–192. [Google Scholar] [CrossRef]
- Bird, R.E.; Hulstrom, R.L. A Simplified Clear Sky Model for Direct and Diffuse Insolation on Horizontal Surfaces; Technical Report SERI/TR-642-761; Solar Research Institute: Golden, CO, USA, 1981. [Google Scholar]
- Maxwell, E.L. METSTAT-The solar radiation model used in the production of the National Solar Radiation Data Base (NSRDB). Sol. Energy 1998, 62, 263–279. [Google Scholar]
- Gueymard, C.A. REST2: High performance solar radiation model for cloudless sky irradiance, illuminance, and photosynthetically active radiation- Validation with a benchmark dataset. Sol. Energy 2008, 82, 272–285. [Google Scholar]
- Ineichen, P. A broadband simplified version of the Solis clear sky model. Sol. Energy 2008, 82, 758–762. [Google Scholar]
- Myers, D.R. Solar Radiation: Practical Modeling for Renewable Energy Applications; CRC Press: Boca Raton, FL, USA, 2013. [Google Scholar]
- Orgill, J.F.; Hollands, K.G.T. Correlation equation for hourly diffuse radiation on a horizontal surface. Sol. Energy 1977, 19, 357–359. [Google Scholar] [CrossRef]
- Erbs, D.G.; Klein SADuffie, J.A. Estimation of the diffuse radiation fraction for hourly, daily and monthly average global radiation. Sol. Energy 1982, 4, 293–302. [Google Scholar] [CrossRef]
- Skartveit, A.; Olseth, J.H.; Tuft, M.E. An hourly diffuse fraction model with correction for variability and surface albedo. Sol. Energy 1998, 63, 173–183. [Google Scholar]
- Bolland, J.; Ridley, B.; Brown, B. Models of diffuse solar radiation. Renew. Energy 2008, 33, 575–584. [Google Scholar] [CrossRef]
- Gueymard, C.A. Progress in direct irradiance modeling and validation. In Proceedings of the ASES Annual Conference, Phoenix, AZ, USA, 19–21 May 2010. [Google Scholar]
- Rigollier, C.; Lefėvre, M.; Wald, L. The method of Heliosat-2 for deriving shortwave solar radiation from satellite images. Sol. Energy 2004, 77, 159–169. [Google Scholar]
- Mueller, R.; Behrendt, T.; Hammer, A.; Kemper, A. A New Algorithm for the Satellite-Based Retrieval of Solar Surface Irradiance in Spectral bands. Remote Sens. 2012, 4, 622–647. [Google Scholar]
- Diabaté, L.; Blanc, P.; Wald, L. Solar radiation climate in Africa. Sol. Energy 2004, 76, 733–744. [Google Scholar]
- Kambezidis, H. The Sky-Status Climatology of Greece: Emphasis on Sunshine Duration and atmospheric scattering. Appl. Sci. 2022, 12, 7969. [Google Scholar] [CrossRef]
- Kambezidis, H.D.; Kambezidou, S.I.; Kampezidou, D. Mathematical determination of the Upper and Lower Limits if the Diffuse Fraction at Any Site. Appl. Sci. 2021, 11, 8564. [Google Scholar] [CrossRef]
- Antuña-Sánchez, J.C.; Estevan, R.; Román, R.; Antuña-Marrero, J.C.; Cachorro, V.E.; Vega, A.R.; de Frutos, A.M. Solar Radiation Climatology in Camagüey, Cuba (1981–2016). Remote Sens. 2021, 13, 169. [Google Scholar]
- Apeh, O.O.; Overen, O.K.; Meyer, E.L. Monthly, Seasonal and Yearly Assessments of Global Radiation, Clearness Index and diffuse Fractions in Alice, South Africa. Sustainability 2021, 13, 2135. [Google Scholar] [CrossRef]
- Jacovides, C.P.; Kaltsunides, N.; Hadchioannou, L.; Stefanou, L. An assessment of the solar variation climate of Cyprus. Renew. Energy 1993, 3, 1913–1918. [Google Scholar] [CrossRef]
- Pashiardis, S.; Kalogirou, S.A. Quality control of solar shortwave and terrestrial longwave radiation for surface radiation measurements at two sites in Cyprus. Renew. Energy 2016, 96, 1015–1033. [Google Scholar]
- Solargis. Global Solar Atlas 2.0, Solar Rsource Data: Solargis; The World Bank: Washington, DC, USA, 2020. [Google Scholar]
- McCree, K.J. Test of current definitions of photosynthetically active radiation against leaf photosynthesis data. Agric. For. Meteorol. 1972, 10, 443–453. [Google Scholar]
- Haurwitz, B. Insolation in relation to cloudiness and cloud density. J. Meteorol. 1945, 2, 154–166. [Google Scholar] [CrossRef]
- Ianetz, A.; Lyubansky, V.; Setter, I.; Kriheli, B.; Evseev, E.; Kudish, A.I. Inter-comparison of different models for estimating clear sky solar global radiation for the Negev region of Israel. Energy Convers. Manag. 2007, 48, 259–268. [Google Scholar]
- Tapakis, R.; Charalambides, A.C. Enhanced values of global irradiance due to the presence of clouds in Eastern Mediterranean. Energy 2014, 62, 459–467. [Google Scholar] [CrossRef]
- Long, C.N.; Shi, Y. An automated quality assessment and control algorithm for surface radiation measurements. Open Atmos. Sci. J. 2008, 2, 23–37. [Google Scholar] [CrossRef]
- Younes, S.; Claywell, R.; Muneer, T. Quality control of solar radiation data: Present status and proposed new approaches. Energy 2005, 30, 1533–1549. [Google Scholar] [CrossRef]
- Estevez, J.; Gavilan, P.; Giraldez, J.V. Guidelines on validation procedures for meteorological data from automatic weather stations. J. Hydrol. 2011, 402, 144–154. [Google Scholar]
- Scharmer, K.; Greif, J. The European Solar Radiation Atlas. Vol. 1: Fundamentals and Maps. Vol. 2: Database and Exploitation Software; Ecole des Mines de Paris: Paris, France, 2000. [Google Scholar]
- Kudish, A.I.; Ianetz, A. Analysis of daily clearness index, global, and beam radiation for Beer Sheva, Israel: Partition according to day type and statistical analysis. Energy Convers. Mgmt. 1996, 37, 405–416. [Google Scholar] [CrossRef]


Disclaimer/Publisher’s Note: The statements, opinions and data contained in all publications are solely those of the individual author(s) and contributor(s) and not of MDPI and/or the editor(s). MDPI and/or the editor(s) disclaim responsibility for any injury to people or property resulting from any ideas, methods, instructions or products referred to in the content. |
© 2023 by the authors. Licensee MDPI, Basel, Switzerland. This article is an open access article distributed under the terms and conditions of the Creative Commons Attribution (CC BY) license (https://creativecommons.org/licenses/by/4.0/).