Featured Application
The study could be used for sitting posture monitoring in a work-from-home setup. This could also be used for rehabilitation purposes of patients who has posture-related problems.
Abstract
Human posture recognition is one of the most challenging tasks due to the variation in human appearance, changes in the background and illumination, additional noise in the frame, and diverse characteristics and amount of data generated. Aside from these, generating a high configuration for recognition of human body parts, occlusion, nearly identical parts of the body, variations of colors due to clothing, and other various factors make this task one of the hardest in computer vision. Therefore, these studies require high-computing devices and machines that could handle the computational load of this task. This study used a small-scale convolutional neural network and a smartphone built-in camera to recognize proper and improper sitting posture in a work-from-home setup. Aside from the recognition of body points, this study also utilized points’ distances and angles to help in recognition. Overall, the study was able to develop two objective datasets capturing the left and right side of the participants with the supervision and guidance of licensed physical therapists. The study shows accuracies of 85.18% and 92.07%, and kappas of 0.691 and 0.838, respectively. The system was developed, implemented, and tested in a work-from-home environment.
1. Introduction
Human pose estimation is one of the challenging tasks of computer vision, due to its wide range of use cases. It aims to determine the position of a person in an image frame or video by detecting the pixel location of different body parts/joints [1,2]. Human pose estimation is usually performed using image observations in either 2D or 3D [3,4] by obtaining the pose of the detected person’s joints and selected body points. In the literature, there are several approaches proposed from the traditional use of morphological operators to complex human pose estimation using convolutional neural networks and deep learning [5,6,7,8]. However, these methods involve challenges—inaccuracy in determining a point’s location, finding correlation between variables, and high computational load—since they deal with sensor capability and high-computing devices [9,10].
The processes of human pose estimation have progressed significantly due to the existence of deep learning and many publicly available datasets. The first of a few applications of human pose estimation are seen in the fields of animation and human monitoring [11,12]. These systems have been expanded to video surveillance, assistance systems used for daily living, and driver systems [13,14].
Within a human pose estimation framework, pose classification emerges in recognizing the specific pose that a person is in from a predefined set of poses. This can be used to recognize certain actions or movements, such as yoga poses or dance moves, and can also be used in security or surveillance systems to detect suspicious behavior.
However, this task brings challenges such as joints that are occluded, multi-person detection in one frame, spatial difference because of clothing, lighting, and backgrounds, and investigation of complex positions. However, the cost of 3D camera sensors has been decreasing over the last few years; there is an emergence of machine learning and deep learning methods. This might bring new and innovative approaches to the challenges it is currently facing.
Over the last two years, the COVID-19 pandemic has greatly disrupted many traditional and conventional working routines. This includes switching from the traditional and typical office-based setup to a new working-from-home (WFH) setting on short notice. It has been suggested by many studies that this new setup will have considerable negative impacts on employees’ overall well-being and productivity [15]. Nevertheless, many studies also show positive impacts of WFH settings [16,17,18,19]. Given this, human posture recognition systems could be used to assess sitting postures and might lessen the negative impacts of the work-from-home setup.
This study aims to
- Investigate the related studies pertaining to human sitting posture recognition;
- Develop a custom dataset for sitting posture recognition;
- Develop a model to recognize proper and improper sitting posture using a rule-based approach; and
- Evaluate the effects of other ergonomic and demographic elements on sitting posture.
2. Related Works
Sedentary behavior (SB) refers to seated or reclined behavior [20]. As industrial development trends upwards in the modern world, and this situation becomes more salient due to the COVID-19 pandemic, human life has been transformed into a sedentary lifestyle [21]. Based on recent studies in the United States and Australia, over 50% of an adult’s waking day is spent in sedentary behavior [22]. Large amounts of sitting time are associated with increased risks of disorders [23] (cardio-vascular diseases (CVDs), metabolic syndrome, diabetes, and hypertension) and even mortality, for adults in high-income countries [24]. Using the data in a prospective urban rural epidemiology study from 1 January 2003 until 31 August 2021 in 21 high-, middle-, and low-income countries, the association between sitting time and risks was examined. The study found out that longer sitting times were associated with a significant increase in the risk of mortality and CVDs. Comparing those who were seated for less than 4 h per day and those who sat for more than 8 h per day, there was an increase of 17% to 50% in risks for these diseases for the latter group.
Due to the changes brought by the pandemic in the occupational setting, people spend a significant amount of time sitting; combined with awkward posture (i.e., forward-leaning head, increased thoracic kyphosis), this might contribute to the increased risks of developing spinal pain and disorders [25,26,27,28]. Several studies showed that 17.7–63% of office workers experienced neck pain, and 23–34% suffered from back pain [29,30,31]. Long and extended computer hours during daily activities contribute to high prevalence rates of neck and back pain among college students [32,33]. According to the study presented by Hurwitz et al. [34], back and neck pain have been recognized as the leading cause of disability in most countries. The total cost of these injuries was estimated to be USD 1345 billion in 2016 [35].
While many workplaces follow proper workplace ergonomic design, home settings are far different from this. This may result in poorer sitting posture and the development of musculoskeletal disorders. Therefore, various systems have been proposed to alleviate this, noting the need to monitor proper sitting posture. One breakthrough in research is human pose estimation. In human pose estimation, the two primary processes are locating human body points/joints and grouping these points/joints into a valid human pose configuration. To accomplish the tasks of human pose estimation, the task can be subdivided into different parts such as selecting a dataset, selecting approaches, determining the backbone architecture, and classifying poses.
2.1. Dataset
To locate human body joints, there are many widely used datasets. This includes the COCO [11] and MPII [12], which differ in many aspects. First, the number of points/joints detected in COCO is 17 key points, while MPII provides 14 key points (see Figure 1 below). Aside from the number of key points detected, the way these images were captured and collected in these broadly famous datasets also differs. For example, the VGG Human Pose Estimation dataset consists of large datasets annotated with upper body poses collected using the YouTube Pose dataset, which consists of 50 videos for upper body pose estimation. Some of the activities covered were dancing, stand-up comedy, sports, and a wide range of other activities. On the other hand, the MPII Human Pose dataset has an estimated 25,000 images. In this dataset, there are more than 40,000 people with annotated body joints. Another strength of this dataset is that it covers more than 410 activities annotated in YouTube videos. Lastly, the COCO dataset released in 2017 consists of one 118,000 training images and five thousand 5000 validation images.
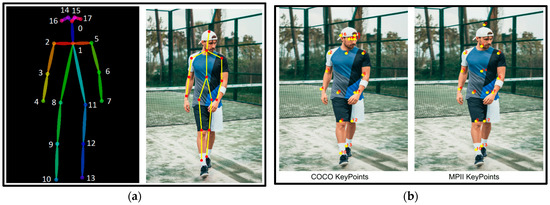
Figure 1.
(a) COCO and MPII Keypoints; (b) Pairwise between key points.
2.2. Approaches
All human pose estimation methodologies are classified into two parts—single-person and multiple-person estimation approaches. Single-person estimation approaches detects the pose of the subject (person) in an image; on the other hand, multiple-person estimation approaches detect the pose of all the subjects (persons) available in an image.
Single-person estimation includes the following: CNN-based approaches, RNN-based approaches, hybrid approaches, and key point-based approaches. CNN-based approaches use convolutional neural networks (CNNs) to classify poses. A common method is to extract features from an image using a CNN and to then use a fully connected layer to classify the pose. One example of this approach is the work of Wei et al. in 2016 [36], who used a CNN to classify yoga poses from images. RNN-based approaches: These approaches use recurrent neural networks (RNNs) to classify poses. This can be useful for classifying dynamic poses, or poses that change over time. One example of this approach is the work of Liu et al. in 2017 [37], who used an RNN to classify dance poses from videos. On the other hand, Hybrid approaches: These approaches combine CNNs and RNNs to classify poses. This can be useful for classifying both static and dynamic poses. One example of this approach is the work of Chen et al. in 2018 [38], who used a hybrid CNN-RNN model to classify poses from images and videos. Lastly, Key point-based approaches: These approaches use key point detection to classify poses. This can be useful for classifying poses from images and videos. One example of this approach is the work of Sun et al. in 2018 [39], who used key point detection to classify poses from images and videos.
For multiple-person estimation, two (2) common approaches are: Top-down approaches and Bottom-up approaches. Top-down approaches start with the processing from low to high resolutions, using a bounding box object detector to follow the detection of the subject/s (person/s) in the image then focuses on determining their succeeding poses [40,41,42]. However, the disadvantage of this approach is that when the early detection fails, then it will not be able to recover from it also, multiple subjects (persons) detection shows signs of vulnerability of this approach. Moreover, the more number of subjects/persons in an image, the higher the computational cost. This is because for every detection, a single-person estimator runs.
On the other hand, bottom-up approaches processing from high to low resolutions. The first step of this approach is to locate all the key points in an image and then group these key points [43,44,45,46,47]. The disadvantage of this approach is when there is an overlapping of multiple subjects/persons.
2.3. Backbone Architecture
In the context of pose classification, one of the main components of human pose estimation is the backbone architecture. This refers to the underlying neural network architecture that is used to extract features from an image. This is commonly a CNN (Convolutional Neural Network) that is pre-trained on a large dataset. To implement these tasks of human pose estimation, a consistent and stable backbone architecture needs to be deployed. Since this is a widely research area in the computer vision, there are many decent backbone architectures. This includes DeepPose [13], which is deployed using AlexNet [14] as the backbone architecture. This was followed by the implementation of R-CNN [15], Fast-RCNN [16], machine learning algorithms. This was then followed by VGG [17] but most of the recent research use ResNet [18]. DeepPose is a human pose estimation model which uses Deep Neural Networks. This captures the position of each joint in a frame which do not require any use of graphical models. DeepCut [1] is used for multiple people pose estimation. The model works by counting the number of people in the frame then predicting the common location of each key point.
Since the emergence of convolutional neural networks (CNN), one of the early implementations for pose estimation is the AlexNet to directly regress the joint co-ordinates to improve its accuracy. In Figure 1a, as mentioned, it detects the location of each key point. This includes upper extremity points such as head, arms, shoulders, elbow and other. As seen in Figure 1b, it shows the groupings or pairs between these key points to estimate a human pose (see Figure 1b).
2.4. Pose Classification
Therefore, this study investigated the use of human pose estimation and pose classification in recognizing proper and improper sitting posture in a work-from-home environment.
Table 1 above shows the summary of the relevant studies published from 2017 to the present time. This covers the studies which used camera as the main tool to capture significant feature points. As seen in the table, the first study used webcam as the main tool for data capturing. It also utilized physical markers placed on the key points. This study recommended the use of deep learning and CNN (Convolutional Neural Network) to recognize key points [48]. The next study used CNN to detect and recognize 18 key points. The study focused on lower extremity and due to occlusion, this study suggested to investigate upper extremity points [49]. Then, the use of side camera was also suggested in this study [50]. This used Kinect cameras that are costly in nature in combination with IMU sensors that are intrusive and invasive. Lastly, the use of Pointcloud data were also investigated. This approach is not just computational expensive but also the price of Lidar sensors in the market is costly. Therefore, the investigation on the use of less expensive devices, less intrusive and less computationally expensive is needed.

Table 1.
Key Insights from the Early Studies (2017–2022).
Table 2 below shows the summary of all the key points mentioned in the previous studies as well as the device/s used to capture these key points. As seen in the table, there are common features that are being measured by both direct (Accelerometer, Gyroscope and IMU) and vision-based type of measurements (RGB and RGB-D cameras). It is noticeable that due to the limitations of direct-based sensors (the cost of these sensors and its nature—intrusive), there is a smaller number of feature points compared to vision-based sensors.
Table 2.
Keypoints and their respective method of capturing.
As seen in the Table 2 below, there are key points that can be measured with either sensors directly attached to human body or vision-based (camera-based) sensors. It is noticeable that in the literature, the three points in the spine, only being measured using direct-based measurement (accelerometers). Therefore, some of the features mentioned in this table will be use in the proposed study. Additionally, some features that were captured using direct-based measurements will be measured using camera-based sensors.
The succeeding sections shows the important concepts and techniques to achieve an acceptable monitoring system for proper and improper sitting posture. The study is divided into two major tasks. First, to develop an acceptable dataset with the guidance and supervision of the Domain Experts (Licensed Physical Therapists). This is essential since this study has added distinct key points such as chin, and three key points in the spine (thoracic, thoraco-lumbar and lumbar). This includes the use of sufficiently fast Human Pose Estimation, and acceptable algorithm for pose classification. To locate raw feature points using human pose estimation, this study has used existing framework.
The next major task is to generate rules used for pose classification systems. These rules will be used to recognize proper and improper sitting posture using the features generated with the distinct key points.
3. Materials and Methods
3.1. Dataset Creation
3.1.1. Data Gathering—Participants
This study includes thirty (30) males and thirty (30) females with a desired height and wrist size (see Table 3 below). A total of sixty (60) participants were involved in the study. They accomplished ethical clearance and data privacy statements. The study did not include any participant who has a history of back-related disorders such as kyphosis, scoliosis and alike (see Table 3).
Table 3.
Body Frame Category.
3.1.2. Data Gathering—Key Points
The key points that were captured by the data gathering tool were presented in Table 4. As seen in the table, it has identical list of feature points for both left and right sides. Aside from these key points, additional feature points such as points’ distances and angles were calculated to help in the recognition. Common features from the existing human pose estimation systems were shown below such as neck, elbow, shoulder, and nose. Moreover, additional distinct feature points were also recognized such as three points in the spine and chin. These distinct feature points are not part of the human pose estimation model Mediapipe [55] that was used to recognize key points. The method on how these distinct feature points were captured will be discuss in the succeeding sections.
Table 4.
List of Keypoints.
3.1.3. Data Gathering—Data Capturing Tool
- The data gathering is composed of three cameras—two mobile phones positioned at the lateral (left and right) of the participant and one web camera positioned in the anterior of the participant for a web conference call with the experts (Licensed Physical Therapists).
- The smartphones minimum specifications in capturing the videos are:
- 1280 × 720 resolution
- 30 fps
- The web conference call was made using a Zoom Meeting. The conference call is essential for the Licensed Physical Therapists (PTs) to facilitate the data gathering procedures and check the sitting posture every ten (10) minutes.
- The two mobile phone cameras positioned in the lateral is essential for livestreaming purposes so that the experts will be able to see the movements of the participants in real-time. This has been achieved using server-client network wherein these two mobile phones were connected into a single server and using a web browser, the experts will be able to access and see the videos.
- At the same time, the two mobile phones captured videos will be saved and recorded for feature extraction purposes later. Since some of the participants are working individuals, audio will not be part of the video as there are some confidential information could be leaked in the duration of the data gathering.
3.1.4. Data Gathering Setup
The setup as shown in Figure 2 below includes two smartphones camera placed in left and right side of the participant with an angle of 90° and a distance of 3 ft and a height of 2.5 ft. This also shows the distance from the monitor.
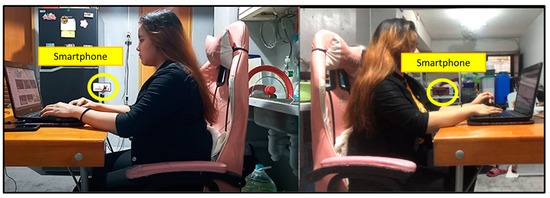
Figure 2.
Data Gathering Setup.
3.1.5. Data Gathering Procedures
Once the setup was done as mentioned earlier, the data gathering will take place as seen in the steps below:
- The participant will start to use the computer in the queue of the technical team. At the same time, the recording process will start and run continuously. Since the participants have computer-related jobs, the study just let them do their job throughout the data gathering (typing, programming, and alike) in seated-typing positions.
- To capture proper sitting posture, the experts will instruct the participants to sit properly checking their left and right views. For the benefit of the participants (an easier identification of body points), the study made seven (7) groups of key points. These are the following: head, neck, shoulders, elbows, wrist, upper back, and lower back.
- Once they are seated properly as per the instruction and judgment of all the experts (based on the posture states criteria mentioned in Table 5), the tool record the posture for ten (10) minutes.
Table 5. Posture States Criteria.
- Each participant was instructed to take short breaks to minimize bias in between takes.
- A total of sixty (60) recordings of ten-second videos were recorded per participant.
- After this, to record improper sitting posture, the participants will proceed to his/her usual seated-typing positions where he/she feel comfortable for thirty (30) minutes.
3.1.6. Data Gathering- Video Annotation
After the recording process, videos of left and right cameras were saved. These videos were saved in a cloud server (Dropbox) and access were given to the annotators. The annotation process was performed as follow:
- A total of three (3) PTs (Physical Therapists) served as annotators.
- The annotation process was done blindly (each annotator will work independently).
- The annotation is based on the criteria set in Table 5.
- Initially, a collection of recordings of proper sitting postures were stored.
- For the recording of improper sitting postures, a total of thirty (30) minutes per participant was captured. These recordings were normalized in this manner:
- Video Pre-processing—cutting the thirty (30) minute video into multiple ten (10) second videos. The first ten (10) seconds of the total video recorded was cut since at that time, the participant was just warming up. For the pre-recorded proper sitting postures, each recording was cut to exactly ten (10) seconds.
- Removal of “Unusable Part”—removal of “unusable part” means the removal of positions aside from seated typing (i.e., standing, no person detected, etc.)
- After all these necessary steps, annotation took place by getting the dominant sitting posture (proper or improper) in every ten (10) second video. This was done as follows:
- From the first (1st) to ten (10th) seconds, the annotator will check for thedominant posture.
- Dominant posture is determined by a greater number of seconds (e.g., six (6) seconds of proper and four (4) seconds of improper, then the dominant posture is PROPER, otherwise IMPROPER). In getting the dominant posture, it does not necessary to read the consecutive seconds.
3.1.7. Data Preparation
Once the video annotation was finished, there will be three CSV files as the output from the three annotators. The data preparation is performed as follow:
- Part 1 of the CSV file contains the time, name, age, gender, category, table height, chair height and distance. (see Figure 3)
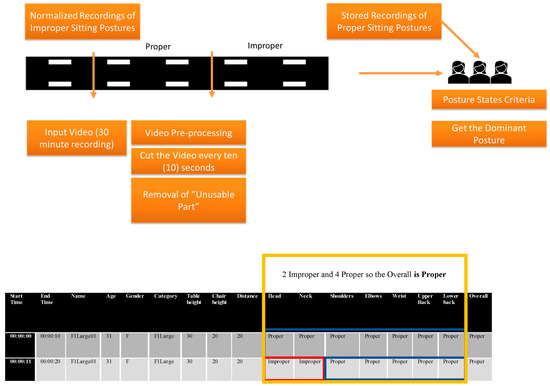 Figure 3. Video Annotation File.
 - Part 2 of the CSV file contains the label of the seven categories (head, neck, shoulders, elbows, wrist, upper back, lower back, and overall). (see Figure 3)
- To do this, each of the categories will be com-pared among the three CSV files
- If two out of three (2 out of 3) annotators agreed on a label then it will be the overall label for that instance (e.g., Row 2, PT1 = Improper, PT2 = Proper, PT3 = Proper, then the overall label for it is PROPER).
- This will be repeated on a total of 7200 instances (see the Equation (1) below).
Based on Table 6 below, the total number of instances of the study is 7200. To calculate this, the study captured ten (10) frames per second. Next, annotation was made every ten (10) seconds. A total of one hundred (100) frames were processed in the duration of 10 s. An overall total of ten (10) minutes were collected per sitting posture (proper and improper). So, a total of 6000 frames were processed for proper and another 6000 frames were processed for improper per participant. A total of sixty (60) participants were used in this study. Therefore, a total of 720,000 frames were process overall.
Table 6.
Total # of Frames and Instances.
Since annotation was made every ten (10) seconds, each participant has sixty (60) instances of proper and sixty (60) instances of improper. A total of one hundred twenty (120) instances per participant were collected, since the study has sixty (60) participants, therefore, a total of seven thousand two hundred (7200) instances overall (see Equation (1)).
As seen on the equation 1 below, a total of sixty (60) participants were gathered and twenty (20) minutes of data gathering for each participant. Twenty minutes has 1200 s but since the annotation will be made for every ten (10) seconds, a total of one hundred twenty (120) in-stances per participant will be recorded. Moreover, multiplying it again on the total number of participants, the overall number of instances is seven thousand two hundred (7200).
3.1.8. Feature Extraction Tool
As seen in Figure 4, to choose the proper human pose estimation tool, there are two performance evaluation for this recognition namely—mean average precision (mAP) and Percentage of Correct Key-points (PCK). To compute for Mean average precision, four key metrics were used (Confusion Matrix, Intersection-over-Union, precision and recall) [56].
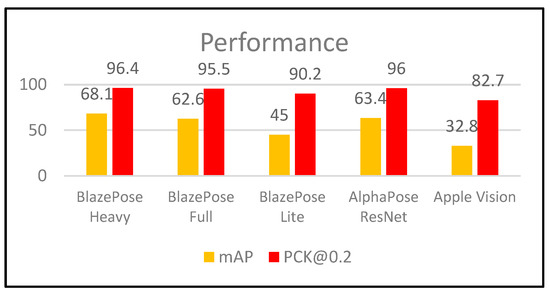
Figure 4.
Comparison of the Performance of the Recognition [55].
Percentage of Correct Key-points (PCK) is the metric used for identifying if a detected joint is considered correct. This can be performed by checking if the distance between the predicted and the true joint is within a certain threshold. Specifically, this study used PCK@0.2 = Distance between predicted and true joint <0.2 * torso diameter.
The performance of the model is shown in the Figure 4 below. The model has deployed three versions namely—heavy, full and lite. As seen in the figure below, the model outperformed the other existing solutions in mAP and PCK.
This feature extraction tool was written in C# using a machine learning solution MediaPipe for high fidelity body pose tracking. This runs inference in small scale tools such as desktops/laptops and mobile phones compared to other machine learning solutions that require powerful desktop environments to generate accurate results.
This task of computer vision requires large-scale computational devices to achieve desirable outcome and to run in a real-time basis. The Machine Learning Pipeline consisting of pose detection and tracking each key points must be very fast and requires low latency. Therefore, to achieve a best and fast performance of the detection and tracking, the most visible part of the frame will be the head. So, this could calculate the and detects the location of the person within the frame. From this, it explicitly predicts two additional virtual key points that could describe the center of the human body, rotation and scale. The Pose detector predicts the center of the human body, rotation and scale as a circle. This is essential to obtain the midpoints of a person’s hips in the frame, the radius of a circle to map the whole person in the frame and the incline angle of line connecting the shoulder and hip midpoints.
This works by running the pose detector in the first frame of the input video that will localize the Region-of-Interest (person) and draw a bounding box. The pose tracker will then predict all the 33 key points and run through all the subsequent frames using the previous frame’s ROI. This only call the detection model when it fails to reach the target confidence score (means fails to track the person).
Mediapipe was used to recognize and track key points in fast and acceptable manner, and the number of feature points are significantly greater than other existing models.
The output of this feature extraction tool is a csv file which contains the x and y locations of the feature points mentioned above.
- The feature extraction process is performed as follow:
- The video will be fed into the tool (This could be completed one by one).
- The video will be processed frame by frame (10 frames per second).
- The given image resolution of 1280 × 720 pixels:
- Then these points will then be converted into lines using the Equation 2 below:
However, it does not cover some of the targeted points of this study such as chin, upper, middle, and lower back (see Figure 5).
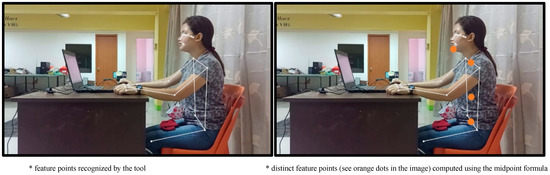
Figure 5.
The points recognized by Mediapipe and the points recognized by the key point extraction tool.
- To recognize these distinct key points, the study will use the common key points of Mediapipe as its base reference for computing the location of each distinct key point and getting its midpoints.
- To compute for these distinct feature points, the study will use midpoint formula.
For chin,
- X = shoulder
- Y = nose
For Thoracic (Upper Back)
- X = Left Shoulder
- Y = Right Shoulder
For Lumbar (Lower Back)
- X = Left Hips
- Y = Right Hips
For Thoraco-Lumbar (Mid-Back)
- X = Thoracic
- Y = Lumbar
After recognizing these distinct features, x and y location of these points in every frame will be recorded.
3.1.9. Feature Extraction
After the recognition of the key points mentioned above, the features were extracted as described below. Table 7 below shows the description of the additional computed features of the study. As seen in the table, the calculation of the difference in the Y-Axis of the distinct features in the spine namely (thoracic, thoracolumbar, and lumbar); the distance between nose and left or right shoulder (Trapezius Muscle); Cosine Rule for (Brach) Brachioradialis angle (computed from left/right shoulder, elbow and wrist); Cosine Rule for (TL) Thoraco-Lumbar angle (computed from left/right shoulder, thoracolumbar and lumbar); and the distance between Nose and Thoracic (neck) Distance. These additional features were used in the development of the model for the recognition of proper and improper sitting postures. The significance of these features was also computed and shown in the results.
Table 7.
List of Features.
For features 11–13, the study applies the cosine rule which follows the procedures below:
- First, find the distance between point a (shoulder left) and point b (elbow left) using the distance formula below:
- Second, find the distance between point b (elbow left) and point c (wrist left)
- Then, find the distance between point c (wrist left) and point a (shoulder left)
- Lastly, apply the cosine rule:
3.2. Pose Extraction and Classification
3.2.1. Feature Extraction
After the extraction of keypoints, the output dataset will undergo data cleaning and normalizing which can be performed by calculating the threshold of values for every ten (10) seconds.
These CSV files will be matched to the CSV files annotated by the PTs. Since the annotations of the experts were taken every ten (10) seconds, these CSV files generated by the feature extraction tool will be normalize. Standard statistical measurements will be calculated such as mean, median, mode, standard deviation and variance.
A total of seven thousand two hundred (7200) instances will be the normalized CSV file and to be fed on the model development. A total of one hundred twenty (120) instances per participant will be labelled. At this point, there is a 50–50 distribution between two labels. Sixty (60) instances for proper and another sixty (60) in-stances for improper. This is also equivalent to ten (10) minutes of data collection for both proper and improper.
3.2.2. Feature Engineering
Table 8 and Table 9 show the features or attributes collected in the data set. The study tries to recognize two labels such as proper and improper sitting posture. The features stated in Table 8 are name, age, gender, wrist size, category, table height, chair height, distance between table and chair. These features were collected during the data gathering using a google spreadsheet sent to the participants.
Table 8.
List of Demographic Features.
Table 9.
List of Final Feature Points.
3.2.3. Classification
The study used the 70–30 distribution for training and testing. During the training, the study utilized the different supervising learning techniques such as Random Tree, Random Forest, Decision Tree and Decision Stump and Rule Induction. Stated below are the definitions of each operator.
- Batch- X Fold Validation—This operator performs a cross-validation to estimate the statistical performance of a learning operator (usually on unseen data sets). It is mainly used to estimate how accurately a model will perform in practice.
- Classification- Next is to identify the type of machine learning technique suitable to generate an acceptable model. There are some well-known classifiers used in different previous studies. Different machine learning algorithms such as Random Forest algorithm, Decision Tree algorithm, Random Tree, Decision Stump and Rule Induction were analyzed. Most of the studies stated in this proposal show that Random Forest and Decision Tree Classifier outperformed these some-well known classifiers in terms of accuracy.
4. Results
As stated, this study developed an objective-type of dataset with the supervision and guidance of the field experts (Licensed Physical Therapists). A total of three experts were part of the study. The agreement among these experts were measured using Fleiss’ Kappa (see Table 10). Overall, the experts have a kappa of maximum of 0.5 (acceptable agreement) between PT3 and PT1.
Table 10.
Kappa Agreement Among Experts.
As much as possible, the study tries to develop a balanced dataset (same number of samples for each class), however, the study tries to remove bias and lessen the impact of the imbalance dataset, the study use optimization to obtain the optimal type of sampling in splitting the data. There are four possible values namely: linear sampling, shuffled sampling, stratified sampling and automatic. After a given number of permutations, the most optimal type of sampling is stratified sampling. Table 11 shows the parameter optimization for Decision Tree and Rule Induction. These two models were selected due to the consistent performance of these during the training.
Table 11.
Parameter Optimization.
After 26,000 permutations in Decision Tree and 968 in Rule Induction, the optimal values for each parameter are the following (see Table 11).
The comparison of both left and right camera models was presented in Figure 6. As seen two most appropriate models were presented namely Decision Tree and Rule Induction. Both classifiers have almost the same performance with an accuracy of ~92% and a kappa of ~0.8. It is noticeable that the Right Camera Model performs better compared to the Left Camera Model. One factor that can be drawn from this result is that all the participants are right handed, therefore, more actions and movements
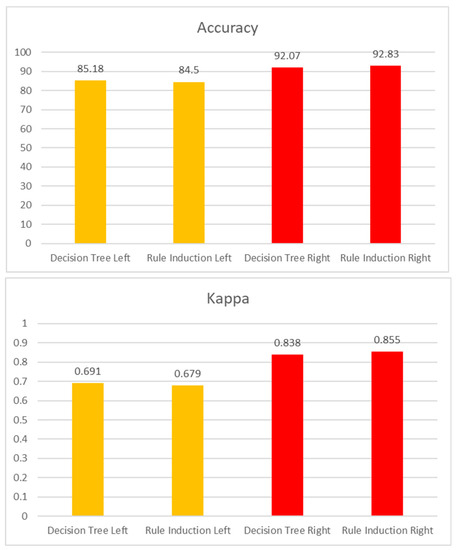
Figure 6.
Performance of Both Models.
Table 12 and Table 13 show the generated rules to recognize proper and improper sitting posture. Table 12 shows the rules for Left Camera and Table 13 shows the rules for Right Camera. As seen in these tables, the significant features found common in two models are age, the distance between nose and left shoulder and table height.
Table 12.
Rules for Left Camera Model.
Table 13.
Rules for Right Camera Model.
5. Discussion
5.1. Comparison of Left and Right Models
As seen in Figure 6 above, Decision Tree shows an accuracy of 91.5383, a kappa statistic of 0.792 for Left Camera and 97.0591 and 0.9003 for Right Camera. Additionally, for Left model, the true positive rate is 0.988 and 0.893, false positive rate is 0.107 and 0.012, precision of 0.976 and 0.945 and recall of 0.988 and 0.893 for improper and proper respectively. Right model shows a true positive rate of 0.988 and 0.893, false positive rate of 0.107 and 0.012, precision of 0.976 and 0.945 and recall of 0.988 and 0.893 for improper and proper respectively.
Moreover, additional experiments were conducted on the seven categories namely head, neck, shoulders, elbow, wrist, upper and lower back. This study investigated the performance of the recognition if it will be based on each category mentioned, as well as the pattern in recognizing sitting posture. The results are as follow:
As seen in the Table 14 below, for Left camera model, highest accuracy level performed is elbow with an accuracy rate of 98.003 and a kappa of 0.9596. On the other hand, the lowest accuracy model performed is lower back with an accuracy rate of 92.765 and a kappa of 0.7649. It is also noticeable that the precision and recall for both proper and improper performs worse in upper back. This shows a precision rate of 0.573 and 0.975, recall rate of 0.373 and 0.989 for proper and improper respectively. This means that there are a smaller number of proper sitting postures exhibited by the elbow compared to other body parts. In seated typing position, elbow shows a major role in the recognition of proper and improper sitting posture.
Table 14.
Performance per Category (Left and Right Camera Model).
For Right camera model, highest accuracy performed is wrist with an accuracy rate of 99.5425 and a kappa of 0.9888. On the other hand, the lowest accuracy model performed is shoulders with an accuracy rate of 95.6073 and a kappa of 0.9085. It is also noticeable that in this model, the precision and recall of Upper Back for proper and improper. This shows a precision of 0.265 and 0.985 and a recall of 0.028 and 0.999 for proper and improper respectively. This means that there are also smaller number of proper sitting postures exhibited by upper back compared to other body parts.
Based on Table 14 below, it is noticeable that elbow and upper back performs best in left and right model, respectively. This shows that the distinct feature points such as upper back (Thoracic) is crucial in the recognition.
5.2. Significant Feature Points (Upper Extremity Points)
This study utilized additional feature points aside from the key points provided by the model. Based on Table 12 and Table 13, the significant features for both models are as follow:
For Left Model,
- noseleftshoulder—nose to left shoulder distance- This is to measure if the head is moving towards left; head should be straight.
- shoulder_elbow_dist—shoulder to elbow distance- This is to measure if the shoulder and elbow is levelled and in proper angle.
- elbow_wrist_dist—elbow to wrist distance- This is to measure if the elbow and wrist is in proper angle.
- stdSWEAngleA—shoulder, elbow and wrist angle A- This will measure the angle of these 3 points.
- shoulder_mid_dist—shoulder and thoraco-lumbar (distinct feature point) distance. This will measure if the shoulder is rounded, or the back is bending.
- hip_shoulder_dist—shoulder and lumbar (distinct feature point) distance. This will measure if the shoulder is rounded, or the back is bending.
For Right Model,
- wrist_shoulder_dist—Wrist to shoulder distance—This is to measure the angle from wrist to right shoulder.
- Nosetoleftshoulder—Nose to left shoulder distance—This is to measure the distance between nose and left shoulder.
- elbow_wrist_dist—elbow to wrist distance—This is to measure the distance between elbow and wrist.
- wrist_shoulder_dist—Wrist to shoulder distance—This is to measure the distance between wrist and shoulder.
- SEWAngleC—shoulder, elbow and wrist angle C—This will measure the angle of these 3 points.
- hip_shoulder_dist—hip_shoulder_dist- shoulder and lumbar (distinct feature point) distance. This will measure if the shoulder is rounded, or the back is bending
It is noticeable that both models have almost identical attributes that are significant in the recognition of proper and improper sitting postures. Both models have nose to left shoulder distance and elbow and wrist distance and shoulder to lumbar distance. Nose to left shoulder is significant to measure the posture of head and shoulder and elbow and wrist distance is used to identify the typing position, and shoulder to lumbar distance checks if the shoulder is rounded or the spine is bending.
5.3. Significant Features (Demographics and Ergonomic Elements)
Aside from these features mentioned, ergonomic design is also part of the dataset which includes table height, chair height and the distance of the user from the monitor. This study found out that table height and chair height signify a correlation to other body feature points. Specifically, table height shows correlation to key points (from the model) while chair height shows correlation to the computed feature points (distances and angles).
5.4. Prototype
Lastly, to create an interactive prototype for this small-scale CNN (convolutional neural network) and the use of smartphones built-in camera to recognize proper and improper sitting posture. The study developed a system using C# and a native application running in Windows CPU-based only laptop. The testing setup follows the same setup mentioned in data gathering.
As seen in Figure 7 presented below, the prototype was able to recognize key points which include 13 body points. The system was able to calculate points distances and angles. Aside from these, the CSV files of all these feature points values can be downloaded. Once the video has been processed, it will show the recognition every 10 s in RED label (see Figure 8 below).
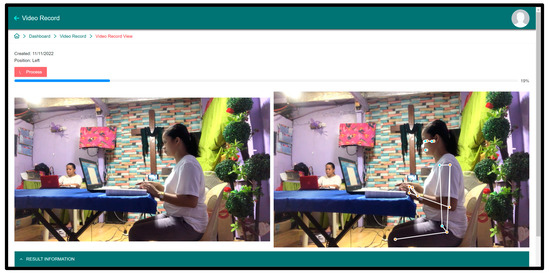
Figure 7.
System Prototype.

Figure 8.
Processed Video Result.
6. Conclusions and Recommendations
To summarize this study, three (3) important points were considered.
- Points—This study found significant feature points to recognize proper and improper sitting postures. This includes nose to left shoulder, shoulder to elbow, elbow to wrist, and shoulder to mid-hip (thoracolumbar) for both Left and Right models. It is also noticeable that age and table height are also considered significant factors in the recognition.
- Patterns—It has been seen that the distance between the nose and the left shoulder is present in both the Left and Right models. This is because all the participants are right-handed, therefore the head motions are moving towards the left side. Also, the study found the optimal table height of higher than 30 inches across all body frame categories. Moreover, the upper back shows less true positive rate (TP) for proper samples in both the Left and Right models. The study found out that even if the domain experts all agreed that the captured ten (10) second video is proper upon their careful assessment, during the annotation process and getting the dominant label, they found out that proper sitting posture for the upper back does not last for more than five (5) seconds. The upper back point (thoracic) started to either drop or extend. Lastly, the lower back category shows the lowest accuracy compared to all other categories (Left: 92.765 and Right: 96.5223). In connection with the upper back, the lower back also drops or extends during the annotation process.
- Performance—Overall, the Left and Right camera datasets were compared that show accuracy of 91.5% and 97.05% and kappa of 0.7 and 0.9 respectively. The left model shows a lesser accuracy rate because of fewer motions exhibited on the left side. Since the users are also using other peripherals such as a mouse, there are much more variations between proper and improper motions on the right side compared to the left side.
After a successful recognition of proper and improper sitting posture using virtual markers and a small-scale convolutional neural network, this study would like to recommend for future researchers to explore:
- Since the convolutional neural network shows significant and fast-paced progress, the need to test and evaluate other new models is needed.
- The consideration of more feature points is also needed. For whole body points, 33 key points may not be optimal to capture other complex positions.
- The consideration of more capturing devices such as the integration of front camera and left camera.
- The study also recommends the inclusion of other attributes such as eyesight, weight, the use of adjustable tables or chairs, and others.
- Future studies should also implement multiple-person recognition.
Author Contributions
Conceptualization, J.E.E.; methodology, J.E.E.; software, J.E.E.; validation, J.E.E., L.A.V. and M.D.; formal analysis, J.E.E.; investigation, J.E.E.; resources, J.E.E.; data curation, J.E.E.; writing—original draft preparation, J.E.E.; writing—review and editing, J.E.E., L.A.V. and M.D.; visualization, J.E.E.; supervision, J.E.E., L.A.V. and M.D.; project administration, J.E.E. All authors have read and agreed to the published version of the manuscript.
Funding
This research received no external funding.
Informed Consent Statement
Informed consent was obtained from all subjects involved in the study.
Data Availability Statement
The data presented in this study are available on request from the corresponding author.
Conflicts of Interest
The authors declare no conflict of interest.
References
- Kreiss, S.; Bertoni, L.; Alahi, A. PifPaf: Composite fields for human pose estimation. In Proceedings of the IEEE/CVF Conference on Computer Vision and Pattern Recognition (CVPR), Long Beach, CA, USA, 15–20 June 2019; pp. 11969–11978. [Google Scholar]
- Babu, S.C. A 2019 Guide to Human Pose Estimation With Deep Learning. 2019. Available online: https://nanonets.com/blog/humanpose-estimation-2d-guide/ (accessed on 1 June 2020).
- Chen, X.; Yuille, A.L. Articulated pose estimation by a graphical model with image dependent pairwise relations. In Proceedings of the Annual Conference on Neural Information Processing Systems, NIPS, Montreal, QC, Canada, 8–13 December 2014; pp. 1736–1744. [Google Scholar]
- Mwiti, D. A 2019 Guide to Human Pose Estimation. 2019. Available online: https://heartbeat.fritz.ai/a-2019-guide-to-human-poseestimation-c10b79b64b73 (accessed on 1 June 2020).
- Andriluka, M.; Roth, S.; Schiele, B. Pictorial structures revisited: People detection and articulated pose estimation. In Proceedings of the IEEE Conference on Computer Vision and Pattern Recognition Workshops, Miami, FL, USA, 20–25 June 2009; pp. 1014–1021. [Google Scholar] [CrossRef]
- Andriluka, M.; Roth, S.; Schiele, B. Monocular 3D pose estimation and tracking by detection. In Proceedings of the IEEE Conference on Computer Vision and Pattern Recognition Workshops, San Francisco, CA, USA, 13–18 June 2010; pp. 623–630. [Google Scholar] [CrossRef]
- Johnson, S.; Everingham, M. Clustered pose and nonlinear appearance models for human pose estimation. In Proceedings of the British Machine Vision Conference, Aberystwyth, UK, 31 August–3 September 2010; p. 5. [Google Scholar]
- Pishchulin, L.; Andriluka, M.; Gehler, P.; Schiele, B. Poselet conditioned pictorial structures. In Proceedings of the IEEE Conference on Computer Vision and Pattern Recognition Workshops, Portland, OR, USA, 23–28 June 2013; pp. 588–595. [Google Scholar]
- Yang, Y.; Ramanan, D. Articulated pose estimation with flexible mixtures-of-parts. In Proceedings of the Computer Vision and Pattern Recognition (CVPR), Colorado Springs, CO, USA, 20–25 June 2011; pp. 1385–1392. [Google Scholar] [CrossRef]
- Yang, Y.; Ramanan, D. Articulated human detection with flexible mixtures of parts. IEEE Trans. Pattern. Anal. Mach. Intell. 2013, 35, 2878–2890. [Google Scholar] [CrossRef] [PubMed]
- Lin, T.-Y.; Maire, M.; Belongie, S.; Hays, J.; Perona, P.; Ramanan, D.; Dollár, P.; Zitnick, C.L. Microsoft COCO: Common Objects in Context. In Proceedings of the ECCV, Zurich, Switzerland, 6–12 September 2014; pp. 740–755. [Google Scholar]
- Andriluka, M.; Pishchulin, L.; Gehler, P.; Schiele, B. MPII human pose dataset. In Proceedings of the CVPR, Columbus, OH, USA, 23–28 June 2014; pp. 3686–3693. [Google Scholar] [CrossRef]
- Toshev, A.; Szegedy, C. DeepPose: Human pose estimation via deep neural networks. In Proceedings of the IEEE Conference on Computer Vision and Pattern Recognition Workshops, Columbus, OH, USA, 23–28 June 2014; pp. 1653–1660. [Google Scholar]
- Krizhevsky, A.; Sutskever, I.; Hinton, G.E. AlexNet: ImageNet classification with deep convolutional neural networks. In Proceedings of the NIPS, Lake Tahoe, NV, USA, 3–6 December 2012; pp. 1097–1105. [Google Scholar]
- Girshick, R.; Donahue, J.; Darrell, T.; Malik, J. Rich feature hierarchies for accurate object detection and semantic segmentation. In Proceedings of the IEEE Conference on Computer Vision and Pattern Recognition Workshops, Columbus, OH, USA, 23–28 June 2014; pp. 580–587. [Google Scholar]
- Girshick, R. Fast R-CNN. In Proceedings of the IEEE International Conference on Computer Vision (ICCV), Santiago, Chile, 7–13 December 2015; pp. 1440–1448. [Google Scholar]
- Simonyan, K.; Zisserman, A. VGG: Very deep convolutional networks for large-scale image recognition. arXiv 2015, arXiv:1409.1556. [Google Scholar]
- He, K.; Zhang, X.; Ren, S.; Sun, J. ResNet: Deep residual learning for image recognition. In Proceedings of the IEEE Conference on Computer Vision and Pattern Recognition (CVPR), Las Vegas, NV, USA, 27–30 June 2016; pp. 770–778. [Google Scholar]
- Yao, A.; Gall, J.; Van Gool, L. Coupled action recognition and pose estimation from multiple views. Int. J. Comput. Vis. 2012, 100, 16–37. [Google Scholar] [CrossRef]
- Wijndaele, K.; De Bourdeaudhuij, I.; Godino, J.G.; Lynch, B.M.; Griffin, S.J.; Westgate, K.; Brage, S. Reliability and validity of a domain-specific last 7-d sedentary time questionnaire. Med. Sci. Sport. Exerc. 2014, 46, 1248. [Google Scholar] [CrossRef] [PubMed]
- Pasdar, Y.; Niazi, P.; Darbandi, M.; Khalundi, F.; Izadi, N. Study of physical activity and its effect on body composition and quality of life in female employees of Kermanshah University of Medical Sciences in 2013. J. Rafsanjan Univ. Med. Sci. 2015, 14, 99–110. [Google Scholar]
- Homer, A.R.; Owen, N.; Sethi, P.; Clark, B.K.; Healy, G.N.; Dempsey, P.C.; Dunstan, D.W. Differing context-specific sedentary behaviors in Australian adults with higher and lower diabetes risk. Res. Sq. 2020. [Google Scholar] [CrossRef]
- Suhaimi, S.A.; Müller, A.M.; Hafiz, E.; Khoo, S. Occupational sitting time, its determinants and intervention strategies in Malaysian office workers: A mixed-methods study. Health Promot Int. 2022, 37, daab149. [Google Scholar] [CrossRef]
- Li, S.; Lear, S.A.; Rangarajan, S.; Hu, B.; Yin, L.; Bangdiwala, S.I.; Alhabib, K.F.; Rosengren, A.; Gupta, R.; Mony, P.K.; et al. Association of Sitting Time with Mortality and Cardiovascular Events in High-Income, Middle-Income, and Low-Income Countries. JAMA Cardiol. 2022, 7, 796–807. [Google Scholar] [CrossRef]
- Mielke, G.I.; Burton, N.W.; Turrell, G.; Brown, W.J. Temporal trends in sitting time by domain in a cohort of mid-age Australian men and women. Maturitas 2018, 116, 108–115. [Google Scholar] [CrossRef]
- Matthews, C.E.; Chen, K.Y.; Freedson, P.S.; Buchowski, M.S.; Beech, B.M.; Pate, R.R.; Troiano, R.P. Amount of time spent in sedentary behaviors in the United States, 2003–2004. Am. J. Epidemiol. 2008, 167, 875–881. [Google Scholar] [CrossRef] [PubMed]
- Lis, A.M.; Black, K.M.; Korn, H.; Nordin, M. Association between sitting and occupational LBP. Eur. Spine J. 2007, 16, 283–298. [Google Scholar] [CrossRef] [PubMed]
- Cote, P.; van der Velde, G.; Cassidy, J.D.; Carroll, L.J.; Hogg-Johnson, S.; Holm, L.W.; Carragee, E.J.; Haldeman, S.; Nordin, M.; Hurwitz, E.L.; et al. The burden and determinants of neck pain in workers: Results of the Bone and Joint Decade 2000–2010 Task Force on Neck Pain and Its Associated Disorders. Spine 2008, 33, S60–S74. [Google Scholar] [CrossRef] [PubMed]
- Janwantanakul, P.; Pensri, P.; Jiamjarasrangsri, V.; Sinsongsook, T. Prevalence of self-reported musculoskeletal symptoms among office workers. Occup. Med. 2008, 58, 436–438. [Google Scholar] [CrossRef] [PubMed]
- Juul-Kristensen, B.; Søgaard, K.; Strøyer, J.; Jensen, C. Computer users’ risk factors for developing shoulder, elbow and back symptoms. Scand J. Work Environ. Health 2004, 30, 390–398. [Google Scholar] [CrossRef]
- Bhardwaj, Y.; Mahajan, R. Prevalence of neck pain and disability in computer users. Int. J. Sci. Res. 2017, 6, 1288–1290. [Google Scholar]
- Hafeez, K.; Ahmed Memon, A.; Jawaid, M.; Usman, S.; Usman, S.; Haroon, S. Back Pain-Are Health Care Undergraduates at Risk? Iran. J. Public Health 2013, 42, 819–825. [Google Scholar]
- Hurwitz, E.L.; Randhawa, K.; Yu, H.; Côté, P.; Haldeman, S. The Global Spine Care Initiative: A summary of the global burden of low back and neck pain studies. Eur. Spine J. 2018, 27, 796–801. [Google Scholar] [CrossRef]
- March, L.; Smith, E.U.; Hoy, D.G.; Cross, M.J.; Sanchez-Riera, L.; Blyth, F.; Buchbinder, R.; Vos, T.; Woolf, A.D. Burden of disability due to musculoskeletal (MSK) disorders. Best Pract. Res. Clin. Rheumatol. 2014, 28, 353–366. [Google Scholar] [CrossRef]
- Dieleman, J.L.; Cao, J.; Chapin, A.; Chen, C.; Li, Z.; Liu, A.; Horst, C.; Kaldjian, A.; Matyasz, T.; Scott, K.W.; et al. US Health Care Spending by Payer and Health Condition, 1996–2016. JAMA 2020, 323, 863–884. [Google Scholar] [CrossRef]
- Wei, S.-E.; Ramakrishna, V.; Kanade, T.; Sheikh, Y. Convolutional pose machines. In Proceedings of the IEEE Conference on Computer Vision and Pattern Recognition Workshops, Las Vegas, NV, USA, 27–30 June 2016; pp. 4724–4732. [Google Scholar]
- Liu, Y.; Weinshall, D. Recognizing dance gestures with pose-based RNNs. In Proceedings of the on Thematic Workshops of ACM Multimedia, Mountain View, CA, USA, 23–27 October 2017; pp. 535–543. [Google Scholar]
- Chen, J.; Li, Y.; Liu, Y.; Weinshall, D. Hybrid CNN-RNN for action recognition from video. In Proceedings of the IEEE Conference on Computer Vision and Pattern Recognition, Salt Lake City, UT, USA, 18–23 June 2018; pp. 8298–8307. [Google Scholar]
- Sun, S.; Liu, Y.; Weinshall, D. Multi-task single-person pose estimation and action recognition. In Proceedings of the IEEE Conference on Computer Vision and Pattern Recognition, Salt Lake City, UT, USA, 18–23 June 2018; pp. 7417–7425. [Google Scholar]
- Su, Z.; Ye, M.; Zhang, G.; Dai, L.; Sheng, J. Cascade feature aggregation for human pose estimation. arXiv 2019, arXiv:1902.07837. [Google Scholar]
- Newell, A.; Yang, K.; Deng, J. Stacked hourglass networks for human pose estimation. In Proceedings of the ECCV, Amsterdam, The Netherlands, 8–16 October 2016; pp. 483–499. [Google Scholar]
- Zhang, H.; Ouyang, H.; Liu, S.; Qi, X.; Shen, X.; Yang, R.; Jia, J. Human pose estimation with spatial contextual information. In Proceedings of the CVPR, Long Beach, CA, USA, 15–20 June 2019; pp. 1–10. [Google Scholar]
- Xiao, B.; Wu, H.; Wei, Y. Simple baselines for human pose estimation and tracking. In Proceedings of the European Conference on Computer Vision—ECCV, Munich, Germany, 8–14 September 2018; Ferrari, V., Hebert, M., Sminchisescu, C., Weiss, Y., Eds.; Springer: Cham, Switzerland, 2018; pp. 472–487. [Google Scholar]
- Chen, Y.; Wang, Z.; Peng, Y.; Zhang, Z.; Yu, G.; Sun, J. Cascaded pyramid network for multi-person pose estimation. In Proceedings of the IEEE/CVF Conference on Computer Vision and Pattern Recognition (CVPR), Salt Lake City, UT, USA, 18–23 June 2018; pp. 7103–7112. [Google Scholar] [CrossRef]
- Insafutdinov, E.; Pishchulin, L.; Andres, B.; Andriluka, M.; Schiele, B. DeeperCut: A deeper, stronger, and faster multi-person pose estimation model. In Proceedings of the ECCV, Amsterdam, The Netherlands, 8–16 October 2016; pp. 34–50. [Google Scholar]
- Cao, Z.; Simon, T.; Wei, S.-E.; Sheikh, Y. Realtime multi-person 2D pose estimation using part affinity fields. In Proceedings of the IEEE Conference on Computer Vision and Pattern Recognition (CVPR), Honolulu, HI, USA, 21–26 July 2017; pp. 1302–1310. [Google Scholar]
- Sun, K.; Xiao, B.; Liu, D.; Wang, J. Deep high-resolution representation learning for human pose estimation. In Proceedings of the IEEE/CVF Conference on Computer Vision and Pattern Recognition (CVPR), Long Beach, CA, USA, 15–20 June 2019; pp. 5686–5696. [Google Scholar]
- Estrada, J.; Vea, L. Sitting posture recognition for computer users using smartphones and a web camera. In Proceedings of the TENCON 2017 IEEE Region 10 Conference, Penang, Malaysia, 5–8 November 2017; pp. 1520–1525. [Google Scholar] [CrossRef]
- Ghazal, S.; Khan, U.S. Human Posture Classification Using Skeleton Information. In Proceedings of the 2018 International Conference on Computing, Mathematics and Engineering Technologies: Invent, Innovate and Integrate for Socioeconomic Development, iCoMET 2018, Sukkur, Pakistan, 3–4 March 2018. [Google Scholar]
- Ding, Z.; Li, W.; Ogunbona, P.; Qin, L. A real-time webcam-based method for assessing upper-body postures. Mach. Vis. Appl. 2019, 30, 833–850. [Google Scholar] [CrossRef]
- Kappattanavar, A.M.; da Cruz, H.F.; Arnrich, B.; Böttinger, E. Position Matters: Sensor Placement for Sitting Posture Classification. In Proceedings of the 2020 IEEE International Conference on Healthcare Informatics (ICHI), Oldenburg, Germany, 30 November–3 December 2020; pp. 1–6. [Google Scholar] [CrossRef]
- Katayama, H.; Mizomoto, T.; Rizk, H.; Yamaguchi, H. You Work We Care: Sitting Posture Assessment Based on Point Cloud Data. In Proceedings of the 2022 IEEE International Conference on Pervasive Computing and Communications Workshops and other Affiliated Events (PerCom Workshops), Pisa, Italy, 21–25 March 2022; pp. 121–123. [Google Scholar] [CrossRef]
- Jolly, V.; Jain, R.; Shah, J.; Dhage, S. Posture Correction and Detection using 3-D Image Classification. In Proceedings of the 2022 International Conference for Advancement in Technology (ICONAT), Goa, India, 21–22 January 2022; pp. 1–5. [Google Scholar] [CrossRef]
- Estrada, J.E.; Vea, L.A. Real-time human sitting posture detection using mobile devices. In Proceedings of the 2016 IEEE Region 10 Symposium (TENSYMP), Bali, Indonesia, 9–11 May 2016; pp. 140–144. [Google Scholar] [CrossRef]
- Pose Landmarks Detection Task Guide. Available online: https://google.github.io/mediapipe/solutions/pose.html (accessed on 10 December 2021).
- Ma, J.; Ma, L.; Ruan, W.; Chen, H.; Feng, J. A Wushu Posture Recognition System Based on MediaPipe. In Proceedings of the 2022 2nd International Conference on Information Technology and Contemporary Sports (TCS), Guangzhou, China, 24–26 June 2022; pp. 10–13. [Google Scholar] [CrossRef]


Disclaimer/Publisher’s Note: The statements, opinions and data contained in all publications are solely those of the individual author(s) and contributor(s) and not of MDPI and/or the editor(s). MDPI and/or the editor(s) disclaim responsibility for any injury to people or property resulting from any ideas, methods, instructions or products referred to in the content. |
© 2023 by the authors. Licensee MDPI, Basel, Switzerland. This article is an open access article distributed under the terms and conditions of the Creative Commons Attribution (CC BY) license (https://creativecommons.org/licenses/by/4.0/).