Abstract
The response of any engineering design components to stresses should be predictable, While the response of a material to complex loading, such as high strain rates experienced during service, is difficult to represent with simple tests, the Taylor impact test is one of a number of tests devised for high strain rate complex loading. To expedite the acceptance of LPBF Ti6Al4V (ELI) for use in demanding structural applications, there is a need to develop numerical models based on the internal microstructural state variables to predict the performance of the alloy over a wide range of high strain rates using such complex tests. This paper documents the numerical simulation of Taylor impact tests for direct metal laser-sintered and post-processed Ti6Al4V (ELI—Extra Low Interstitial) alloy. A microstructural variable-based constitutive model was used to predict the mechanical properties (stresses and evolution of plastic strains) of the material. The corresponding material parameters of the model were based on the specific microstructure obtained upon post-process heat treatment. The model was first implemented as a user material subroutine in the explicit finite element program ABAQUS using the VUHARD subroutine. Subsequently, the symmetrical Taylor impact tests of Laser Powder Bed Fusion (LPBF) Ti6Al4V (ELI) parts were numerically simulated using the VUHARD subroutine at different impact velocities. The equivalent von Mises stress and plastic strain obtained from numerical simulations were compared with the analytical solutions based on the strain rates obtained. It was shown that the instantaneous and average absolute errors between the numerical and analytical values of the model were generally less than 5%. The mushroom end, commonly observed in a Taylor test specimen, was also seen in the numerical model.
1. Introduction
Laser Powder Bed Fusion (LPBF), one of a number of additive manufacturing techniques, continues to gain attention in the aerospace, biomedical, military, and automotive industries, to name but a few, and is revolutionizing component designs and production lines. The technology has experienced considerable publicity and growth in the last few years, with many successful insertions for non-mission-critical applications such as in the biomedical sector. To meet the full potential that LPBF has to offer, especially for demanding structural applications such as flight-critical components and armaments, qualification and certification are necessary [1]. Some of the key areas that can be considered in the qualification routes include the development of analytical and numerical models that can be used to tailor the LPBF-produced parts to their mechanical properties and performance based on different internal and external state variables [2,3]. Data driven approaches can also be used to predict mechanical properties such as the fatigue life and fracture of components [4,5].
The manufacturing of parts with Ti6Al4V, an alloy commonly used for structural applications in jet engines and as a material for biomedical implants, has traditionally relied on the forging, casting, and rolling of bulk feedstock materials [6]. This is followed by subsequent machining to final shapes and dimensions [6,7]. However, the manufacturing of parts with this alloy through these conventional processes is always challenging due to its poor thermal conductivity, reactivity with oxygen, and susceptibility to strain hardening [7,8]. Besides, the nature of these traditional manufacturing processes leads to wastage of high volumes of material, which increases the cost of production. Compared to other additive manufacturing techniques, LPBF has provided a better alternative in the production of Ti6Al4V alloys, which accounts for more than 50% of the titanium alloy usage in the market [9,10,11]. To expedite the acceptance of LPBF Ti6Al4V (ELI) for use in demanding structural applications, there is a need to develop numerical models based on the internal microstructural state variables in order to predict the performance of the alloy over a wide range of external state variables. Such models are critical in instances where it is difficult to test the mechanical performance of the parts in their actual environmental conditions, such as for temperature and strain rate.
A constitutive model for predicting the mechanical performance of different forms of LPBF Ti6Al4V (ELI) over a wide spectrum of strain rates and temperatures was developed and validated in the authors’ work, which can be found in Muiruri et al. [3]. The constitutive model was based on microstructural internal state variables. The model took into consideration the meso-deformation of various forms of post-process heat-treated LPBF Ti6Al4V (ELI) alloy, emphasizing the different sizes of α-grains and initial dislocation densities in these microstructures. The validated model was further implemented separately in the two ABAQUS/Explicit subroutines: VUMAT and VUHARD, which are useful in modelling the isotropic plasticity of materials. The implementation process and simulation results of single and multiple-element numerical models for testing VUMAT and VUHARD subroutines were reported in the authors’ work in reference [12]. The obtained positive test results provided a foundation for simulating more complex numerical models with contact interaction, such as the split Hopkinson pressure bar (SHPB) test and Taylor impact test, that allow for modelling at large magnitudes of strain and strain rates. The finite element modelling of the SHPB test for LPBF Ti6Al4V (ELI) alloy was carried out, where test samples were modelled using the VUMAT and VUHARD subroutines for this material that were extended in this work, the results of which were reported in reference [2].
The Taylor impact test typically consists of a cylindrical rod/bar/projectile striking a flat, rigid surface at high velocity to determine the dynamic properties of the rod/bar/projectile. During the test, the impact end of the rod/bar deforms plastically while the free end is undeformed. The impacted end experiences very high stresses and, once the elastic limit is exceeded, a plastic front moves towards the free end of the cylindrical rod/bar/projectile. Moreover, the cylindrical rod shortens as material flows out radially when the elastic rear portion of the rod becomes plastic. The Taylor test was used in this study to further validate the utility of the extended VUHARD subroutine reported in [12] to predict the high strain rate properties of LPBF Ti6Al4V (ELI) parts. The obtained numerical solutions were compared with analytical solutions based on the range of strain rate obtained during the simulations.
It is important to note that the Taylor impact test has been widely used in studying the high strain rate properties of materials [13,14]. In contrast to quasi-static material testing, where several standards such as ASTM and BS are used [15,16], the Taylor impact technique has not yet been standardised. Depending on the mechanical properties of the material being tested, various Taylor impact test specimen dimensions have been employed [13,14,17,18,19].
2. Finite Element Model of the Taylor Impact Test
Finite element modelling of the direct Taylor impact test was performed using ABAQUS/Explicit. The developed model consisted of a deformable three-dimensional (3D) cylinder impacting on a rigid surface at an initial prescribed velocity. The diameter and length of the cylindrical model used in this study were 5 mm and 15 mm, respectively. Furthermore, due to the axisymmetric nature of the cylindrical model, a quarter-symmetric model of the cylinder shown in Figure 1 was used in all analyses to reduce the total number of mesh elements used and therefore, the computation resources.
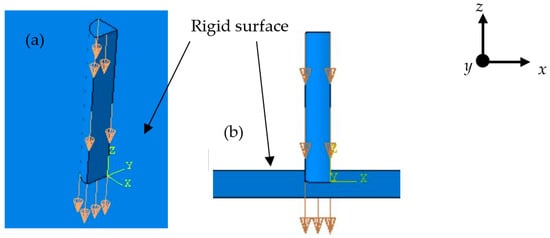
Figure 1.
A quarter-symmetrical model of the Taylor impact test in (a) isometric view and (b) front view. The arrows show the direction of prescribed velocity.
A hard contact with separation after contact was used as the normal interaction property between the rigid surface and the deformable symmetrical model of the cylinder. The tangential behaviour between the symmetrical model of the cylinder and the rigid surface was modelled as frictionless. An initial prescribed velocity was assigned to the deformable quarter cylindrical model in the negative z-direction as shown in Figure 1. The prescribed impact velocities used for this study were 130 m/s, 200 m/s, and 250 m/s. The Taylor impact test specimens were modelled as elastic-plastic. The elastic properties of the Ti6Al4V (ELI) model were assigned as: elastic modulus, 113 GPa and Poisson’s ratio, 0.34 [20]. The plastic material model was defined by the microstructural-based constitutive model presented in Equation (1) that was developed and validated for LPBF Ti6Al4V (ELI) in [3]. The definitions of the parameters of this constitutive model are summarised in Table 1.

Table 1.
Definitions and values of the constant parameters of the analytical model obtained from the literature, and those calibrated, as well as those determined from the microstructure of Ti6Al4V (ELI) samples.
The model was further implemented as a VUHARD material subroutine in ABAQUS/EXPLICIT, and the results were presented in the authors’ work published in reference [12]. The coding for VUHARD generated in FOTRAN 90 and saved as a .for file can be found as a supplementary file in [12]. An in-built explicit central difference time integration rule was used for time integration of the equivalent strain and plastic strain rate and updating equivalent von Mises stress at the gauss point [26,27]. The increments and computation time for each simulation with 3632 elements were recorded as 1920 and 4065 s, respectively. Modelling and simulation of the Taylor impact test were carried out for the LPBF Ti6Al4V (ELI) alloy with known microstructural internal state variables.
Various forms of the Ti6Al4V (ELI) alloy were obtained via a heat treatment strategy to vary the microstructure of the alloy. Details of the heat treatment strategy and a comprehensive discussion of the resulting microstructure can be found in the authors’ work published in reference [28,29]. For ease of reference, the secondary electron image (SEI) and crystallographic texture of the three microstructures obtained after heat treatment are presented in Figure 2. The measured model parameters and those calibrated based on these microstructures of the alloy, as presented in Table 1, are summarised in Table 2.
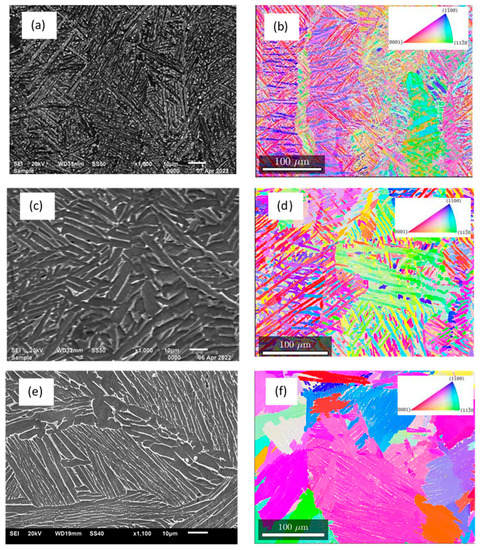
Figure 2.
The secondary electron images and crystallographic texture of heat-treated microstructures of LPBF Ti6Al4V (ELI) (a) and (b) at 800 °C/2 h (samples C), (c) and (d) 950 °C/2 h followed by 750 °C/2 h (Samples D), and (e) and (f) 1020 °C/2 h (Samples E), respectively.

Table 2.
Measured and calibrated model parameters for different forms of LPBF Ti6Al4V (ELI) alloy.
A mesh convergence study for the proposed VUHARD model to obtain the optimum mesh size for accurate simulation of the dynamic properties of LPBF Ti6Al4V (ELI) was previously conducted and reported in Muiruri et al. [2]. Further extensive mesh convergence analyses of implemented VUHARD subroutines were carried out by Muiruri et al. [12]. The results from these two publications found values of equivalent plastic strain and von Mises stress to converge for meshes equal to or less than 0.5 mm. From the foregoing discussion, therefore, continuum elements C3D8R having meshes with a global size of 0.5 mm were used in this study. The 0.25 mm mesh size yielded a total of 3632 elements for the quarter-symmetrical cylindrical model.
3. Results and Discussion
3.1. Strain Rate-Time Graph
Figure 3 shows the strain rate–time curves generated from the Taylor impact test numerical simulations conducted at the prescribed velocities of 130 m/s, 200 m/s, and 250 m/s. The range of impact velocity from 130 m/s to 250 m/s was selected to ensure sufficient noticeable plastic deformation of the numerical model.
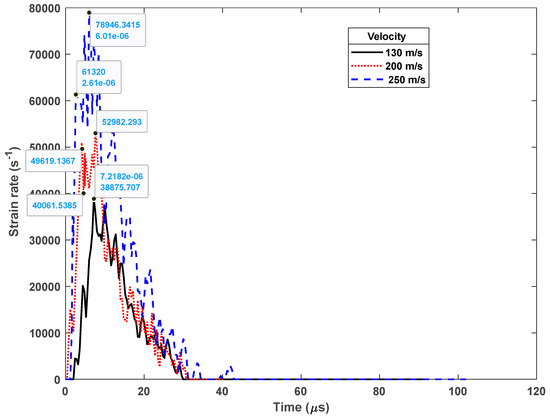
Figure 3.
The strain rate–time graph for the Taylor impact numerical simulations conducted at various imposed velocities.
It is clear from this figure that there was a sharp increase in strain rate in all three cases. Furthermore, the rate of increase in strain rate was higher for higher simulation velocities and vice vasa. At a prescribed velocity of 250 m/s, the strain rate initially peaked at a time of about 2.6 µs before going through a series of rises and drops and subsequently attaining a maximum value of strain rate at 6.01 µs. The range of strain rates attained at these times were 61,320 s−1 and 78,946 s−1, respectively. The time for the initial peak strain rate at a simulation velocity of 200 m/s was at about 4.11 µm before dropping and rising again and reaching a maximum at 7.61 µm. The strain rate within this range of times was between 40,061 s−1 and 52,982 s−1, as seen in Figure 3. At the lower simulation velocity of 130 m/s, the initial peak strain rate was approximately 38,875 s−1, followed by a series of rises and drops. The time for the initial peak strain rate at this simulation velocity was approximately 7.21 µm. In all cases, the strain rate eventually decreased to zero, as seen in Figure 3. This difference in times for the initial peak strain rates in each case was ascribed to the difference in times taken for the impact wave, generated by impact of the cylinder onto the rigid surface, to travel through the cylinder. It is clear from these times that the impact wave was faster at high impact velocities and vice versa.
3.2. Numerical Model at Different Prescribed Velocities
Figure 4 shows the typical results obtained from the numerical simulation of the Taylor impact test for the LPBF Ti6Al4V (ELI) alloy at three imposed velocities. From Figure 4a, it can be seen that the lower velocity of 130 m/s produced a plastic strain of about 0.467 and the deformation of the model is characteristic of the Taylor impact test results, where the impacted end of the model deforms plastically while the free end is undeformed. Lateral bulging of the model at this velocity increased from the impacted to the free end.
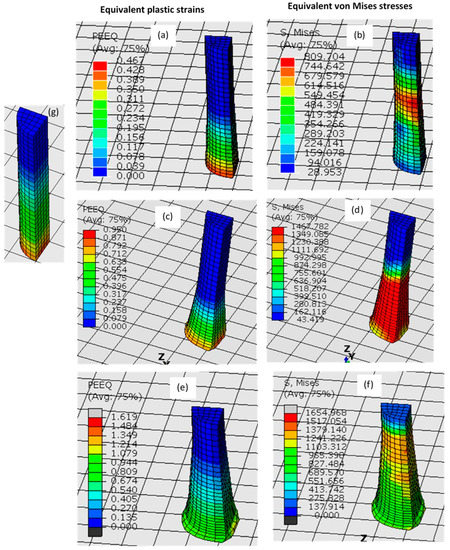
Figure 4.
Typical distribution of equivalent von Mises stresses and strains obtained after numerical simulation of LPBF Ti6Al4V (ELI) specimens at impact velocities of (a,b) 130 m/s, (c,d) 200 m/s, and (e,f) 250 m/s. Image (g) shows the status of the model at the beginning of simulation prior to impact.
Remarkable deformations near the impact region were observed with an increase in prescribed velocity. Figure 4c,e clearly show that the higher velocities of 200 m/s and 250 m/s resulted in greater inelastic deformation (plastic strain > 0.9) which was concentrated near the impacted end and decreased in magnitude away from it. It is evident that, at these higher velocities, the impacted surface of the projectile deforms into a mushroom shape, which can be ascribed to large plastic flow in the highly strained regions.
Figure 4g depicts an undeformed model of a Taylor test specimen with a length of 15 mm and a uniform cross section diameter of 5 mm (the radius of a quarter rod being 0.25). A comparison between the undeformed and deformed Taylor impact models shows that the cylindrical rod shortens as material flows out radially due to plastic flow. The diameter at the impact end increased during the simulation due to the induced tensile hoop stress caused by the compressive plastic wave. The parameters of the final shape of the deformed model are illustrated in the schematic diagram shown in Figure 5.
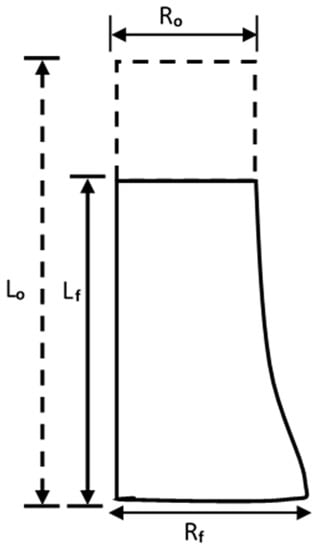
Figure 5.
Schematic illustrations of the parameters of the deformed Taylor impact test model.
The radial ratio, expressed as Rf/Ro, and the length ratio, expressed as Lf/Lo, for the simulation of LPBF Ti6Al4V (ELI) were extracted from the simulation results in Figure 5 and are presented in Table 3.

Table 3.
Comparison of deformed model parameter ratio for samples C, D, and E.
From this table, it can be seen that the Rf/Ro ratio increased as the velocity imposed on the model increased. Conversely, the Lf/Lo ratio decreased as the imposed velocity increased. It can be inferred from a study of the values in this table that the deformation configuration that characterised the numerical Taylor impact tests was the same as observed in other studies [19,20]. The foregoing discussion suggests that the typical features of the Taylor impact model were numerically predicted using the VUHARD subroutine.
3.3. Equivalent Stress—Equivalent Plastic Strain Behaviour
The values of equivalent von Mises stress and plastic strain obtained from numerical simulations were compared with the analytical solutions based on the strain rates which were obtained and presented in Figure 3. It is important to note that, as the strain rates presented in Figure 3 were not constant during plastic flow, the ranges of plastic strain rates discussed in Section 3.1 were selected for use in this section. The ranges selected from Figure 3 are shown in Table 4.

Table 4.
Imposed velocities and ranges of obtained strain rates.
The curves of the equivalent von Mises stresses and plastic strains obtained from numerical simulations and those obtained from analytical solutions, based on the range of strain rates obtained and presented in Table 4, are shown in Figure 6, Figure 7 and Figure 8.
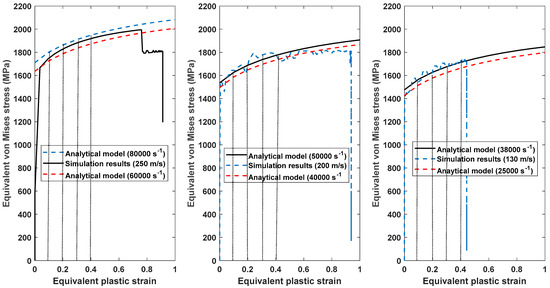
Figure 6.
Comparison of the equivalent von Mises stress and plastic strain curves for samples C obtained by numerical modelling at three imposed velocities, with those obtained from analytical solutions within the range of strain rates obtained in preceding section, under each simulation velocity.
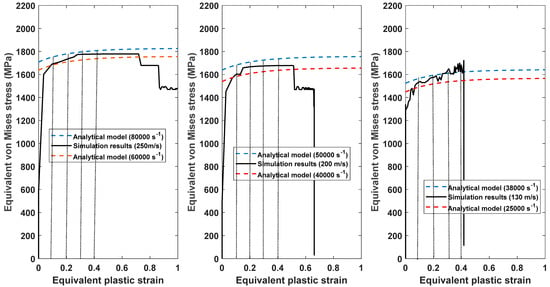
Figure 7.
Comparison of the equivalent von Mises stress and plastic strain curves for samples D obtained by numerical modelling at three imposed velocities, with those obtained from analytical solutions within the range of strain rates obtained in preceding section, under each simulation velocity.
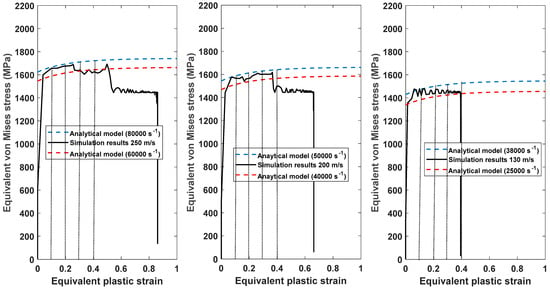
Figure 8.
Comparison of the equivalent von Mises stress and plastic strain curves for samples E obtained by numerical modelling at three imposed velocities, with those obtained from analytical solutions within the range of strain rates obtained in preceding section, under each simulation velocity.
To evaluate the capability of the numerical model to generate results equal to those obtained from analytical solutions, the instantaneous and average absolute errors at values of plastic strain up to a value of 0.4 were determined using the following expressions:
where the symbol N denotes the total number of data points employed in the analysis, and denote the analytical and numerical values of flow stress, respectively, while and represent the obtained values of instantaneous and average absolute errors. The results obtained using these two equations are summarised in Table 5.

Table 5.
Instantaneous and average absolute errors of the numerical solutions based on the analytical results at different imposed velocities for the three different forms of LPBF Ti6Al4V (ELI).
It is evident from the data presented in this table that the instantaneous and average absolute errors between the numerical values and analytical values of the model are generally less than 5%, which is an acceptable range. This is a good indication that the VUHARD subroutine used in this study is reasonably good for use in numerical simulation of the Taylor impact test to predict large plastic deformation of LPBF Ti6Al4V (ELI) under a very high strain rate.
4. Conclusions
A numerical simulation of the Taylor impact test at different high imposed impact velocities, using the VUHARD material’s subroutine for LPBF Ti6Al4V (ELI), was presented in this study. The following deductions arise from this work:
- The initial peak strain rates for the Taylor impact model were lower at higher imposed velocities and vice versa.
- Remarkable deformation near the impact region was observed, whose magnitude increased with an increase in prescribed velocity.
- The Rf/Ro ratio increased as the velocity imposed on the model increased and, conversely, the Lf/Lo ratio decreased as the imposed velocity increased.
- The instantaneous and average absolute errors between the numerical values and analytical values of the two models were generally less than 6%, indicating that the VUHARD subroutine is adequate for numerical simulation of the Taylor impact test of LPBF Ti6Al4V (ELI) alloy.
Future research should aim to test the utility of the VUHARD subroutine used in this study in the numerical simulation of the Taylor impact test of various metals and their alloys with a wider range of internal state variables. The accuracy of the numerical model should also be compared with sets of experimental data.
Author Contributions
Conceptualization, A.M., M.M. and W.d.P.; methodology, A.M.; validation, A.M.; formal analysis, A.M.; writing—original draft preparation, A.M.; writing—review and editing, A.M., M.M. and W.d.P.; supervision, M.M. and W.d.P.; funding acquisition, W.d.P. All authors have read and agreed to the published version of the manuscript.
Funding
This research was funded by the South African Department of Science and Innovation (DSI) through the Council for Scientific and Industrial Research (CSIR) for the Collaborative Program in Additive Manufacturing, Contract No.: CSIR -NLC-CPAM-21-MOA-CUT-01.
Institutional Review Board Statement
Not applicable.
Informed Consent Statement
Not applicable.
Data Availability Statement
The datasets presented in this study are available on request from the corresponding author and are not publicly available as they form part of an ongoing research.
Acknowledgments
The authors acknowledge Finite Element Analysis Services (PTY) Ltd. (FEAS) where the ABAQUS research license was procured. The authors also acknowledge and thank Greg Mitchell and Hellmut Bowles of FEAS for their constant support and technical assistance in writing subroutines.
Conflicts of Interest
The authors declare no conflict of interest.
References
- Seifi, M.; Salem, A.; Beuth, J.; Lewandowski, J. Overview of Materials Qualification Needs for Metal Additive Manufacturing. JOM 2016, 68, 747–764. [Google Scholar] [CrossRef]
- Muiruri, A.; Maringa, M.; du Preez, W. Numerical Simulation of High Strain Rate and Temperature Properties of Laser Powder Bed Fusion Ti6Al4V (ELI) Determined Using a Split Hopkinson Pressure Bar. Materials 2022, 15, 1872. [Google Scholar] [CrossRef] [PubMed]
- Muiruri, A.; Maringa, M.; du Preez, W. Validation of a Microstructure-Based Model for Predicting the High Strain Rate Flow Properties of Various Forms of Additively Manufactured Ti6Al4V (ELI) Alloy. Metals 2021, 11, 1628. [Google Scholar] [CrossRef]
- Nasiri, S.; Khosravani, M. Applications of data-driven approaches in prediction of fatigue and fracture. Mater. Today Commun. 2022, 33, 104437. [Google Scholar] [CrossRef]
- Yang, W.; Zhang, D.; Lei, G. Experimental study on multiphase flow in fracture –vug medium using 3D printing technology and visualization techniques. J. Pet. Sci. Eng. 2020, 193, 107394. [Google Scholar] [CrossRef]
- Shunyu, L.; Yung, S. Additive manufacturing of Ti6Al4V alloy: A review. Mater. Des. 2019, 164, 107552. [Google Scholar] [CrossRef]
- Veiga, C.; Davim, J.P.; Loureiro, A.J. Review on machinability of titanium alloys: The process perspective. Rev. Adv. Mater. Sci. 2013, 34, 148–164. [Google Scholar]
- Saha, R.; Jacob, K. Casting of Titanium and its Alloys. Def. Sci. J. 2014, 36, 121–141. [Google Scholar] [CrossRef]
- Gaytan, S.M.; Murr, L.E.; Medina, F.; Martinez, E.; Lopez, M.I.; Wicker, R.B. Advanced metal powder-based manufacturing of complex components by electron beam melting. Mater. Technol. 2009, 24, 180–190. [Google Scholar] [CrossRef]
- Frazier, W. Metal additive manufacturing: A review. J. Mater. Eng. Perform. 2014, 23, 1917–1928. [Google Scholar] [CrossRef]
- Lewandowski, J.J.; Seifi, M. Metal additive manufacturing: A review of mechanical properties. Annu. Rev. Mater. Res. 2016, 46, 151–186. [Google Scholar] [CrossRef]
- Muiruri, A.; Maringa, M.; du Preez, W. Development of VUMAT and VUHARD Subroutines for Simulating the Dynamic Mechanical Properties of Additively Manufactured Parts. Materials 2022, 15, 372. [Google Scholar] [CrossRef] [PubMed]
- Jones, S.E.; Drinkard, J.A.; Rule, W.K.; Wilson, L.L. An elementary theory for the Taylor impact test. Int. J. Impact Eng. 1998, 21, 1–13. [Google Scholar] [CrossRef]
- Hawkyard, J.B.; Eaton, D.; Johnson, W. The mean dynamic yield strength of copper and low carbon steel at elevated temperatures from measurements of the “mushrooming” of flat-ended projectiles. Int. J. Impact Eng. 1968, 10, 929–930. [Google Scholar] [CrossRef]
- BS EN ISO 6892-1; Metallic Materials. Tensile Testing. Methods of Test at Room Temperature. The British Standards Institution: London, UK, 2019. [CrossRef]
- ASTM E8/E8M-13a; Standard Test Methods Tension Testing of Metallic Materials. ASTM: West Conshohocken, PA, USA, 2013.
- Lee, S.; Huh, H. Shear stress hardening curves of AISI 4130 steel at ultra-high strain rates with Taylor impact tests. Int. J. Impact Eng. 2021, 149, 103789. [Google Scholar] [CrossRef]
- Brunig, M.; Larissa, D. Numerical simulation of Taylor impact tests. Int. J. Plast. 2007, 23, 1979–2003. [Google Scholar] [CrossRef]
- Rakvag, K.; Børvik, T.; Hopperstad, O.S. A numerical study on the deformation and fracture modes of steel projectiles during Taylor bar impacts tests. Int. J. Solids Struct. 2014, 51, 808–821. [Google Scholar] [CrossRef]
- AZO Materials. Grade 23 Ti6Al4V (ELI) Alloy (UNS R56401). Available online: https://www.azom.com/article.aspx?ArticleID=9365 (accessed on 12 June 2020).
- Picu, P.C.; Majorell, A. Mechanical behaviour of Ti6Al4V at high and moderate temperatures–Part II: Constitutive modelling. Mater. Sci. Eng. A 2002, 326, 306–316. [Google Scholar] [CrossRef]
- Hull, D.; Bacon, D.J. Introduction to Dislocations, 5th ed.; Elsevier: Oxford, UK, 2011; pp. 205–217. [Google Scholar]
- Cáceres, C.H.; Lukac, P. Strain hardening behaviour and the Taylor factor of pure magnesium. Philos. Mag. 2008, 88, 977–989. [Google Scholar] [CrossRef]
- Galindo, M.A.; Mumtaz, K.; Rivera, P.E.; Galindo-Nava, E.I.; Ghadbeigi, H. A microstructure sensitive model for deformation of Ti6Al4V describing cast-and-wrought and additive manufacturing morphologies. Mater. Des. 2018, 160, 350–362. [Google Scholar] [CrossRef]
- Kohn, D.H.; Ducheyne, P. Tensile and fatigue strength of hydrogen-treated Ti6Al4V alloy. J. Mater. Sci. 1991, 26, 328–334. [Google Scholar] [CrossRef]
- Ming, L.; Pantalé, O. An efficient and robust VUMAT implementation of elastoplastic constitutive laws in ABAQUS/explicit finite element code. Mech. Ind. 2018, 19, 308. [Google Scholar] [CrossRef]
- ABAQUS Documentation Version 6.6. Available online: https://classes.engineering.wustl.edu/2009/spring/mase5513/abaqus/docs/v6.6/books/usb/default.htm?startat=pt03ch06s03at07.html#usb-anl-aexpdynamic (accessed on 12 November 2020).
- Muiruri, A.; Maringa, M.; du Preez, W. Evaluation of Dislocation Densities in Various Microstructures of Additively Manufactured Ti6Al4V (Eli) by the Method of X-ray Diffraction. Materials 2020, 13, 5355. [Google Scholar] [CrossRef] [PubMed]
- Muiruri, A.; Maringa, M.; du Preez, W. Crystallographic Texture Analysis of As-Built and Heat-Treated Ti6Al4V (ELI) Produced by Direct Metal Laser Sintering. Crystals 2020, 10, 699. [Google Scholar] [CrossRef]
Disclaimer/Publisher’s Note: The statements, opinions and data contained in all publications are solely those of the individual author(s) and contributor(s) and not of MDPI and/or the editor(s). MDPI and/or the editor(s) disclaim responsibility for any injury to people or property resulting from any ideas, methods, instructions or products referred to in the content. |
© 2023 by the authors. Licensee MDPI, Basel, Switzerland. This article is an open access article distributed under the terms and conditions of the Creative Commons Attribution (CC BY) license (https://creativecommons.org/licenses/by/4.0/).