Abstract
Multiparametric indices offer a more comprehensive approach to voice quality assessment by taking into account multiple acoustic parameters. Artificial intelligence technology can be utilized in healthcare to evaluate data and optimize decision-making processes. Mobile devices provide new opportunities for remote speech monitoring, allowing the use of basic mobile devices as screening tools for the early identification and treatment of voice disorders. However, it is necessary to demonstrate equivalence between mobile device signals and gold standard microphone preamplifiers. Despite the increased use and availability of technology, there is still a lack of understanding of the impact of physiological, speech/language, and cultural factors on voice assessment. Challenges to research include accounting for organic speech-related covariables, such as differences in conversing voice sound pressure level (SPL) and fundamental frequency (f0), recognizing the link between sensory and experimental acoustic outcomes, and obtaining a large dataset to understand regular variation between and within voice-disordered individuals. Our study investigated the use of cellphones to estimate the Acoustic Voice Quality Index (AVQI) in a typical clinical setting using a Pareto-optimized approach in the signal processing path. We found that there was a strong correlation between AVQI results obtained from different smartphones and a studio microphone, with no significant differences in mean AVQI scores between different smartphones. The diagnostic accuracy of different smartphones was comparable to that of a professional microphone, with optimal AVQI cut-off values that can effectively distinguish between normal and pathological voice for each smartphone used in the study. All devices met the proposed 0.8 AUC threshold and demonstrated an acceptable Youden index value.
1. Introduction
A series of voice analysis tools includes many components to evaluate speech functions and voice quality [1,2]. The quantitative evaluation of voice quality using acoustics is advocated [3], and two metrics in this sector are the Acoustic Voice Quality Index (AVQI) and the Acoustic Breathiness Index (ABI) [4]. In the assessment of prolonged phonation and continual speech, multiparametric indexes enable a more robust acoustic analysis of voice quality by taking into account more than one acoustic parameter. However, if continuous speech is included, linguistic discrepancies must be handled [5]. The goal of Grillo’s research [6] was to evaluate the acoustic metrics of fundamental frequency, standard deviation, jitter, shimmer, noise-to-harmonic ratio, smoothed cepstral peak prominence (CPPS), and AVQI evaluated invariably by VoiceEvalU8 or manually by two researchers. They discovered that the measurements were of good to exceptional reliability. Furthermore, the human voice is dynamic and evolves over time. The influences of age and sex on acoustic measurements of voice quality are well-known, yet AVQI remains independent of gender [7]. Compared to adults, the AVQI achieved by the pediatric and older adult groups was shown to be substantially higher. AVQI also exhibited significant age effects. Adults’ AVQI levels were shown to be more constant than those of children and the elderly. The AVQI scores of elderly adults and children did not differ substantially [8]. Leyns’ study examined and contrasted the acoustic short-term effects of pitch elevation training (PET) In transgender women, also focusing on articulation-resonance training (ART), and a combination of both programs. Xirs discovered that fundamental frequencies rose after both PET and ART programs, with a greater increase after PET, but that intensity and voice quality measures did not become altered [9].
Artificial intelligence (AI) approaches can be used to analyze data, reduce computing time, and optimize decision-making processes and forecasts in a variety of industries, including healthcare [10]. Advances in mobile device technology provide new possibilities for remote speech monitoring at home and in clinical settings. A simple mobile device is transformed into a screening tool for the early detection, monitoring, and treatment of voice abnormalities. There is, nevertheless, a necessity to demonstrate equivalence between characteristics generated from mobile device signals and gold-standard microphone preamplifiers. Acoustic speech qualities from Android phone, tablets, and microphone preamplifier records were compared in the study of [11]. Compared to conventional PC-based voice treatment, smartphone voice therapy is less expensive and more flexible for patients and doctors. According to [12], voice quality and patient satisfaction increased in both therapies compared to before therapy, showing recovery. Others discovered that AVQI measures obtained from smartphone microphone voice recordings with experimentally added ambient noise disclosed an amicable settlement with the results of oral microphone recordings, implying that smartphone microphone recordings conducted, even with the existence of acceptable ambient noise, are suitable for estimating AVQI [13]. Pommes wanted to see how standardized mobile phone recordings transferred across a telecom channel affected acoustic indicators of speech quality and how voice specialists perceived it in normophonic speakers [14]. The results reveal that sending a speech signal across a telephone line causes filtering and noise effects, limiting the use of popular acoustic sound quality metrics and indexes. The recording type has a considerable influence on both the AVQI and the ABI. Pitch perturbation (local jitter and periodic standard deviation) and the harmonics-to-noise ratio from Dejonckere and Lebacq appear to be the most reliable acoustic metrics. The study on the end-user mobile app “VoiceScreen” also demonstrated an accurate and robust method for measuring voice quality and the potential to be used in clinical settings as a sensitive assessment of voice alterations throughout the results of phonosurgical treatment [15].
Despite the greater use and availability of technology expertise and equipment, the current study has revealed a lack of awareness of physiological, speech/language and culturally influenced aspects. The primary obstacles to this investigation are the following:
- 1.
- Standardization and disclosure of acoustic analysis methods;
- 2.
- Recognition of the link between sensory and experimental acoustic outcomes;
- 3.
- The obligation to account for organic speech-related covariables, such as distinctions in conversing voice sound pressure level (SPL) and fundamental frequency f0;
- 4.
- The requirement for a significant larger dataset to comprehend regular variance between and within voice-disordered individual people.
The results of the studies mentioned above enabled us to presume the feasibility of voice recordings captured with different smartphones in an ordinary clinical setting for the estimation of AVQI. Consequently, the current research was designed to answer the following questions regarding the possibility of a smartphone-based “VoiceScreen” app for AVQI estimation:
- 1.
- Are the different estimated average AVQI values for smartphones consistent and comparable?
- 2.
- Is the diagnostic accuracy of the estimated AVQIs for different smartphones relevant to differentiate normal and pathological voices?
We hypothesize that the use of different smartphones for voice recordings and the estimation of AVQI in an ordinary clinical environment will be feasible for the quantitative assessment of voice.
Therefore, the present study aimed to develop the universal platform-based application suitable for different smartphones for the estimation of AVQI and evaluate its reliability in the measurements of AVQI and the normal/pathological differentiation of voices.
2. State of the Art Review
2.1. Use of Voice Quality Index Instruments in the Medical Domain
Naturally, the medical domain is the primary field in which impairment and acoustic measures can be used to accurately assess overall voice quality in numerous medical pathologies [16] and therapies [17].To reduce the danger of voice problems in those who rely heavily on their voices, such as teachers, vocal screening is essential from the start of their professional studies. A dependable and precise screening instrument is required. AVQI has been shown to distinguish between normal and disordered voices and to be a therapy outcome measure. The purpose of the study of [18] was to see whether the AVQI could be used as a screening tool in conjunction with auditory and self-perception of the voice to differentiate between normal and somewhat inferior voices. Enhelt et al. [19] sought to assess the accuracy of AVQI and its isolated acoustic measurements to distinguish voices with varying degrees of deviation in severity of disorder. The results showed that the AVQI is a reliable instrument for distinguishing between different degrees of vocal deviation, and that it is more accurate for voices with moderate and severe abnormalities. When identifying voices with a higher degree of variation, isolated acoustic measurements perform better. Their other investigation [20] discovered that AVQI had the highest accuracy at a length tailored. To improve the reliability of voice analysis, a systematic approach should be followed, along with a specific speech material control that allows comparability between clinics and voice centers. A combination of acoustic measures with the same weight is more accurate in distinguishing different degrees of departure but is inconsistent. In clinical voice practice, outcome measures measuring acoustic voice quality and self-perceived vocal impairment are often utilized. Earlier studies on the link between acoustic and self-perceived measures have indicated relatively minor correlations, but it is unclear whether acoustic measurements connected with voice quality and self-perceived voice handicap become altered in a comparable way throughout voice therapy. As a result, the [21] study looked at the association between the degree of change in AVQI and the Voice Handicap Index (VHI). Voice treatment provided in a community voice clinic to individuals with various diseases was also shown to be successful, as evaluated by improvements in VHI and AVQI [22].
During the COVID-19 pandemic, the use of nose-and-mouth cover respiratory protection masks (RPMs) has become widespread. The effects of wearing RPMs, particularly on the perception and production of spoken communication, are increasingly emerging and their impact on medical voice analysis devices is significant [23]. The effects of face masks on spectral speech acoustics were evaluated in the Keas investigation [24]. Speech intensity, spectral moments, spectral tilt, and energy in mid-range frequencies were among the outcome metrics examined at the utterance level. Although the impact magnitude varied, masks were associated with changes in spectral density characteristics consistent with a low-pass filtering effect. The center of gravity, spectral diversity (in habitual speech), and spectral tilt had greater impacts (in all speech styles). KN95 masks outperformed the surgical masks in terms of speech acoustics. The general pattern of acoustic speech alterations was consistent between the three speaking styles. Compared to habitual speech, loud speech followed by clear speech was successful in removing the filtering effects of masks. In a similar study, Lehnert discovered that wearing COVID-19 protective masks did not significantly degrade the findings of AVQI or ABI based on a selected sample of healthy or minimally impaired voices [25].
According to Parkinson voice research [26], AVQI incorporates acoustics from both vowel and sentence settings and therefore may be preferred to CPPS (vowel) or CPPS (sentence). AVQI has been shown to be a reliable multiparametric measure for assessing the severity of dysphonia, which is often a rare, persistent, and long-term neurological voice problem caused by excessive or incorrect contraction of the laryngeal muscles. Alternatively, the Ulosian technique [27] sought to identify irregularities in the voice affected by PD and build an automated screening tool capable of distinguishing between the voices of patients with PD and healthy volunteers while also generating a voice quality score. The classification accuracy was tested using two speech corpora (the Italian PVS and our own Lithuanian PD voice dataset), and the results were confirmed to be medically adequate. Gale explored the impact of intensive speech therapy that targets the voice or focuses on articulation on the quality of the voice as judged by the AVQI in people with Parkinson’s disease [28]. The results show that voice-focused therapy results in significant gains in voice quality in this population.
The growing number of validity studies that evaluate the validity of the AVQI requires a complete synthesis of existing results [29]. AVQI is a contemporary multivariate acoustic measure of dysphonia that assesses overall voice quality. In [30], a comparison of the two groups revealed a considerable difference between them. Consequently, AVQI serves as an excellent diagnostic method for obtaining scores from the dysphonic population and should be investigated in other voice issues. According to Portalete’s results [31], while the characteristics detected in the evaluations were similar to those expected from individuals with dysarthria, it is difficult to establish a differential diagnosis of this disorder based solely on auditory and physiological criteria. Similarly, the team of Barsties et al. [32] analyzed two acoustic properties, the cepstral spectral index of dysphonia (CSID) and AVQI, which have gained popularity as valid and reliable multiparametric indicators in the objective evaluation of hoarseness due to their inclusion of continuous speech and sustained vowels. Another multiparametric assessment, ABI, analyzes and detects breathiness mixing during phonation without being unaffected by other features of dysphonia, such as roughness. They discovered that CSID, AVQI, and ABI objectively increase the identification of voice quality problems. Their use is straightforward and their usefulness for physicians is high, in contrast to their demonstrated validity. The authors also reached the same conclusion in a similar study on synthetic voice [33].
The purpose of Gomez’s [34] study was to assess the voice in patients with thyroid pathology using two objective indicators with high diagnostic precision. AVQI was used to assess general vocal quality, and ABI was used to assess breathiness, both of which were found to be relevant. Other researchers wanted to use cutting-edge deep learning research to objectively categorize, extract, and assess substitute voicing following laryngeal oncosurgery from audio signals [35]. Their technique had the highest true-positive rate of all of the cutting-edge approaches examined, reaching an acceptable overall accuracy and demonstrating the practical usage of voice quality devices. In a similar study, ASVI was found to be a quick and efficient option after laryngeal oncosurgery [36]. Individuals who have had maxillectomies may have changes in the stomatognathic functions involved in oral communication. Rehabilitative care should prioritize the restoration of these functions by surgical flaps, obturator prosthesis, or both. Improvements in intelligibility and resonance were found in the absence of trans-surgical palatine obturators (TPO) in the vocal evaluation performed by [37], and minor hypernasality was discovered in only one instance in the presence of TPO. In a similar study [38], Sluis found no statistical significance in the VHI-10 scores over time compared to AVQI.
AVQI and comparable instruments were also used in other related areas. For example, the AVQI was also used to determine the effectiveness of the NHS waterpipe as a superficial hydration therapy in healthy young women’s voice production. The technique was determined to be useful by the authors, and the perceived phonatory effort decreased significantly at the last assessment point [39]. The authors of [40] attempted to assess the influence of type 1 diabetes mellitus on the voice in pediatric patients using voice quality analysis. The study findings revealed that the AVQI value was higher in the patient group, although not statistically significant. Acoustic measures, such as AVQI and the maximum phonation time (MPT), were used in the study [41] to predict the degree of lung involvement in COVID-19 patients. Each participant created a phonetically balanced sentence with a sustained vowel. In terms of AVQI and MPT, the results demonstrated substantial disparities between COVID-19 patients and healthy persons. Huttenen’s study [42] sought to determine the efficacy of a 4-week breathing exercise intervention in patients with voice complaints. The total scores of AVQI and several of its subcomponents (shimmer and harmonic-to-noise ratio), as well as the GRBAS scale’s grade, roughness, and strain, showed dramatically enhanced voice quality. However, neither the kind nor frequency of vocal symptoms, nor the perceived phonatory effort, changed as a result of the intervention.
2.2. Measurement of the Effects of Vocal Fatigue and Related Impairments
Measurement of the effects of vocal fatigue and related impairments is another well-established approach. Vocal loading tasks (VLTs) allow researchers to collect acoustic data and study how a healthy speaker alters their voice in response to obstacles. Such instruments can provide detailed voice information and aid speech pathologists in determining whether the vocal activity of instructors at work should be regulated or not [43]. There is a paucity of research on the effect of the talking rate in VLT on acoustic voice characteristics and vocal fatigue [44]. Vocal effort is widespread and frequently leads to decreased respiratory and laryngeal efficiency. However, it is not known whether the respiratory kinematic and acoustic adaptations used during vocal exertion differ between speakers who express vocal fatigue and those who do not. Ref. [45] evaluated respiratory kinematics and acoustic measurements in people with low and high degrees of vocal fatigue while performing a vocal exertion task. Ref. [46] looked at clinically normal voices with no history of vocal problems and assessed weariness. The Vocal Fatigue Index (VFI) was used for the subjective study of vocal loading, while the acoustic and cepstral analysis of voice recordings was used in both circumstances for objective analysis. The results demonstrated that there was a substantial difference in VFI scores between the two circumstances. The acoustic and cepstral properties of the voice also differed significantly between the two circumstances, a result also confirmed in the study [47]. A similar study [48] was conducted with VFI and the Borg vocal effort scale. Before, during and after periods of speaking, they objectively examined fluctuations in relative sound pressure level, frequency response, pitch intensity, averaged cepstral peak amplitude, and AVQI.
AVQI was also used to evaluate the characteristics, vocal complaints, and habits of musicians and students of musical theater. Given the mismatch of high vocal requirements vs. poor vocal education, and hence greater risk for voice issues, choir singers’ voice usage remains understudied. With mean scores on the Dysphonia Severity Index and AVQI, choir members demonstrated exceptional voice quality and capabilities [49]. The mean grade score corresponded to a normal to somewhat aberrant voice quality in terms of auditory perception. Patient-reported outcome measures revealed significant deviation scores, indicating significant singing voice impairment. Choir singers appear to be particularly prone to stress, with a high incidence rate. After 15 min of choir singing, the severity index of dysphonia improved considerably compared to the control group, although the self-perceived presence of fatigue and voice complaints increased. In both groups, the fundamental frequency rose. Dheleeser et al. [50] conducted a study on musical theater actors who had comparably good objective voice measurements (DSI, AVQI). There has been an upsurge in the number of VTDs and complaints about the singing voice. The AVQI was used to identify people who were susceptible to stress, vocal misuse, VTD, and pain symptoms. The purpose of [51] was to see if the voices of actors and actresses could be cognitively identified as being more resonant after an intensive Lessac Kinesensic training workshop and to see if AVQI, ABI, and their acoustic measures could indicate classified voices as being more resonant. Unfortunately, statistical analysis that compared perceptual and auditory data for the final samples was not possible. Leyns conducted a similar study and discovered that professional actors had stronger vocal abilities than non-professionals [52]. The voice quality of the dancers is inferior to that of the actors. The findings reveal that one performance has little effect on vocal quality among theater performers and dancers. Nonetheless, the long-term consequences of performance are still being studied. Similar research, which used the AVQI to examine 40-minute vocal loading tests that comprised warm-up, hard singing, and loud reading, found that there were no significant differences in vocal characteristics between female and male conductors [53]. They discovered that the volume of the rehearsal room and the duration of the reverberation had no effect on the characteristics of the acquired voice after vocal loading.
2.3. Language Factors in Voice Quality Analysis
Voice quality metrics have been found to be useful and efficient in the analysis of a variety of very different spoken languages. The purpose of the [54] study was to confirm the impact of different cultural origins and languages (Brazil Portuguese and European Portuguese) on the perception of voice quality. Another goal was to evaluate the relationship between clinical auditory perception assessments and acoustic measures such as AVQI and ABI, as well as their influence on concurrent validity. They discovered that Brazilian raters evaluated voice quality as more deviant and that Brazilian voice samples were less severe (a possible language characteristic). More research is needed to determine whether there was a task or a sample consequence, as well as whether revisions to the AVQI and ABI formulations are needed for Brazilian Portuguese. A similar assessment was made for the Italian speaking population [55]. The auditory perceptual RBH scale (roughness, breathiness, and hoarseness) and acoustical analysis using AVQI validated dysphonia in a study of the Polish population using recorded voice [56]. Jakamarar [57] explored the verification of AVQI in the South Indian population and found it to be superior in terms of diagnostic precision and internal consistency. Kim et al. sought to validate the AVQI version 3.01 and ABI as acoustic analysis tools in Korean [58]. They discovered that AVQI and ABI had good concurrent validity in quantifying the severity of dysphonia with respect to OS and B in a sample of Korean speakers. A further investigation of the Korean population found that each measure had a strong discriminative ability to distinguish the presence or absence of voice difficulties [59]. The findings of this study might be used as an objective criterion to detect voice disorders. According to [60], the AVQI is a robust multiparametric measure that can reliably differentiate between subcategories of severity of perceptual dysphonia with good accuracy in Kannada. Moreover, AVQI has been shown to be useful in analyzing signals with greater degrees of aperiodicity, such as extreme hoarse voice quality [7]. The AVQI was lower (better) in samples with a high degree of strain for Finnish speakers, but the variation was not substantial [61]. Only CPPS distinguished between modest and large degrees of creak. With normophonic speakers, the AVQI does not appear to distinguish between low and high levels of creak and strain. Puzzella [62] investigated the validity (both concurrent and diagnostic) and the test–retest reliability of AVQI in a Turkish speaking community. The link between AVQI scores and auditory perception rating of total voice quality was statistically significant. The dysphonic voice was assigned a necessary threshold by AVQI. Intraclass correlation coefficient values using a two-way mixed effects model, single-measures type, and absolute agreement definition demonstrated high test–retest reliability for the AVQI in Turkish. Furthermore, the considerable values of concurrent validity and diagnostic accuracy of both versions of AVQI-Persian were verified, demonstrating that it can distinguish between normal and diseased voices in Persian speakers [63]. As a conclusion, it is clear that AVQI and similar metrics can be utilized for language-independent screening or diagnosis.
3. Materials and Methods
3.1. Materials
The study comprised 134 adult participants, with 58 men and 77 women, who were evaluated in the Department of Otolaryngology of the Lithuanian University of Health Sciences, Kaunas, Lithuania. The mean age of the participants was 42.9 (SD 15.26) years. The pathological voice subgroup, which included 86 patients (42 men and 44 women), had a mean age of 50.8 years (SD 14.3) and presented with a variety of laryngeal diseases and associated voice impairments, such as benign and malignant mass lesions of the vocal folds and unilateral paralysis of the vocal fold. Diagnosis was based on clinical examination, including patient complaints and history, voice assessment and video laryngostroboscopy (VLS) using an XION Endo-STROB DX device (XION GmbH, Berlin, Germany) 70° rigid endoscope and/or direct microlaryngoscopy. Five experienced physicians–laryngologists performed the auditory–perceptual evaluations of voice samples. For the purpose of this study, only the evaluation of dysphonia’s grade (G) was used from the GRBAS scale (grade, breathiness, roughness, asthenia, and strain). The voice samples were rated into four ordinal severity classes of G on the scale from 0 to 3 points, where 0 = normal voice, 1—mild, 2—moderate, and 3—severe dysphonia [64]. A severity distribution is displayed in Figure 1.
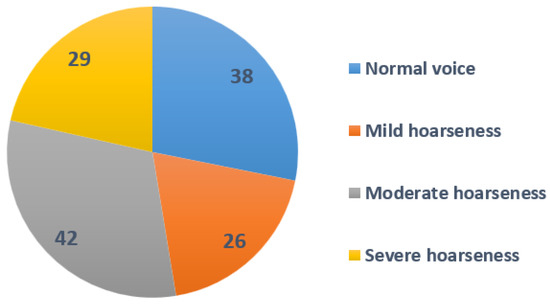
Figure 1.
Severity distribution of the patients involved.
The normal voice subgroup consisted of 49 healthy volunteers, 16 men and 33 women, with a mean age of 31.69 (SD 9.89) years. To qualify as vocally healthy, participants were required to have no actual voice complaints, no history of chronic laryngeal diseases or voice disorders, and to self-report their voice as normal. The voices of the participants were evaluated as normal by otolaryngologists specialized in the field of voice, as there were no pathological alterations in the larynx. Demographic data for the study group and diagnoses for the pathological voice subgroup are presented in Table 1.

Table 1.
Demographic data of the study group.
Voice samples representing five different smartphones were used, namely the iPhone 12 Pro, iPhone 13 Pro Max, Xiaomi Redmi Note 5, iPhone 12 Mini, and Samsung Galaxy S10+. The following processing conditions were applied: smartphones were placed approximately 30.0 cm away from the mouth, at a 90 angle to the mouth, and had internal microphones (bottom) (see Figure 2). The devices were selected from a range of commercial prices. The background noise level averaged 29.61 dB SPL and the signal-to-noise ratio (SNR) was approximately 38.11 dB compared to the voiced recordings, indicating that the environment was suitable for both voice recordings and the extraction of acoustic parameters. The AKG microphone was placed 10.0 cm from the mouth at a comfortable (approximately 90°) microphone-to-mouth angle.
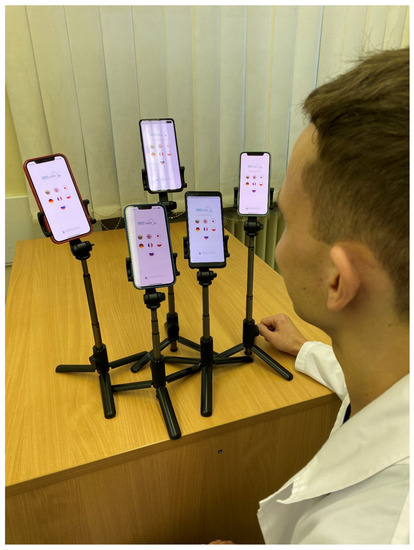
Figure 2.
The experimental setup of five different smartphone devices modeled in this study (iPhone SE, iPhone PRO MAX 13, Huawei P50 pro, Samsung S22 Ultra, and OnePlus 9 PRO).
A phonetically balanced Lithuanian sentence “Turėjo senelė žilą oželį” (“Old granny had a billy goat”) was the main utterance used to compare the recordings. The relative frequencies of the phonemes in the sentence are as close as possible to the distribution of speech sounds used in Lithuanian. The examples of spectral analysis results of voice samples are given in Figure 3.
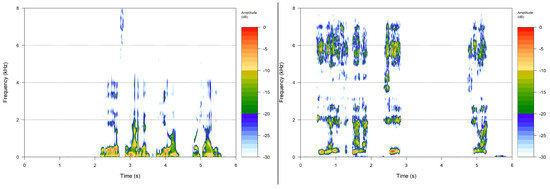
Figure 3.
Spectral analysis results of a normal voice (class 0) and voice with severe dysphonia.
3.2. Calculating Required Voice Characteristics
To conduct the clinical research, we built a universal-platform-based version of the “VoiceScreen” software for use with both iOS and Android operating systems, using our Pareto optimized technique. The AVQI and its characteristics are calculated on the server; hence, computationally expensive sound processing is not reliant on the computing capabilities of the user device and may run on any Android or iOS device with a manufacturer-supported version of each respective operating system. The provided smartphone (either iOS or Android) records sound waves obtained while pronouncing given sentences aloud in the first stage. Sound waves are preprocessed in real time. The goal is to remove pauses from the sound waves and to guarantee that only the minimum quantity of sound is available for further processing. Then, that preprocessed sound wave is sent to the server for further analysis. The server runs a Linux operating system and operates our proprietary software to calculate the required characteristics necessary to evaluate the voice. Finally, the AVQI index and related data are sent back to the phone and displayed to the user. Figure 4 shows the structure of the system, while Figure 5 illustrates the operation sequence.
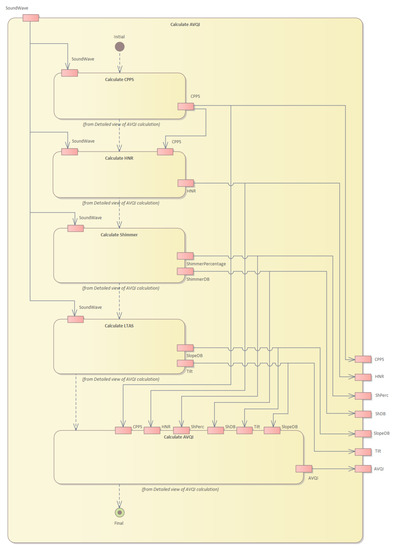
Figure 4.
Structure of the system and flow of the operations.
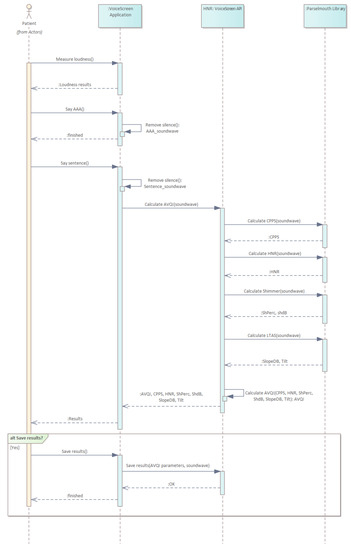
Figure 5.
Sequence diagram of operations performed in our approach.
The server-side system performs numerous operations. First, the cepstral peak prominence (CPPS) is calculated (see Figure 6).
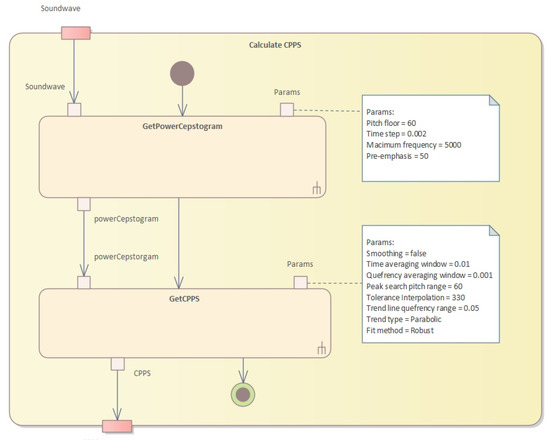
Figure 6.
Calculation of the CPPS.
Our approach outlines a series of algorithms used to assess impaired voice quality using acoustic measures. The first algorithm resamples and applies pre-emphasis to the sound, then calculates the power cepstrogram. The second algorithm calculates the harmonicity using the cross-correlation technique, while the third algorithm calculates the shimmer, which measures cycle-to-cycle variations in vocal amplitude. The fourth algorithm calculates the long-term average spectrum (LTAS) of the sound waveform. Finally, the AVQI values are calculated, using multiple acoustic measures of voice quality through Pareto optimization. This technique identifies the optimal trade-off between multiple conflicting objectives to find the best solution to improve overall vocal quality while minimizing breathiness, roughness, and strain.
In Algorithm 1, we first resample the sound to twice the value of the maximum frequency and apply pre-emphasis to the resampled sound. Then, for each analysis window, we apply a Gaussian window, calculate the spectrum, transform it into a PowerCepstrum and store the values in the corresponding vertical slice of the PowerCepstrogram matrix. The algorithm returns the resulting PowerCepstrogram. The PowerCepstrogram is a representation of the power spectrum of a signal in the cepstral domain. The algorithm takes as input a sound signal, a pitch floor, a time step, a maximum frequency, and a pre-emphasis coefficient. The output of the algorithm is the PowerCepstrogram.
| Algorithm 1 PowerCepstogram algorithm. |
| Require: Ensure: PowerCepstrogram
|
The second step is to perform pitch analysis and calculate harmonicity (see Figure 7 and Algorithm 2).
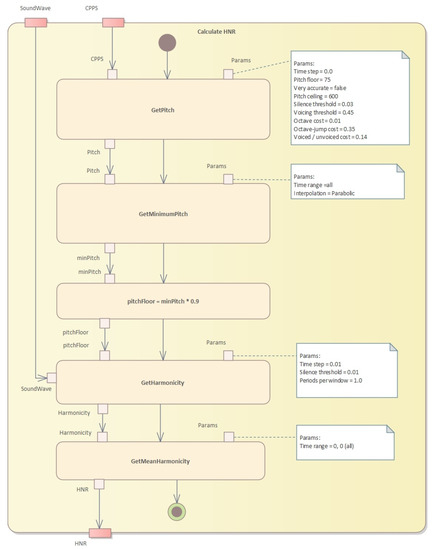
Figure 7.
Pitch analysis and harmonicity calculation.
Algorithm 2 shows an implementation of the pitch analysis method that uses the cross-correlation technique to determine the pitch of a sound signal. The input parameters are the sound signal, the time step, the pitch floor and ceiling, as well as various thresholds and costs that affect the pitch analysis. The algorithm returns a pitch object that contains the pitch measurements and other pitch-related information.
The formant calculation algorithm is presented in Algorithm 3. This algorithm is a partial implementation of a function called “getFormantMean” that calculates the average value of a specified formant for a given time range. The function takes four arguments: “formantNum” specifies which formant to calculate the mean for, “fromTime” and “toTime” specify the time range to consider, and “units” specifies the units of the time range.
Algorithm 4 presents an algorithm to calculate harmonicity using Praat’s harmonicity object. This algorithm takes a Praat sound object, a start and end time for the analysis, a time step, a silence threshold, and the number of periods per analysis window. It first creates a Praat harmonicity object from the input sound, with the given time step, silence threshold, and periods per window. It then selects the portion of the harmonicity object corresponding to the specified time range and returns the mean value of the selected portion. Aproach is explained in the Algorithm 4.
| Algorithm 2 Pitch analysis based on the cross-correlation method. |
|
| Algorithm 3 Formant calculation. |
|
| Algorithm 4 Harmonicity calculation. |
|
The third step is to calculate the shimmer (see Figure 8 and Algorithm 5).
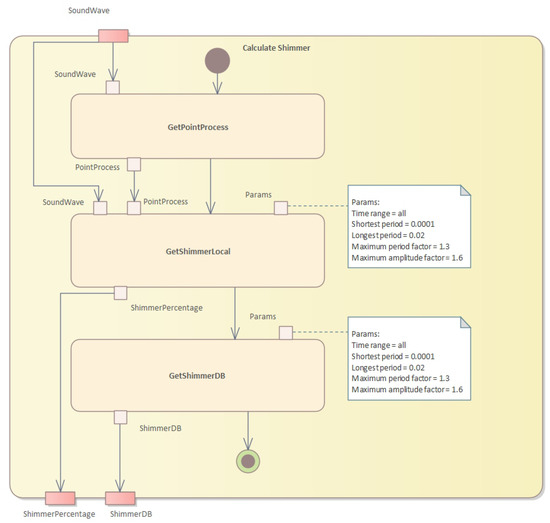
Figure 8.
Calculation of the shimmer values.
This algorithm calculates two measures of shimmer, which is a measure of cycle-to-cycle variations in vocal amplitude. The input is a sound waveform, a point process representing glottal closures, and the start and end times in seconds. The output is the shimmer local value and the shimmer dB value.
| Algorithm 5 Shimmer calculation. |
| Require: , the sound waveform Require: , the point process representing glottal closures Require: , the start time in seconds Require: , the end time in seconds Ensure: , the shimmer local value Ensure: , the shimmer dB value
|
In the fourth step, we need to calculate the long-term average spectrum (LTAS) (see Figure 9).
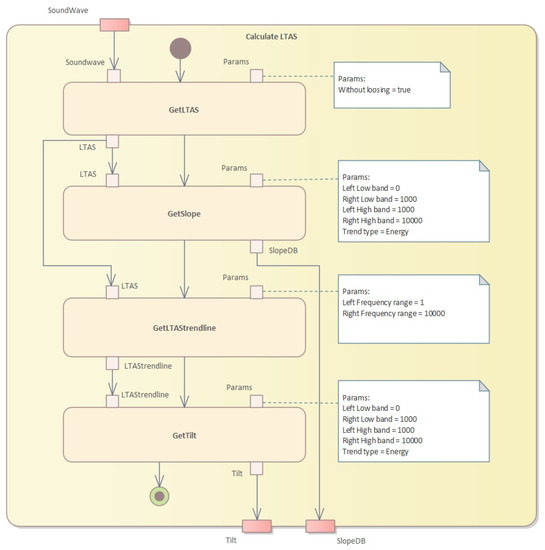
Figure 9.
Calculation of the LTAS values.
The algorithm to calculate the LTAS (long-term average spectrum) is presented in Algorithm 6. This algorithm calculates the LTAS of a given sound waveform and computes the slope and tilt parameters. The LTAS is a smoothed version of the spectrum of the sound waveform, calculated over a long period of time, typically several seconds.
| Algorithm 6 LTAS calculation. |
| Require: : the sound waveform Ensure: : the slope in dB and : the tilt parameter
|
Finally, we calculate the AVQI values (see Figure 10) given several acoustic measures of voice quality. The calculation algorithm is given in Algorithm 7. The Pareto optimization of AVQI scores is given in Algorithm 8.
| Algorithm 7 AVQI calculation. |
| Require: Ensure: AVQI
|
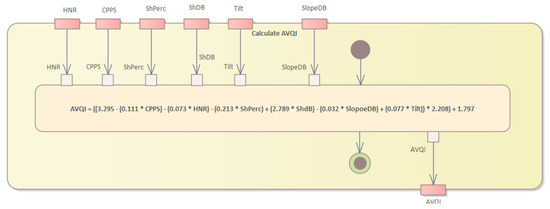
Figure 10.
Calculation of the AVQI values.
| Algorithm 8 Pareto optimization of AVQI scores. |
|
Pareto Optimized Assessment of Impaired Voice
Pareto optimization is a technique used to identify the optimal trade-off between multiple conflicting objectives.
Let X be the set of candidate solutions, where each solution is a vector of n characteristics of voice quality, such as overall voice quality, strain, and pitch. Let be a vector of m objective functions that measure the performance of x in each characteristic. The Pareto front is defined as the set of nondominated solutions, i.e., those solutions that cannot be improved in any objective without worsening at least one other objective. Formally, a solution dominates another solution if and only if , and and there exists at least one objective function such that . The Pareto front is the set of all non-dominated solutions, i.e., is not dominated by . The Pareto optimal solution is any solution that maximizes the trade-off between the objectives, i.e., , where ≤ denotes Pareto dominance.
In the context of the evaluation of impaired voice by AVQI recorded on the smartphone, Pareto optimization is used to find the best trade-off between different parameters that affect overall vocal quality, such as breathiness, roughness, strain, and pitch. The first step in Pareto optimization is to define the objectives or criteria that need to be optimized. In the case of the AVQI assessment, the objective could be to maximize overall vocal quality while minimizing breathiness, roughness, and strain. Pitch could be considered a separate objective, depending on the specific voice impairment being assessed. The next step is to generate a set of candidate solutions that represent different combinations of objectives. This is done by varying the weights or importance assigned to each objective in the AVQI algorithm. For example, increasing the weight of the overall vocal quality objective would result in a higher score for samples with better overall quality, while decreasing the weight of the breathiness objective would result in a lower score for samples with more breathiness. Once the candidate solutions are generated, Pareto optimization techniques are used to identify the optimal trade-off between the objectives as follows.
Step 1: Calculate the AVQI scores for each candidate solution based on the relevant parameters.
To calculate the AVQI score, we need to first define the relevant parameters that affect voice quality. These could include measures of pitch, loudness, jitter, shimmer, harmonics-to-noise ratio, and other relevant acoustic and perceptual measures. Once the parameters are defined, we can use a combination of objective and subjective methods to calculate the AVQI score. Objective methods use signal processing and machine learning techniques to analyze the acoustic properties of the voice signal and extract relevant features. These features are then combined using a mathematical model to calculate the AVQI score. Examples of objective methods include Praat software, which measures various voice parameters, and the glottal inverse filtering (GIF) method, which estimates the glottal source waveform from the speech signal. Subjective methods use human listeners to rate the quality of the voice based on perceptual criteria, such as clarity, naturalness, and overall acceptability. These ratings are then combined using statistical methods to calculate the AVQI score. Examples of subjective methods include the consensus auditory–perceptual evaluation of voice (CAPE-V), which uses a standardized rating scale to evaluate various aspects of voice quality.
Step 2: Plot the candidate solutions on a Pareto front to visualize the trade-off between the objectives.
To plot the candidate solutions on a Pareto front, we first need to define the objective functions that we want to optimize. For example, we may want to maximize the clarity of the voice while minimizing the jitter and shimmer. We can then calculate the objective values for each candidate solution and plot them on a 2D or 3D graph, where each axis represents an objective function. The Pareto front is the set of candidate solutions that cannot be improved in one objective without sacrificing another objective.
Step 3: Identify the Pareto optimal solutions on the Pareto front that cannot be improved in one objective without sacrificing another objective.
To identify the Pareto optimal solutions, we can use a variety of techniques, such as visual inspection, clustering, or optimization algorithms. Visual inspection involves manually examining the Pareto front and selecting the solutions that best meet the specific needs and preferences of the AVQI assessment. Clustering involves grouping similar solutions together and selecting the representative solutions from each cluster. Optimization algorithms, such as the NSGA-II (non-dominated sorting genetic Algorithm 2) can be used to automatically identify the Pareto optimal solutions.
Step 4: Select the Pareto optimal solution that best meets the specific needs and preferences of the AVQI assessment.
To select the Pareto optimal solution that best meets the specific needs and preferences of the AVQI assessment, we need to consider factors, such as clinical relevance, patient preference, and ease of implementation. We may also want to consult with clinicians and patients to get their feedback and ensure that the selected solution is acceptable and feasible.
Step 5: Fine-tune the AVQI algorithm and the Pareto optimization parameters based on the validation results and feedback from clinicians and patients
To fine-tune the AVQI algorithm and the Pareto optimization parameters, we need to evaluate the performance of the algorithm using validation data and feedback from clinicians and patients. We can use metrics such as accuracy, sensitivity, specificity, and AUC (area under the roc curve) to assess the performance of the AVQI algorithm. We can also ask clinicians and patients to rate the quality of the voice for a subset of the validation data and compare the ratings with the AVQI scores. Based on the validation results and feedback.
4. Results
AVQI Evaluation Outcomes
First, we used two statistical measures to assess the agreement and reliability of the data collected through individual smartphone AVQI evaluations and inter smartphone AVQI measurements. Cronbach’s alpha was used as a statistical measure to assess the internal consistency or reliability of AVQI. It ranges from 0 to 1, where 0 indicates no internal consistency or reliability, and 1 indicates perfect internal consistency or reliability. The Cronbach’s alpha for individual smartphone AVQI evaluations was calculated to be 0.99, which is an excellent agreement.
Next, we calculated the intraclass correlation coefficient (ICC), which is a statistical measure used to assess the reliability or consistency of the measurements taken by different raters or methods, in our case, different smartphones. It ranges from 0 to 1, where 0 indicates that there is no reliability or consistency, and 1 indicates perfect reliability or consistency. Therefore, the ICC was used to assess the reliability of the intersmartphone AVQI measurements, and we determined the average ICC to be 0.9115, which is an excellent result. The range of ICC values from 0.8885 to 0.9316 suggests that the measurements taken by different smartphones are consistent and reliable throughout the range.
Table 2 displays the mean AVQI scores obtained from various smartphones and a studio microphone.

Table 2.
Comparison of the mean results of the AVQI obtained with different smartphones and studio microphones.
We also performed a one-way ANOVA test to determine whether there are statistically significant differences between the means of three or more independent groups. In our case, a one-way ANOVA was performed to compare the mean AVQI scores obtained from different smartphones. The results of the analysis (presented in Table 2) indicate that there were significant differences in mean AVQI scores between different smartphones (; ). Therefore, pairwise comparisons were conducted to determine which smartphones differed significantly from each other. The results of the pairwise comparisons (pairwise analysis) revealed that there were significant differences between AKG Perception 220 (studio microphone) and Samsung S22 Ultra ().
We also explored the differences in mean AVQI scores (ranged from 0.17 to 0.99 points) when comparing different smartphones. These indicate that some smartphones performed better than others in terms of producing accurate and high-quality sound recordings.
Table 3 reports that there was a nearly perfect direct linear correlation between the AVQI results obtained from both the studio microphone and different smartphones. This means that the AVQI scores obtained from different smartphones were highly correlated with the AVQI scores obtained from the studio microphone. Pearson’s correlation coefficients ranged from 0.976 to 0.99, which is a strong positive correlation.

Table 3.
Correlations of AVQI scores obtained with a studio microphone and different smartphones.
For analysis, the Bland–Altman plot, often known as the difference plot, is used as a visual way to contrast two measuring methods [65]. The ratios (or disparities, as an alternative) between the two procedures are shown. For all devices compared to the reference microphone, bias and critical difference were computed, and the relevant Bland–Altman graphs are shown in Figure 11.
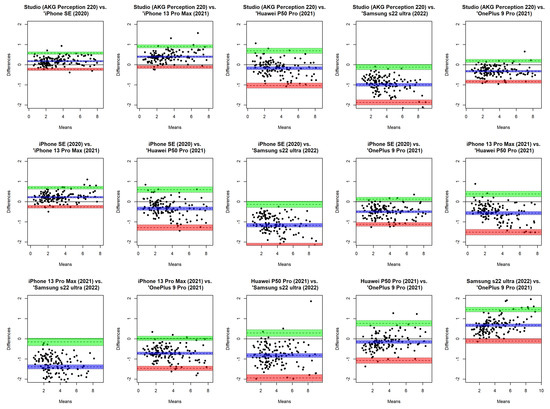
Figure 11.
Bland–Altman plot for comparison of AVQI scores obtained from each smartphone device and the reference microphone.
The bias’s 95% confidence interval was used. If 0 was omitted from the confidence interval, the bias was considered substantial. To compare the means of the recorded samples from the reference microphone with the means from the five cellphones, we utilized Bland–Altman analysis. Both an absolute number and a percentage of the complete range of the relevant parameter, as determined by the reference microphone, are used to express the amount of the important difference (random error). The results show the crucial difference calculated from studio microphone measurements as a percentage of the parameter’s total range and in absolute numbers. For the combined male and female samples, bias and critical difference were computed. In order to determine if gender has any impact on overall bias and crucial difference, the Bland–Altman plots display data points designated by gender. The 95% confidence interval was used in significance testing for bias values, as was previously noted. The correlation between AVQI results obtained from studio using AKG Perception 220 microphone and different smartphones with a 95% confidence interval is illustrated in Figure 12.
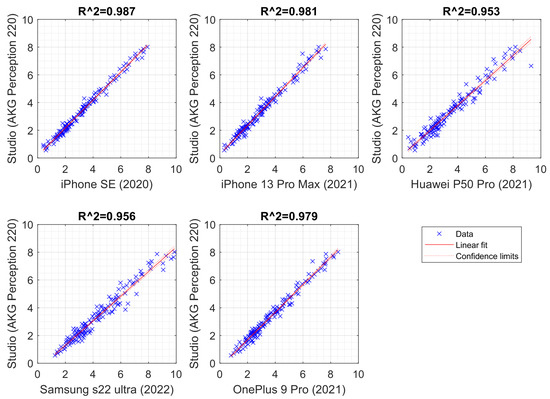
Figure 12.
Scatterplot illustrating the correlation between AVQI results obtained from studio using AKG Perception 220 microphone and different smartphones with a 95% confidence interval.
The experimental evaluation continued with the analysis of receiver operating characteristic (ROC) curves using AVQI to determine the diagnostic accuracy of different smartphones compared to a professional microphone (see Figure 13). ROC curves are representations of the relationship between the sensitivity and specificity of a diagnostic test at various cutoff points. They were used to evaluate the performance of diagnostic tests and to determine the optimal cutoff scores for diagnostic accuracy to compare the diagnostic accuracy of different smartphones with a professional microphone.
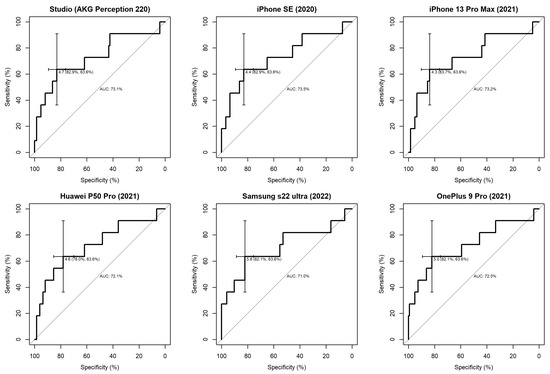
Figure 13.
ROC curves illustrating the diagnostic accuracy of studio and different smartphone microphones in discriminating normal/pathological voice.
The diagnostic accuracy of different smartphones was comparable to that of a professional microphone. This suggests that smartphones were able to distinguish between normal and pathological voices with accuracy similar to that of a professional microphone.
To determine the optimal cutoff scores for diagnostic precision, the ROC curves obtained from the studio microphone and different smartphones were visually inspected according to the general interpretation guidelines [66]. This allowed one to identify the best balance between sensitivity and specificity for each smartphone, and the cutoff score was determined accordingly.
Furthermore, the AUC statistics analysis demonstrated that AVQI had a high level of precision in distinguishing between normal and pathological voices, as evidenced by the suggested AUC = 0.7 threshold. The findings of the ROC statistical analysis are provided in Table 4.

Table 4.
The findings of the ROC statistical analysis.
We also analyzed the area under the curve (AUC) statistics to determine the accuracy of AVQI in distinguishing between normal and pathological voices. This statistical measure was used to evaluate the performance of a diagnostic test. It represents the ability of the test to correctly classify individuals into normal and pathological categories. An AUC of 0.5 indicates that the test is no better than random guessing, whereas an AUC of 1.0 indicates perfect classification. A good level of accuracy was achieved, which means that AVQI was able to correctly classify individuals into normal and pathological categories with a high degree of accuracy (the suggested threshold for high precision was an AUC of 0.7, which means that if the AUC value of AVQI was equal to or greater than 0.7, it could be considered a highly accurate diagnostic test to distinguish between normal and pathological voices).
Through the use of ROC analysis (see Table 4), we determined that there are optimal AVQI cut-off values that can effectively distinguish between normal and pathological voices for each smartphone used in the study. Furthermore, all of these devices met the proposed 0.7 AUC threshold and demonstrated an acceptable Youden index value. These results indicate that AVQI is a reliable tool for distinguishing between normal and pathological voice, be it using a smartphone or professional recording equipment.
Third, a pairwise comparison of the significance of the differences between the AUCs revealed in the present study is presented in Table 5. We used DeLong’s test [67] for two correlated ROC curves, which allows us to statistically compare the AUCs of two dependent ROC curves. This test takes into account the correlation between the ROC curves and provides a more accurate comparison of the AUCs. DeLong’s test confirmed that there were no statistically significant differences between the AUCs obtained from AVQI measurements obtained from the studio microphone and different smartphones. This means that the ability of AVQI to distinguish between normal and pathological voices was comparable between the studio microphone and different smartphones. The largest difference observed between the AUCs obtained from the studio microphone and different smartphones was only 0.025. This means that the difference in the ability of AVQI to distinguish between normal and pathological voices between the studio microphone and different smartphones was very small.

Table 5.
A pairwise comparison of the significance of differences between AUCs was revealed in the present study.
To summarize, across the statistical analysis of the study results, the data demonstrated almost identical and compatible results of AVQI performance between studio microphones and different smartphones. However, it is important to note that differences in the phone operating conditions, microphones within each smartphone series, and version of the operating system software may cause variations in acoustic voice quality measurements between recording systems. Therefore, it is advisable to use the “VoiceScreen” app with caution if tests are being performed using multiple devices. For reliable voice screening purposes, it is recommended to perform AVQI measurements using the same device, preferably with repeated measurements. These considerations should also be taken into account when comparing data from acoustic voice analysis between different recording systems, such as different smartphones or other mobile communication devices, and when using them for diagnostic purposes or monitoring voice treatment results.
5. Discussion and Conclusions
The VoiceScreen algorithm was created for clinical research and can be used on both iOS and Android devices. The AVQI and its characteristics are computed on the server, and the sound waves collected from the provided smartphone are preprocessed to remove pauses and excess sound before being sent to the server for analysis. The evaluation results were found to be reproducible on different smartphone platforms with no statistical differences. Furthermore, there was a nearly perfect direct linear correlation between the AVQI results obtained from the studio microphone and different smartphones, as the individual smartphone AVQI evaluations demonstrated excellent agreement as indicated by a Cronbach alpha of 0.99. Similarly, the inter-smartphone AVQI measurements showed excellent reliability with an average intra-class correlation coefficient (ICC) of 0.9115 (ranging from 0.8885 to 0.9316). The results of the one-way ANOVA analysis did not reveal significant differences in mean AVQI scores between different smartphones, indicating that the results of the AVQI evaluation are reproducible on different smartphone platforms. Similarly, Pearson’s correlation coefficients ranged from 0.976 to 0.99, indicating a nearly perfect direct linear correlation between AVQI results obtained from both the studio microphone and different smartphones. Additionally, based on the analysis of ROC curves using AVQI, it was determined that the diagnostic accuracy of different smartphones was comparable to that of a professional microphone. We determined that there are optimal AVQI cut-off values that can effectively distinguish between normal and pathological voices for each smartphone used in the study. Furthermore, all devices met the proposed 0.7 AUC threshold and demonstrated an acceptable Youden index value.
These results confirmed compatible results of the diagnostic accuracy of AVQI in differentiating normal versus pathological voices when using voice recordings from studio microphones and different smartphones, and our approach was found to be a reliable tool for distinguishing between normal and pathological voices, regardless of the device used, with no statistically significant differences between the voice impairment measurements obtained from different devices.
A substantial device effect was detected in a comparable study [68] for low versus high spectral ratio (L/H Ratio) (dB) in both vowel and phrase contexts, as well as for the cepstral spectral index of dysphonia (CSID) in the sentence context. It was discovered that independent of context, the device had a little influence on CPP (dB). The recording distance had a small-to-moderate influence on measurements of CPP and CSID but had no effect on the L/H ratio. The setting was found to have a considerable influence on all three measures, with the exception of the L/H ratio in the vowel context. The range of voice characteristics contained in the voice sample corpus was captured by all devices evaluated.
Author Contributions
Conceptualization, V.U.; Data curation, K.P.; Formal analysis, R.M., R.D., T.B., K.P., N.U.-S. and V.U.; Funding acquisition, V.U.; Investigation, K.P. and N.U.-S.; Methodology, K.P. and V.U.; Project administration, R.M. and V.U.; Resources, R.D., K.P. and V.U.; Software, T.B.; Supervision, R.M.; Validation, R.M., R.D. and K.P.; Visualization, R.D.; Writing—original draft, R.M.; Writing—review and editing, R.M. and R.D. All authors have read and agreed to the published version of the manuscript.
Funding
This project has received funding from European Regional Development Fund (project No. 13.1.1-LMT-K-718-05-0027) under grant agreement with the Research Council of Lithuania (LMTLT). Funded as European Union’s measure in response to COVID-19 pandemic.
Institutional Review Board Statement
This study was approved by the Kaunas Regional Ethics Committee for Biomedical Research (2022-04-20 No. BE-2-49) and by Lithuanian State Data Protection Inspectorate for Working with Personal Patient Data (No. 2R-648 (2.6-1)).
Informed Consent Statement
Informed consent was obtained from all subjects involved in the study.
Acknowledgments
The authors acknowledge the use of artificial intelligence tools for grammar checking and language improvement.
Conflicts of Interest
The authors declare no conflict of interest.
Abbreviations
The following abbreviations are used in this manuscript:
| SPL | sound pressure level |
| f0 | fundamental frequency |
| AVQO | Acoustic Voice Quality Index |
| ABI | Acoustic Breathiness Index |
| CPPS | smoothed cepstral peak prominence |
| PET | pitch elevation training |
| ART | articulation-resonance training |
| VHI | Voice Handicap Index |
| RPM | respiratory protection masks |
| KN95 | variant of respiratory protection masks |
| CSID | cepstral spectral index of dysphonia |
| TPO | trans-surgical palatine obturators |
| VHI-10 | Voice Handicap Index 10 |
| MPT | maximum phonation time |
| RBH | roughness, breathiness, hoarseness scale |
| SD | standard deviation |
| SNR | signal-to-noise ratio |
| GRBAS | grade, roughness, breathiness, asthenia, strain scale |
| iOS | Apple smartphone operating system |
| HNR | harmonicity |
| LTAS | long-term average spectrum |
| ANOVA | analysis of variance |
| ROC | receiver operating curve |
| AUC | area under the ROC curve |
References
- McKenna, V.S.; Vojtech, J.M.; Previtera, M.; Kendall, C.L.; Carraro, K.E. A Scoping Literature Review of Relative Fundamental Frequency (RFF) in Individuals with and without Voice Disorders. Appl. Sci. 2022, 12, 8121. [Google Scholar] [CrossRef]
- Jayakumar, T.; Benoy, J.J. Acoustic Voice Quality Index (AVQI) in the Measurement of Voice Quality: A Systematic Review and Meta-Analysis. J. Voice 2022, in press. [Google Scholar] [CrossRef] [PubMed]
- Saeedi, S.; Aghajanzadeh, M.; Khatoonabadi, A.R. A Literature Review of Voice Indices Available for Voice Assessment. J. Rehabil. Sci. Res. 2022, 9, 151–155. [Google Scholar]
- Englert, M.; Latoszek, B.B.V.; Behlau, M. Exploring The Validity of Acoustic Measurements and Other Voice Assessments. J. Voice 2022, in press. [Google Scholar] [CrossRef] [PubMed]
- Englert, M.; Latoszek, B.B.V.; Maryn, Y.; Behlau, M. Validation of the Acoustic Voice Quality Index, Version 03.01, to the Brazilian Portuguese Language. J. Voice 2021, 35, 160.e15–160.e21. [Google Scholar] [CrossRef]
- Grillo, E.U.; Wolfberg, J. An Assessment of Different Praat Versions for Acoustic Measures Analyzed Automatically by VoiceEvalU8 and Manually by Two Raters. J. Voice 2023, 37, 17–25. [Google Scholar] [CrossRef]
- Shabnam, S.; Pushpavathi, M. Effect of Gender on Acoustic Voice Quality Index 02.03 and Dysphonia Severity Index in Indian Normophonic Adults. Indian J. Otolaryngol. Head Neck Surg. 2022, 74, 5052–5059. [Google Scholar] [CrossRef]
- Jayakumar, T.; Benoy, J.J.; Yasin, H.M. Effect of Age and Gender on Acoustic Voice Quality Index Across Lifespan: A Cross-sectional Study in Indian Population. J. Voice 2022, 36, 436.e1–436.e8. [Google Scholar] [CrossRef]
- Leyns, C.; Daelman, J.; Adriaansen, A.; Tomassen, P.; Morsomme, D.; T’sjoen, G.; D’haeseleer, E. Short-Term Acoustic Effects of Speech Therapy in Transgender Women: A Randomized Controlled Trial. Am. J. Speech-Lang. Pathol. 2023, 32, 145–168. [Google Scholar] [CrossRef]
- Verde, L.; Brancati, N.; De Pietro, G.; Frucci, M.; Sannino, G. A Deep Learning Approach for Voice Disorder Detection for Smart Connected Living Environments. ACM Trans. Internet Technol. 2022, 22, 1–16. [Google Scholar] [CrossRef]
- Fahed, V.S.; Doheny, E.P.; Busse, M.; Hoblyn, J.; Lowery, M.M. Comparison of Acoustic Voice Features Derived From Mobile Devices and Studio Microphone Recordings. J. Voice 2022, in press. [Google Scholar] [CrossRef] [PubMed]
- Kim, G.; Lee, Y.; Bae, I.; Park, H.; Kwon, S. Effect of mobile-based voice therapy on the voice quality of patients with dysphonia. Clin. Arch. Commun. Disord. 2021, 6, 48–54. [Google Scholar] [CrossRef]
- Uloza, V.; Ulozaitė-Stanienė, N.; Petrauskas, T.; Kregždytė, R. Accuracy of Acoustic Voice Quality Index Captured With a Smartphone – Measurements With Added Ambient Noise. J. Voice 2021, in press. [Google Scholar] [CrossRef] [PubMed]
- Pommée, T.; Morsomme, D. Voice Quality in Telephone Interviews: A preliminary Acoustic Investigation. J. Voice 2022, in press. [Google Scholar] [CrossRef]
- Uloza, V.; Ulozaite-Staniene, N.; Petrauskas, T. An iOS-based VoiceScreen application: Feasibility for use in clinical settings—A pilot study. Eur. Arch. Oto-Rhino 2023, 280, 277–284. [Google Scholar] [CrossRef] [PubMed]
- Brockmann-Bauser, M.; de Paula Soares, M.F. Do We Get What We Need from Clinical Acoustic Voice Measurements? Appl. Sci. 2023, 13, 941. [Google Scholar] [CrossRef]
- Queiroz, M.R.G.; Pernambuco, L.; Leão, R.L.D.S.; Araújo, A.N.; Gomes, A.D.O.C.; da Silva, H.J.; Lucena, J.A. Voice Therapy for Older Adults During the COVID-19 Pandemic in Brazil. J. Voice 2022, in press. [Google Scholar] [CrossRef]
- Faham, M.; Laukkanen, A.; Ikävalko, T.; Rantala, L.; Geneid, A.; Holmqvist-Jämsén, S.; Ruusuvirta, K.; Pirilä, S. Acoustic Voice Quality Index as a Potential Tool for Voice Screening. J. Voice 2021, 35, 226–232. [Google Scholar] [CrossRef]
- Englert, M.; Lopes, L.; Vieira, V.; Behlau, M. Accuracy of Acoustic Voice Quality Index and Its Isolated Acoustic Measures to Discriminate the Severity of Voice Disorders. J. Voice 2022, 36, 582.e1–582.e10. [Google Scholar] [CrossRef]
- Englert, M.; Lima, L.; Latoszek, B.B.V.; Behlau, M. Influence of the Voice Sample Length in Perceptual and Acoustic Voice Quality Analysis. J. Voice 2022, 36, 582.e23–582.e32. [Google Scholar] [CrossRef]
- Thijs, Z.; Knickerbocker, K.; Watts, C.R. The Degree of Change and Relationship in Self-perceived Handicap and Acoustic Voice Quality Associated With Voice Therapy. J. Voice 2022, in press. [Google Scholar] [CrossRef] [PubMed]
- Thijs, Z.; Knickerbocker, K.; Watts, C.R. Epidemiological Patterns and Treatment Outcomes in a Private Practice Community Voice Clinic. J. Voice 2022, 36, 437.e11–437.e20. [Google Scholar] [CrossRef] [PubMed]
- Maryn, Y.; Wuyts, F.L.; Zarowski, A. Are Acoustic Markers of Voice and Speech Signals Affected by Nose-and-Mouth-Covering Respiratory Protective Masks? J. Voice 2021, in press. [Google Scholar] [CrossRef] [PubMed]
- Knowles, T.; Badh, G. The impact of face masks on spectral acoustics of speech: Effect of clear and loud speech styles. J. Acoust. Soc. Am. 2022, 151, 3359–3368. [Google Scholar] [CrossRef] [PubMed]
- Lehnert, B.; Herold, J.; Blaurock, M.; Busch, C. Reliability of the Acoustic Voice Quality Index AVQI and the Acoustic Breathiness Index (ABI) when wearing CoViD-19 protective masks. Eur. Arch. Oto-Rhino 2022, 279, 4617–4621. [Google Scholar] [CrossRef]
- Boutsen, F.R.; Park, E.; Dvorak, J.D. An Efficacy Study of Voice Quality Using Cepstral Analyses of Phonation in Parkinson’s Disease before and after SPEAK-OUT!®. Folia Phoniatr. Logop. 2023, 75, 35–42. [Google Scholar] [CrossRef]
- Maskeliūnas, R.; Damaševičius, R.; Kulikajevas, A.; Padervinskis, E.; Pribuišis, K.; Uloza, V. A Hybrid U-Lossian Deep Learning Network for Screening and Evaluating Parkinson’s Disease. Appl. Sci. 2022, 12, 11601. [Google Scholar] [CrossRef]
- Moya-Galé, G.; Spielman, J.; Ramig, L.A.; Campanelli, L.; Maryn, Y. The Acoustic Voice Quality Index (AVQI) in People with Parkinson’s Disease Before and After Intensive Voice and Articulation Therapies: Secondary Outcome of a Randomized Controlled Trial. J. Voice 2022, in press. [Google Scholar] [CrossRef]
- Batthyany, C.; Latoszek, B.B.V.; Maryn, Y. Meta-Analysis on the Validity of the Acoustic Voice Quality Index. J. Voice 2022, in press. [Google Scholar] [CrossRef]
- Bhatt, S.S.; Kabra, S.; Chatterjee, I. A Comparative Study on Acoustic Voice Quality Index Between the Subjects with Spasmodic Dysphonia and Normophonia. Indian J. Otolaryngol. Head Neck Surg. 2022, 74, 4927–4932. [Google Scholar] [CrossRef]
- Portalete, C.R.; Moraes, D.A.D.O.; Pagliarin, K.C.; Keske-Soares, M.; Cielo, C.A. Acoustic and Physiological Voice Assessment And Maximum Phonation Time In Patients With Different Types Of Dysarthria. J. Voice 2021, in press. [Google Scholar] [CrossRef] [PubMed]
- Barsties V Latoszek, B.; Mathmann, P.; Neumann, K. The cepstral spectral index of dysphonia, the acoustic voice quality index and the acoustic breathiness index as novel multiparametric indices for acoustic assessment of voice quality. Curr. Opin. Otolaryngol. Head Neck Surg. 2021, 29, 451–457. [Google Scholar] [CrossRef] [PubMed]
- Latoszek, B.B.V.; Englert, M.; Lucero, J.C.; Behlau, M. The Performance of the Acoustic Voice Quality Index and Acoustic Breathiness Index in Synthesized Voices. J. Voice 2021, in press. [Google Scholar]
- León Gómez, N.M.; Delgado Hernández, J.; Luis Hernández, J.; Artazkoz del Toro, J.J. Objective Analysis Of Voice Quality In Patients With Thyroid Pathology. Clin. Otolaryngol. 2022, 47, 81–87. [Google Scholar] [CrossRef] [PubMed]
- Maskeliūnas, R.; Kulikajevas, A.; Damaševičius, R.; Pribuišis, K.; Ulozaitė-Stanienė, N.; Uloza, V. Lightweight Deep Learning Model for Assessment of Substitution Voicing and Speech after Laryngeal Carcinoma Surgery. Cancers 2022, 14, 2366. [Google Scholar] [CrossRef] [PubMed]
- Uloza, V.; Maskeliunas, R.; Pribuisis, K.; Vaitkus, S.; Kulikajevas, A.; Damasevicius, R. An Artificial Intelligence-Based Algorithm for the Assessment of Substitution Voicing. Appl. Sci. 2022, 12, 9748. [Google Scholar] [CrossRef]
- Revoredo, E.C.V.; Gomes, A.D.O.C.; Ximenes, C.R.C.; Oliveira, K.G.S.C.D.; Silva, H.J.D.; Leão, J.C. Oropharyngeal Geometry of Maxilectomized Patients Rehabilitated with Palatal Obturators in the Trans-surgical Period: Repercussions on the Voice. J. Voice 2022, in press. [Google Scholar] [CrossRef]
- van Sluis, K.E.; van Son, R.J.J.H.; van der Molen, L.; MCGuinness, A.J.; Palme, C.E.; Novakovic, D.; Stone, D.; Natsis, L.; Charters, E.; Jones, K.; et al. Multidimensional evaluation of voice outcomes following total laryngectomy: A prospective multicenter cohort study. Eur. Arch. Oto-Rhino 2021, 278, 1209–1222. [Google Scholar] [CrossRef]
- Tattari, N.; Forss, M.; Laukkanen, A.; Rantala, L.; Finland, T. The Efficacy of the NHS Waterpipe in Superficial Hydration for People With Healthy Voices: Effects on Acoustic Voice Quality, Phonation Threshold Pressure and Subjective Sensations. J. Voice 2021, in press. [Google Scholar] [CrossRef]
- Kara, I.; Temiz, F.; Doganer, A.; Sagıroglu, S.; Yıldız, M.G.; Bilal, N.; Orhan, I. The effect of type 1 diabetes mellitus on voice in pediatric patients. Eur. Arch. Oto-Rhino 2023, 280, 269–275. [Google Scholar] [CrossRef]
- Asiaee, M.; Nourbakhsh, M.; Vahedian-Azimi, A.; Zare, M.; Jafari, R.; Atashi, S.S.; Keramatfar, A. The feasibility of using acoustic measures for predicting the Total Opacity Scores of chest computed tomography scans in patients with COVID-19. Clin. Linguist. Phon. 2023. [Google Scholar] [CrossRef] [PubMed]
- Huttunen, K.; Rantala, L. Effects of Humidification of the Vocal Tract and Respiratory Muscle Training in Women With Voice Symptoms—A Pilot Study. J. Voice 2021, 35, 158.e21–158.e33. [Google Scholar] [CrossRef] [PubMed]
- Penido, F.A.; Gama, A.C.C. Accuracy Analysis of the Multiparametric Acoustic Indices AVQI, ABI, and DSI for Speech-Language Pathologist Decision-Making. J. Voice 2023, in press. [Google Scholar] [CrossRef] [PubMed]
- Nudelman, C.; Webster, J.; Bottalico, P. The Effects of Reading Speed on Acoustic Voice Parameters and Self-reported Vocal Fatigue in Students. J. Voice 2021, in press. [Google Scholar] [CrossRef]
- Fujiki, R.B.; Huber, J.E.; Preeti Sivasankar, M. The effects of vocal exertion on lung volume measurements and acoustics in speakers reporting high and low vocal fatigue. PLoS ONE 2022, 17, e0268324. [Google Scholar] [CrossRef]
- Aishwarya, S.Y.; Narasimhan, S.V. The effect of a prolonged and demanding vocal activity (Divya Prabhandam recitation) on subjective and objective measures of voice among Indian Hindu priests. Speech Lang. Hear. 2022, 25, 498–506. [Google Scholar] [CrossRef]
- Jayakumar, T.; Kalyani, A.; Kashyap Bannuru Nanjundaswamy, R.; Tonni, S.S. A Preliminary Study on the Effect of Bhramari Pranayama on Voice of Prospective Singers. J. Voice 2022, in press. [Google Scholar] [CrossRef]
- Anand, S.; Bottalico, P.; Gray, C. Vocal Fatigue in Prospective Vocal Professionals. J. Voice 2021, 35, 247–258. [Google Scholar] [CrossRef]
- Meerschman, I.; D’haeseleer, E.; Cammu, H.; Kissel, I.; Papeleu, T.; Leyns, C.; Daelman, J.; Dannhauer, J.; Vanden Abeele, L.; Konings, V.; et al. Voice Quality of Choir Singers and the Effect of a Performance on the Voice. J. Voice 2022, in press. [Google Scholar] [CrossRef]
- D’haeseleer, E.; Quintyn, F.; Kissel, I.; Papeleu, T.; Meerschman, I.; Claeys, S.; Van Lierde, K. Vocal Quality, Symptoms, and Habits in Musical Theater Actors. J. Voice 2022, 36, 292.e1–292.e9. [Google Scholar] [CrossRef]
- Grama, M.; Barrichelo-Lindström, V.; Englert, M.; Kinghorn, D.; Behlau, M. Resonant Voice: Perceptual and Acoustic Analysis After an Intensive Lessac Kinesensic Training Workshop. J. Voice 2021, in press. [Google Scholar] [CrossRef]
- Leyns, C.; Daelman, J.; Meerschman, I.; Claeys, S.; Van Lierde, K.; D’haeseleer, E. Vocal Quality After a Performance in Actors Compared to Dancers. J. Voice 2022, 36, 141.e19–141.e31. [Google Scholar] [CrossRef] [PubMed]
- Trinite, B.; Barute, D.; Blauzde, O.; Ivane, M.; Paipare, M.; Sleze, D.; Valce, I. Choral Conductors Vocal Loading in Rehearsal Simulation Conditions. J. Voice 2022, in press. [Google Scholar] [CrossRef]
- Englert, M.; Latoszek, B.B.V.; Behlau, M. The Impact of Languages and Cultural Backgrounds on Voice Quality Analyses. Folia Phoniatr. Logop. 2022, 74, 141–152. [Google Scholar] [CrossRef] [PubMed]
- Fantini, M.; Ricci Maccarini, A.; Firino, A.; Gallia, M.; Carlino, V.; Gorris, C.; Spadola Bisetti, M.; Crosetti, E.; Succo, G. Validation of the Acoustic Voice Quality Index (AVQI) Version 03.01 in Italian. J. Voice 2021, in press. [Google Scholar] [CrossRef] [PubMed]
- Szklanny, K.; Lachowicz, J. Implementing a Statistical Parametric Speech Synthesis System for a Patient with Laryngeal Cancer. Sensors 2022, 22, 3188. [Google Scholar] [CrossRef] [PubMed]
- Jayakumar, T.; Rajasudhakar, R.; Benoy, J.J. Comparison and Validation of Acoustic Voice Quality Index Version 2 and Version 3 among South Indian Population. J. Voice 2022, in press. [Google Scholar] [CrossRef] [PubMed]
- Kim, G.; von Latoszek, B.B.; Lee, Y. Validation of Acoustic Voice Quality Index Version 3.01 and Acoustic Breathiness Index in Korean Population. J. Voice 2021, 35, 660.e9–660.e18. [Google Scholar] [CrossRef] [PubMed]
- Lee, Y.; Kim, G.; Sohn, K.; Lee, B.; Lee, J.; Kwon, S. The Usefulness of Auditory Perceptual Assessment and Acoustic Analysis as a Screening Test for Voice Problems. Folia Phoniatr. Logop. 2021, 73, 34–41. [Google Scholar] [CrossRef]
- Kishore Pebbili, G.; Shabnam, S.; Pushpavathi, M.; Rashmi, J.; Gopi Sankar, R.; Nethra, R.; Shreya, S.; Shashish, G. Diagnostic Accuracy of Acoustic Voice Quality Index Version 02.03 in Discriminating across the Perceptual Degrees of Dysphonia Severity in Kannada Language. J. Voice 2021, 35, 159.e11–159.e18. [Google Scholar] [CrossRef]
- Laukkanen, A.; Rantala, L. Does the Acoustic Voice Quality Index (AVQI) Correlate with Perceived Creak and Strain in Normophonic Young Adult Finnish Females? Folia Phoniatr. Logop. 2022, 74, 62–69. [Google Scholar] [CrossRef]
- Yeşilli-Puzella, G.; Tadıhan-Özkan, E.; Maryn, Y. Validation and Test-Retest Reliability of Acoustic Voice Quality Index Version 02.06 in the Turkish Language. J. Voice 2022, 36, 736.e25–736.e32. [Google Scholar] [CrossRef] [PubMed]
- Zainaee, S.; Khadivi, E.; Jamali, J.; Sobhani-Rad, D.; Maryn, Y.; Ghaemi, H. The acoustic voice quality index, version 2.06 and 3.01, for the Persian-speaking population. J. Commun. Disord. 2022, 100, 106279. [Google Scholar] [CrossRef] [PubMed]
- Dejonckere, P.H.; Bradley, P.; Clemente, P.; Cornut, G.; Crevier-Buchman, L.; Friedrich, G.; Heyning, P.V.D.; Remacle, M.; Woisard, V. A basic protocol for functional assessment of voice pathology, especially for investigating the efficacy of (phonosurgical) treatments and evaluating new assessment techniques. Eur. Arch. Oto-Rhino 2001, 258, 77–82. [Google Scholar] [CrossRef] [PubMed]
- Bland, J.; Altman, D. Comparing methods of measurement: Why plotting difference against standard method is misleading. Lancet 1995, 346, 1085–1087. [Google Scholar] [CrossRef] [PubMed]
- Dollaghan, C.A. The Handbook for Evidence-Based Practice in Communication Disorders; Brookes Publishing: Baltimore, MD, USA, 2007. [Google Scholar]
- DeLong, E.R.; DeLong, D.M.; Clarke-Pearson, D.L. Comparing the Areas under Two or More Correlated Receiver Operating Characteristic Curves: A Nonparametric Approach. Biometrics 1988, 44, 837. [Google Scholar] [CrossRef] [PubMed]
- Awan, S.N.; Shaikh, M.A.; Awan, J.A.; Abdalla, I.; Lim, K.O.; Misono, S. Smartphone Recordings are Comparable to “Gold Standard” Recordings for Acoustic Measurements of Voice. J. Voice 2023. [Google Scholar] [CrossRef] [PubMed]
Disclaimer/Publisher’s Note: The statements, opinions and data contained in all publications are solely those of the individual author(s) and contributor(s) and not of MDPI and/or the editor(s). MDPI and/or the editor(s) disclaim responsibility for any injury to people or property resulting from any ideas, methods, instructions or products referred to in the content. |
© 2023 by the authors. Licensee MDPI, Basel, Switzerland. This article is an open access article distributed under the terms and conditions of the Creative Commons Attribution (CC BY) license (https://creativecommons.org/licenses/by/4.0/).