Abstract
To reduce carbon emissions in the atmosphere, the utilization of renewable energy sources has been on the rise. However, as their integration level increases, grid system operators require higher performance of the frequency response service for renewable energy sources, especially wind power generators (WPGs). Conventional frequency control schemes release kinetic energy depending on the fixed and adjustable gains in the system difference loop between the standard and current system frequency; however, these conventional schemes cannot provide frequency support outside of the rotor’s speed operating region. In this work, a frequency regulation support strategy employing a WPG and lithium-ion battery based on an adaptable power reference is implemented. This is accomplished by assigning different roles to the WPG and battery. As the primary frequency control support, the WPG uses a frequency deviation loop with adaptable gain which depends on the speed of the rotor and the difference in frequency. Additionally, to assist with the frequency control support, the battery operates based on its state-of-charge (SOC) and rotor speed of the WPG. For investigating the capability of the suggested technique, an IEEE 14-bus system is employed. Qualitative wake effect analysis is further presented in the study to determine the feasibility of the proposed approach which consists of the hybrid WPP–battery system for frequency regulation. The main limitations of this study and further research studies that can be performed in the future to improve the performance of the proposed technique are presented. The scenario study results show that the minimum frequency point during a synchronous generator trip obtains a higher value than conventional ones in the suggested strategy by releasing more stored energy from the WPG and the battery.
1. Introduction
Ensuring the stability of an operating grid system that includes high integration levels of wind power generation is a crucial challenge because of the unpredictable fluctuation of wind as an alternative energy source [1,2,3]. Furthermore, the inertia of the system has declined owing to the performance of the maximum power point tracking (MPPT) mechanism by dynamic speed wind power generators (WPGs) [4,5,6]. Variable-speed WPGs operated with MPPT control do not react to the frequency control support of a system in case any fault occurs within the electrical power network [7]; thus, challenges arise in maintaining the frequency of the grid system within a constricted range when the integration level of the wind power increases [8,9]. To reduce these problems, a frequency control support scheme is required for a WPG operating within a grid system. To incorporate traditional frequency control techniques in a power system, the MPPT control loop is accompanied by a supplementary control loop [10,11,12,13]. There are two groups of traditional frequency control techniques. The techniques include one which uses a fixed gain and the other which uses a variable gain. The authors in [14] proposed a releasable kinetic-energy-based inertial control system strategy to increase the frequency nadir by utilizing the releasable energy in a WPG. To achieve this frequency control, two additional loops for the inertial control are implemented in each DFIG controller: the rate of change of frequency and droop loops. In [15], to control wind farms providing a primary frequency response, synthetic inertia with a novel frequency-dependent multi-gain droop control approach is proposed. For comparison, a proportional and proportional–integral-type pitch angle controller is combined with the suggested multi-gain droop control. The simulation results demonstrate that the suggested multi-gain droop control system can provide the best frequency control performance. A novel virtual inertia control technique for wind turbines to enhance the rotor angle’s first swing stability in the power grid is proposed in [16]. The stability of the power grid’s frequency and rotor angle features that are closely related to the inertia can be improved by controlling their variables. The study of [17] suggests a rotor-speed-based frequency–droop control technique for wind turbines. The major frequency regulation employed by the wind turbine is accomplished by modifying its power tracking curve rather than by adding droop control signals to the wind turbine’s power tracking reference, and the proposed control system is unaffected by rotor deceleration. The varying control method gains are accepted for the frequency deviance and rate of change of frequency (ROCOF) loops which are the supplementary control loops used as the frequency control technique. In [18], the primary frequency control loop was incorporated into the ROCOF loop. During the primary frequency response, the supplementary power is generated by using the ROCOF loop to prevent severe frequency drop; however, its magnitude decreases over time. Furthermore, the ROCOF loop causes a negative impact after the frequency recovery. The authors in [19] proposed a fast-frequency control technique for converter–interface energy storage systems. The approach optimizes the performance of the controller by combining droop and ROCOF regulation channels. The suggested technique enables full control of the storage device during both the inertial response and the primary frequency control periods. To control for system frequency violations caused by unforeseen events, a unique dynamic model is developed which incorporates large-scale wind farms and utility-scale batteries with frequency-sensitive active power reference schemes [20]. The power electronic interface model, its related control loops, and a brand-new controller based on fuzzy logic are also included in the proposed frequency control model. The combined wind–battery system can estimate the active power mismatch that results from a contingency or trip, determine the ensuing frequency variations, and then deliver a fast-frequency response robustly and reliably to arrest the aforementioned frequency distortions thanks to the proposed fuzzy-logic-based controller and a wash-out filter. The frequency support of a WPG with the ROCOF was enhanced by employing model-free control and rotor speed control and envisaging synthetic inertia and primary frequency response support from WPGs to overcome the demerits of the conventional ROCOF loop [17,21,22]. The supplementary power generated by the frequency deviation loop is proportional to the difference between the standard and current frequency of the system; thus, after the frequency nadir, additional generated power adds to the undesirable influence of the ROCOF loop. However, the performance of the ROCOF loop is affected by noise components. Consequently, in [23], the frequency control technique utilizes the frequency deviation loop. The performance of the frequency control technique can be enhanced by increasing the gain; however, the WPG then becomes susceptible to operational instability outside of the rotor speed operating region. Thus, a relatively small value for the fixed gain is chosen. To increase the minimum point of the frequency, a frequency deviation loop with an adjustable gain was suggested while the operation stability of the WPG is maintained [14]. The rotor speed of the WPG determines the variable gain in this technique, thus ensuring stable operation when a large generator fault is experienced. Since in the low-rotor-speed region the stored kinetic energy of the WPG is insufficient and cannot perform frequency control, the conventional schemes show low performance to maintain the frequency at the above condition. An additional device, such as a supercapacitor, flywheel, or battery, is thus required to assist in the frequency response of a WPG.
As seen from the above related studies, further research is required combining battery model systems and WPGs, and to improve the minimum point of the frequency during a frequency drop, this paper suggests the following contributions:
- A frequency control support technique based on an adaptable power reference comprising a WPG and a battery is implemented. The battery and WPG are assigned different rules in the frequency control service to accomplish this control.
- The suggested frequency control technique incorporates a supplementary control loop used in combination with the MPPT control loop which relies on the frequency difference. The speed of the rotor and the frequency determine the gain to increase the minimum frequency and ensure that the WPG operates in a stable condition.
- In the low-rotor-speed region, the battery improves the operational stability of the WPG. This is accomplished by determining that the power of the battery operates depending on its state-of-charge (SOC) and the WPG’s rotor speed.
- An IEEE 14-bus system with two wind power plants (WPPs), doubly fed induction generators (DFIGs), a battery with a 5 MWh capacity, five synchronous generators, and specified loads using the EMTP-RV simulator are used for the analysis of the suggested technique.
The remainder of this study is organized as follows: The control systems of the DFIG and battery system are presented in Section 2. The conventional frequency control support techniques and suggested frequency control support techniques in the wind power generator–battery system are presented in Section 3 and Section 4, respectively. The model system employed in this study is presented in Section 5. In Section 6, scenario studies are presented with their respective results for the suggested technique compared with the conventional approach. Additionally, a qualitative feasibility analysis of the wake effect in the wind farm is presented considering the Jensen wake model. The conclusion with further remarks; the main limitations of the study; and possible future studies to improve this study are presented in Section 7.
2. DFIG and Battery Control System
2.1. DFIG Control System
A DFIG, as seen in Figure 1, is made up of mechanical power, the two-mass shaft, pitch control models, the rotor-side converter (RSC), and the grid-side converter (GSC). The RSC and GSC are expressed in reference frames where the space vector of the DFIG stator voltage is lined up with the q-axis [24]. It should be noted that the reference frames for the DFIG model, RSC, and GSC controls are all aligned with the voltage of the stator. The controls of the converter can then be incorporated with the DFIG in a similar dq reference frame. The RSC and GSC are linked by a dc-link capacitor. The active and reactive power on the grid point are regulated by the RSC controller and the GSC controller adjusts the dc-link voltage (VDC) and ensures a unity power factor [24].
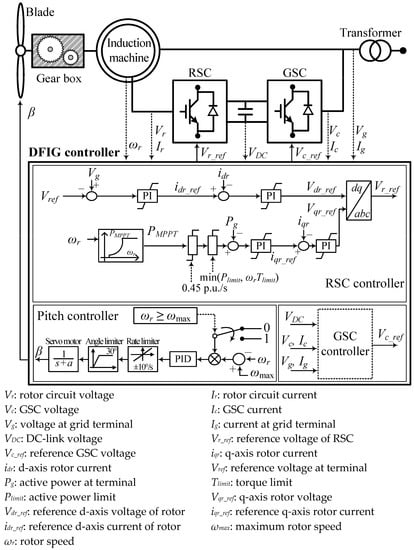
Figure 1.
A DFIG’s conventional design and pitch control approach.
The mechanical power (Pm) is illustrated as follows:
where ρ, A, cp, λ, β, vw, and ωt represent the density of air, the area covered by the rotor blades, the power coefficient, the tip/speed ratio, the pitch angle, the wind speed, and the angular wind of the turbine, respectively. In [25], cp is illustrated as follows:
where . In this investigation, β = 0°, and the maximum cp and optimal λ are selected to be 0.5 and 9.95, respectively. In addition, a drivetrain system is designed to model the dynamic operation of the wind power turbine and doubly fed induction generator, as shown in Figure 2 [26].
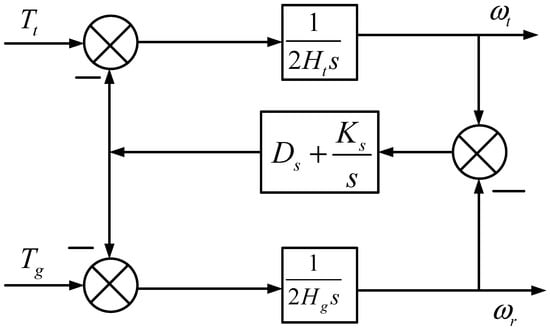
Figure 2.
The two-mass shaft is designed as the drivetrain system [26].
A two-mass shaft model is denoted by the following:
Ht and Hg denote the inertia time constants of a wind turbine and the generator mass, ωt and ωr are the angular speeds of a wind turbine and the generator mass, Tt and Tg represent the electrical torques of a wind turbine and the generator mass, and Dt and Dg denote the damping constants of a wind turbine and the generator mass [26,27].
In addition, the shaft stiffness coefficient (Ks), the damping constant of the shaft in per-unit (pu) (Ds), the torsional twist angle in radians (rad) (θs), and the base value of the angular speed (ω = 314 rad/s) are represented accordingly [26,27]. θs indicates the measure of the mechanical stress from the speed difference between the shaft [24,25]. The values chosen for the parameters in this work were Dt = 0 pu, Ds = 1.5 pu, Dg = 0 pu, Ht = 4 s, Hg = 1 s, and Ks = 1.25 pu. The MPPT control reference (PMPPT) was set as in Equation (4) to maximize the power output as in [27,28]:
where kg is a constant expressed as in Equation (5), set as 0.512 in this investigation.
R is the radius equal to the length of the turbine blades, cpmax is the maximum power coefficient attained when the pitch angle of the blade system is (β = 0°), and λoptimum is the optimum tip/speed ratio that achieves the cpmax. A pitch angle controller, as shown in Figure 1, ensures that the rotor speed (ωr) does not surpass the maximum operating limit (ωmax). Furthermore, the pitch angle controller rate is set as ±10°/s and the angle limiters are set as 30°.
Figure 3 and Figure 4 show the power–rotor speed and the power–wind speed curves of a DFIG, respectively. During the low-wind-speed condition, the control purpose is to ensure that the operating point follows the maximum power point tracking limit and attains the maximum wind power. The rotor speed attains the limit and maintains the maximum as the wind speed increases [27,29]. During the high-speed condition, the wind power tracking efficiency is reduced by regulating the pitch angle so that the DFIG power output is maintained at the rated active power.
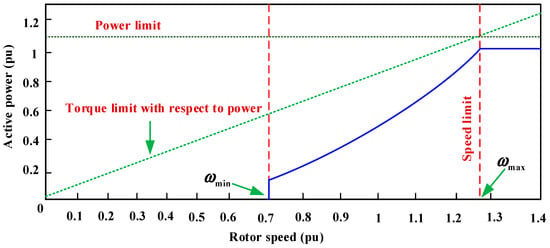
Figure 3.
Power–rotor speed curve of a DFIG.
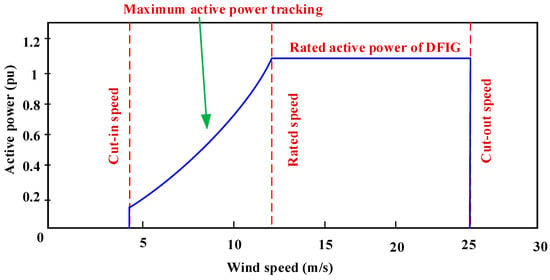
Figure 4.
DFIG power–wind speed curve.
Furthermore, as seen in Figure 4, in the low-speed region (vw < 5 m/s), the speed of the rotor is maintained at ωmin; thus, during any frequency drop, the DFIG cannot respond by supplying the rotational kinetic energy. At the center speed region (5 m/s ≤ vw ≤ 11 m/s), the DFIG operates in the maximum power tracking condition to exploit the efficiency of the wind power being captured. The fast-frequency response is attained by delivering the rotational kinetic energy. In the high-speed mode (11 m/s < vw), the DFIG power output is limited by the converter capacity, and no extra power can be generated; thus, the fast-frequency response action cannot be performed by the DFIG.
2.2. Battery System Model
The battery is modeled as being ideal with a 5 MWh capacity. To investigate a grid system with a high-capacity battery, the battery model is assumed to be a series cell-connected configured battery pack [30]. When the battery operates in such conditions, its voltage curve has a non-linear form due to electrochemical characteristics such as electrolyte resistance and charge transfer resistance which causes overpotential [31]. From this point of view, the non-linear voltage curve changes in two steps when the current flows through the battery after enough rest time for eliminating the overpotential factors characterized as the open-circuit voltage (OCV) condition [31]. In the first step, the battery voltage drops suddenly, and which can be directly used to calculate the ohmic resistance. From Ohm’s law, the resistance (Rbattery) is defined as the difference between OCV and dropped voltage divided by current [31,32,33]. In the second step, after a sudden voltage drop, the battery voltage draws an exponential decrease form resulting from the charge transfer reaction and ionic diffusion. The exponential voltage curve can be designed with a resistor and capacitor parallel connection. The beginning and end voltage in the exponential curve indicate resistance (R1) as being the same as in the first step of non-linear voltage curve’s change and the degree of exponential change is set by the time constant [34]. In the resistance and capacitor parallel connection, the time constant is defined as one product between resistance and capacitance. In this study, an ideal battery system is applied; thus, 5 MWh can be used whenever the system needs energy from the battery system. Therefore, capacitance (C1) can be calculated from the time at 63.2% voltage variation. As seen in Figure 5, the lithium-ion battery electrical circuit model is composed of a series resistor and a parallel resistor, as well as a capacitor combination. The battery-model-related equation can be expressed as in Equation (6). This model is composed of a voltage source (E0) representing the OCV dependent on the SOC, an ohmic resistor modeling the internal resistance (Rbattery), and an RC network (R1C1) that describes the diffusion phenomena. For this investigation, Rbattery, R1, and C1 were assigned values of 0.12 Ω, 0.09 Ω, and 473.89 F, respectively.
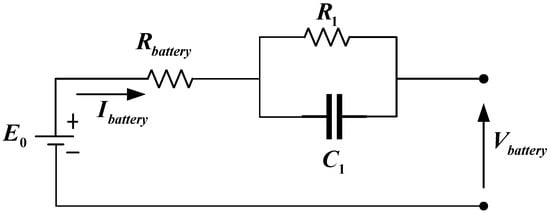
Figure 5.
Detailed electrical equivalent circuit model of the battery.
3. Conventional Frequency Control Support Techniques
As this paper mentioned above, supplementary control loops which depend on the frequency deviation loop and the ROCOF were proposed to control the frequency. Nevertheless, the ROCOF loop is subjected to noise components as a result of the measurement of the system frequency. Furthermore, the output of the ROCOF loop negatively contributes to the frequency control support until the frequency returns to the standard value after the frequency recovery. This is because the output of the ROCOF loop becomes negative during this period; thus, the suggested techniques adapt the frequency deviation loop only. This section concisely explains the features of two traditional frequency control techniques: Technique I and Technique II, respectively, using fixed gain in [23] and variable gain in [14].
3.1. Technique I Employing the Fixed Gain
Figure 6 illustrates a typical frequency regulation technique of a DFIG system that applies a droop gain. The RSC controller is indicated on the right side. In [23], the sum of the maximum power point tracking power and the output power of the frequency deviation loop (ΔPa) results in the reference power (Pref) of the frequency control loop, as seen below:

Figure 6.
Technique I using the fixed gain [23].
When a frequency disturbance occurs, ΔPa sets a positive value and it leads to increasing Pref. ΔPa is defined as follows:
where fsys and fnom are the current frequency of the system and the nominal frequency, respectively; R0 is the fixed gain, set to 25 in this investigation to attain the operational stability of the DFIG near the minimum rotor speed [35]. After obtaining Pref, the rate limiter and power limiter set the order of the RSC controller considering the DFIG performance. In Figure 6, the rate limiter considers the mechanical stress on a drivetrain of a DFIG and is set to 0.45 pu/s, and the limiter is set to the minimum value of the power limit and torque limit of a DFIG with the rotor speed. This typical strategy inevitably adopts a small gain for this reason. Thus, Technique I provides a limited contribution to the frequency control support due to the relatively small value assigned to the frequency deviation loop gain despite the sufficient kinetic energy stored up in the rotating masses. Technique II modifies the frequency deviation loop gain with kinetic energy. The next subsection explains the characteristics of Technique II.
3.2. Technique II Employing the Variable Gain
To increase the performance of the frequency regulation of a WPG with stable operation, Technique II suggests an adaptable gain that is established on the WPG’s rotor speed [14]. Technique I using fixed gain, which is enclosed in the blue dotted line as shown in Figure 6, is replaced by Technique II using variable gain. Furthermore, Technique II adopts the frequency deviation loop to compensate for the ROCOF loop. In Technique II, the variable gain AG(ωr) is relational to the releasable kinetic energy (ΔE) delivered by the WPG, illustrated as follows:
where J represents the rotor moment of inertia and C is a proportional constant chosen to be 200. C can be determined by the droop at the maximum rotor speed, as seen below:
where Rmax denotes the droop at the maximum rotor speed of DFIG (ωmax). To apply AG(ωr), the power system can be enhanced to consider the aspects of the frequency nadir when a disturbance occurs.
In Equation (10), AG(ωr) obtains the bigger gain when the WPG has enough kinetic energy (Ke); on the other hand, AG(ωr) has zero value at the bottom of the rotor speed to keep the operation of the WPG stable. Technique II, however, can only help the frequency control within the bounds dictated by the releasable kinetic energy. Figure 7 shows the illustration of Technique II using the variable gain in which Ke and Ro are adjusted depending on the releasable kinetic energy. In the ROCOF loop, a first-order low-pass filter is used to remove the noise features in the measured frequency. Additionally, the rate limiter and the maximum limiter are utilized to obtain accurate results, where the rate limiter which is set to 0.45 pu/s [14] takes into consideration the mechanical stress on the DFIG’s drivetrain, and the maximum limiter is set to the DFIG’s minimum value of the power and torque limits.
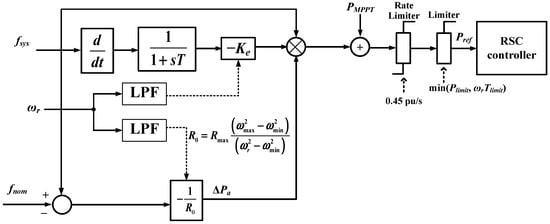
Figure 7.
Technique II using the variable gain [14].
4. Suggested Frequency Control Support Technique in the Wind–Battery System
The goal of the suggested technique is to increase the minimum point of the system frequency, although the WPG has insufficient available kinetic energy within the rotor circuit. To accomplish this aim, the suggested frequency control support technique is divided into two control functions:
- (1)
- The WPG predominantly releases kinetic energy to the grid system when the synchronous generator trip occurs.
- (2)
- The battery supports the WPG as the auxiliary control system. Hence, the overall power output is adaptable and dependent on the SOC of the battery, frequency deviation, and rotor speed.
Figure 8 depicts the structure of the suggested frequency control support technique in the wind–battery system.

Figure 8.
Proposed frequency control support scheme in the wind–battery system.
4.1. Frequency Control Support Technique
The summation of the output power of the WPG (PMPPT + ΔP) and the battery (Pref_B) equals the total output power (Ptotal) as follows:
Figure 9 displays the suggested frequency control support technique in the WPG and battery system that applies the adaptable gain of the frequency deviation loop. The variable gain for K(ωr, Δf) is dependent on the speed of the rotor (ωr) and the change in frequency (Δf). A 3D space plot of the variable gain for K(ωr, Δf) is seen in Figure 10, and Figure 11 depicts the resultant output ΔP(ωr, Δf) of the frequency deviation loop. For the suggested technique, ΔP and K(ωr, Δf) are illustrated as follows:

Figure 9.
Suggested frequency control support technique.
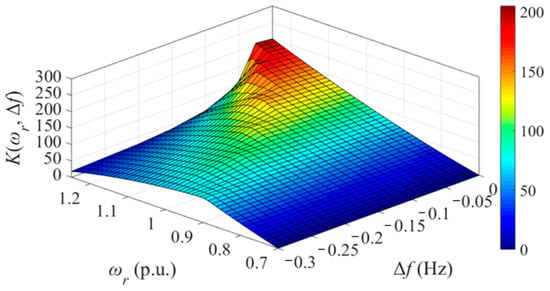
Figure 10.
K(ωr, Δf) in the 3D space.
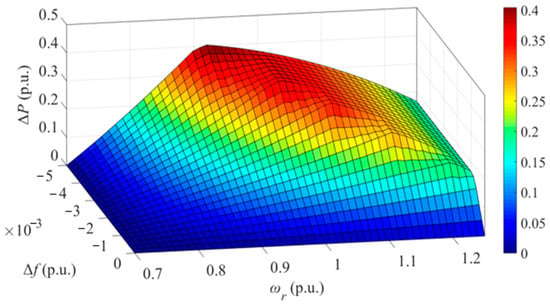
Figure 11.
ΔP represented in the 3D space.
For this investigation, K(ωr, Δf) is determined as follows:
In Equation (15), K(ωr, Δf) is composed of ωr and Δf. The ωr adds to ensuring the stability of WPG’s operation and the Δf adds to improving the minimum point of the frequency dependent on the change in frequency. A larger K(ωr, Δf) is determined by the large speed of the rotor and frequency change. Additionally, to prevent Pref from reaching the output power limit of the DFIG, this investigation considers the gain limit (Klimit(ωr, Δf)), which also varies with Δf and ωr as follows:
Finally, the gain is set as the minimum value between the gains in Equations (15) and (16) during the frequency decrease.
4.2. Frequency Control Support Technique Incorporating a Battery
In the proposed technique, Pref_B is calculated by the battery’s SOC and ωr of the WPG as follows:
where SOC indicates the measured SOC, and SOCmin and SOCmax indicate the minimum and maximum.
In Figure 12, the small ωr results in a bigger Pref_B, and the high SOC leads to a higher Pref_B since the lithium-ion battery contributes enormously to frequency control support when the WPG does not contain enough kinetic energy. However, when the battery is situated in over-discharge and over-charge conditions, battery accidents can occur such as fire and explosion. Therefore, to ensure battery safety, its operation is limited to the SOC range between 20% and 80%. In achieving this, as the SOC of a battery decreases to 20%, Pref_B is set to zero. Every scenario study sets the initial battery SOC as 50%, as seen in Section 6.
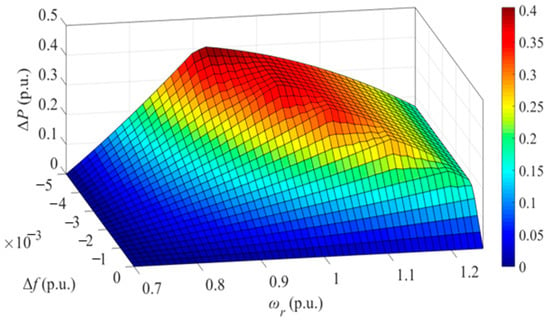
Figure 12.
Pref_B for various speeds of the rotor.
5. Model System
The model system discussed in this paper is depicted in Figure 13. A modified IEEE 14-bus system is composed of five synchronous generators, two combined DFIG-based WPPs, and a battery with a capacity of 5 MWh, and active and reactive loads are modeled utilizing an EMTP-RV simulator to demonstrate the frequency control technique’s performance. The whole static load is about 600 MW and 57.4 MVAr for active and reactive, respectively. For this investigation, the wind power integration level was 15%, which was obtained as a result of the installed capacity of the power plant divided by the demand. In Figure 13, the synchronous generators’ working conditions, as well as the demands of each bus, can be seen. All synchronous generators’ droop gains were chosen to be 5%. The synchronous generators were supposed to be steam turbine generators to simulate a grid system that has a slow response feature of ramping ability. The IEEEG1 steam governor model was adopted in this paper [36,37].
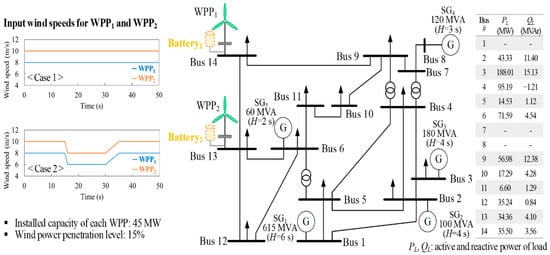
Figure 13.
IEEE 14-bus system with three WPPs.
6. Scenario Study
Two different scenarios comprising different input wind speeds were investigated. As a disturbance, synchronous generator (SG2) within the IEEE 14-bus system generating a total of 50 MW was tripped at 10 s. For Scenario A, the input wind speeds of the two WPPs were set to be 8 m/s and 10 m/s. In Scenario B, the input wind speeds decreased at 15 s and then recovered at 35 s. Performance comparisons of the suggested technique with the battery control system, the suggested technique without the battery control system, Technique I, Technique II, and the MPPT control, indicated with red, blue, green, pink, and brownish-yellow lines, respectively, were undertaken.
6.1. Scenario A
The investigations and results of the capability of the frequency control support strategies for different input wind speeds are described and presented in this subsection. Figure 14 shows the resulting power output and frequency of the WPPs and battery. The minimum point of the frequency after the disturbance is 59.728 Hz in the proposed system incorporating the battery control system, as seen in Figure 14a. The MPPT technique with 59.521 Hz is less than the proposed technique by 0.207 Hz, Technique I with 59.624 Hz is less than the proposed technique by 0.104 Hz, Technique II with 59.697 Hz is less than the proposed technique by 0.031 Hz, and the proposed system without the battery control system with 59.709 Hz is less than the proposed technique by 0.019 Hz. These results show that the proposed system with the battery releases comparatively more energy stored from the synchronous generators’ rotating masses and the battery regulating the power output references.
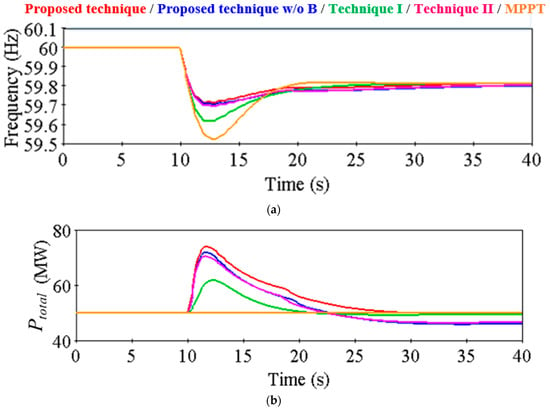
Figure 14.
Scenario A: (a) frequency; (b) total output power.
The results of Scenario A can be seen in Figure 15. The WPP1 power output of the suggested technique (red and blue lines) is greater than Technique I, Technique II, and the MPPT control operation, as shown in Figure 15a. As seen in Figure 15b, the output power of WPP2 in the suggested technique and Technique II is similar because of the power limit. As seen in Figure 15c, the Battery2 power output of WPP2 is less than that of WPP1 because the rotor speed, ωr, of WPP1 is less than that of WPP2. Hence, as shown in Figure 15d, the SOC of Battery1 rapidly decreases compared to that of Battery2.
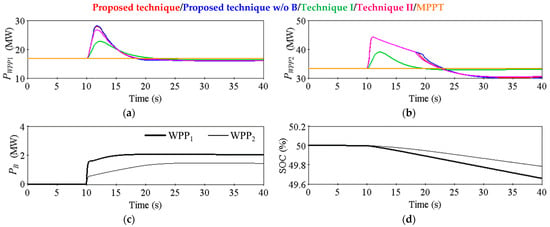
Figure 15.
Results for Scenario A: (a) WPP1 and battery1 power output; (b) WPP2 and battery2 power output; (c) battery’s power output; (d) battery’s SOC.
Figure 16a,b shows that ΔP in the suggested technique is enormously higher than in the typical schemes, Technique I and Technique II. This is due to K(ωr, Δf) in the suggested technique being bigger than the gain in the typical schemes, as indicated in Figure 16c,d. Consequently, ωr in the suggested technique is smaller than that in the typical schemes, which can be seen in Figure 16e,f.
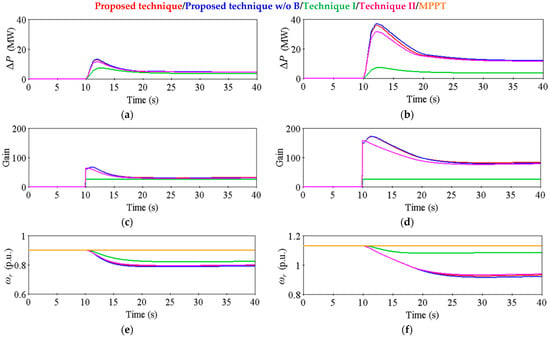
Figure 16.
Results for Scenario A: (a) WPP1’s auxiliary power output; (b) WPP2’s auxiliary power output; (c) WPP1’s gain; (d) WPP2’s gain; (e) speed of WPP1 rotor; (f) speed of WPP2 rotor.
6.2. Scenario B
The Scenario B results are shown in Figure 17, Figure 18 and Figure 19 where the input wind speeds are variable. Figure 17a displays the frequency nadir which is 59.630 Hz after a synchronous generator trip of the presented technique, incorporating the battery control system. The MPPT control scheme’s frequency, 59.469 Hz, is 0.161 Hz less than the minimum frequency point of the proposed technique, Technique I with a frequency of 59.574 Hz is 0.056 Hz less, Technique II which is 59.601 Hz is 0.029 Hz less than the proposed technique, and the proposed scheme without the battery system frequency of 59.602 Hz is 0.028 Hz less than the proposed technique with the battery system.
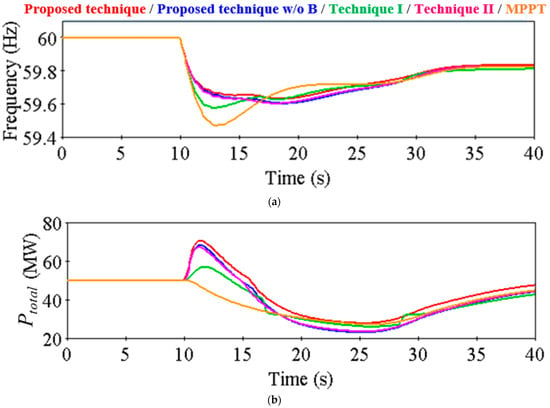
Figure 17.
Scenario B: (a) frequency; (b) total output power.
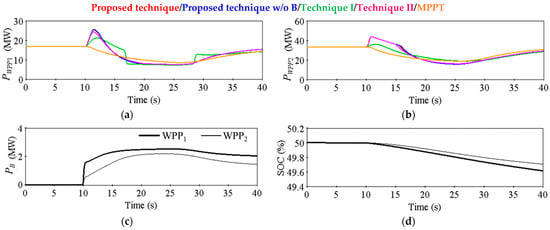
Figure 18.
Results for Scenario B: (a) WPP1 and battery1 power output; (b) WPP2 and battery2 power output; (c) battery’s power output; (d) battery’s SOC.
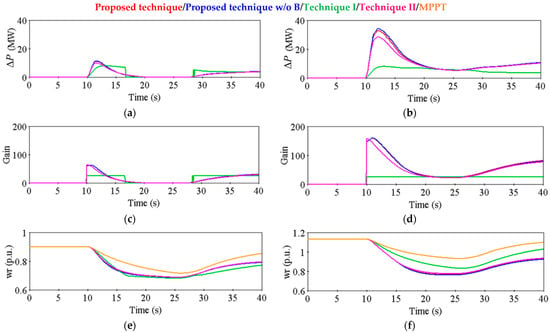
Figure 19.
Results for Scenario B: (a) WPP1’s auxiliary power output; (b) WPP2’s auxiliary power output; (c) WPP1’s gain; (d) WPP2’s gain; (e) speed of WPP1 rotor; (f) speed of WPP2 rotor.
As seen in Figure 18 and Figure 19, as the input wind speed decreases in WPP1, the control gains in the suggested technique, Technique I, and Technique II are zero since ωr reaches the minimum value. However, the Technique I frequency displays a second frequency dip because the gain is abruptly set to zero, resulting in a rapid decrease in the WPP1 power output. In the suggested frequency control technique, the lithium-ion battery power output is varied by ωr and SOC for supporting the output power of WPG. Therefore, the proposed strategy shows a higher frequency nadir for the variable input wind speed.
The frequencies obtained by implementing the proposed technique as compared to the conventional approaches have been summarized in Table 1. In Scenario A, the minimum point of the frequency after the disturbance is 59.728 Hz in the proposed technique. The MPPT technique with 59.521 Hz is less than the proposed technique by 0.207 Hz, Technique I with 59.624 Hz is less than the proposed technique by 0.104 Hz, Technique II with 59.697 Hz is less than the proposed technique by 0.031 Hz, and the proposed technique without the battery control system with 59.709 Hz is less than the proposed technique by 0.019 Hz. In Scenario B, the frequency nadir is 59.630 Hz after a synchronous generator trip of the proposed technique, incorporating the battery control system. The MPPT control scheme’s frequency, 59.469 Hz, is 0.161 Hz less than the minimum frequency point of the proposed technique, Technique I with a frequency of 59.574 Hz is 0.056 Hz less, Technique II which is 59.601 Hz is 0.029 Hz less than the proposed technique, and the proposed technique without the battery system frequency of 59.602 Hz is 0.028 Hz less than the proposed technique with the battery system. The frequency values indicate the improved performance of the proposed technique, where more energy is released into the system even under variable input wind speeds.

Table 1.
Obtained frequencies by the proposed technique and conventional approaches under each scenario.
6.3. Qualitative Feasibility Analysis for Possibly Considering Wake Effect within the Wind Farm
The WPPs’ design optimization is necessary as this influences the wind farm’s annual energy production (AEP) [38]. The optimal performance of a wind farm, which involves maximizing the area’s wind energy potential and minimizing the turbulence loading on the rotors of downstream WPPs, is closely connected to the optimal WPP distribution throughout the available site [38,39]. The wake effect is a dominant factor that influences the wind farm’s AEP. As the wind moves past each WPP’s rotor, axial and radial pressure drops occur and energy is extracted, which causes pertinent turbulence to rise downstream of the WPP.
The Jensen wake model is a well-known one-dimensional (1D) wake model that makes use of two formulas based on the assumptions of a linearly growing wake diameter, constant wind speed recovery which is proportional to the downstream distance, and a “top-hat” distribution [38,40]. This can be further expressed in a constant wind speed in the cross-wind direction, with changes appearing only in a streamwise direction. The expressions below apply to the Jensen wake model [38,40]:
where Dwk, kwk, xd, Rd, Vwsd, and Vup represent the wake’s diameter, downstream distance, WPP rotor distance, wind speed deficit, and upstream wind speed, respectively. The schematic Jensen wake model representation is shown in Figure 20.
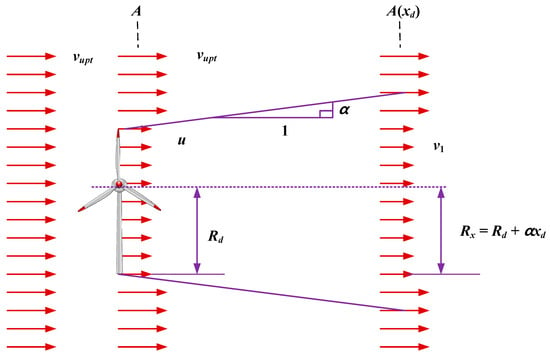
Figure 20.
Jensen wake model schematic representation [38,40].
From the wake model above, the following equations can be expressed as follows:
a is a defined ‘axial interference factor’, which is utilized to express the ratio between the speed reduction at the plane of the blade disc and the undistributed wind speed well upstream of the turbine. The wind’s course through the turbine blades is depicted by a cone on the assumption that the wake will expand linearly. Thus, the radius of this cone Rx is obtained as seen in the model figure. The dimensionless scalar α determines how quickly the wake expands with distance and is defined in Equation (20). z is the hub height of the turbine generating the wake and z0 is a constant called surface roughness, which depends on the characteristics of the local landscape. Due to assumptions on the turbulent wake and the minimal tip vortices contribution, it can be said that the Jensen wake model is suitable for downstream distances greater than three times the WPP rotor diameter [38,40]. For this study, the WPPs within the wind farm will tend to have such a wake effect, and thus the analysis with the combination of the battery system for frequency regulation operation is very necessary. This is due to the operation condition that the battery system might set into operation, dependent on the selection of the WPP based on the rotor speed being measured.
7. Conclusions
The main achievements of this study are as follows: A frequency control support technique based on an adaptable power reference comprising a WPG and a battery is implemented. The battery and WPG were assigned different functions in the frequency control service to accomplish this purpose. The proposed frequency control technique incorporates a supplementary control loop used in combination with the MPPT control loop which relies on the frequency difference. The speed of the rotor and the frequency determine the gain to increase the minimum frequency and ensure that the WPG operates in a stable condition. In the low-rotor-speed region, the battery improves the operational stability of the WPG. This is accomplished by determining that the power of the battery operates depending on its state-of-charge (SOC) and the WPG’s rotor speed. An IEEE 14-bus system with two wind power plants (WPPs), doubly fed induction generators (DFIGs), a battery with a 5 MWh capacity, five synchronous generators, and specified loads using the EMTP-RV simulator were used for the analysis of the suggested technique. The scenario study results present that the suggested technique can decrease the frequency drop by releasing more energy which is stored in the rotating masses of the WPP and battery than the typical conventional techniques.
This study has some main limitations. Firstly, an ideal battery model system was employed for this study; however, in actual operating conditions, the non-linear battery model characteristics with varying systems and environmental conditions need to be considered. Additionally, a qualitative feasibility analysis on the wind farm where the wake effect is often experienced was performed to determine the future adaptability of the proposed approach within the system. This analysis does not provide a clear relation with the application of the proposed technique in frequency regulation and wake effect scenarios and thus needs further investigation. In addition, to further verify the effective application of the proposed technique, a sensitivity analysis of the proposed control technique was not presented considering various operating conditions.
Hence, based on the above limitations of the study, the following future research needs to be performed. An actual battery system takes into consideration its non-linear characteristics and various operating conditions as well as investigating the battery states, which include the battery’s state-of-health, ageing, and remaining useful life, to ensure an efficient battery system. Additionally, a detailed wake effect analysis needs to be further studied on the wind farm taking into account the frequency regulation control employing the battery system for an optimized wind farm. Furthermore, a sensitivity analysis study needs to be performed based on the proposed control technique considering various operating conditions.
Author Contributions
Conceptualization, H.L. and R.K.T.; methodology, H.L.; software, H.L.; validation, R.K.T., H.L. and S.H.; formal analysis, R.K.T.; investigation, R.K.T.; resources, H.L.; data curation, S.H.; writing—original draft preparation, R.K.T.; writing—review and editing, J.K.; visualization, R.K.T.; supervision, J.K.; project administration, J.K.; funding acquisition, J.K. All authors have read and agreed to the published version of the manuscript.
Funding
This work was supported by the Korea Electric Power Corporation (R21XO01-3) and Korea Institute of Energy Technology Evaluation and Planning (KETEP), as well as the Ministry of Trade, Industry and Energy (MOTIE) of the Republic of Korea (no. 20210501010020).
Institutional Review Board Statement
Not applicable.
Informed Consent Statement
Not applicable.
Data Availability Statement
The data that support the findings of this study are available from the corresponding author upon reasonable request.
Conflicts of Interest
The authors declare no conflict of interest.
References
- Impram, S.; Nese, S.V.; Oral, B. Challenges of renewable energy penetration on power system flexibility: A survey. Energy Strat. Rev. 2020, 31, 100539. [Google Scholar] [CrossRef]
- Adetokun, B.B.; Muriithi, C.M.; Ojo, J.O. Voltage stability assessment and enhancement of power grid with increasing wind energy penetration. Int. J. Electr. Power Energy Syst. 2020, 120, 105988. [Google Scholar] [CrossRef]
- Oskouei, M.Z.; Mohammadi-Ivatloo, B.; Abapour, M.; Shafiee, M.; Anvari-Moghaddam, A. Techno-economic and environmental assessment of the coordinated operation of regional grid-connected energy hubs considering high penetration of wind power. J. Clean. Prod. 2021, 280, 124275. [Google Scholar] [CrossRef]
- Taghdisi, M.; Balochian, S. Maximum Power Point Tracking of Variable-Speed Wind Turbines Using Self-Tuning Fuzzy PID. Technol. Econ. Smart Grids Sustain. Energy 2020, 5, 13. [Google Scholar] [CrossRef]
- Pande, J.; Nasikkar, P.; Kotecha, K.; Varadarajan, V. A Review of Maximum Power Point Tracking Algorithms for Wind Energy Conversion Systems. J. Mar. Sci. Eng. 2021, 9, 1187. [Google Scholar] [CrossRef]
- Boopathi, R.; Jayanthi, R.; Ansari, M.M.T. Maximum power point tracking-based hybrid pulse width modulation for harmonic reduction in wind energy conversion systems. Comput. Electr. Eng. 2020, 86, 106711. [Google Scholar] [CrossRef]
- Chen, J.; Yao, W.; Lu, Q.; Ren, Y.; Duan, W.; Kan, J.; Jiang, L. Adaptive active fault-tolerant MPPT control of variable-speed wind turbine considering generator actuator failure. Int. J. Electr. Power Energy Syst. 2022, 143, 108443. [Google Scholar] [CrossRef]
- Shazon, N.H.; Masood, N.A.; Jawad, A. Frequency control challenges and potential countermeasures in future low-inertia power systems: A review. Energy Rep. 2022, 8, 6191–6219. [Google Scholar] [CrossRef]
- Fernández-Guillamón, A.; Gómez-Lázaro, E.; Muljadi, E.; Molina-García, Á. Power systems with high renewable energy sources: A review of inertia and frequency control strategies over time. Renew. Sustain. Energy Rev. 2019, 115, 109369. [Google Scholar] [CrossRef]
- Zhong, C.; Lv, Y.; Li, H.; Chen, J.; Li, Y. Frequency support scheme based on parametrized power curve for de-loaded wind turbine under various wind speed. Wind. Eng. 2022, 46, 459–479. [Google Scholar] [CrossRef]
- Fernández-Bustamante, P.; Barambones, O.; Calvo, I.; Napole, C.; Derbeli, M. Provision of Frequency Response from Wind Farms: A Review. Energies 2021, 14, 6689. [Google Scholar] [CrossRef]
- Büyük, M.; Inci, M. Improved drift-free P&O MPPT method to enhance energy harvesting capability for dynamic operating conditions of fuel cells. Energy 2023, 267, 126543. [Google Scholar] [CrossRef]
- Inci, M. A flexible perturb & observe MPPT method to prevent surplus energy for grid-failure conditions of fuel cells. Int. J. Hydrogen Energy 2021, 46, 39483–39498. [Google Scholar] [CrossRef]
- Lee, J.; Muljadi, E.; Sørensen, P.E.; Kang, Y.C. Releasable Kinetic Energy-Based Inertial Control of a DFIG Wind Power Plant. IEEE Trans. Sustain. Energy 2016, 7, 279–288. [Google Scholar] [CrossRef]
- Datta, U.; Kalam, A.; Shi, J. Frequency performance analysis of multi-gain droop controlled DFIG in an isolated microgrid using real-time digital simulator. Eng. Sci. Technol. Int. J. 2020, 23, 1028–1041. [Google Scholar] [CrossRef]
- Zhang, X.; Zhu, Z.; Fu, Y.; Li, L. Optimized virtual inertia of wind turbine for rotor angle stability in interconnected power systems. Electr. Power Syst. Res. 2020, 180, 106157. [Google Scholar] [CrossRef]
- Boyle, J.; Littler, T.; Muyeen, S.; Foley, A.M. An alternative frequency-droop scheme for wind turbines that provide primary frequency regulation via rotor speed control. Int. J. Electr. Power Energy Syst. 2021, 133, 107219. [Google Scholar] [CrossRef]
- Mandal, R.; Chatterjee, K. Virtual inertia emulation and RoCoF control of a microgrid with high renewable power penetration. Electr. Power Syst. Res. 2021, 194, 107093. [Google Scholar] [CrossRef]
- Ortega, Á.; Milano, F. Combined Frequency and RoCoF Control of Converter-Interfaced Energy Storage Systems. IFAC-PapersOnLine 2019, 52, 240–245. [Google Scholar] [CrossRef]
- Taghvaei, M.; Gilvanejad, M.; Sedighizade, M. Cooperation of large-scale wind farm and battery storage in frequency control: An optimal Fuzzy-logic based controller. J. Energy Storage 2021, 46, 103834. [Google Scholar] [CrossRef]
- Park, B.; Zhang, Y.; Olama, M.; Kuruganti, T. Model-free control for frequency response support in microgrids utilizing wind turbines. Electr. Power Syst. Res. 2021, 194, 107080. [Google Scholar] [CrossRef]
- Prakash, V.; Kushwaha, P.; Sharma, K.C.; Bhakar, R. Frequency response support assessment from uncertain wind generation. Int. J. Electr. Power Energy Syst. 2022, 134, 107465. [Google Scholar] [CrossRef]
- Wang-Hansen, M.; Josefsson, R.; Mehmedovic, H. Frequency Controlling Wind Power Modeling of Control Strategies. IEEE Trans. Sustain. Energy 2013, 4, 954–959. [Google Scholar] [CrossRef]
- Boubzizi, S.; Abid, H.; El Hajjaji, A.; Chaabane, M. Comparative study of three types of controllers for DFIG in wind energy conversion system. Prot. Control Mod. Power Syst. 2018, 3, 21. [Google Scholar] [CrossRef]
- Carpintero-Renteria, M.; Santos-Martin, D.; Lent, A.; Ramos, C. Wind turbine power coefficient models based on neural networks and polynomial fitting. IET Renew. Power Gener. 2020, 14, 1841–1849. [Google Scholar] [CrossRef]
- Yang, J.; Mu, A.; Li, N. Dynamical Analysis and Stabilization of Wind Turbine Drivetrain via Adaptive Fixed-Time Terminal Sliding Mode Controller. Math. Probl. Eng. 2019, 2019, 8982028. [Google Scholar] [CrossRef]
- Yang, D.; Jin, Z.; Zheng, T.; Jin, E. An adaptive droop control strategy with smooth rotor speed recovery capability for type III wind turbine generators. Int. J. Electr. Power Energy Syst. 2022, 135, 107532. [Google Scholar] [CrossRef]
- Bastiani, B.A.; de Oliveira, R.V. Adaptive MPPT control applied to virtual synchronous generator to extend the inertial response of type-4 wind turbine generators. Sustain. Energy Grids Netw. 2021, 27, 100504. [Google Scholar] [CrossRef]
- Peng, B.; Zhang, F.; Liang, J.; Ding, L.; Liang, Z.; Wu, Q. Coordinated control strategy for the short-term frequency response of a DFIG-ES system based on wind speed zone classification and fuzzy logic control. Int. J. Electr. Power Energy Syst. 2019, 107, 363–378. [Google Scholar] [CrossRef]
- Sreelekshmi, R.S.; Lakshmi, R.; Nair, M.G. AC microgrid with battery energy storage management under grid connected and islanded modes of operation. Energy Rep. 2022, 8, 350–357. [Google Scholar] [CrossRef]
- Liu, S.; Chen, J.; Zhang, C.; Jin, L.; Yang, Q. Experimental study on lithium-ion cell characteristics at different discharge rates. J. Energy Storage 2022, 45, 103418. [Google Scholar] [CrossRef]
- Han, S.; Tagayi, R.K.; Kim, J.; Kim, J. Adaptive deterministic approach for optimized sizing of high-energy battery system applied in electric-powered application. Appl. Energy 2022, 309, 118498. [Google Scholar] [CrossRef]
- Tagayi, R.K.; Kim, J. Binary-phase service battery energy storage system strategy for peak demand shaving and enhanced power quality. Sustain. Energy Technol. Assess. 2022, 52, 102328. [Google Scholar] [CrossRef]
- Li, T.; Wang, D.; Wang, H. New method for acquisition of impedance spectra from charge/discharge curves of lithium-ion batteries. J. Power Sources 2022, 535, 231483. [Google Scholar] [CrossRef]
- Shabani, H.R.; Kalantar, M. Real-time transient stability detection in the power system with high penetration of DFIG-based wind farms using transient energy function. Int. J. Electr. Power Energy Syst. 2021, 133, 107319. [Google Scholar] [CrossRef]
- Abdella, M.M.; Nassar, I.A. Parameters calculation of thermal power plant dynamic model using steam cycle data. Therm. Sci. Eng. Prog. 2019, 9, 259–265. [Google Scholar] [CrossRef]
- Yang, D.; Gao, H.-C.; Zhang, L.; Zheng, T.; Hua, L.; Zhang, X. Short-term frequency support of a doubly-fed induction generator based on an adaptive power reference function. Int. J. Electr. Power Energy Syst. 2020, 119, 105955. [Google Scholar] [CrossRef]
- Kaldellis, J.K.; Triantafyllou, P.; Stinis, P. Critical evaluation of Wind Turbines’ analytical wake models. Renew. Sustain. Energy Rev. 2021, 144, 110991. [Google Scholar] [CrossRef]
- Zhang, R.; Xin, Z.; Huang, G.; Yan, B.; Zhou, X. Characteristics and modelling of wake for aligned multiple turbines based on numerical simulation. J. Wind Eng. Ind. Aerodyn. 2022, 228, 105097. [Google Scholar] [CrossRef]
- González-Longatt, F.; Wall, P.; Terzija, V. Wake effect in wind farm performance: Steady-state and dynamic behavior. Renew. Energy 2012, 39, 329–338. [Google Scholar] [CrossRef]
Disclaimer/Publisher’s Note: The statements, opinions and data contained in all publications are solely those of the individual author(s) and contributor(s) and not of MDPI and/or the editor(s). MDPI and/or the editor(s) disclaim responsibility for any injury to people or property resulting from any ideas, methods, instructions or products referred to in the content. |
© 2023 by the authors. Licensee MDPI, Basel, Switzerland. This article is an open access article distributed under the terms and conditions of the Creative Commons Attribution (CC BY) license (https://creativecommons.org/licenses/by/4.0/).