Abstract
The practical applications of automatic recognition and categorization technology for next-generation systems are desired in the clinical laboratory. We approached the identification of reactive lymphocytosis using artificial intelligence (AI) technology and studied its clinical usefulness for blood smear screening. This study created one- and two-step AI models for the identification of reactive lymphocytosis. The ResNet-101 model was applied for deep learning. The original image set for supervised AI training consisted of 5765 typical nucleated blood cell images. The subjects for clinical assessment were 25 healthy cases, 25 erythroblast cases, and 25 reactive lymphocytosis cases. The total accuracy (mean ± standard deviation) of the one- and two-step models were 0.971 ± 0.047 and 0.977 ± 0.024 in healthy, 0.938 ± 0.040 and 0.978 ± 0.018 in erythroblast, and 0.856 ± 0.056 and 0.863 ± 0.069 in reactive lymphocytosis cases, respectively. The two-step AI model showed a sensitivity of 0.960 and a specificity of 1.000 between healthy and reactive lymphocytosis cases. As our two-step tandem AI model showed high performance for identifying reactive lymphocytosis in blood smear screening, we plan to apply this method to the development of AI models to differentiate reactive and neoplastic lymphocytosis.
1. Introduction
Artificial intelligence (AI) technology is rapidly developing as an automation technology based on human thought processes. Deep learning is one of the machine learning methods in which a computer performs intellectual training for understanding, reasoning, and prediction. Deep learning has multi-layered neural networks that imitate the human cranial nerve circuit by automatically extracting each feature contained in each data category through dozens to hundreds of training iterations. Deep learning detects latent features that humans overlook, making accurate and efficient judgment possible. The continued social implementation of AI technologies, such as automated driving and intelligent agriculture, is expected to contribute to vast improvements in safety and efficiency [1,2]. Moreover, many efforts have been started in the medical field. Research on medical AI technology is underway to assist diagnostic experts in fields such as radiological, pathological, and endoscopic image diagnoses [3,4]. Similarly, blood morphology diagnosis is one of the fields in which AI technology is desired to be applied clinically. At present, hematological diseases are diagnosed by performing leukocyte categorization under a microscope on peripheral blood or bone marrow smears. Then, experts (hematologists or clinical laboratory technologists) must identify normal blood cells, reactive blood cells, or neoplastic cells (e.g., leukemia, lymphoma, myelodysplastic syndrome). However, experts require a long training period to master the skill of leukocyte categorization. Therefore, the clinical laboratory strongly desires the practical application of automatic recognition and categorization technology. One representative automation technology for recognition and categorization is an automatic complete blood count (CBC) analyzer, which has fully automated blood cell counts and categorization. Flow cytometry technology is generally used in almost all CBC analyzers, which have been shown to have high throughput and efficiency in the clinical laboratory, and to be capable of obtaining high data counting accuracy in the case of normal blood cells [5,6]. However, neoplastic, immature, and reactive blood cells have been reported to show abnormal scattergram patterns, and the accuracy of calculation or categorization is known to be poor [7,8]. One of the most difficult diseases to differentiate in scattergram pattern analysis is lymphocytosis. Lymphocytosis is classified into neoplastic and reactive diseases and may be morphologically divided into polymorphic and monomorphic populations. Monomorphic populations are concerned with lymphoproliferative neoplasm (e.g., acute lymphoblastic leukemia [ALL], chronic lymphoblastic leukemia, or malignant lymphoma). ALL is a representative neoplastic tumor, and lymphoblastic cells have extremely high proliferative ability, so starting clinical treatment early strongly affects the patient’s prognosis. By contrast, polymorphic populations are consistent with a reactive process, so this is defined as reactive lymphocytosis [9]. Morphological changes in reactive lymphocytosis are observed as atypical lymphocytes that are activated or juvenilized by antigenic stimuli from external enemies such as viral infection (e.g., Epstein–Barr virus, cytomegalovirus, or severe acute respiratory syndrome coronavirus 2) [10]. While symptoms are weak in the early stages of viral infection, in the acute phase, when symptoms become apparent, treatment is difficult because the viral load in the body is extremely high. Therefore, the detection of atypical lymphocytes is critical for the early diagnosis and clinical treatment of reactive lymphocytosis associated with viral infection. However, distinguishing normal from atypical lymphocytes for morphological differentiation in hematological testing in the clinical laboratory is often difficult. According to the morphological criteria of the Standardization Committee of the Japanese Society for Laboratory Medicine and Hematology, atypical lymphocytes are characterized by a diameter of 16 μm or more, a relatively wide cytoplasm, a strongly basophilic color tone compared with normal lymphocytes, and the presence of azurophilic granules and vacuoles in the cytoplasm. The nuclei are round and may be transformed. Chromatin is concentrated, with a mixture of lymphocyte- and para-chromatin-like chromatin. Nucleoli may be present within the nucleus [11]. Because of these various morphological characteristics, Downey’s categorization, as a classical method, was developed as a subcategorization criterion. Quality control surveillance has shown that the recognition of atypical lymphocytes is more complicated compared with other cell categories (e.g., monocytes, normal lymphocytes, lymphoblasts, or erythroblasts), and is frequently judged differently, even by experts. In the past 10 years, numerous clinical application studies on AI technology for mature leukocyte categorization or neoplastic leukocytosis diagnosis have reported the high accuracy and usefulness of AI analysis [12,13,14]. Recent lymphocytosis experiments are shown in Table 1. Most studies have focused on neoplastic lymphocytosis, all achieving accuracy of more than 85% [15,16,17,18,19,20,21,22]. AI technology for neoplastic lymphocytosis has achieved high performance in clinical diagnosis and been proven to contribute to the diagnosis of neoplastic lymphocytosis at an early stage. However, although the highly accurate detection of atypical lymphocytes in hematological screening is essential for the diagnosis of viral infections at an early stage, few studies have been conducted on techniques for atypical lymphocyte screening applications using AI technology [19,20]. If AI diagnostic technologies for reactive lymphocytosis and their clinical utility can be identified, AI could also contribute to the diagnosis of other hematological diseases with polymorphic changes. Recently, the effectiveness of ensemble models for improving leukocyte recognition accuracy using AI has been reported [23,24,25]. Ensemble models are a method of improving accuracy by combining multiple models, mainly used in parallel combinations. Because reactive lymphocytosis involves atypical lymphocytes that display diverse morphologies, it may be more difficult to recognize compared with neoplastic leukocytosis, which displays monomorphic changes, when using a single AI model to compare multiple similar cell categories. Therefore, it may be possible to improve recognition accuracy by extracting only similar cell categories and combining multiple models. In the present study, we approached leukocyte categorization using two-step tandem AI models and assessed their clinical usefulness for the identification of reactive lymphocytosis at blood smear screening.

Table 1.
AI experiments in neoplastic or reactive lymphocytosis.
2. Materials
2.1. Subjects for Supervised Training
The study subjects for supervised training were 100 healthy cases, 20 erythroblast cases, and 30 reactive lymphocytosis cases. Erythroblast cases were defined as having a cutoff value of 3% or higher for the appearance of orthochromatic or polychromatic erythroblasts in the peripheral blood. Similarly, reactive lymphocytosis cases were defined as having a cutoff value of 3% or higher for the appearance of atypical lymphocytes in the peripheral blood. Thin-layer blood smears were prepared from peripheral blood supplemented with ethylenediaminetetraacetic acid dipotassium salt dihydrate (EDTA-2K).
2.2. Subjects for Clinical Assessment
The subjects for clinical assessment were 25 healthy cases, 25 erythroblast cases, and 25 reactive lymphocytosis cases. Erythroblast cases were defined as having a cutoff value of 3% or higher for the appearance of orthochromatic or polychromatic erythroblasts in the peripheral blood. Similarly, reactive lymphocytosis cases were defined as having a cutoff value of 3% or higher for the appearance of atypical lymphocytes in the peripheral blood. The thin-layer blood smears were prepared from peripheral blood supplemented with EDTA-2K.
2.3. Hardware and Software for Deep Learning
The hardware consisted of an Intel(R) Core (TM) i7-8700 3.2 GHz for CPU and NVIDIA GeForce RTX 3090 Ti with 24 GB memory for GPU (40 TFLOPS). NNabla (SONY) was used as the neural network library [26], and Anaconda 3.0 and Python 3.5 were used as the development environment. The ResNet-101 model was applied for deep learning [27]. AdaBound, AdaGrad, AMSGrad, and AMSBound were used for optimization methods. The layer structure and hyperparameters are shown in Figure 1.
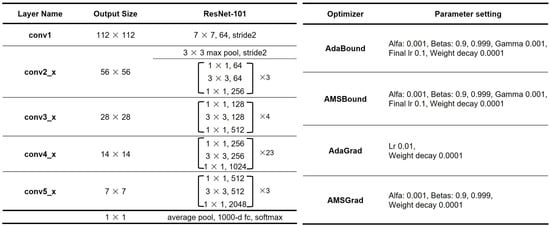
Figure 1.
Structure and hyperparameters.
3. Methods
The outline of this study is shown in Figure 2.
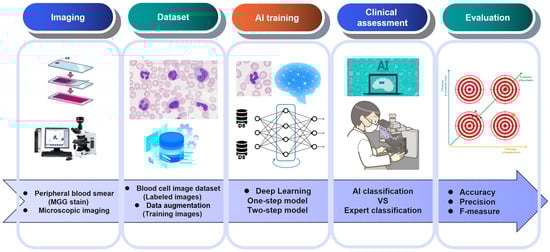
Figure 2.
Outline from microscopic imaging to clinical assessment.
3.1. Preparation of Stained Smears
Thin-layer blood smears were subjected to May–Grünwald–Giemsa (MGG) staining. The May–Grünwald and Giemsa solutions were manufactured by Merck & Co. (Rahway, NJ, USA). The MGG staining protocol and conditions are shown in Figure 3.
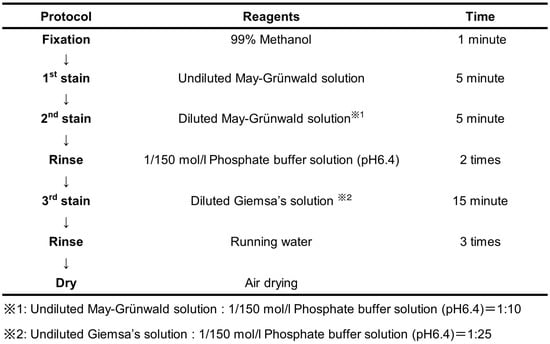
Figure 3.
Protocol and conditions of the MGG staining.
3.2. Microscopic Imaging
The MGG-stained smears were observed under a microscope using an objective 100× oil immersion lens. Leukocytes (200 images per smear slide) or nucleated erythroblasts were captured with a microscope color camera (Axiocam ERc5s; Carl Zeiss) and saved in JPG format (1920 × 2560 pixels). These images were then trimmed to 750 × 750 pixels as one nucleated blood cell/image.
3.3. Labeling of Nucleated Blood Cell Images
All images were classified into the following eight categories by three hematological experts: rod-shaped neutrophil (Band), segmental nucleus neutrophil (Segment), eosinophil (Eosino), basophil (Baso), monocyte (Mono), normal lymphocyte (Lymph), atypical lymphocyte (A-lymph), or erythroblast (EB). The leukocyte classification criteria followed the “shared standard range for leukocyte visual morphology classification” designated by the Japanese Society for Laboratory Hematology Committee for Standardization [28,29]. The morphological features of each category of the nucleated blood cell visual morphology classification are shown in Table 2 and Table 3.
Table 2.
Morphological features and typical images of normal nucleated blood cells.
Table 3.
Morphological features and typical images of atypical lymphocytes.
3.4. Preparation of Datasets for Supervised Training
A total of 40,000 nucleated blood cell images were captured with a microscope for supervised training. A total of 5765 of these 40,000 images that showed typical morphology in each cell category were randomly selected for the alignment of the balance of the number of cell images for each category in the data sets, and four types of data sets for supervised training—A, B, C, and D—were created. The blood cell configurations in the data sets are shown in Table 4. Next, 80% of the cell images randomly extracted from the data set were used for the training; these images were reduced from a resolution of 750 × 750 pixels to a resolution of 480 × 480 pixels. The remaining 20% were used for validation experiments; these images were reduced from 750 × 750 to 320 × 320 pixels.
Table 4.
Blood cell configurations in the data sets for AI training.
3.5. The Development of AI Models for the Identification of Reactive Lymphocytosis Cases
The outline of the AI models developed for the identification of reactive lymphocytosis cases is shown in Figure 4. The structure of the convolutional neural network (CNN) for reactive lymphocytosis diagnosis is shown in Figure 5. In this study, two types of screening AI models were created (one- and two-step models), and their levels of accuracy were compared by hematological experts. The one-step screening model classifies cases into seven cell categories (Neutrophil (Band and Segment)/Eosino/Baso/Mono/Lymph/A-lymph/EB), whereas the two-step model is a tandem AI model consisting of a first model for normal nucleated blood cell classification and two types of second models for subcategory classification and verification. The first model classifies cases into six cell categories (Neutrophil (Band and Segment)/Eosino/Baso/Mono/Lymph/EB), whereas the second classifies cases into three cell categories (Lymph/A-lymph/EB or Mono/Lymph/A-lymph). Data augmentation processing was performed to increase the number of training images in all AI models. Rotation or inversion processing was applied to the randomly selected original image. Any of the optimization methods (AdaBound/AdaGrad/AMSGrad/AMSBound), which showed the highest accuracy in validation experiments, were selected as the optimizer for the best model in the clinical assessments.
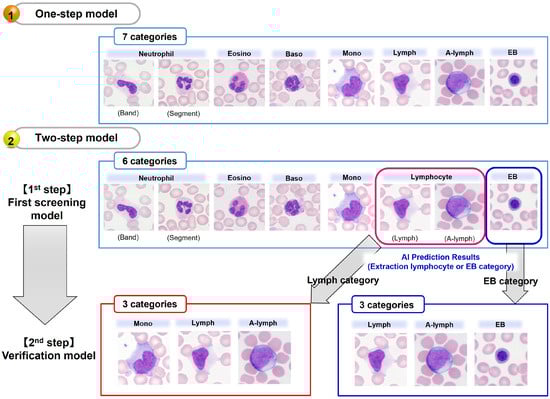
Figure 4.
Outline of the detection of reactive lymphocytes using a one- or two-step AI model.
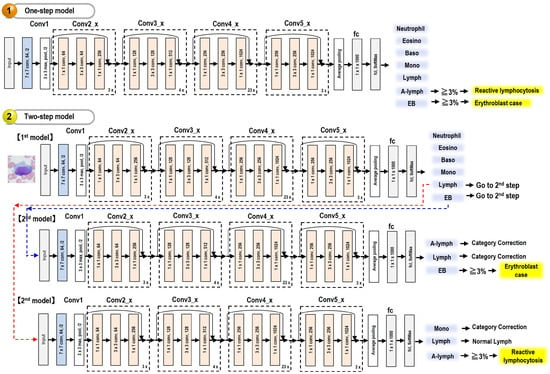
Figure 5.
Structure of the convolutional neural network for reactive lymphocytosis diagnosis.
3.5.1. One-Step Model
This model consists of only one ResNet-101 model and classifies leukocytes into seven categories. The hyperparameters are shown in Figure 1, and the blood cell configurations in the data sets for supervised training are shown in Table 4. The transfer learning and fine-tuning were performed at 500 epochs using training data set A.
3.5.2. Two-Step Model
This model consists of three ResNet-101 models. The hyperparameters are shown in Figure 1, and the blood cell configurations in the data sets for supervised training are shown in Table 4.
- (1)
- The first model for normal nucleated blood cell classification
This model consists of only one ResNet-101 model and classifies leukocytes into six categories. The transfer learning and fine-tuning for the first AI model were performed at 500 epochs using training data set B.
- (2)
- The second model for subcategory classification and verification
This model consists of two ResNet-101 models and classifies leukocytes into three categories. The transfer learning and fine-tuning for the second AI model were performed at 500 epochs using training data set C or D.
3.6. Clinical Assessment of AI Models for Reactive Lymphocyte Detection
A total of 13,555 nucleated blood cell images (3212 images of healthy cases, 5252 images of erythroblast cases, and 5091 images of reactive lymphocytosis cases) were captured with a microscope for clinical assessment. The blood cell configurations for the clinical assessments are shown in Table 5. All images were reduced from a resolution of 750 × 750 pixels to a resolution of 320 × 320 pixels. The AI model used for the clinical assessment is the one that showed the lowest error value in the validation experiments. We performed clinical assessments with both the one- and two-step models. We calculated representative indicators (total accuracy, recall, precision, and F-measure), which were compared statistically. Statistical analysis was performed using IBM SPSS Statistics 29, and p-values less than 0.05 were considered statistically significant. The validity of the two models as screening technologies was compared, with sensitivity and nonspecificity calculated across case groups.
Table 5.
Blood cell configurations for clinical assessment.
4. Results
4.1. Validation Experiments of the AI Model
The best validation error for each optimization method in the validation experiment is shown in Table 6.
Table 6.
Best validation error for each optimization method in the validation experiment.
4.1.1. One-Step Model
The AMSGrad method (best validation error = 0.0963, 379 epochs) showed the highest accuracy among the four optimization methods in the validation experiment.
4.1.2. Two-Step Model
- (1)
- The first model for normal nucleated blood cell classification
The AdaGrad method (best validation error = 0.0660, 133 epochs) showed the highest accuracy of the four optimization methods in the validation experiment.
- (2)
- The second model for subcategory classification and verification
The AdaGrad method (best validation error = 0.0313, 376 epochs) showed the highest accuracy among the four optimization methods in the validation experiment with second model 1 for EB verification. The AMSBound method (validation error = 0.0558, 237 epochs) showed the highest accuracy among the four optimization methods in the validation experiment with second model 2 for subcategory classification of lymphocytes.
4.2. Clinical Assessments of the AI Model
4.2.1. Analysis of Healthy Cases
Table 7 shows a classification matrix table between experts and the one-step AI model, and Table 8 shows a classification matrix table between experts and the two-step AI model. The one-step AI model showed total accuracy, average recall, average precision, and average F-measure of 0.972, 0.986, 0.867, and 0.900, respectively. By contrast, the two-step AI model showed values of 0.977, 0.988, 0.870, and 0.914, respectively. All indicators of total accuracy (+0.005), average recall (+0.002), average precision (+0.003), and average F-measure (+0.014) showed improvement in the two-step AI model.
Table 7.
Clinical Assessment of the one-step AI model for the healthy cases.
Table 8.
Clinical Assessment of the two-step AI model for the healthy cases.
4.2.2. Analysis of Erythroblast Cases
Table 9 shows a classification matrix table between experts and the one-step AI model, and Table 10 shows a classification matrix table between experts and the two-step AI model. The one-step AI model showed total accuracy, average recall, average precision, and average F-measure of 0.943, 0.950, 0.801, and 0.830, respectively. By contrast, the two-step AI model showed values of 0.979, 0.977, 0.924, and 0.943, respectively. All indicators of total accuracy (+0.036), average recall (+0.027), average precision (+0.123), and average F-measure (+0.113) showed improvement in the two-step AI model.
Table 9.
Clinical Assessment of the one-step AI model for the erythroblast cases.
Table 10.
Clinical Assessment of the two-step AI model for the erythroblast cases.
4.2.3. Analysis of Reactive Lymphocytosis Cases
Table 11 shows a classification matrix table between experts and the one-step AI model, and Table 12 shows a classification matrix table between experts and the two-step AI model. The one-step AI model showed total accuracy, average recall, average precision, and average F-measure of 0.857, 0.889, 0.793, and 0.803, respectively. By contrast, the two-step AI model showed values of 0.863, 0.913, 0.841, and 0.869, respectively. All indicators of total accuracy (+0.006), average recall (+0.024), average precision (+0.048), and average F-measure (+0.066) showed improvement in the two-step AI model.
Table 11.
Clinical Assessment of the one-step AI model for the reactive lymphocytosis cases.
Table 12.
Clinical Assessment of the two-step AI model for the reactive lymphocytosis cases.
Figure 6 shows the recall, precision, and F-measure distribution of the A-lymph category in the clinical assessments. The one- and two-step models showed 0.594 ± 0.192 (mean ± standard deviation [SD]) and 0.680 ± 0.174 for recall, 0.813 ± 0.124 and 0.759 ± 0.173 for precision, and 0.672 ± 0.169 and 0.712 ± 0.164 for the F-measure, respectively. A significant improvement in recall was found (p < 0.01). Figure 7 shows representative images classified into the lymph or A-lymph category by experts and the two-step AI model. A-lymph with strong cytoplasmic basophilia or with moderate cytoplasmic basophilia and intense atypical nuclear changes (appearance of many nucleoli or agglutinated nuclei) were classified into the A-lymph category by both experts and the AI model. Lymph from small to medium size was also classified into the Lymph category by both experts and the AI model. By contrast, large Lymph with mild cytoplasmic basophilia but without atypical nuclear changes was misclassified into A-lymph, and A-lymph with mild cytoplasmic basophilia and atypical nuclear changes was misclassified into Lymph by the AI model. In addition, part of large Lymph or monocyte-like A-lymph (Type I) was misclassified into the Mono category by the AI model.
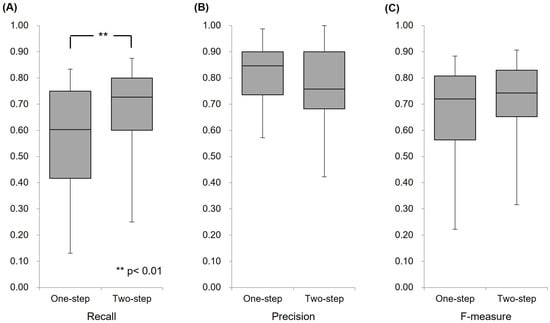
Figure 6.
Comparison of the one- and two-step AI models for the A-lymph category. (A) Distribution of recall for cases. (B) Distribution of precision for cases. (C) Distribution of F-measure for cases.
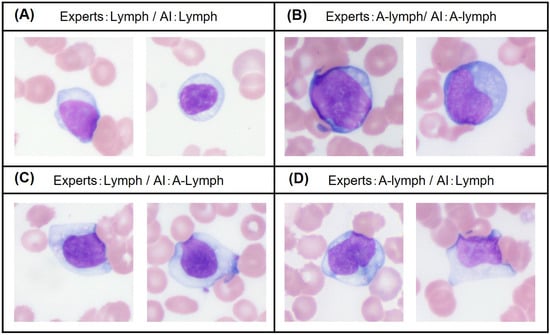
Figure 7.
Comparison of representative images classified into the Lymph or A-lymph category.
4.2.4. Comparison of Case Group Identification Performance in Clinical Assessments
Figure 8 shows the total accuracy distribution of each case group in the clinical assessments. The accuracy of one- and two-step models showed 0.971 ± 0.047 (mean ± SD) and 0.977 ± 0.024 in the analysis of healthy cases, 0.938 ± 0.040 and 0.978 ± 0.018 in the analysis of erythroblast cases, and 0.856 ± 0.056 and 0.863 ± 0.069 in the analysis of atypical lymphocytosis cases, respectively. Significant improvement was observed for the erythroblast cases (p < 0.01). However, no significant improvement was observed for the reactive lymphocytosis cases (p = 0.417). The identification accuracy at the case level is shown in Table 10. The concordance accuracy for cell classification may be biased toward detecting some cases with a high appearance rate (missed detection with a low appearance rate), and the occurrence of false-negative cases cannot be denied. Conversely, the diagnostic concordance accuracy at the case level reflects the power to detect borderline cases with a low atypical lymphocyte appearance rate (3%–5%). Table 13 shows a matrix table for the identification of erythroblast cases with the one- and two-step AI model. Both the one- and two-step AI models showed sensitivity, specificity, positive predictive ratio, negative predictive ratio, and efficiency of 1.000, 1.000, 1.000, 1.000, and 1.000, respectively. No differences in the identification of erythroblast cases were observed between the one- and two-step AI models. Table 14 shows a matrix table for the identification of reactive lymphocytosis cases with the one- and two-step AI model. The one-step AI model showed sensitivity, specificity, positive predictive ratio, negative predictive ratio, and efficiency of 0.880, 1.000, 1.000, 0.893, and 0.893, respectively. By contrast, the two-step AI model showed values of 0.960, 1.000, 0.962, 1.000, and 0.962, respectively. Improved sensitivity, negative predictive ratio, and efficiency in the identification of reactive lymphocytosis cases were observed between the one- and two-step AI models.
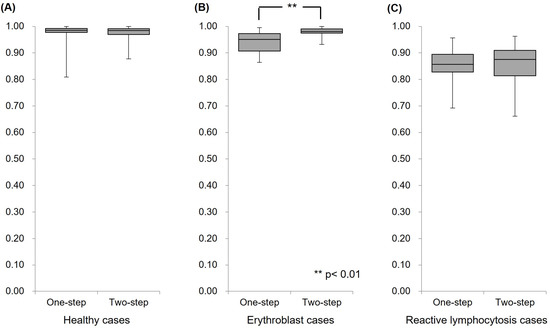
Figure 8.
Comparison of the one- and two-step AI models in the clinical assessments.
Table 13.
Comparison of identification performance in the erythroblast cases.
Table 14.
Comparison of identification performance in the reactive lymphocytosis cases.
5. Discussion
In this study, we approached leukocyte categorizations using two types of AI models and assessed their clinical usefulness for the identification of reactive lymphocytosis at blood smear screening. The one-step model was a direct classification AI model that classified leukocytes with normal and atypical morphologies in a single process. By contrast, the two-step model classified normal leukocytes regardless of atypicality or abnormality in the first step, and identified normal cells, atypical cells, or other similarly morphed cells only in a specific cell category in the second step. The two-step model showed higher performance than the one-step model for all indicators (total accuracy, recall, precision, and F-measures) in the clinical assessments of healthy, erythroblast, and reactive lymphocytosis cases. The two-step model also showed higher performance than the one-step model in detecting atypical lymphocytes (+0.086 for recall and +0.04 for the F-measure). These results suggest that compared with a single AI model, a tandem combination of multiple AI models is more effective for improving AI performance in leukocyte classification. In addition, both sensitivity and specificity are representative clinical indicators for screening tests, and a highly sensitive test method is important and efficient for screening tests. Because the main purpose of a screening test is to prevent atypical or abnormal cells from being missed, even if over-detection occurs in the screening test, this can be verified in a subsequent definitive test by experts. The two-step approach greatly improved the sensitivity, from 0.880 to 0.960. Bigorra et al. [30] reported that the pattern-matching leukocyte classification system currently in operation in clinical laboratories is only 80% accurate for reactive lymphocytosis. Therefore, in the present study, the tandem combination of multiple AI models was proven to be effective for improving reactive lymphocytosis identification. This means that the method can contribute to the prevention of reactive lymphocytosis from being overlooked in peripheral blood smear screening. The benefits of multiple AI model combinations have been reported by Claro, M.L. et al. [25], who studied multiple CNNs connected by parallel linkages in leukemia classification and reported that a combination of methods helped reduce the error variance of the predictions, which improves the accuracy of deep learning-based models. Chen, Y.M. et al. [15] reported that the parallel combined ensemble model with Resnet-101 had superior accuracy. In their study, they achieved 85.11% accuracy in ALL classifications using the ResNet101-9 ensemble model. Although their targets were ALL and differed in terms of parallel combination, their goals were consistent with those of the present study in terms of multiple Resnet-101 binding models. The classification accuracy of their method approximated that of the present study. However, it did not reach the level of the hybrid model reported by Abunadi, I. et al. [17], who combined several different layered models. This suggests that combining CNN models with different layers in our proposed tandem combination may be effective for improving accuracy. Most ensemble methods involve a parallel connection of multiple AI models for the same leukocyte classification number at the final process, whereas our method involves a tandem connection of a rough leukocyte classification model and a fine identification model limited to a specific cell category. However, both studies showed similar results in terms of improved accuracy by combining multiple AI models, which supports the validity of our proposed method. Our proposed method limits the leukocyte classification categories to a small number of morphologically similar categories, which we presume allows for the detection of features that are valid only for identification between specific cells. Despite the same training data, the number of A-lymph detections increased from 720 to 822 with the two-step model; therefore, it is clear that a differently weighted AI model was generated. Similarly, the number of misclassifications from A-lymph to Lymph decreased from 361 to 192 with the two-step model, while the number of misclassifications to Mono increased from 37 to 104; therefore, it is clear that different features were recognized. However, while improved sensitivity can be useful in terms of preventing missed cells, over-detection by automated technologies may lead to the need for retesting by experts. Therefore, we consider that this model needs improved precision for atypical lymphocytes in terms of efficiency. Concerning the causes of over-detection in clinical assessments, some trends have been found in cell classification (Figure 6). Our results indicated that A-lymph with strong cytoplasmic basophilia or A-lymph with moderate cytoplasmic basophilia and intense atypical nuclear changes (appearance of many nucleoli or agglutinated nuclei) was able to be classified accurately (Figure 7A,B). By contrast, normal large Lymph with mild cytoplasmic basophilia but without atypical nuclear changes was misclassified into A-lymph, and A-lymph with mild cytoplasmic basophilia and atypical nuclear changes was misclassified into normal Lymph by the AI model (Figure 7C,D). Identifying atypical lymphocytes is based on a comprehensive rating of two factors: nuclear structure and the level of basophilia of the cytoplasm. It is presumed that plasma cell- or lymphoblast-like A-lymph could be easily identified from normal lymphocytes because these cells have strong cytoplasmic basophilia. On the contrary, Mono, normal large Lymph, and monocyte-like A-lymph show remarkably similar morphology. It is suggested that misclassification may occur with moderate cytoplasmic basophilia in these borderline morphological cases. Therefore, it may be necessary to consider cutoff values for average basophilic levels and to reconstruct the data set for AI training based on Downey subclassification to obtain high accuracy and precision. This is supported by Kim, D.H. et al. [31], who reported that setting cutoff values to maximize sensitivity and specificity improves the accuracy of AI analysis. In addition, the establishment of borderline classifications may also be useful in limiting the number of cells to be retested by experts. Malignant cell screening performed as a noninvasive test of solid tumors (e.g., uterine cancer, lung cancer, or urologic tumors) in cytopathology is a representative example. The Papanicolaou Classification or Bethesda System is used as a grading system in cancer cell screening [32,33,34]. These grading systems contain a malignant suspect category, intermediate between normal and malignant, which allows retests to be limited to borderline cells. The current visual blood morphology classification does not define “suspicious” as a separate category and differs from the malignant cell classification in cytopathological diagnosis. However, because AI classification is based on statistical probability, it may be necessary to indicate “suspicious” when the predicted classification of two cell groups is close. As with the detection of A-lymph, ALL is also a hematological disease that is difficult to classify. Abir, W.H. et al. [35] proposed implementing explainable AI techniques (XAI) for classifying ALL. Several studies have reported using XAI techniques to visualize the causes of leukocyte misclassification in case studies other than ALL [36,37,38]. Grad-CAM and LIME methods are known as visualization AI techniques that can confirm the presence of misinterpretations by AI regarding feature extraction locations and importance. Therefore, visualization AI technology is expected to be used in conjunction with this AI model to improve the efficiency of double-checking by experts.
6. Conclusions
In the present study, our two-step tandem AI model achieved a sensitivity of 0.960 and a specificity of 1.000 between healthy and reactive lymphocytosis cases. It also showed high performance for identifying reactive lymphocytosis in blood smear screening. As the clinical utility of this AI model was identified, we believe tandem combination methods with stepwise limitation of cell classification categories contribute to a diagnosis of reactive lymphocytosis at an early stage. Moreover, this method could also be expected to contribute to the improvement of the diagnostic technology for other hematological diseases with polymorphic changes.
Author Contributions
Conceptualization, H.N.; methodology, H.N.; validation, H.N.; investigation, H.N.; resources, M.K., K.K.; data curation, H.N., M.K.; writing—original draft preparation, H.N.; writing—review and editing, K.Y., K.K.; supervision, H.N., K.Y.; project administration, H.N.; funding acquisition, H.N., K.Y. All authors have read and agreed to the published version of the manuscript.
Funding
This study was supported by Grants-in-Aid for Scientific Research (KAKENHI; Grant Nos.: 19K21737, 21H00894, 22K18573, and 22K02799) from the Japan Society for the Promotion of Science.
Institutional Review Board Statement
This study was conducted in accordance with the Declaration of Helsinki. It was approved by the Committee of Medical Ethics of Hirosaki University Graduate School of Health Sciences (Approval No.: 2021-005) and carried out according to the ethical guidelines for medical and biological research involving human subjects.
Informed Consent Statement
Informed consent was obtained from all subjects in the form of an online opt-out (https://www.med.hirosaki-u.ac.jp/hospital/outline/resarch.html) (accessed on 1 March 2023).
Data Availability Statement
Not applicable.
Acknowledgments
The authors would like to thank Sayaka Souma, Shizuku Hirano, Suzuka Saga, Niina Sakaiya, and Shou Kimura for their technical assistance with the experiments. We also thank Ami Sasaki, Miku Oda, Honoka Harako, and Mae Miyazaki for collaborating on the early stages of this work. Finally, we are grateful to the referees and clinical laboratory technologists of Hirosaki University Hospital for their helpful comments.
Conflicts of Interest
The authors declare no conflict of interest.
References
- Zahid, H.; Rizwana, K.; Shariq, B.; Ghulam, A. Artificial intelligence techniques for driving safety and vehicle crash prediction. Artif. Intell. Rev. 2016, 46, 351–387. [Google Scholar] [CrossRef]
- Konstantinos, G.L.; Patrizia, B.; Dimitrios, M.; Simon, P.; Dionysis, B. Machine Learning in Agriculture. Sensors 2018, 18, 2674. [Google Scholar] [CrossRef]
- Jianxing, H.; Sally, L.B.; Jie, X.; Jiming, X.; Xingtao, Z.; Kang, Z. The practical implementation of artificial intelligence technologies in medicine. Nat. Med. 2019, 25, 30–36. [Google Scholar] [CrossRef]
- Heang-Ping, C.; Ravi, K.S.; Lubomir, M.H.; Chuan, Z. Deep Learning in Medical Image Analysis. Adv. Exp. Med. Biol. 2020, 1213, 3–21. [Google Scholar] [CrossRef]
- Chabot-Richards, D.S.; George, T.I. White blood cell counts: Reference methodology. Clin. Lab. Med. 2015, 35, 11–24. [Google Scholar] [CrossRef]
- Edward, C.C.W. Hematology analyzers: Special considerations for pediatric patients. Clin. Lab. Med. 2015, 35, 165–181. [Google Scholar] [CrossRef]
- Gene, G.; Guldeep, U.; Jerald, G. Unreliable Automated Complete Blood Count Results: Causes, Recognition, and Resolution. Ann. Lab. Med. 2022, 42, 515–530. [Google Scholar] [CrossRef]
- Zandecki, M.; Genevieve, F.; Gerard, J.; Godon, A. Spurious counts and spurious results on haematology analysers: A review. Part II: White blood cells, red blood cells, haemoglobin, red cell indices and reticulocytes. Int. J. Hematol. 2007, 29, 21–41. [Google Scholar] [CrossRef]
- Chabot-Richards, D.S.; George, T.I. Leukocytosis. Int. J. Lab. Hematol. 2014, 36, 279–288. [Google Scholar] [CrossRef]
- Page, W.; Eric, S.W. Leukocytosis and Leukemia. Prim. Care 2016, 43, 575–587. [Google Scholar] [CrossRef]
- Amer, W.; Amitava, D. Complete Blood Count and Peripheral Smear Examination. In Hematology and Coagulation, 1st ed.; Elsevier: Amsterdam, The Netherlands, 2015; pp. 1–14. [Google Scholar] [CrossRef]
- Yapin, W.; Yiping, C. Human peripheral blood leukocyte classification method based on convolutional neural network and data augmentation. Med. Phys. 2020, 47, 142–151. [Google Scholar] [CrossRef]
- Qiwei, W.; Shusheng, B.; Minglei, S.; Yuliang, W.; Di, W.; Shaobao, Y. Deep learning approach to peripheral leukocyte recognition. PLoS ONE 2019, 14, e0218808. [Google Scholar] [CrossRef]
- Lei, J.; Chang, T.; Hua, Z. White blood cell classification via a discriminative region detection assisted feature aggregation network. Biomed. Opt. Express 2022, 13, 5246–5260. [Google Scholar] [CrossRef]
- Chen, Y.M.; Chou, F.I.; Ho, W.H.; Tsai, J.T. Classifying microscopic images as acute lymphoblastic leukemia by Resnet ensemble model and Taguchi method. BMC Bioinform. 2022, 22, 615. [Google Scholar] [CrossRef] [PubMed]
- Jawahar, M.; H, S.; L, J.A.; Gandomi, A.H. ALNett: A cluster layer deep convolutional neural network for acute lymphoblastic leukemia classification. Comput. Biol. Med. 2022, 148, 105894. [Google Scholar] [CrossRef] [PubMed]
- Abunadi, I.; Senan, E.M. Multi-Method Diagnosis of Blood Microscopic Sample for Early Detection of Acute Lymphoblastic Leukemia Based on Deep Learning and Hybrid Techniques. Sensors 2022, 22, 1629. [Google Scholar] [CrossRef] [PubMed]
- Musleh, S.; Islam, M.T.; Alam, M.T.; Househ, M.; Shah, Z.; Alam, T. ALLD: Acute Lymphoblastic Leukemia Detector. Stud. Health Technol. Inform. 2022, 289, 77–80. [Google Scholar] [CrossRef] [PubMed]
- Bigorra, L.; Larriba, I.; Gutiérrez-Gallego, R. A Physician-in-the-Loop Approach by Means of Machine Learning for the Diagnosis of Lymphocytosis in the Clinical Laboratory. Arch. Pathol. Lab. Med. 2022, 146, 1024–1031. [Google Scholar] [CrossRef]
- Sahasrabudhe, M.; Sujobert, P.; Zacharaki, E.I.; Maurin, E.; Grange, B.; Jallades, L.; Paragios, N.; Vakalopoulou, M. Deep Multi-Instance Learning Using Multi-Modal Data for Diagnosis of Lymphocytosis. IEEE J. Biomed. Health Inform. 2021, 25, 2125–2136. [Google Scholar] [CrossRef]
- Pałczyński, K.; Śmigiel, S.; Gackowska, M.; Ledziński, D.; Bujnowski, S.; Lutowski, Z. IoT Application of Transfer Learning in Hybrid Artificial Intelligence Systems for Acute Lymphoblastic Leukemia Classification. Sensors 2021, 21, 8025. [Google Scholar] [CrossRef]
- Rezayi, S.; Mohammadzadeh, N.; Bouraghi, H.; Saeedi, S.; Mohammadpour, A. Timely Diagnosis of Acute Lymphoblastic Leukemia Using Artificial Intelligence-Oriented Deep Learning Methods. Comput. Intell. Neurosci. 2021, 2021, 5478157. [Google Scholar] [CrossRef] [PubMed]
- Jiang, Z.; Dong, Z.; Wang, L.; Jiang, W. Method for Diagnosis of Acute Lymphoblastic Leukemia Based on ViT-CNN Ensemble Model. Comput. Intell. Neurosci. 2021, 2021, 7529893. [Google Scholar] [CrossRef] [PubMed]
- Mishra, S.; Shaw, K.; Mishra, D.; Patil, S.; Kotecha, K.; Kumar, S.; Bajaj, S. Improving the Accuracy of Ensemble Machine Learning Classification Models Using a Novel Bit-Fusion Algorithm for Healthcare AI Systems. Front. Public Health 2022, 10, 858282. [Google Scholar] [CrossRef] [PubMed]
- Claro, M.L.; Veras, R.M.S.; Santana, A.M.; Vogado, L.H.S.; Braz, J.G.; Medeiros, F.N.S.; Tavares, J.M.R.S. Assessing the impact of data augmentation and a combination of CNNs on leukemia classification. Inf. Sci. 2022, 609, 1010–1029. [Google Scholar] [CrossRef]
- Takuya, N.; Javier, A.; Fabien, C.; Akio, H.; Masato, I.; Kazunori, I.; Thomas, K.; Yoshiyuki, K.; Lukas, M.; Akira, N.; et al. Neural Network Libraries: A Deep Learning Framework Designed from Engineers’ Perspectives. arXiv 2021, arXiv:2102.06725. [Google Scholar]
- Kaiming, H.; Xiangyu, Z.; Shaoqing, R.; Jian, S. Deep Residual Learning for Image Recognition. arXiv 2015, arXiv:1512.03385. [Google Scholar]
- Tohyama, K. Present status and perspective of laboratory hematology in Japan: On the standardization of blood cell morphology including myelodysplasia. Int. J. Lab. Hematol. 2018, 40, 120–125. [Google Scholar] [CrossRef] [PubMed]
- Palmer, L.; Briggs, C.; McFadden, S.; Zini, G.; Burthem, J.; Rozenberg, G.; Proytcheva, M.; Machin, S.J. ICSH recommendations for the standardization of nomenclature and grading of peripheral blood cell morphological features. Int. J. Lab. Hematol. 2015, 37, 287–303. [Google Scholar] [CrossRef]
- Bigorra, L.; Merino, A.; Alférez, S.; Rodellar, J. Feature Analysis and Automatic Identification of Leukemic Lineage Blast Cells and Reactive Lymphoid Cells from Peripheral Blood Cell Images. J. Clin. Lab. Anal. 2017, 31, e22024. [Google Scholar] [CrossRef]
- Kim, D.H.; MacKinnon, T. Artificial intelligence in fracture detection: Transfer learning from deep convolutional neural networks. Clin. Radiol. 2018, 73, 439–445. [Google Scholar] [CrossRef]
- Lester, J.L.; Magda, E. A modified Papanicolaou Society of Cytopathology system for reporting respiratory cytology specimens: Implications for estimates of malignancy risk and diagnostic accuracy. Diagn. Cytopathol. 2021, 49, 1167–1172. [Google Scholar] [CrossRef]
- Nayar, R.; Wilbur, D.C. The Pap test and Bethesda 2014. Cancer Cytopathol. 2015, 123, 271–281. [Google Scholar] [CrossRef] [PubMed]
- Raza, S.H.; Elizabeth, B.F.; Ronald, N.A., 3rd; Matthew, R.; Martha, B.P. Risk of malignancy in the categories of the Papanicolaou Society of Cytopathology system for reporting pancreaticobiliary cytology. J. Am. Soc. Cytopathol. 2019, 8, 120–127. [Google Scholar] [CrossRef]
- Abir, W.H.; Uddin, M.F.; Khanam, F.R.; Tazin, T.; Khan, M.M.; Masud, M.; Aljahdali, S. Explainable AI in Diagnosing and Anticipating Leukemia Using Transfer Learning Method. Comput. Intell. Neurosci. 2022, 2022, 5140148. [Google Scholar] [CrossRef] [PubMed]
- Deshpande, N.M.; Gite, S.; Aluvalu, R. A review of microscopic analysis of blood cells for disease detection with AI perspective. PeerJ Comput. Sci. 2021, 7, e460. [Google Scholar] [CrossRef] [PubMed]
- Chen, H.; Liu, J.; Hua, C.; Feng, J.; Pang, B.; Cao, D.; Li, C. Accurate classification of white blood cells by coupling pre-trained ResNet and DenseNet with SCAM mechanism. BMC Bioinform. 2022, 23, 282. [Google Scholar] [CrossRef]
- Wang, Z.; Xiao, J.; Li, J.; Li, H.; Wang, L. WBC-AMNet: Automatic classification of WBC images using deep feature fusion network based on focalized attention mechanism. PLoS ONE 2022, 17, e0261848. [Google Scholar] [CrossRef]


Disclaimer/Publisher’s Note: The statements, opinions and data contained in all publications are solely those of the individual author(s) and contributor(s) and not of MDPI and/or the editor(s). MDPI and/or the editor(s) disclaim responsibility for any injury to people or property resulting from any ideas, methods, instructions or products referred to in the content. |
© 2023 by the authors. Licensee MDPI, Basel, Switzerland. This article is an open access article distributed under the terms and conditions of the Creative Commons Attribution (CC BY) license (https://creativecommons.org/licenses/by/4.0/).