Article

AMP-GSM: Prediction of Antimicrobial Peptides via a Grouping–Scoring–Modeling Approach

by
Ümmü Gülsüm Söylemez
1,2,
Malik Yousef
3,* and
Burcu Bakir-Gungor
2,*
1
Department of Software Engineering, Faculty of Engineering, Muş Alparslan University, Muş 49100, Turkey
2
Department of Computer Engineering, Faculty of Engineering, Abdullah Gul University, Kayseri 38170, Turkey
3
Department of Information Systems, Zefat Academic College, Zefat 13206, Israel
*
Authors to whom correspondence should be addressed.
Appl. Sci. 2023, 13(8), 5106; https://doi.org/10.3390/app13085106
Submission received: 1 March 2023 / Revised: 28 March 2023 / Accepted: 31 March 2023 / Published: 19 April 2023

Abstract

:
Due to the increasing resistance of bacteria to antibiotics, scientists began seeking new solutions against this problem. One of the most promising solutions in this field are antimicrobial peptides (AMP). To identify antimicrobial peptides, and to aid the design and production of novel antimicrobial peptides, there is a growing interest in the development of computational prediction approaches, in parallel with the studies performing wet-lab experiments. The computational approaches aim to understand what controls antimicrobial activity from the perspective of machine learning, and to uncover the biological properties that define antimicrobial activity. Throughout this study, we aim to develop a novel prediction approach that can identify peptides with high antimicrobial activity against selected target bacteria. Along this line, we propose a novel method called AMP-GSM (antimicrobial peptide-grouping–scoring–modeling). AMP-GSM includes three main components: grouping, scoring, and modeling. The grouping component creates sub-datasets via placing the physicochemical, linguistic, sequence, and structure-based features into different groups. The scoring component gives a score for each group according to their ability to distinguish whether it is an antimicrobial peptide or not. As the final part of our method, the model built using the top-ranked groups is evaluated (modeling component). The method was tested for three AMP prediction datasets, and the prediction performance of AMP-GSM was comparatively evaluated with several feature selection methods and several classifiers. When we used 10 features (which are members of the physicochemical group), we obtained the highest area under curve (AUC) value for both the Gram-negative (99%) and Gram-positive (98%) datasets. AMP-GSM investigates the most significant feature groups that improve AMP prediction. A number of physico-chemical features from the AMP-GSM’s final selection demonstrate how important these variables are in terms of defining peptide characteristics and how they should be taken into account when creating models to predict peptide activity.

1. Introduction

Antimicrobial peptides (AMPs) are one of the most effective ways to fight against the infections of living things that may occur due to the microorganisms living in the environment. Hence, AMPs are an important part of the natural immune system [1]. These peptides serve as potent broad-acting antibiotics that are capable of acting on potential pathogens. Antimicrobial peptides have also been shown to kill Gram-negative and Gram-positive bacteria, mycobacteria, viruses, fungi, and even altered and cancerous cells. Unlike most ordinary antibiotics, antimicrobial peptides may also have the ability to enhance immunity by acting as immune modifiers [1]. Antimicrobial peptides are generally short proteins with a length varying between 12 to 50 amino acid (aa)s.
A number of databases have been recently introduced that provide details about AMPs and their functions. These databases include DBAASP [2], CAMP [3], YADAMP [4], LAMP [5], and DRAMP [6].
In recent years, different computational methods have been developed to predict antimicrobial peptides. As machine learning is utilized to solve numerous biological problems, it has also gained popularity for AMP prediction problems. In this problem setting, a query protein is predicted as AMP or non-AMP via analyzing its biological features. These features can be generated from the protein sequence or protein structure. The classification model can be used to score the peptides and hence it can help the selection of the peptide with the highest antimicrobial activity. By selecting the best candidate AMP before synthesis and then by testing it against pathogens in the wet lab, computational methods aid in developing effective antimicrobial drugs.
Various machine learning algorithms have been applied to this problem, including support vector machines (SVM) [3,7,8,9], random forests (RF) [3], artificial neural networks (ANN) [3,8,10], and logistic regression [11,12]. Additionally, there are a few comprehensive studies that employ multiple ML models simultaneously to have a better understanding of how well ML methods work for AMP prediction [13,14]. For the prediction of AMPs in different organisms, such as bacteria, fish, insects, plants and humans, Chung et al. [15] built a model using amino acid compositions, amino acids pairs, and physico-chemical characteristics as features, with RF, SVM, and k-nearest neighbor (k-NN) as the classification algorithms. They also tested the effect of different feature selection techniques. According to their findings, RF produced the best outcome, with over 92% accuracy on all tested organisms. Kavousi et al. designed a model called IAMPE for the prediction of AMPs [16]. In this model, using the AMP datasets obtained from different databases, such as CAMP [3], LAMP [5], and AntiBP [10], the classification system was built using naive Bayes (NB), k-NN, SVM, RF, and extreme gradient boosting (XGBoost) classifiers based on the composition and physico-chemical characteristics of peptides. On the benchmark dataset, the combined features achieved 95% accuracy. Xu et al. [17] reported a comprehensive study based on ML methods to predict AMPs. Using five-fold cross-validation, they evaluated six widely used feature selection algorithms and eleven traditional machine learning techniques. They found that SVM, RF, and XGBoost were outstanding machine learning techniques for AMP prediction based on a number of parameters.
In contrast to the typical ML techniques that need pre-existing domain expertise and cleverly designed input features, deep neural networks (DNNs) have been employed in numerous bioinformatics tasks and they can automatically learn high-level characteristics. Recently, deep learning techniques have also been applied to solve the antimicrobial peptides prediction problem [18,19,20]. Ahmad et al. designed a model called Deep-AntiFP for the prediction of antifungal peptides [21]. This model includes three dense layers and uses composite physico-chemical properties (CPP), a quasi-sequence order, and a reduced amino acid alphabet as input features. They obtained 89.08% accuracy with their DNN model using an independent dataset. Hussain proposed a model with three different sequence encodings and two image-based DNNs (RESNET-50 and VGG-16) to improve prediction accuracy of short AMPs [22]. Compared with RESNET-50, which had 96.14% training accuracy and 83.87% testing accuracy, VGG-16 produced more accurate results, with 98.30% training accuracy and 87.37% testing accuracy for predicting short AMPs. For the purpose of identifying AMPs, Su et al. created a deep neural network that included an embedding layer and many convolutional layers [23]. Their model outperformed the current models in terms of accuracy (92%) [23]. The deep CNN approach with one-hot encoding was suggested by Dua et al. to produce the input features for AMP identification. They demonstrated that CNN outperformed simple RNN, long short-term memory (LSTM), LSTM with a gated recurrent unit (GRU), and bidirectional LSTM (Bi-LSTM) [24]. Szymczak et al. built a model called HydrAMP which is a conditional variational autoencoder [25]. This model learns a lower-dimensional, continuous chemical space containing peptides and maintains their antimicrobial characteristics [25].
Most of the machine learning models utilized for AMP prediction are based on the physico-chemical properties of antimicrobial peptides, such as net charge, isoelectric point, hydrophobic moment, penetration depth, tilt angle, etc. [8,26]. Apart from physico-chemical properties, there are also approaches that include sequence-based features, including amino acid composition, dipeptide composition, tripeptide composition, etc. [3,17,27], [28]. Additionally, there are studies that involve structure-based, linguistic-based features [29,30,31]. In the present study, for the antimicrobial peptide prediction task, we aim to develop a new computational approach that incorporates different types of AMP features and takes advantage of the characteristics of these groups. We attempt to show that one can increase the antimicrobial peptide prediction performance by using the selected groups of features that are identified with the proposed AMP-GSM method.

2. Materials and Methods

2.1. Datasets

Within this study, we used the following three datasets.
Dataset 1: In our previous study [32] we downloaded data from DBAASP [2] web server according to specific criteria, such as non-hemolytic, linear cationic peptides, between 20–50 amino acids in length, etc. We selected peptides active against Gram-negative and Gram-positive bacteria separately. The complete dataset includes 231 positively labeled (AMP) and 114 negatively labeled (non-AMP) peptides in the Gram-negative dataset, and 165 positive and 194 negative samples in the Gram-positive dataset.
Dataset 2: Veltri et al. provided a dataset containing 1778 AMPs and 1778 non-AMPs, which are available in the APD vr.3 database (http://aps.unmc.edu/AP, accessed on 18 March 2023) [33]. AMP peptides are active against Gram-negative and/or Gram-positive bacteria. These AMPs are filtered by removing sequences that are less than 10 amino acids long, and those that share 90% sequence identity using the CD-HIT program [34]. Additionally, non-AMPs are filtered by removing sequences less than 10 amino acids in length and those that share 40% sequence identity with the CD-HIT program [34]. Further details can be found in [33].
Dataset 3: Manavalan et al. provided another dataset in [35], which is slightly different from other antimicrobial peptide datasets, since it includes anti-inflammatory peptides (AIPs). Using the IEDB (The Immune Epitope Database), they extracted positive and negative linear peptides that passed experimental validation [36,37]. A positive label was assigned to a peptide if it caused any of the anti-inflammatory cytokines to be produced in mouse and human T-cell experiments. Anti-inflammatory cytokines testing negative for linear peptides were regarded as negative. This dataset included 1258 AIPs and 1887 non-AIPs.

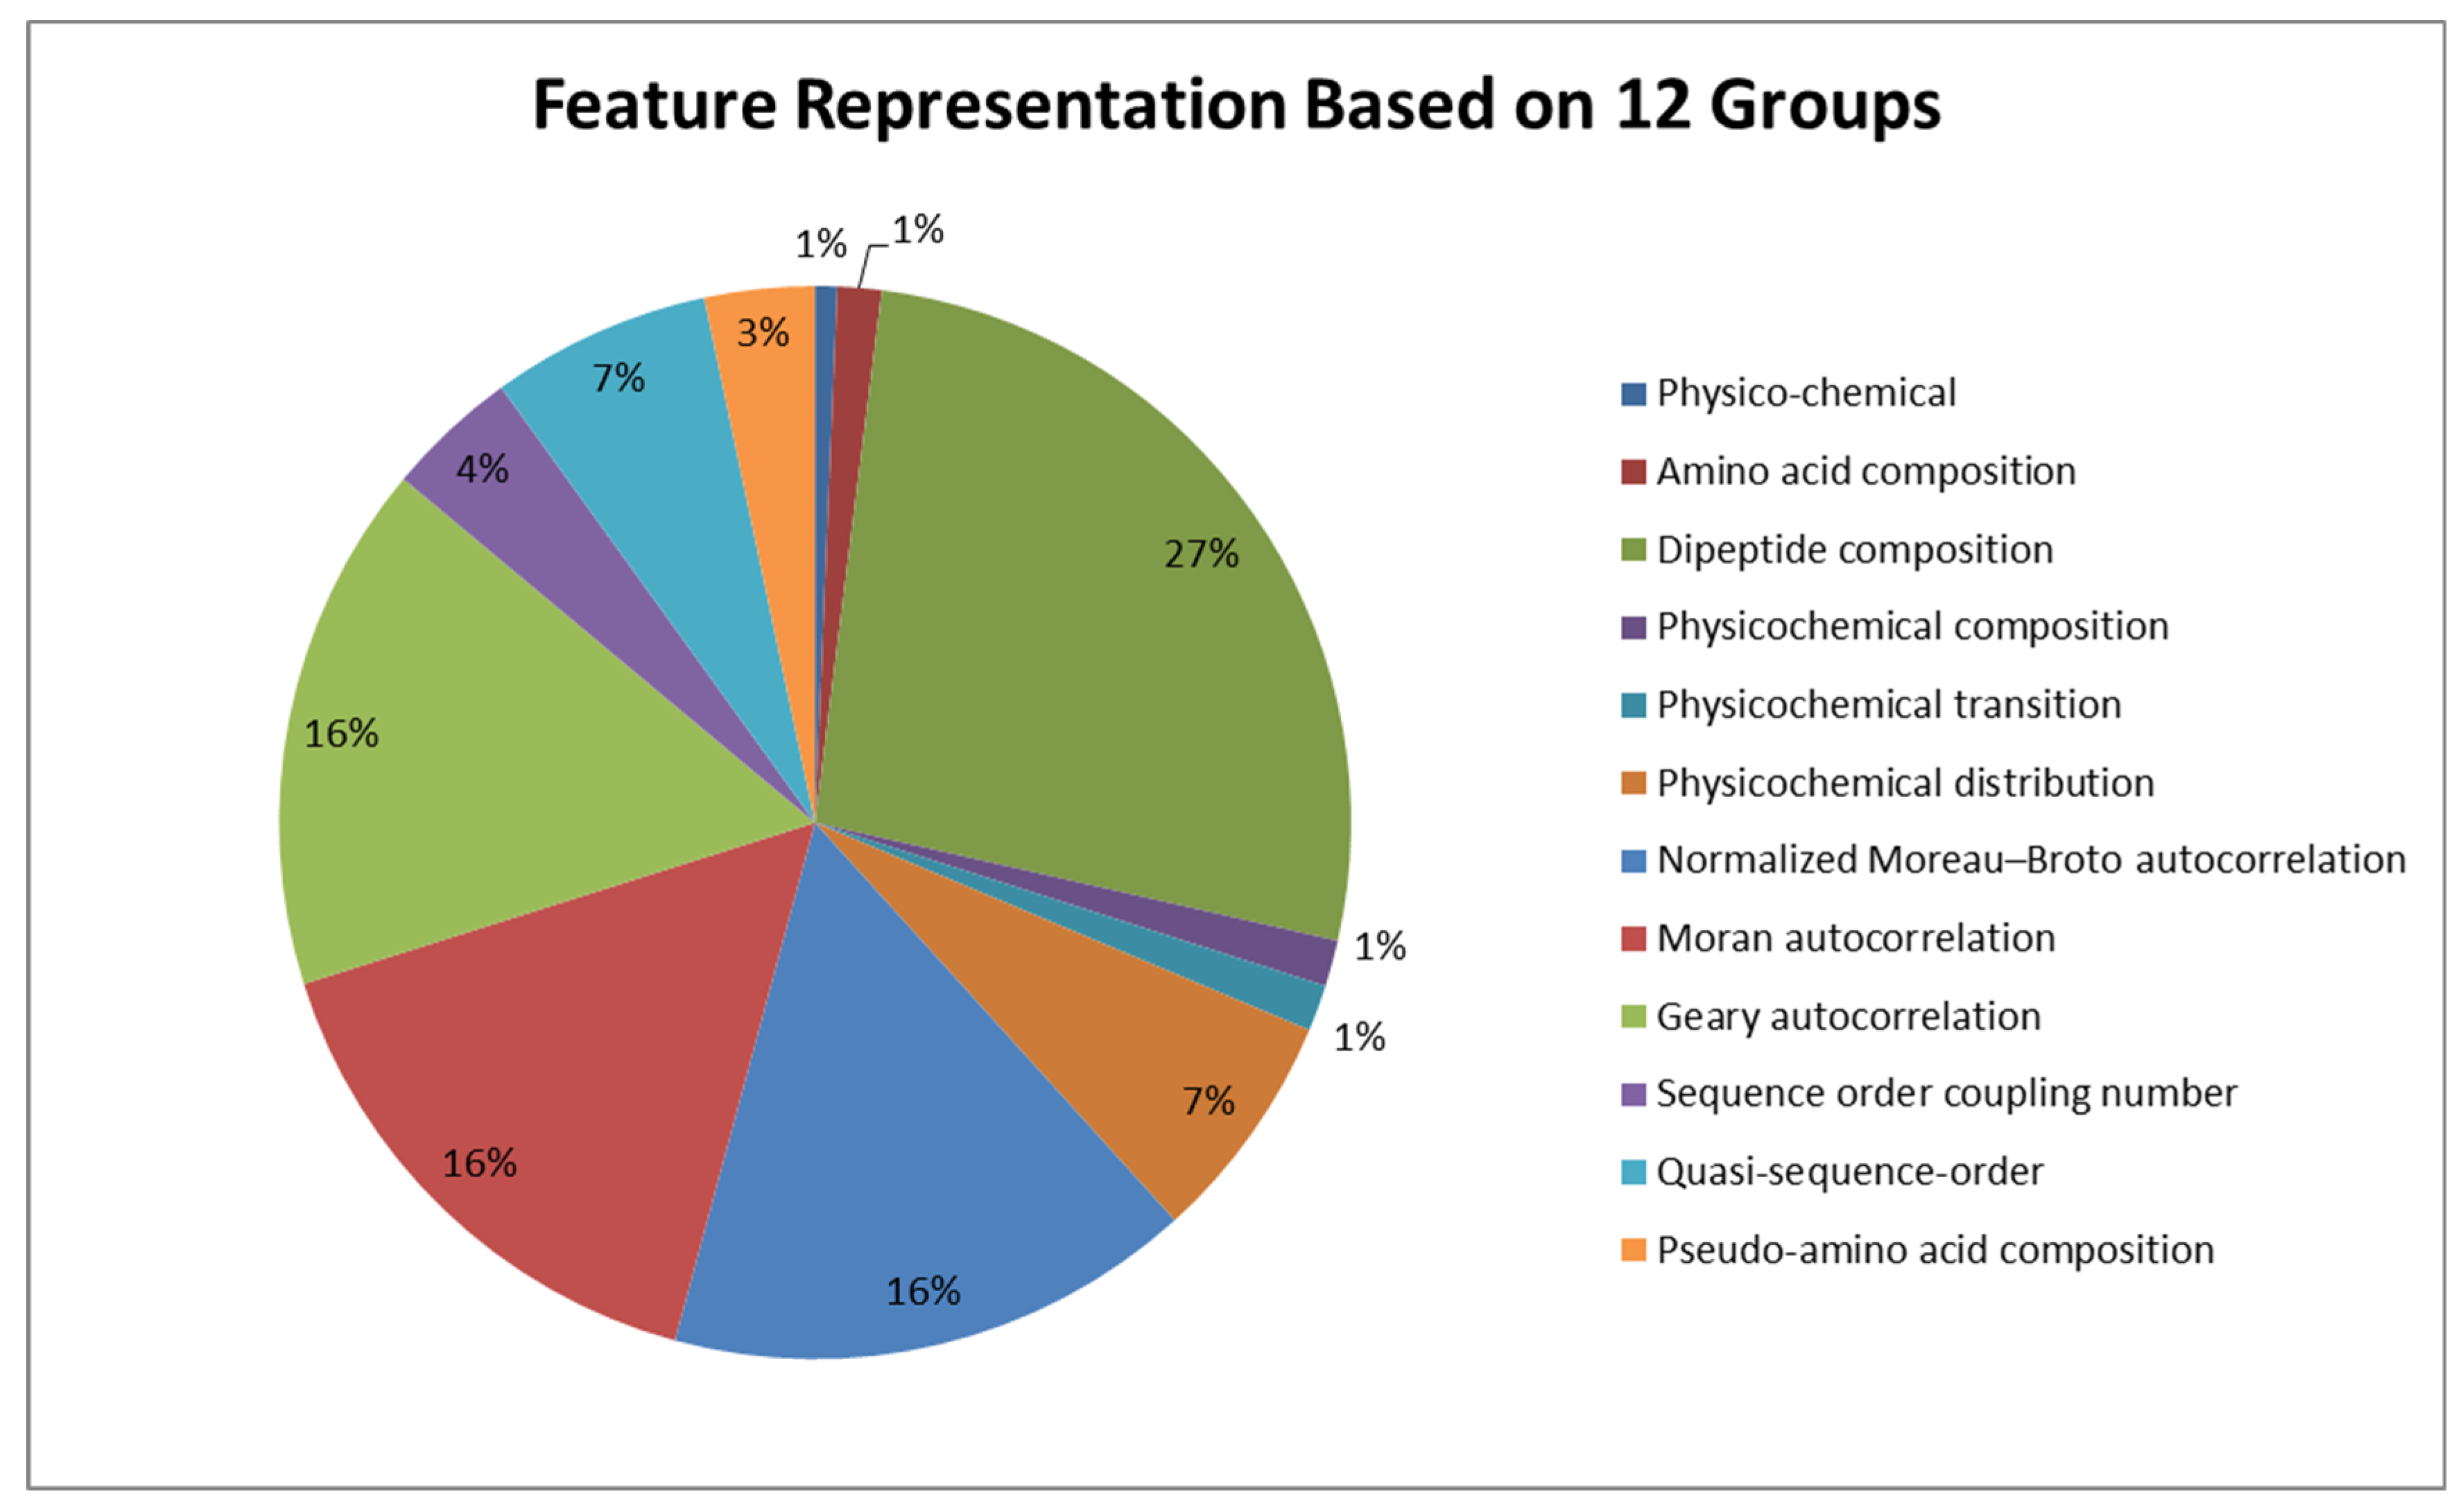
2.2. Generation of Sequence-Based, Structure-Based, and Linguistic-Based Features
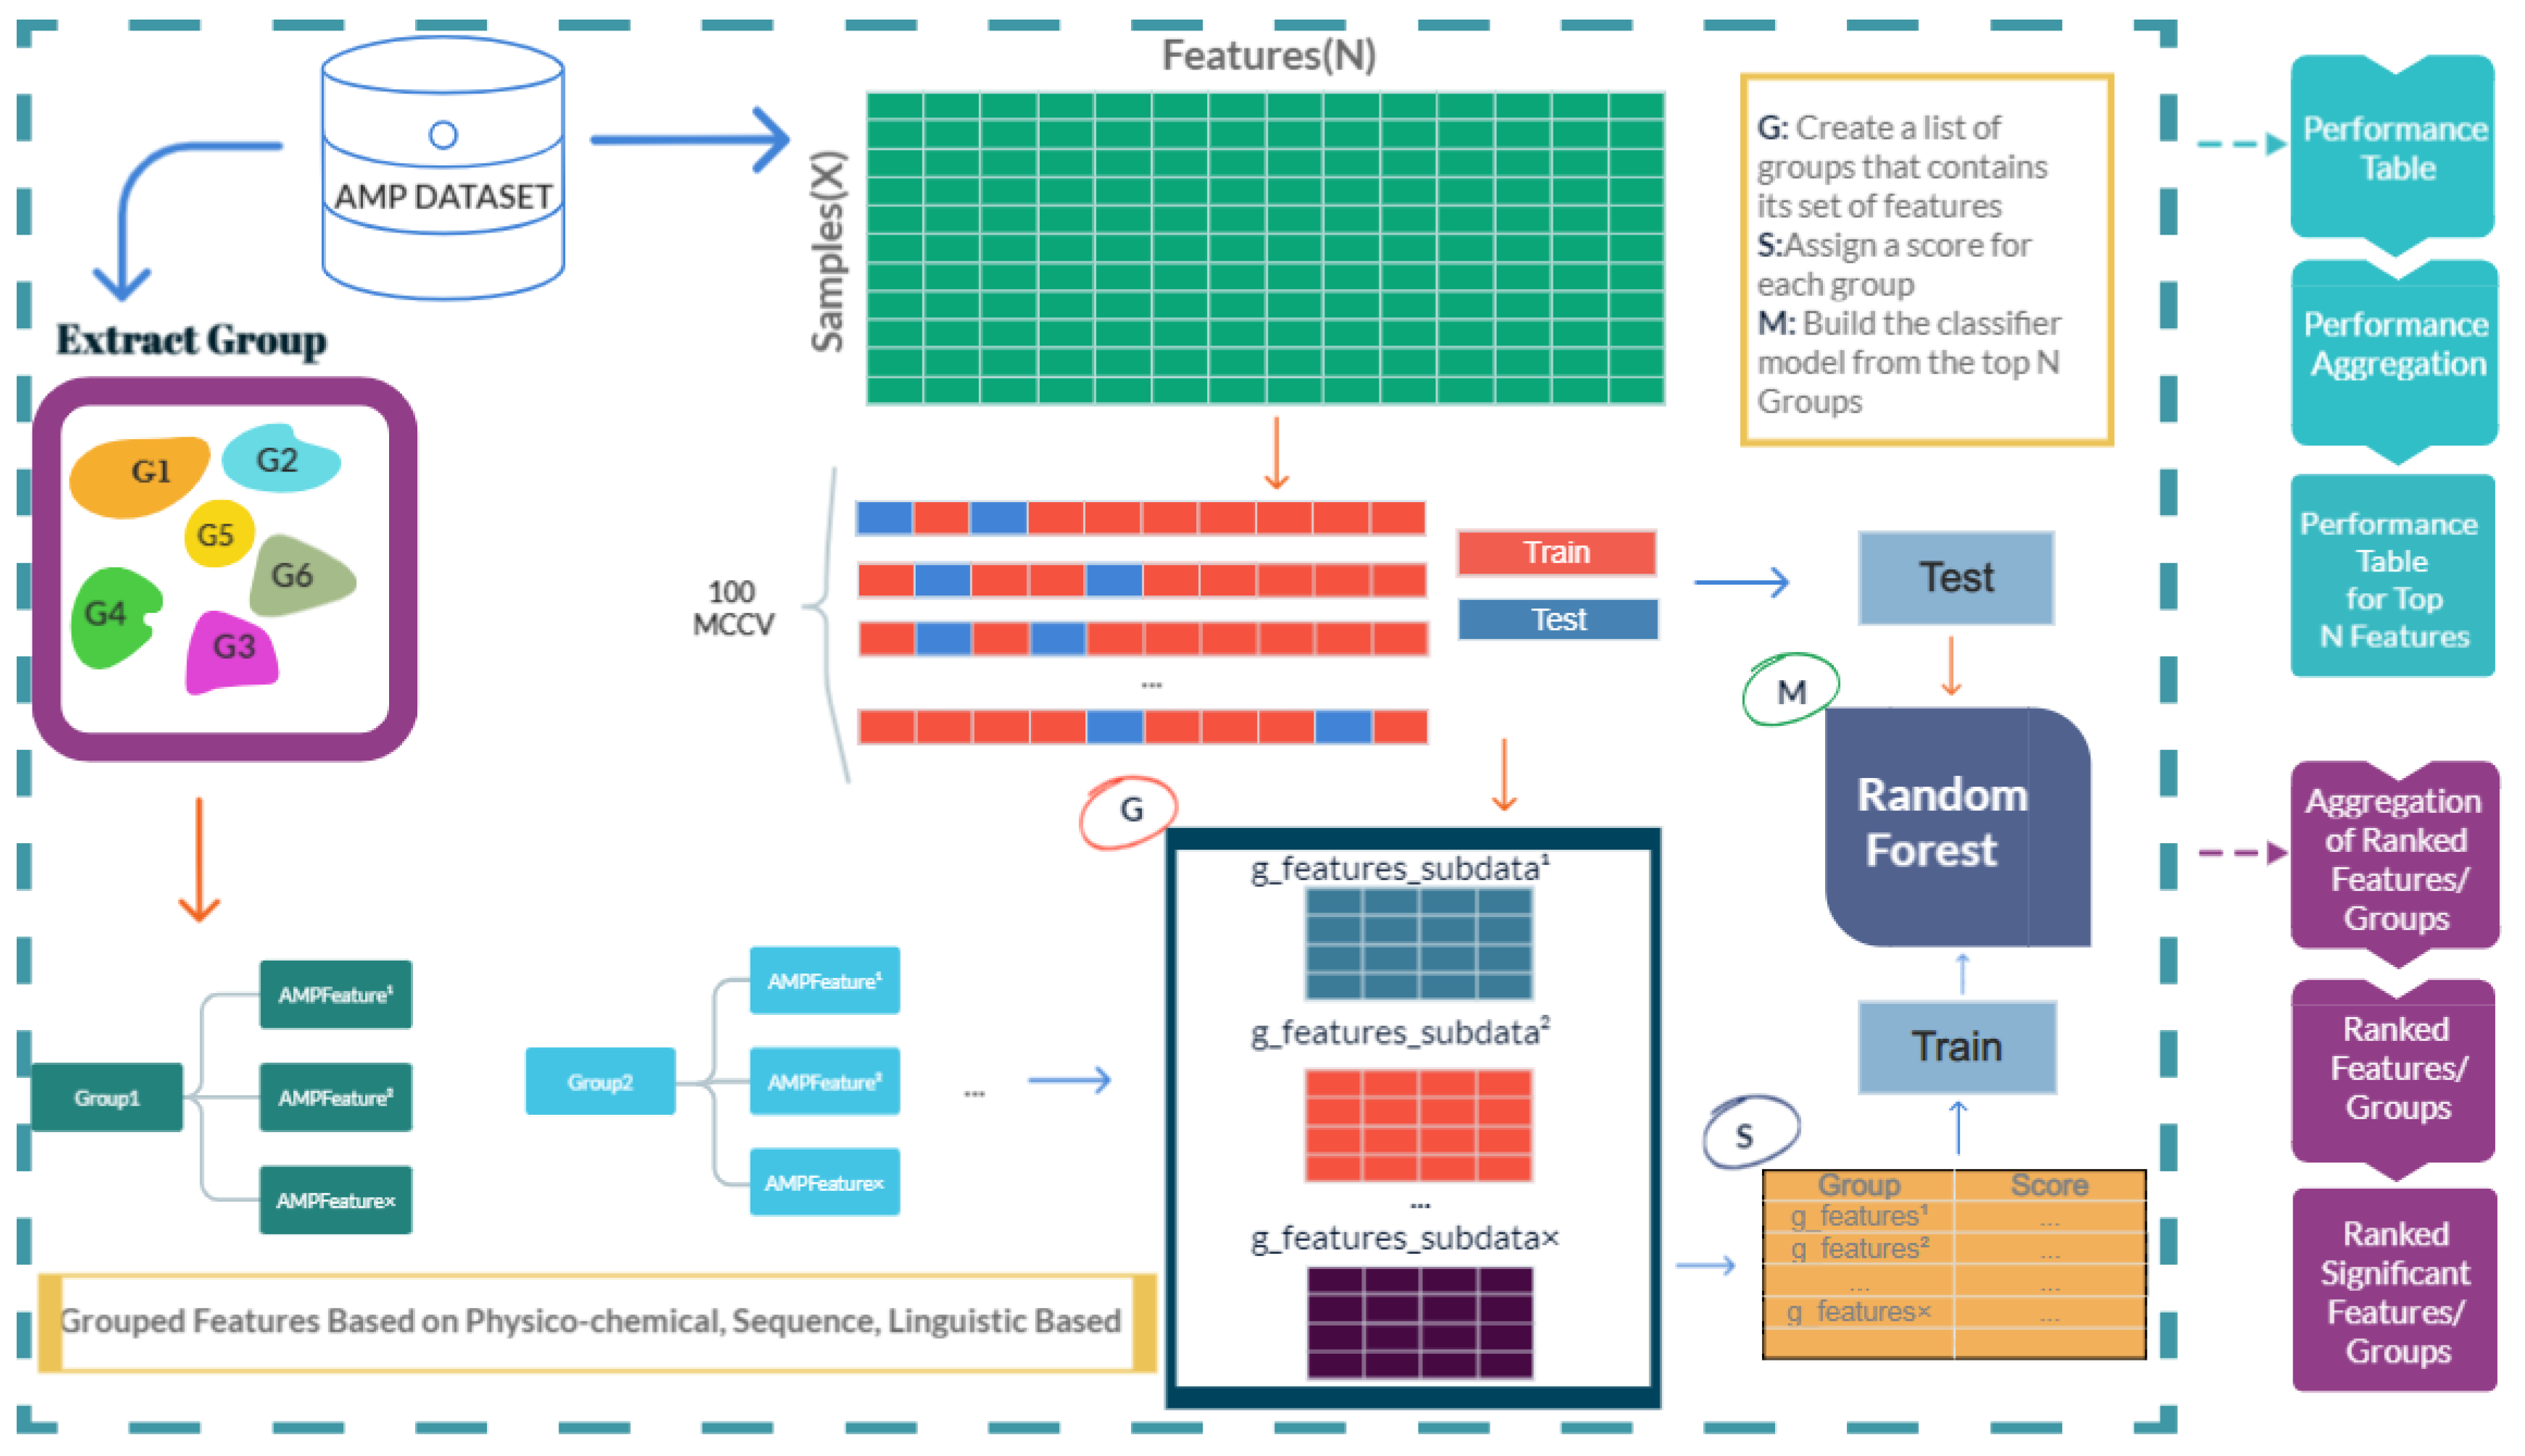
A total of 1508 features were obtained for the peptide sequences in Dataset 1. DBAASP [2] web server was used to extract 10 physico-chemical features including sequence length, normalized hydrophobic moment, normalized hydrophobicity, net charge, isoelectric point, penetration depth, tilt angle, disordered conformation propensity, linear moment, and propensity to in vitro aggregation. The remaining 1408 features were extracted using the PyProtein package [38]. These features belong to the following categories, where the numbers of features within each category is shown in parenthesis: amino acid composition (20), dipeptide composition (400), composition–transition–distribution (CTD) composition (21), CTD transition (21), CTD distribution (105), Moreau–Broto (M–B) autocorrelation (240), Moran autocorrelation (240), Geary autocorrelation (240), quasi-sequence-order descriptors (100), sequence order coupling number (60), and pseudo amino acid composition (50).

2.3. Proposed Model

In our earlier studies, in order to improve classification performance, we proposed grouping-based feature elimination techniques, e.g., SVM RCE [39], SVM-RCE-R [40], and SVM-RCE-R-OPT [41]. Recently, we proposed numerous tools which incorporate biological information into the machine learning algorithm to accomplish feature selection or to choose groups of features. maTE [42], CogNet [43], miRcorrNet [44], miRModuleNet [45], PriPath [46], 3Mint [47], and Integrating Gene Ontology-Based Grouping and Ranking [48] followed this strategy. This technique is known as the GSM approach [49], which is the primary motivation for the development of our proposed approach within this study.
The workflow of the proposed approach, AMP-GSM, is presented in Figure 1. AMP-GSM includes three main components: grouping, scoring, and modeling.

2.3.1. Grouping Peptides Based on Physico-Chemical, Sequence-Based, Structure-Based, and Linguistic-Based Features

The grouping component generates a list of groups where each group is composed of a feature set. An example output of this component is shown in Table 1. In our study, we have 12 groups, including physico-chemical, amino acid composition, dipeptide composition, physico-chemical composition, physico-chemical transition, physico-chemical distribution, normalized Moreau–Broto autocorrelation, Moran autocorrelation, Geary autocorrelation, sequence order coupling number, quasi-sequence order, and pseudo-amino acid composition. Each group has its own feature set. In Figure 2, the distribution of the features into different groups are shown.
The groups created within the Grouping step are utilized to generate sub-datasets from the initial data. Each sub-data is composed of the properties belonging to the features within a particular group, retaining the original class labels of the peptides.
Let Groupn represent the n-th group from the Gram-negative or Gram-positive AMP dataset, which includes x different features and is denoted as Groupn = {AMPFeature1, AMPFeature3, …, AMPFeatureˣ, class label} and Let g_features_subdataˢ represent the s-th group created by the grouping part of the AMP-GSM model, which includes a number of groups (i), denoted as g_features_subdatas = {Group1, Group3, …, Groupi}.

2.3.2. Scoring the Groups

The scoring component gives a score to each group that is created by the grouping component. At the end of this step, each group will have their own score. This score shows how well the group can distinguish between negative and positive classes. In order to determine this score, a 100-fold Monte Carlo cross validation (MCCV) procedure is used [50]. A portion of the data is chosen to serve as the training set for the MCCV approach, while the remaining data are designated as the test set. Then, this procedure is randomly repeated numerous times, producing new training and testing portions each time. In our experiments, 90% of the data is used as the training set, and 10% is used as the test set.
The scoring component produces lists of AMP groups and the features linked to them that are slightly different after each iteration. Consequently, a prioritization strategy needs to be applied to those lists. We applied rank aggregation techniques similar to those proposed in miRcorrNet [43]. In this regard, the RobustRankAggreg R package [51] was integrated into our workflow. Each element in the aggregated list was given a p-value by the RobustRankAggreg, which indicates how well it was ranked relative to the predicted value. The list of the groups that are ordered by scores is the final output of the scoring component.

2.3.3. Modeling Component

After defining the informative groups of features, the model can then be tested on the group with the highest ranking, or cumulatively on the top j groups. In our experiments we decided to use 10 for j. In other words, while maintaining the original labels, we build sub-data using the features related to the top 10 group categories. Applying machine learning to this new subset of data results in the creation of the model, which is then tested using the test set. The model built using the top-ranked groups is evaluated as the final part of our method. We used the Random Forest (RF) Classifier for the modeling part. We split the data into 90% training and 10% testing. We applied 100-fold MCCV for evaluation.
The Konstanz Information Miner (KNIME) platform was used to implement all three components of our method [52].

2.4. Feature Selection Methods

We have a total of 1508 features in our dataset. These features have an impact on how well the classification algorithms work. Therefore, a feature selection method is required to lower the model’s dimension and make it simpler to classify and comprehend. Feature selection can also be performed based on grouping with the proposed AMP-GSM method. We wanted to compare the results we obtained with the results obtained using certain traditional feature selection methods. Therefore, we applied conditional mutual information maximization (CMIM) [53], minimum redundancy maximum relevance (mRmR) [54], information gain (IG) [55], and extreme gradient boosting (XGB) [56] methods, which are also frequently used in the literature.
Conditional mutual information maximization (CMIM) strikes a balance between the candidate feature’s ability to forecast the future and its independence from other characteristics that have already been chosen by using conditional mutual information to calculate distance [57].
The mRMR algorithm is a filtering method that attempts to select the most relevant features with the class labels, while simultaneously aiming to minimize the redundancy between the selected features [58]. This algorithm starts with an empty set, uses mutual information to balance the features, and then combines sequential search with forward selection to identify the best subset of attributes.
Information gain (IG) is utilized for feature selection by assessing each variable’s gain in relation to the target variable. For each of the independent features, we determine the information gain. The traits are then be ranked according to their individual information gains in descending order. We choose a cutoff point and incorporate all features above the cutoff point into the machine learning algorithms.
Extreme gradient boosting (XGB) is another commonly used feature selection method. Importance in XGB assigns a score based on the usefulness or value of each feature in building the boosted decision trees within the model. An attribute’s relative relevance rises as an increasing number of decision trees use it to make important decisions.

2.5. Performance Metrics

The following formulas were used to calculate a number of quantitative metrics, including accuracy, sensitivity, specificity, precision, and F1 measure, in order to assess the performance of the RF model:
Accuracy = TP + TN TP + TN + FN + FP
Recall   Sensitivity = TP TP + FN
Specificity = TN TN + FP
F 1 = 2 TP 2 TP + FP + FN
where TP is true positive, TN is true negative, FP is false positive, and FN is false negative. Furthermore, we used the area under the curve (AUC) for performance evaluation. The AUC is one of the most crucial evaluation criteria for assessing the effectiveness of any classification model. The level or measurement of separability is represented by the AUC. It reveals how well the model can differentiate across classes. According to our study, the higher the AUC, the better the model is at distinguishing between negative (non-AMP) and positive (AMP) samples.

3. Results

We tested AMP-GSM for Dataset 1, which includes a Gram-negative and a Gram-positive dataset, as mentioned above; details are presented in our previous study [32]. Furthermore, we applied different feature selection methods on those datasets. Additionally, we ran our approach on other existing datasets (Dataset 2 and Dataset 3) to compare our results with other methods.

3.1. Performance Evaluation of AMP-GSM on the Gram-Negative Dataset in Dataset 1

The Gram-negative dataset includes 231 positive (AMP) and 114 negative (non-AMP) samples. Average 100-fold MCCV performance metrics of AMP-GSM for the combined top 10 groups for the Gram-negative dataset are shown in Table 2. The first column represents the number of groups, and the second column shows the number of cumulative features. The performance of the top-ranked group is given in the last row, where number of groups = 1. Using 10 features on average, we obtained 95% accuracy and 99% AUC. The features from the initial top-ranked group and the second-highest scoring group are combined. The tenth row of Table 2, where number of groups = 2 displays the performance metrics derived for the top two groups cumulatively. AMP-GSM reports the cumulative performance metrics for the top 10 groups.

3.2. Performance Evaluation of AMP-GSM on the Gram-Positive Dataset in Dataset 1

The Gram-positive dataset in Dataset 1 includes 165 positively labeled (AMP) and 194 negatively labeled (non-AMP) samples. Average 100-fold MCCV performance metrics of AMP-GSM for the combined top 10 groups for the Gram-positive dataset are shown in Table 3. The first column represents the number of groups, and the second column shows the number of cumulative features. The performance of the top-ranked group is given in the last row, where number of groups = 1. Using 10 features on average, we obtained 92% for accuracy and 98% for AUC metric. The features from the initial top-ranked group and the second-highest scoring group are combined. The tenth row of Table 3 where number of groups = 2, displays the performance metrics derived for the top 2 groups cumulatively. AMP-GSM reports the cumulative performance metrics for the top 10 groups.
It is worth noting that both for the Gram-negative and Gram-positive datasets of Dataset 1, all members of the top scoring group originated from the physico-chemical group, and this group showed the highest performance results. It was observed that the scoring made using only physico-chemical features obtained much better results than the groups formed by adding other features.
We re-ran our method by removing this physico-chemical group from the grouping to demonstrate how important physico-chemical properties are in antimicrobial peptide prediction. As seen in Table 4, when the physico-chemical properties are extracted, on the Gram-negative dataset, a single group generated by AMP-GSM includes 38.27 features (averaged over 100-fold MCCV iterations), and this group achieves an accuracy of only 87% and an AUC value of 93%. However, when physico-chemical properties are included, this rate was 95% for accuracy and 99% for AUC (as shown in Table 2). Likewise, for the Gram-positive dataset of Dataset 1, when the physico-chemical properties are removed, 82% accuracy and 90% AUC were obtained (shown in Table 5) by using a single group, including 37.67 features (averaged over 100-fold MCCV iterations), while 92% accuracy and 98% AUC values were obtained when physico-chemical properties were included in the analysis (shown in Table 3).

3.3. Ranking of the Groups

We ranked the groups by the RobustRankAggreg method, applied on the Gram-negative and Gram-positive datasets of Dataset 1. The results are presented in Supplementary Table S1.

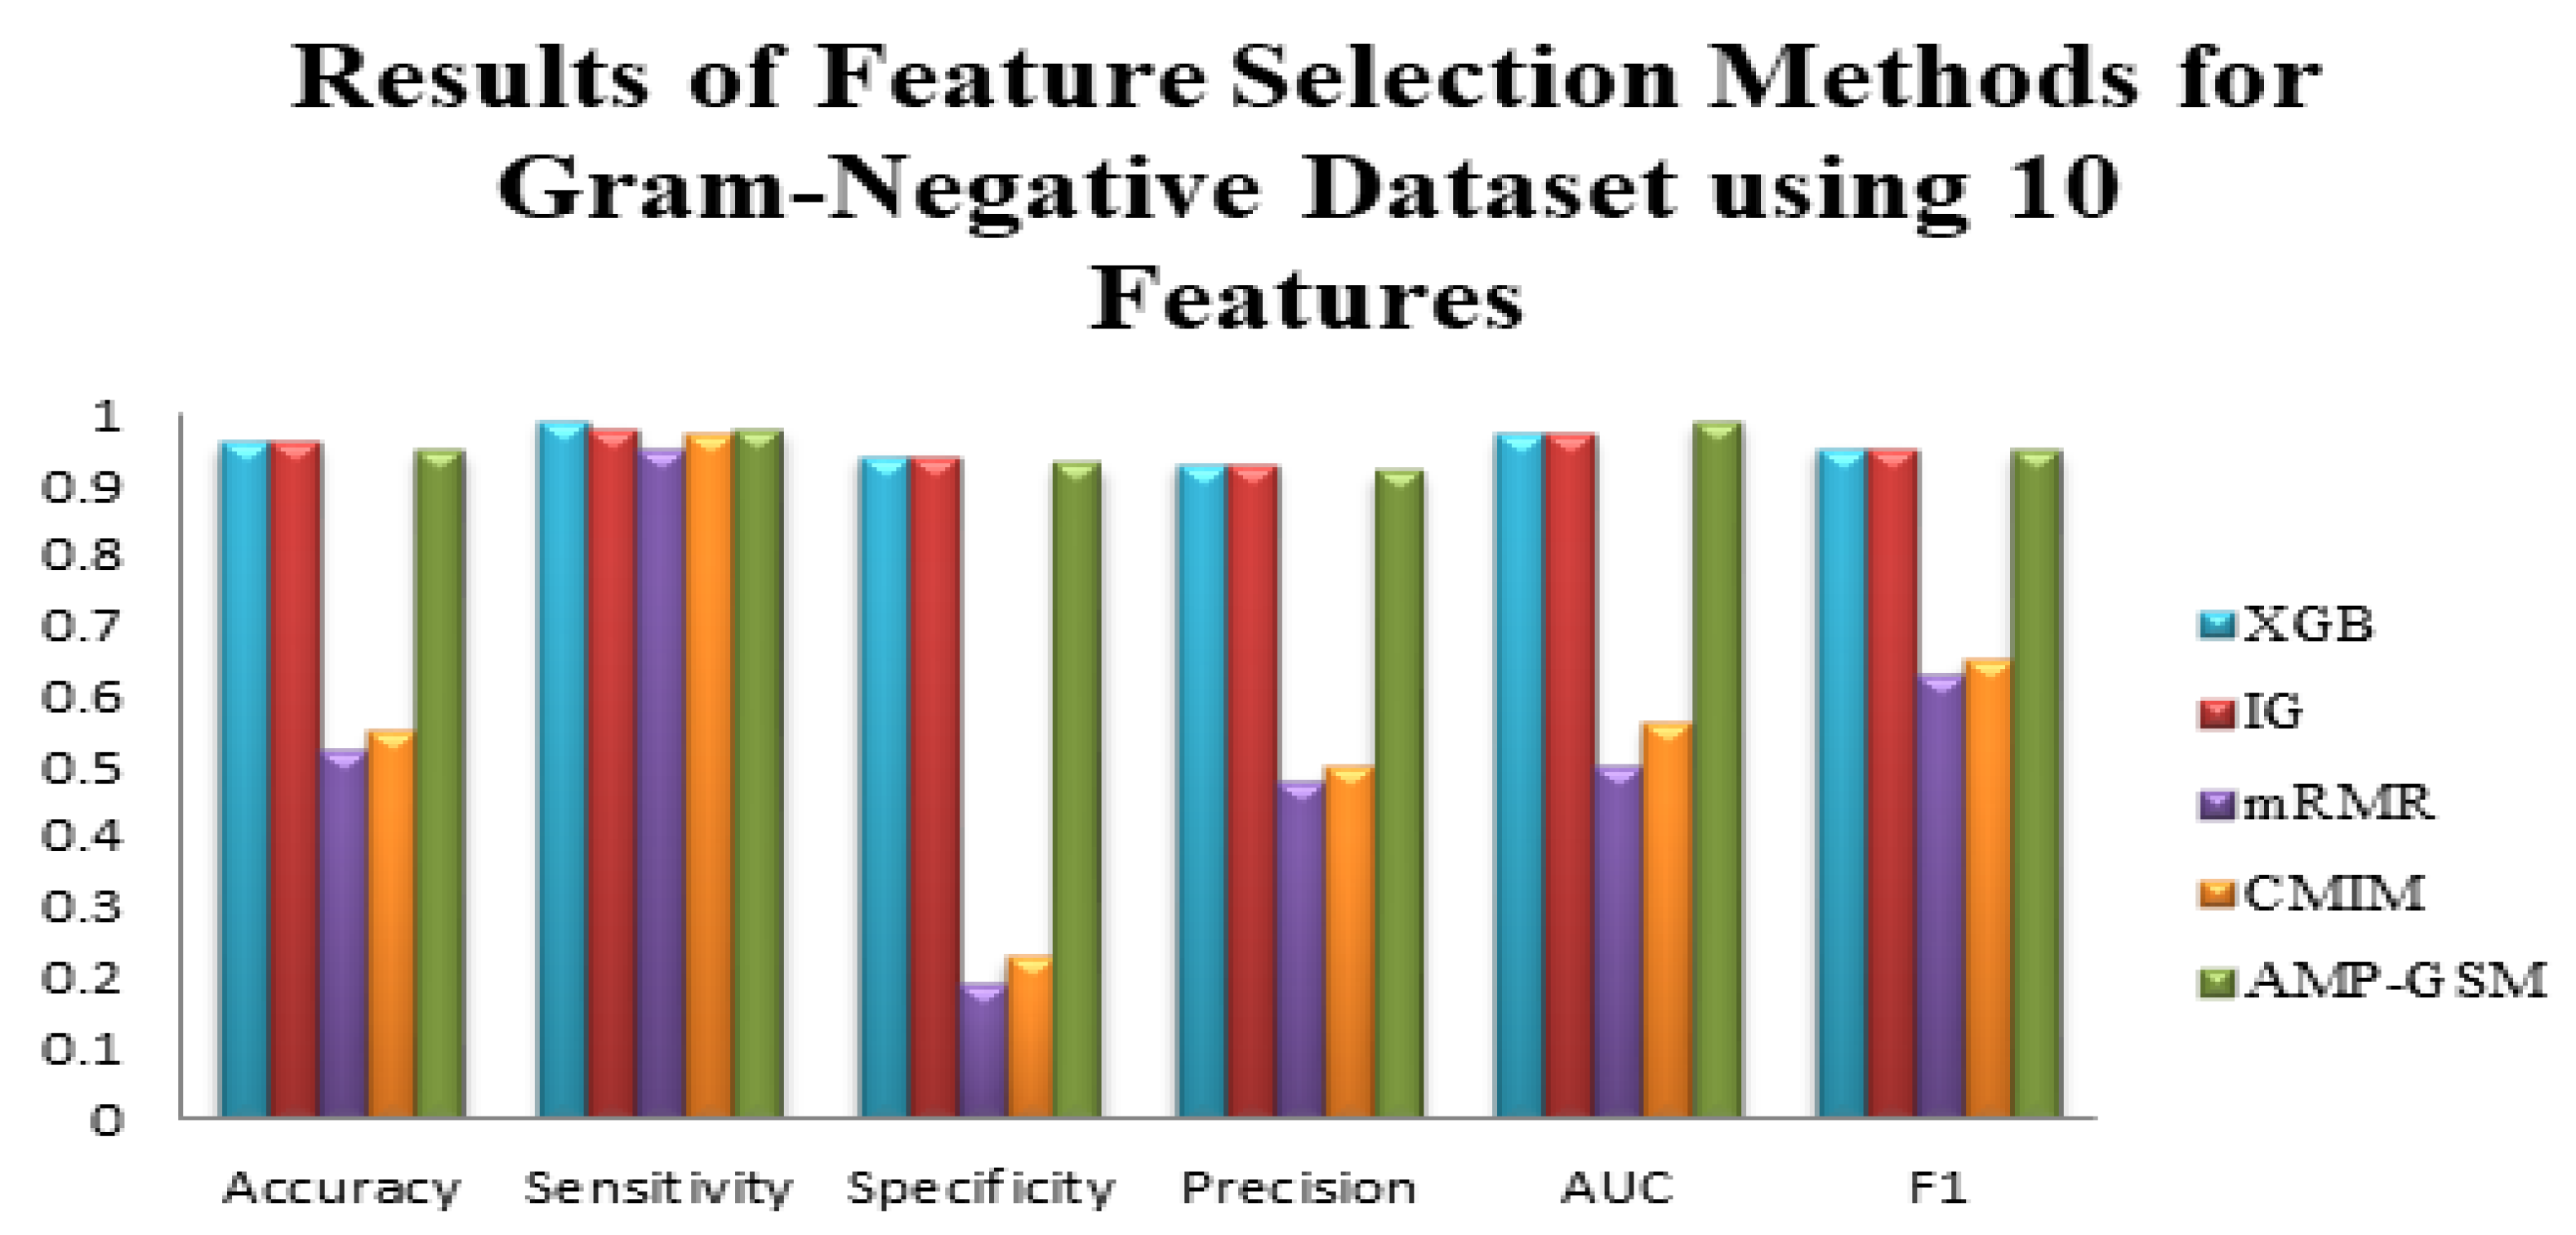
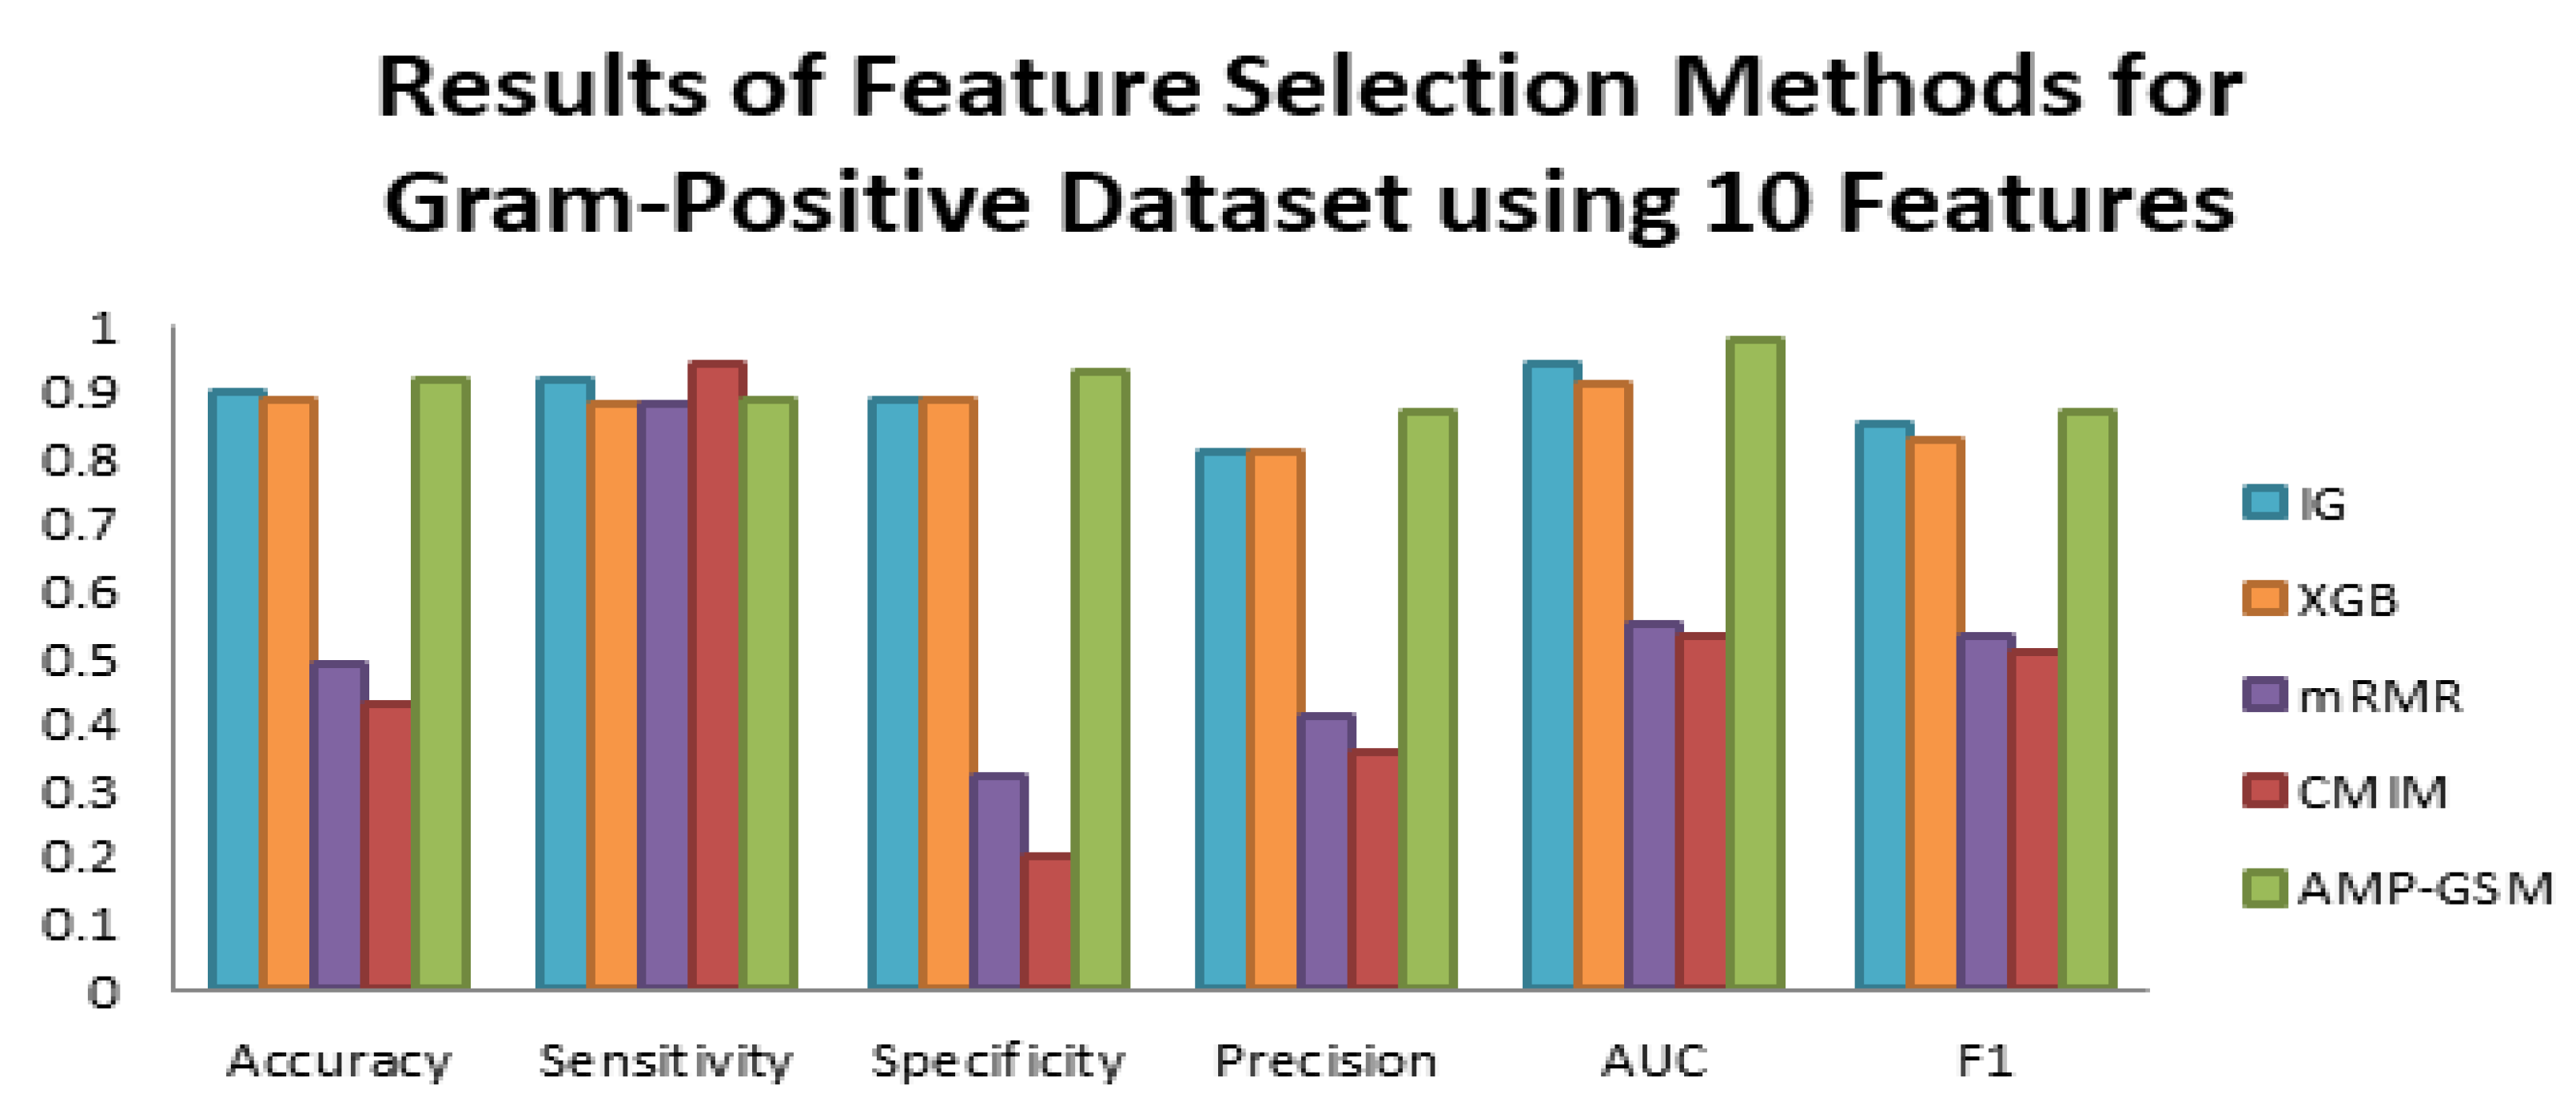
3.4. Comparative Evaluation of the Proposed Method with Other Feature Selection Methods and Classifiers

We have a total of 1508 features for the sequences in Dataset 1. Feature selection techniques attempted to eliminate redundant and unimportant features. As explained in the Materials and Methods section, we experimented with the use of mRMR, IG, XGBoost, and CMIM feature selection methods for the AMP prediction problem. Additionally, the effectiveness of different classification methods, such as RF, SVM, LogitBoost, Decision Tree, and AdaBoost, was evaluated. Since AMP-GSM selected 10 features, for the remaining feature selection methods, we obtained results using their top 10 features. The top 10 features chosen by the four above-mentioned approaches were used to evaluate the effectiveness of numerous classifiers using different metrics. Table 6 shows, compared with other feature selection methods, how the XGBoost and IG techniques enhanced the accuracy, sensitivity, specificity, F1 measure, and AUC values of the tested classifiers, applied on the Gram-negative dataset of Dataset 1. With the same data, it was possible to deduce that the mRMR and CMIM feature selection methods resulted in a low accuracy and a high sensitivity, as well as signs of poor fitting across evaluated models. On the other hand, on the Gram-negative dataset of Dataset 1, AMP-GSM performed better than all tested feature selection methods, all tested classifiers, in terms of the area under curve performance evaluation metric (as shown in Table 6, Figure 3).
Table 7 shows that compared with other feature selection methods, the IG technique enhanced the accuracy, sensitivity, specificity, F1 measure, and AUC values of the tested classifiers, applied on the Gram-positive dataset of Dataset 1. Although not as good as IG, XGB provided a good estimation result on the overall. The mRMR and CMIM feature selection approaches resulted in low accuracy and high recall values, as well as indications of poor fitting across examined models on the same data. On the other hand, on the Gram-positive dataset of Dataset 1, AMP-GSM performed better than all tested feature selection methods, all tested classifiers in terms of different performance evaluation metrics except sensitivity score (as shown in Table 7, Figure 4).
In Table 8, 10 features obtained from the feature selection method (IG-RF pairwise for Gram-positive and XGB-Logitboost pairwise for Gram-negative) that gave the best results and the 10 most important features selected by AMP-GSM are compared. While all of the 10 features identified by the AMP-GSM method belong to the physico-chemical group, it can be observed from Table 8 that the features detected by the feature selection methods belong to different groups for both Gram-negative and Gram-positive datasets.

3.5. Testing AMP-GSM on Different Benchmark Datasets, Comparative Evaluation with Existing Approaches

Veltri et al. proposed a model consisting of a deep neural network (DNN) structure including convolution and LSTM layers [33]. The features are represented with a sequence-to-vector conversion, in which peptide sequences are encoded into uniform numerical vectors of length 200. They tested their proposed DNN on Dataset 2, where the main characteristics of this dataset are presented in the Materials and Methods section and further details can be found in [33].
Table 9 compares the performance metrics of one of the DNN models proposed in [33] with the AMP-GSM model and with other feature selection methods for Dataset 2. The methods being compared are listed in column 1 of Table 9, along with the five performance metrics listed in columns 3 through column 7. The results in bold in Table 9 represent the best results for a particular metric. According to Table 9, the AMP-GSM model performs the best in terms of accuracy, sensitivity, F1 measure and AUC metrics.
Manavalan et al. proposed a model consisting of a random forest classifier and feature selection methods [35]. They used amino acid composition, amino acid index, dipeptide composition, physico-chemical properties, and distribution of amino acid patterns as peptide features. They compare their results with commonly used machine learning models, such as SVM, k-NN, and extremely randomized trees (ERT).
Table 10 compares the performance metrics of the method proposed in [35] with AMP-GSM and other feature selection methods for Dataset 3. The methods being compared are listed in column 1 of Table 10 along with the four performance metrics listed in columns 3 through column 6. The results in bold in Table 10 indicate the best results for a particular metric. AMP-GSM considerably outperforms CMIM, IG, and mRMR feature selection methods for predicting AIPs. There is a significant difference for all performance metrics.

4. Discussion

In this study, we propose AMP-GSM, a novel approach that is built on the grouping and ranking of peptide features. The method relies on grouping the features according to their biological characteristics, and then scoring those groups according to their importance in terms of distinguishing antimicrobial peptides from non-antimicrobial peptides. Traditional methods often use the properties of antimicrobial peptides together rather than grouping them. On the other hand, feature selection methods select the features that they identify as important, and then develop the classification models using the selected features. However, such a selection is not a group-based selection. Based on all the attributes, traditional feature selection methods select the most important ones. Studies in this area are mostly aimed at classification by taking feature groups individually or collectively, or by using a set of features selected by traditional feature selection methods [59,60,61].
In this study, structure-based, sequence-based, and physico-chemical features were grouped and their effects on classification performance were evaluated. We analyzed a comprehensive set of features, including amino acid composition, dipeptide composition, pseudo amino acid composition, CTD of physico-chemical properties, various autocorrelations, quasi-sequence-order descriptors, and sequence order coupling number. These features are generated for each peptide within the Gram-positive and Gram-negative datasets separately. Separately for the Gram-positive and Gram-negative datasets, we compared the performances of the models that apply the proposed AMP-GSM technique and alternative feature selection strategies. As shown in Figure 3 and Figure 4, AMP-GSM resulted in higher AUC values on both Gram-negative and Gram-positive dataset.
An AMP prediction system has a very high number of potential input features, and the decisions made regarding which features to use for antimicrobial prediction greatly affect prediction performance in terms of accuracy and AUC. Finding novel antimicrobial descriptors that may be connected to physico-chemical properties could reduce the wide accuracy range of the prediction algorithms, and aid in identifying the real significance of characteristics related to antimicrobial activities.
Ten of the 1508 factors displayed statistically significant variations in positive and negative datasets separately. Compared with the known feature selection algorithms, these ten features are effective antimicrobial peptide descriptors that produce higher accuracy when used with the AMP-GSM approach. As seen in Table 8, all 10 features belong to the physico-chemical group. Additionally, when we removed the physico-chemical group from the dataset and run our approach, it was observed that accuracy and AUC values significantly decreased for both Gram-negative and Gram-positive datasets.
We also used two other benchmark datasets in order to make a comparison between different approaches. In Dataset 2, there are 1778 AMPs and 1778 non-AMPs. Using the whole dataset with 10-fold MCCV, for some performance metrics, AMP-GSM outperformed the DNN model with LSTM and convolutional layers, as proposed in [33]. As seen in Table 9, we obtained higher performance metrics for sensitivity, accuracy, and AUC compared to the DNN model with LSTM and convolutional layers [33]. Another dataset that we analyzed (Dataset 3) was provided by Manavalan et al. in [35]. This dataset consists of anti-inflammatory peptides (AIP). It includes 1258 AIPs and 1887 non-AIPs. Their model consists of a feature selection part with RF. Using Dataset3, we obtained higher performance metrics (99% accuracy, 100% AUC) compared with their method and traditional machine learning approaches, such as SVM and k-NN (as seen in Table 10). Hence, we can conclude that the novel approach developed in this study can be used to predict not only antimicrobial peptides, but also anti-inflammatory peptides by considering group characteristics.
Our technique performs well and provides better categorization of AMPs based on different types of information (physico-chemical, sequence-based, etc.). However, AMPs can be hazardous and inefficient as a medicine, which is undesirable. Studies on the synthesis and modification of AMPs have shown that even small modifications can impact how well they work. This approach does not take into account the functional traits of AMPs, but instead, it can only identify AMPs. It is possible to undertake additional studies in accordance with the roles played by AMPs, which will improve our comprehension of their method of action and our ability to forecast their behaviors.
Another issue regarding the design of AMPs is that toxicity, stability, and bacterial resistance must all be addressed concurrently in the rational design of AMP-based therapeutics [62]. To achieve this, it is essential to determine the key attributes that a peptide contains in order to be effective against various bacterial species. To rationally develop antimicrobial peptides that target certain bacteria, this study offers a feature selection method based on grouping that is specific to bacteria. It will be crucial to test our study using larger datasets active against bacteria.

5. Conclusions

We create a novel approach based on grouping, scoring, and modeling to accurately predict the antimicrobial peptides. To determine key properties involved in the prediction of antimicrobial peptides, we used different types of feature groups. Each group has its own feature set. The group including physico-chemical features is identified as the best group in terms of predicting AMP activity. We observed that estimating antimicrobial peptides using only physico-chemical properties generated the best score. It has been demonstrated that physico-chemical properties play a significant impact in peptide prediction, and should be taken into account while developing novel models.
It is crucial to compare our novel approach with benchmark datasets in this area. Our findings demonstrate how effective and discriminating the AMP-GSM model is. In-depth evaluations of AMP-GSM against other traditional feature selection techniques for AMP prediction place it among one of the best predictors.
To sum up, AMPs are thought to be the most promising antibiotic substitutes. Consequently, precise antimicrobial peptide prediction aids in the development of cheaper, more efficient peptides. Additionally, they gained popularity in this industry since computational prediction approaches minimize losses during production phases. This study’s grouping methodology will be beneficial to precise prediction and the design of antimicrobial peptides that are extremely efficient against particular bacterial infections. Although the categorization method we have created here is only applicable to antimicrobial and anti-inflammatory peptides, it could be used in future research to predict antifungal, antiviral, antiprotozoal, and anticancer drugs. Additionally, it is possible to expand our current work by adding more groups for future studies.

Supplementary Materials

The following supporting information can be downloaded at: https://www.mdpi.com/article/10.3390/app13085106/s1, Table S1. Ranking of the Groups by the RobustRankAggreg method on Gram-negative and Gram-positive datasets of Dataset 1.

Author Contributions

Conceptualization, B.B.-G., M.Y. and Ü.G.S.; methodology, M.Y. and B.B.-G.; software, M.Y. and Ü.G.S.; validation, Ü.G.S. and M.Y.; formal analysis, Ü.G.S., B.B.-G. and M.Y.; investigation, Ü.G.S. and B.B.-G.; writing—original draft preparation, Ü.G.S.; writing—review and editing, B.B.-G. and M.Y.; visualization, Ü.G.S.; supervision, B.B.-G. and M.Y.; funding acquisition, M.Y. and B.B.-G. All authors have read and agreed to the published version of the manuscript.

Funding

The work of M.Y. has been supported by the Zefat Academic College. The work of B.B.-G. has been supported by the Abdullah Gul University Support Foundation (AGUV).

Institutional Review Board Statement

Not applicable.

Informed Consent Statement

Not applicable.

Data Availability Statement

The data are obtained from the Database of Antimicrobial Activity and Structure of Peptides (DBAASP) web server.

Conflicts of Interest

The authors declare no conflict of interest.

References

  1. Büyükkiraz, M.E.; Kesmen, Z. Antimicrobial peptides (AMPs): A promising class of antimicrobial compounds. J. Appl. Microbiol. 2021, 132, 1573–1596. [Google Scholar] [CrossRef]
  2. Vishnepolsky, B.; Grigolava, M.; Zaalishvili, G.; Karapetian, M.; Pirtskhalava, M. DBAASP Special prediction as a tool for the prediction of antimicrobial potency against particular target species. In Proceedings of the 4th International Electronic Conference on Medicinal Chemistry, Sciforum Online, 1–30 November 2018; p. 5608. [Google Scholar] [CrossRef]
  3. Thomas, S.; Karnik, S.; Barai, R.; Jayaraman, V.K.; Idicula-Thomas, S. CAMP: A useful resource for research on antimicrobial peptides. Nucleic Acids Res. 2009, 38, D774–D780. [Google Scholar] [CrossRef]
  4. Piotto, S.P.; Sessa, L.; Concilio, S.; Iannelli, P. YADAMP: Yet another database of antimicrobial peptides. Int. J. Antimicrob. Agents 2012, 39, 346–351. [Google Scholar] [CrossRef]
  5. Zhao, X.; Wu, H.; Lu, H.; Li, G.; Huang, Q. LAMP: A Database Linking Antimicrobial Peptides. PLoS ONE 2013, 8, e66557. [Google Scholar] [CrossRef]
  6. Fan, L.; Sun, J.; Zhou, M.; Zhou, J.; Lao, X.; Zheng, H.; Xu, H. DRAMP: A comprehensive data repository of antimicrobial peptides. Sci. Rep. 2016, 6, 24482. [Google Scholar] [CrossRef]
  7. Lee, E.Y.; Fulan, B.M.; Wong, G.C.L.; Ferguson, A.L. Mapping membrane activity in undiscovered peptide sequence space using machine learning. Proc. Natl. Acad. Sci. USA 2016, 113, 13588–13593. [Google Scholar] [CrossRef]
  8. Torrent, M.; Andreu, D.; Nogués, M.V.; Boix, E. Connecting Peptide Physicochemical and Antimicrobial Properties by a Rational Prediction Model. PLoS ONE 2011, 6, e16968. [Google Scholar] [CrossRef]
  9. Meher, P.K.; Sahu, T.K.; Saini, V.; Rao, A.R. Predicting antimicrobial peptides with improved accuracy by incorporating the compositional, physico-chemical and structural features into Chou’s general PseAAC. Sci. Rep. 2017, 7, 42362. [Google Scholar] [CrossRef]
  10. Lata, S.; Mishra, N.K.; Raghava, G.P. AntiBP2: Improved version of antibacterial peptide prediction. BMC Bioinform. 2010, 11, S19. [Google Scholar] [CrossRef] [PubMed]
  11. Veltri, D.; Kamath, U.; Shehu, A. Improving Recognition of Antimicrobial Peptides and Target Selectivity through Machine Learning and Genetic Programming. IEEE/ACM Trans. Comput. Biol. Bioinform. 2015, 14, 300–313. [Google Scholar] [CrossRef]
  12. Randou, E.G.; Veltri, D.; Shehu, A. Binary Response Models for Recognition of Antimicrobial Peptides. In Proceedings of the International Conference on Bioinformatics, Computational Biology and Biomedical Informatics, Wshington, DC, USA, 22–25 September 2013; pp. 76–85. [Google Scholar] [CrossRef]
  13. Lertampaiporn, S.; Vorapreeda, T.; Hongsthong, A.; Thammarongtham, C. Ensemble-AMPPred: Robust AMP Prediction and Recognition Using the Ensemble Learning Method with a New Hybrid Feature for Differentiating AMPs. Genes 2021, 12, 137. [Google Scholar] [CrossRef]
  14. Vishnepolsky, B.; Grigolava, M.; Managadze, G.; Gabrielian, A.; Rosenthal, A.; Hurt, D.E.; Tartakovsky, M.; Pirtskhalava, M. Comparative analysis of machine learning algorithms on the microbial strain-specific AMP prediction. Brief. Bioinform. 2022, 23, 233. [Google Scholar] [CrossRef] [PubMed]
  15. Chung, C.-R.; Jhong, J.-H.; Wang, Z.; Chen, S.; Wan, Y.; Horng, J.-T.; Lee, T.-Y. Characterization and Identification of Natural Antimicrobial Peptides on Different Organisms. Int. J. Mol. Sci. 2020, 21, 986. [Google Scholar] [CrossRef]
  16. Kavousi, K.; Bagheri, M.; Behrouzi, S.; Vafadar, S.; Atanaki, F.F.; Lotfabadi, B.T.; Ariaeenejad, S.; Shockravi, A.; Moosavi-Movahedi, A.A. IAMPE: NMR-Assisted Computational Prediction of Antimicrobial Peptides. J. Chem. Inf. Model. 2020, 60, 4691–4701. [Google Scholar] [CrossRef] [PubMed]
  17. Xu, J.; Li, F.; Leier, A.; Xiang, D.; Shen, H.-H.; Lago, T.T.M.; Li, J.; Yu, D.-J.; Song, J. Comprehensive assessment of machine learning-based methods for predicting antimicrobial peptides. Brief. Bioinform. 2021, 22, 83. [Google Scholar] [CrossRef]
  18. Dee, W. LMPred: Predicting antimicrobial peptides using pre-trained language models and deep learning. Bioinform. Adv. 2022, 2, 021. [Google Scholar] [CrossRef]
  19. Ma, Y.; Guo, Z.; Xia, B.; Zhang, Y.; Liu, X.; Yu, Y.; Na Tang, N.; Tong, X.; Wang, M.; Ye, X.; et al. Identification of antimicrobial peptides from the human gut microbiome using deep learning. Nat. Biotechnol. 2022, 40, 921–931. [Google Scholar] [CrossRef] [PubMed]
  20. Tang, W.; Dai, R.; Yan, W.; Zhang, W.; Bin, Y.; Xia, E.; Xia, J. Identifying multi-functional bioactive peptide functions using multi-label deep learning. Brief. Bioinform. 2021, 23, 414. [Google Scholar] [CrossRef]
  21. Ahmad, A.; Akbar, S.; Khan, S.; Hayat, M.; Ali, F.; Ahmed, A.; Tahir, M. Deep-AntiFP: Prediction of antifungal peptides using distanct multi-informative features incorporating with deep neural networks. Chemom. Intell. Lab. Syst. 2020, 208, 104214. [Google Scholar] [CrossRef]
  22. Hussain, W. sAMP-PFPDeep: Improving accuracy of short antimicrobial peptides prediction using three different sequence encodings and deep neural networks. Brief. Bioinform. 2021, 23, 487. [Google Scholar] [CrossRef]
  23. Su, X.; Xu, J.; Yin, Y.; Quan, X.; Zhang, H. Antimicrobial peptide identification using multi-scale convolutional network. BMC Bioinform. 2019, 20, 730. [Google Scholar] [CrossRef] [PubMed]
  24. Dua, M.; Barbara, D.; Shehu, A. Exploring Deep Neural Network Architectures: A Case Study on Improving Antimicrobial Peptide Recognition. In Proceedings of the 12th International Conference on Bioinformatics and Computational Biology, San Francisco, CA, USA, 23–25 March 2020; pp. 182–191. [Google Scholar]
  25. Szymczak, P.; Możejko, M.; Grzegorzek, T.; Jurczak, R.; Bauer, M.; Neubauer, D.; Sikora, K.; Michalski, M.; Sroka, J.; Setny, P.; et al. Discovering highly potent antimicrobial peptides with deep generative model HydrAMP. Nat. Commun. 2023, 14, 1453. [Google Scholar] [CrossRef] [PubMed]
  26. Boone, K.; Camarda, K.; Spencer, P.; Tamerler, C. Antimicrobial peptide similarity and classification through rough set theory using physicochemical boundaries. BMC Bioinform. 2018, 19, 469. [Google Scholar] [CrossRef] [PubMed]
  27. Khaledian, E.; Broschat, S.L. Sequence-Based Discovery of Antibacterial Peptides Using Ensemble Gradient Boosting. In Proceedings of the 1st International Electronic Conference on Microbiology, Sciforum Online, 2–30 November 2020; p. 6. [Google Scholar] [CrossRef]
  28. Timmons, P.B.; Hewage, C.M. HAPPENN is a novel tool for hemolytic activity prediction for therapeutic peptides which employs neural networks. Sci. Rep. 2020, 10, 10869. [Google Scholar] [CrossRef]
  29. Spänig, S.; Heider, D. Encodings and models for antimicrobial peptide classification for multi-resistant pathogens. BioData Min. 2019, 12, 7. [Google Scholar] [CrossRef]
  30. Loose, C.; Jensen, K.; Rigoutsos, I.; Stephanopoulos, G. A linguistic model for the rational design of antimicrobial peptides. Nature 2006, 443, 867–869. [Google Scholar] [CrossRef]
  31. Khabbaz, H.; Karimi-Jafari, M.H.; Saboury, A.A.; BabaAli, B. Prediction of antimicrobial peptides toxicity based on their physico-chemical properties using machine learning techniques. BMC Bioinform. 2021, 22, 549. [Google Scholar] [CrossRef]
  32. Söylemez, G.; Yousef, M.; Kesmen, Z.; Büyükkiraz, M.E.; Bakir-Gungor, B. Prediction of Linear Cationic Antimicrobial Peptides Active against Gram-Negative and Gram-Positive Bacteria Based on Machine Learning Models. Appl. Sci. 2022, 12, 3631. [Google Scholar] [CrossRef]
  33. Veltri, D.; Kamath, U.; Shehu, A. Deep learning improves antimicrobial peptide recognition. Bioinformatics 2018, 34, 2740–2747. [Google Scholar] [CrossRef] [PubMed]
  34. Li, W.; Godzik, A. Cd-hit: A fast program for clustering and comparing large sets of protein or nucleotide sequences. Bioinformatics 2006, 22, 1658–1659. [Google Scholar] [CrossRef] [PubMed]
  35. Manavalan, B.; Shin, T.H.; Kim, M.O.; Lee, G. AIPpred: Sequence-Based Prediction of Anti-inflammatory Peptides Using Random Forest. Front. Pharmacol. 2018, 9, 276. [Google Scholar] [CrossRef]
  36. Zhang, Q.; Wang, P.; Kim, Y.; Haste-Andersen, P.; Beaver, J.; Bourne, P.E.; Bui, H.-H.; Buus, S.; Frankild, S.; Greenbaum, J.; et al. Immune epitope database analysis resource (IEDB-AR). Nucleic Acids Res. 2008, 36, W513–W518. [Google Scholar] [CrossRef] [PubMed]
  37. Fleri, W.; Paul, S.; Dhanda, S.K.; Mahajan, S.; Xu, X.; Peters, B.; Sette, A. The Immune Epitope Database and Analysis Resource in Epitope Discovery and Synthetic Vaccine Design. Front. Immunol. 2017, 8, 278. Available online: https://www.frontiersin.org/articles/10.3389/fimmu.2017.00278 (accessed on 18 March 2023). [CrossRef]
  38. Dong, J.; Yao, Z.-J.; Zhang, L.; Luo, F.; Lin, Q.; Lu, A.-P.; Chen, A.F.; Cao, D.-S. PyBioMed: A python library for various molecular representations of chemicals, proteins and DNAs and their interactions. J. Cheminform. 2018, 10, 16. [Google Scholar] [CrossRef]
  39. Yousef, M.; Jung, S.; Showe, L.C.; Showe, M.K. Recursive Cluster Elimination (RCE) for classification and feature selection from gene expression data. BMC Bioinform. 2007, 8, 144. [Google Scholar] [CrossRef]
  40. Yousef, M.; Bakir-Gungor, B.; Jabeer, A.; Goy, G.; Qureshi, R.; Showe, L.C. Recursive Cluster Elimination based Rank Function (SVM-RCE-R) implemented in KNIME. F1000Research 2021, 9, 1255. [Google Scholar] [CrossRef]
  41. Yousef, M.; Jabeer, A.; Bakir-Gungor, B. SVM-RCE-R-OPT: Optimization of Scoring Function for SVM-RCE-R. In Database and Expert Systems Applications—DEXA 2021 Workshops; Kotsis, G., Tjoa, A.M., Khalil, I., Moser, B., Mashkoor, A., Sametinger, J., Fensel, A., Martinez-Gil, J., Fischer, L., Czech, G., et al., Eds.; Springer: Cham, Switzerland, 2021; Volume 1479, pp. 215–224. [Google Scholar] [CrossRef]
  42. Yousef, M.; Abdallah, L.; Allmer, J. maTE: Discovering expressed interactions between microRNAs and their targets. Bioinformatics 2019, 35, 4020–4028. [Google Scholar] [CrossRef]
  43. Yousef, M.; Ülgen, E.; Sezerman, O.U. CogNet: Classification of gene expression data based on ranked active-subnetwork-oriented KEGG pathway enrichment analysis. PeerJ Comput. Sci. 2021, 7, e336. [Google Scholar] [CrossRef]
  44. Yousef, M.; Goy, G.; Mitra, R.; Eischen, C.M.; Jabeer, A.; Bakir-Gungor, B. miRcorrNet: Machine learning-based integration of miRNA and mRNA expression profiles, combined with feature grouping and ranking. PeerJ 2021, 9, e11458. [Google Scholar] [CrossRef] [PubMed]
  45. Yousef, M.; Goy, G.; Bakir-Gungor, B. miRModuleNet: Detecting miRNA-mRNA Regulatory Modules. Front. Genet. 2022, 13, 767455. [Google Scholar] [CrossRef] [PubMed]
  46. Yousef, M.; Ozdemir, F.; Jaber, A.; Allmer, J.; Bakir-Gungor, B. PriPath: Identifying dysregulated pathways from differential gene expression via grouping, scoring, and modeling with an embedded feature selection approach. BMC Bioinform. 2023, 24, 60. [Google Scholar] [CrossRef] [PubMed]
  47. Yazici, M.U.; Marron, J.S.; Bakir-Gungor, B.; Zou, F.; Yousef, M. Invention of 3Mint for feature grouping and scoring in multi-omics. Front. Genet. 2023, 14, 1093326. Available online: https://www.frontiersin.org/articles/10.3389/fgene.2023.1093326 (accessed on 18 March 2023). [CrossRef]
  48. Yousef, M.; Sayıcı, A.; Bakir-Gungor, B. Integrating Gene Ontology Based Grouping and Ranking into the Machine Learning Algorithm for Gene Expression Data Analysis. In Database and Expert Systems Applications—DEXA 2021 Workshops; Springer: Cham, Switzerland, 2021; pp. 205–214. [Google Scholar] [CrossRef]
  49. Yousef, M.; Kumar, A.; Bakir-Gungor, B. Application of Biological Domain Knowledge Based Feature Selection on Gene Expression Data. Entropy 2020, 23, 2. [Google Scholar] [CrossRef]
  50. Xu, Q.-S.; Liang, Y.-Z. Monte Carlo cross validation. Chemom. Intell. Lab. Syst. 2001, 56, 1–11. [Google Scholar] [CrossRef]
  51. Kolde, R.; Laur, S.; Adler, P.; Vilo, J. Robust rank aggregation for gene list integration and meta-analysis. Bioinformatics 2012, 28, 573–580. [Google Scholar] [CrossRef]
  52. Berthold, M.R.; Cebron, N.; Dill, F.; Gabriel, T.R.; Kötter, T.; Meinl, T.; Ohl, P.; Thiel, K.; Wiswedel, B. KNIME—The Konstanz information miner. ACM SIGKDD Explor. Newsl. 2009, 11, 26–31. [Google Scholar] [CrossRef]
  53. Brown, G.; Pocock, A.; Zhao, M.-J.; Lujan, M. Conditional Likelihood Maximisation: A Unifying Framework for Information Theoretic Feature Selection. J. Mach. Learn. Res. 2012, 13, 27–66. [Google Scholar]
  54. Peng, H.; Long, F.; Ding, C. Feature selection based on mutual information criteria of max-dependency, max-relevance, and min-redundancy. IEEE Trans. Pattern Anal. Mach. Intell. 2005, 27, 1226–1238. [Google Scholar] [CrossRef] [PubMed]
  55. Kent, J.T. Information gain and a general measure of correlation. Biometrika 1983, 70, 163–173. [Google Scholar] [CrossRef]
  56. Chen, T.; He, T. xgboost: eXtreme Gradient Boosting. R Package Vers. 0.4-2 2015, 4, 1–4. [Google Scholar]
  57. Liang, J.; Hou, L.; Luan, Z.; Huang, W. Feature Selection with Conditional Mutual Information Considering Feature Interaction. Symmetry 2019, 11, 858. [Google Scholar] [CrossRef]
  58. Ding, C.; Peng, H. Minimum Redundancy Feature Selection from Microarray Gene Expression Data. J. Bioinform. Comput. Biol. 2005, 03, 185–205. [Google Scholar] [CrossRef]
  59. Wang, P.; Hu, L.; Liu, G.; Jiang, N.; Chen, X.; Xu, J.; Zheng, W.; Li, L.; Tan, M.; Chen, Z.; et al. Prediction of Antimicrobial Peptides Based on Sequence Alignment and Feature Selection Methods. PLoS ONE 2011, 6, e18476. [Google Scholar] [CrossRef] [PubMed]
  60. Teimouri, H.; Medvedeva, A.; Kolomeisky, A.B. Bacteria-Specific Feature Selection for Enhanced Antimicrobial Peptide Activity Predictions Using Machine-Learning Methods. J. Chem. Inf. Model. 2023, 63, 1723–1733. [Google Scholar] [CrossRef] [PubMed]
  61. Joseph, S.; Karnik, S.; Nilawe, P.; Jayaraman, V.K.; Idicula-Thomas, S. ClassAMP: A Prediction Tool for Classification of Antimicrobial Peptides. IEEE/ACM Trans. Comput. Biol. Bioinform. 2012, 9, 1535–1538. [Google Scholar] [CrossRef] [PubMed]
  62. Tornesello, A.L.; Borrelli, A.; Buonaguro, L.; Buonaguro, F.M.; Tornesello, M.L. Antimicrobial Peptides as Anticancer Agents: Functional Properties and Biological Activities. Molecules 2020, 25, 2850. [Google Scholar] [CrossRef] [PubMed]
Figure 1. AMP-GSM workflow based on grouping, scoring, and modeling.
Applsci 13 05106 g001
Figure 2. Feature representation based on different groups for antimicrobial peptides.
Applsci 13 05106 g002
Figure 3. Performance evaluation of different feature selection techniques and the AMP-GSM approach on the Gram-negative dataset of Dataset 1 using 10 features and 100-fold MCCV.
Applsci 13 05106 g003
Figure 4. Performance evaluation of different feature selection techniques and the AMP-GSM approach on the Gram-positive dataset of Dataset 1 using 10 features and 100-fold MCCV.
Applsci 13 05106 g004
Table 1. A list of feature groups and the features that are associated with them, based on [2,38].
GroupFeature SetNumber of Features
Physico-chemicalSequence Length, Normalized Hydrophobic Moment, Normalized Hydrophobicity, Net Charge, Isoelectric Point, Penetration Depth…10
Amino acid compositionA, C, E, D, G, F, I, H, K, M…20
Dipeptide compositionGW, GV, GT, GS, GR, GQ, ME, MD, MG, MF, MA, MC, MM, ML, MN…400
Physico-chemical composition_NormalizedVDWVC2, _PolarizabilityC2, _PolarizabilityC3, _ChargeC1…21
Physico-chemical transition_SecondaryStrT13, _SecondaryStrT12, _HydrophobicityT23, _NormalizedVDWVT23, _ChargeT12…21
Physico-chemical distribution_NormalizedVDWVD1075, _PolarityD1075, _SecondaryStrD2075, _SolventAccessibilityD1100…105
Normalized Moreau–Broto autocorrelationMoreauBrotoAuto_ResidueASA28, MoreauBrotoAuto_ResidueVol30…240
Moran autocorrelationMoranAuto_FreeEnergy8, MoranAuto_FreeEnergy9, MoranAuto_Steric8 …240
Geary autocorrelationGearyAuto_Mutability23, GearyAuto_Mutability21, GearyAuto_FreeEnergy24, …240
Sequence order coupling numberQSO26, QSO27, QSO_ex50, QSO_ex24, QSO_ex18, QSO_ex19…60
Quasi-sequence-orderTaugrant23, taugrant24, tausw8, tausw9, tausw6, tausw7…100
Pseudo-amino acid compositionPAAC34, PAAC35, APAAC20, PAAC38, PAAC39…50
Table 2. Performance results of the AMP-GSM approach on the Gram-negative dataset of Dataset 1 (for 12 groups and 100-fold MCCV) *.
#Groups#Features (Mean)Acc (Mean)Sn (Mean)Sp (Mean)F-Measure (Mean)AUC (Mean)Pr (Mean)
101039.990.920.910.930.910.980.92
9807.190.930.930.920.920.980.91
8714.010.940.940.930.930.980.92
7571.080.920.930.920.910.980.90
6439.450.920.930.910.910.980.90
5306.470.920.940.900.910.980.89
4190.910.920.940.910.910.980.90
3121.250.930.950.910.920.980.90
260.60.930.950.920.930.990.91
1100.950.980.930.950.990.92
* The average number of features is shown in the column #Features. Firstly, the features from the top group are used to create a model, which is then tested using the testing part of the data. Secondly, the top one and two groups are used to create a model, which is subsequently tested. Similarly, the model is created using the features from the top 10 groups, and it is then tested. Acc: Accuracy, Sn: Sensitivity, Sp: Specificity, AUC: Area Under Curve, Pr: Precision.
Table 3. Performance results of the AMP-GSM approach on the Gram-positive dataset of Dataset 1 (for 12 groups and 100-fold MCCV) *.
#Groups#Features (Mean)Acc (Mean)Sn (Mean)Sp (Mean)F-Measure (Mean)AUC (Mean)Pr (Mean)
101026.750.880.690.960.770.950.91
9795.750.880.720.960.790.950.90
8657.260.870.700.950.770.950.89
7526.350.880.730.940.780.950.88
6351.870.880.750.940.800.950.87
5226.480.890.780.940.820.960.88
4160.750.890.770.940.810.950.87
3103.510.900.800.950.830.960.89
244.280.910.820.950.850.960.90
1100.920.890.930.870.980.87
* The average number of features is shown in the column #Features. Firstly, the features from the first top group are used to create a model, which is then tested using the testing part of the data. Secondly, the top one and two groups are used to create a model, which is subsequently tested. Similarly, the model is created using the features from the top 10 groups for j = 10, and is then tested. Acc: Accuracy, Sn: Sensitivity, Sp: Specificity, AUC: Area Under Curve, Pr: Precision.
Table 4. Performance results of AMP-GSM approach for the Gram-negative dataset of Dataset 1 without using physico-chemical properties (for 11 groups and 100-fold MCCV) *.
#Groups#Features (Mean)Acc (Mean)Sn (Mean)Sp (Mean)F-Measure (Mean)AUC (Mean)Pr (Mean)
3169.730.880.870.890.860.960.87
2100.650.890.890.890.870.950.86
138.270.870.860.880.850.930.85
* Acc: Accuracy, Sn: Sensitivity, Sp: Specificity, AUC: Area Under Curve, Pr: Precision.
Table 5. Performance results of the AMP-GSM approach for the Gram-positive dataset of Dataset 1 without using physico-chemical properties (for 11 groups and 100-fold MCCV) *.
#Groups#Features (Mean)Acc (Mean)Sn (Mean)Sp (Mean)F-Measure (Mean)AUC (Mean)Pr (Mean)
3135.410.850.690.920.740.920.81
285.270.840.670.910.720.910.79
137.670.820.630.910.680.900.78
* Acc: Accuracy, Sn: Sensitivity, Sp: Specificity, AUC: Area Under Curve, Pr: Precision.
Table 6. Performance metrics of different feature selection techniques with 10 features on the Gram-negative dataset of Dataset 1, using 100-fold MCCV *.
Results for the Gram-Negative Dataset (10 Features, 100-Fold MCCV)
ML MethodFS MethodAccuracySensitivity
(Recall)
SpecificityPrecisionAUCF1
LogitBoostXGB0.96 ± 0.030.99 ± 0.030.94 ± 0.060.93 ± 0.070.97 ± 0.020.95 ± 0.04
LogitBoostIG0.96 ± 0.040.98 ± 0.030.94 ± 0.060.93 ± 0.070.97 ± 0.020.95 ± 0.04
AdaboostMRMR0.52 ± 0.090.95 ± 0.090.19 ± 0.220.48 ± 0.070.50 ± 0.130.63 ± 0.04
RFCMIM0.55 ± 0.110.97 ± 0.080.23 ± 0.230.50 ± 0.090.56 ± 0.140.65 ± 0.05
RFAMP-GSM0.95 ± 0.040.98 ± 0.030.93 ± 0.070.92 ± 0.080.99 ± 0.0060.95 ± 0.05
* ML: Machine Learning, FS: Feature Selection, AUC: Area Under Curve.
Table 7. Performance metrics of different feature selection techniques with 10 features on the Gram-positive dataset of Dataset 1, using 100-fold MCCV *.
Results for the Gram-Positive Dataset (10 Features, 100-Fold MCCV)
ML MethodFS MethodAccuracySensitivity
(Recall)
SpecificityPrecisionAUCF1
RFIG0.90 ± 0.040.92 ± 0.090.89 ± 0.070.81 ± 0.110.94 ± 0.030.85 ± 0.06
RFXGB0.89 ± 0.050.88 ± 0.100.89 ± 0.080.81 ± 0.120.91 ± 0.050.83 ± 0.07
RFMRMR0.49 ± 0.170.88 ± 0.150.32 ± 0.310.41 ± 0.140.55 ± 0.140.53 ± 0.07
RFCMIM0.43 ± 0.140.94 ± 0.110.20 ± 0.240.36 ± 0.080.53 ± 0.110.51 ± 0.05
RFAMP-GSM0.92 ± 0.040.89 ± 0.100.93 ± 0.050.87 ± 0.090.98 ± 0.020.87 ± 0.06
* ML: Machine Learning, FS: Feature Selection, AUC: Area Under Curve.
Table 8. Comparison of the most important 10 features found in the first two groups in the AMP-GSM method with the 10 most informative features identified by the feature selection methods for Gram-negative and Gram-positive datasets.
Gram-Negative Dataset
FS/CLSF * MethodFeatures Identified by FS MethodsFeatures Identified by AMP-GSMCommon Features between the Top Features of the FS Method and AMP-GSM
XGB/LogitboostNet Charge
MoranAuto_AvFlexibility8
Tilt Angle
Normalized Hydrophobic Moment
MoranAuto_Hydrophobicity15
MoranAuto_ResidueVol5
_ChargeC1
QSO_ex29
Isoelectric Point
tausw2
SequenceLength
Normalized Hydrophobic Moment
Normalized Hydrophobicity
Net Charge
Isoelectric Point
Penetration Depth
Tilt Angle
Disordered Conformation Propensity
Linear Moment
Propensity to in vitro Aggregation
Net Charge
Tilt Angle
Normalized Hydrophobic Moment
Isoelectric Point
Gram-Positive Dataset
IG/RFIsoelectric Point
Net Charge
Disordered Conformation Propensity
Normalized Hydrophobicity
_ChargeC1
_PolarityC3
tausw9
taugrant6
_PolarityT13
tausw6
SequenceLength
Normalized Hydrophobic Moment
Normalized Hydrophobicity
Net Charge
Isoelectric Point
Penetration Depth
Tilt Angle
Disordered Conformation Propensity
Linear Moment
Propensity to in vitro Aggregation
Normalized Hydrophobicity
Net Charge
Isoelectric Point
Disordered Conformation Propensity
* FS: Feature Selection, CLSF: Classification.
Table 9. Performance evaluation of AMP-GSM with a DNN model for Dataset 2 [33].
MethodEvaluationSensitivity (%)Specificity (%)Accuracy (%)AUC (%)F1 Measure
DNN Model10-fold CV88.81 (±3.53)94.21 (±2.68)91.51 (±0.89)96.58 (±0.66)-
CMIM-DT10-fold MCCV51.34 ± 0.1751.40 ± 0.1751.37 ± 0.0351.37 ± 0.0350.02 ± 0.09
IG-RF10-fold MCCV88.70 ± 0.0291.40 ± 0.0290.05 ± 0.0196.36 ± 0.00789.91 ± 0.01
mRMR-RF10-fold MCCV33.70 ± 0.1867.41 ± 0.2150.56 ± 0.0350.80 ± 0.0537.80 ± 0.14
AMP-GSM Model10-fold MCCV91.01 (±0.23)92.97(±0.03)91.71 (±0.13)97.07 (±0.06)91.59 (±0.15)
Table 10. Performance evaluation of AMP-GSM with other traditional feature selection and classification models for Dataset 3 [35].
MethodEvaluation SetAccuracySensitivitySpecificityAUC
AIPpred5-Fold CV0.730.750.710.80
ERT5-Fold CV0.730.730.720.79
SVM5-Fold CV0.650.640.670.70
k-NN5-Fold CV0.640.510.770.69
CMIM-LogitBoost5-Fold MCCV0.540.670.400.55
IG-AdaBoost5-Fold MCCV0.690.660.720.73
mRMR-LogitBoost5-Fold MCCV0.500.790.200.50
AMP-GSM Model5-Fold MCCV0.9910.991
Disclaimer/Publisher’s Note: The statements, opinions and data contained in all publications are solely those of the individual author(s) and contributor(s) and not of MDPI and/or the editor(s). MDPI and/or the editor(s) disclaim responsibility for any injury to people or property resulting from any ideas, methods, instructions or products referred to in the content.

