Abstract
Tea infusion is the most popular drink in Poland, and the tea bush is the most fluoride-rich among plants. Excessive fluoride intake can adversely affect human health by causing dental or skeletal fluorosis. This study aimed to determine the fluoride content in tea infusion depending on the tea types, the degree of fragmentation of the leaves, brewing time, and conducting a health risk assessment for the consumer in Poland. Infusions of 28 popular teas (green leafy tea, pu-erh leafy tea, white leaf tea, black leaf tea, black granulated tea, and black in bags) available in the Polish market were analyzed concerning a fluoride amount using the potentiometric method. Tea leaf size is an important parameter affecting fluoride’s release during tea brewing. An increase in fluoride content in the infusion was also shown with the extension of the brewing time. It was also revealed that significantly higher fluoride content was found in infusions of black tea prepared from tea in bags than from “loose” leaves. The conducted health risk assessment indicates the possibility of adverse health effects caused by fluoride consumption, particularly from infusions of black and green tea purchased in bags.
1. Introduction
Tea is a food product made of young leaves or undeveloped leaf buds from the tea bush, which, subjected to appropriate processing, are used to prepare the infusion. The most famous are the Chinese tea Camellia sinensis (L.) Kuntze and the Assamese tea Camelia sinensis var. assamica (Theaceae), differing in the place of occurrence, size of bushes, and leaves. Next to water, tea infusion is the most popular beverage consumed worldwide. Tea has many favorable properties and has a positive effect on human health. Tea infusion contains many antioxidants, such as polyphenols, which help protect the body cells from damage caused by free radicals. As a result, teas contribute to maintaining good health and preventing diseases []. Polyphenols in tea help maintain normal cholesterol and blood pressure levels, preventing cardiovascular diseases []. The tea infusion’s caffeine helps improve brain functions, including the ability to concentrate and short-term memory []. In addition, studies have shown that regular tea drinking can reduce the risk of neurodegenerative diseases, such as Alzheimer’s and Parkinson’s []. Tea can help reduce stress and improve your well-being. Ingredients such as theanine, which is present in green tea, help to relieve tension and improve mood []. It is worth noting, however, that despite these positive results, further research is needed to confirm these benefits and understand the mechanisms of action of the components present in the tea infusion.
Drinking tea infusion in moderation should not harm your health, but consuming it excessively can cause adverse effects. Certain substances in tea, such as caffeine and tannins, can hinder the absorption of certain nutrients. Tannins are chemical compounds that bind to proteins and minerals in food and the body, which can affect their absorption by the body. Studies have shown that tea tannins can inhibit iron absorption, especially in people with iron deficiency or anemia []. It is worth emphasizing, however, that the negative effect of tannins on the absorption of nutrients can only occur when drinking a large amount of tea infusion. In addition, excessive tea consumption can cause stress and anxiety, sleep problems, heartburn, frequent abdominal pain, caffeine addiction, dehydration, and many other symptoms [].
Tea infusion provides phenolic compounds and selected minerals, often being their primary source in the human diet []. The tea bush is the most fluoride-rich among the plants and can contain even more than a thousand mg/kg of dry leaves []. Many factors affect the fluoride content of tea and its products. The most important include its concentration and form in the soil and air, place of cultivation, rainfall, genetic condition of the plant, and raw material used for production [,]. Tea bushes grown on older plantations accumulate more fluoride than bushes grown on younger plantations. Different fluoride concentrations in various types of tea grown in the same place confirm the influence of genetic differences of tea plants in the uptake and accumulation of fluoride. The small-leaved subspecies contain significantly higher amounts of fluoride than the large-leaved subspecies []. The fluoride concentration in the tea plant varies in its parts, with the highest concentration found in the leaves and increasing with age. The highest amounts of this element are found in mature, old leaves, much smaller in young leaves and buds, and the smallest amounts of fluoride are found in twigs, stems, and roots [].
The Scientific Committee on Health and Environmental Risks (SCHER) of the European Commission stated that “Fluoride is not considered to be essential for human growth and development” []. Research results confirm the effectiveness and beneficial effects of low concentrations of fluoride used in the prevention and treatment of dental caries. Still, on the other hand, long-term exposure to elevated fluoride concentrations has undesirable effects []. Fluoride’s harmfulness is affected by factors such as dose and exposure time. The human body may be exposed to the toxic effects of fluoride through the presence of this element in food or as a result of contamination of the natural environment with fluoride compounds. The consequence of this may be dental and skeletal fluorosis. In addition, exposure to fluoride among pregnant women has been shown to increase with tea consumption, which is associated with the likely risk of developmental neurotoxicity to their children []. Dental fluorosis initially manifests as white patches that darken and the enamel cracks. In the case of bone-forming cells, unfavorable changes occur, causing demineralization of bone tissue. As a result, bone fragility increases, while ligaments become less flexible. Fluorosis is a disease associated with long-term exposure to fluoride, which is too high in the body []. The disease is endemic in many countries due to environmental or industrial exposure. It occurs mainly in countries where the level of fluoride in drinking water is very high, especially in developing countries. In addition, dietary calcium and vitamin D deficiency can exacerbate skeletal fluorosis []. Nonendemic cases of skeletal fluorosis have been described in the literature. Cook et al. conducted a literature review in 2020 and found 19 cases of skeletal fluorosis []. About half of these 19 cases have been attributed, either partially [,] or fully [,,,,], to chronic consumption of large amounts of various types of tea. Estimated daily fluoride intake from tea ranged from 13 to 74 mg throughout >20 years. In the remaining cases, the sources of fluoride were toothpaste and inhalation of fumes containing this element. There are many scientific reports on fluoride content in various tea infusions, simultaneously attempting to assess the health risk, mainly in countries where tea consumption is high [,,,,,,,,,,,,,,,]. Conclusions from these studies, in most cases, indicate that tea infusion is an important and insufficiently considered source of fluoride exposure, and its consumption, especially in larger quantities, may pose a potential health risk. Of the 16 cited publications, 6 indicate that the risk assessment did not show a significant health risk from the consumption of tea infusions [,,,,,]. In addition, Ruxton and Bond [] conclude that more significant dental health benefits could be achieved for the UK population if the average adult intake increased to four to five servings per day. However, this conclusion is not supported by their research. Mazur et al. [] reviewed the results of randomized controlled trials on the use of green tea and its effect on the processes of gingivitis, periodontitis, and caries. Green tea has been found to affect gingivitis and periodontitis positively. Based on these results, sufficient evidence supports the use of green tea in preventing and treating periodontal disease. This review shows that there is currently insufficient evidence to recommend using green tea to treat tooth decay. SCHER indicates that topical application of fluoride is most effective in preventing tooth decay. Topical application of fluoride maintains oral fluoride levels and helps prevent caries with reduced systemic availability. The effectiveness of population policies, such as fluoridation of drinking water, milk or salt, in reducing social disparities in oral health remains insufficiently substantiated [].
The tea infusion is the most popular drink in Poland, accounting for over 40% of all drinks consumed in the winter and 25% in the summer season. The annual consumption of tea per capita in Poland is almost 1 kg, usually finished 2–3 times a day. About 20% of consumers drink tea more often, 4–5 times a day []. So far, two works have been published to assess the concentration and daily intake of fluoride from tea and herbal infusions popular in Poland [,]. In both publications, there was no health risk assessment related to fluoride consumption from tea infusions, and opposing conclusions were presented. Szmagara et al. [] indicate that the general value of fluoride in the analyzed tea and herbs was not high enough to cause a risk of fluorosis, even with the use of 15 min of brewing time. Malinowska et al. [], based on the results obtained, state that consumers drinking some types of tea infusions in large quantities may be exposed to large amounts of fluoride contained in drinking tea.
Therefore, the work aimed to determine the fluoride content in tea infusion depending on the tea types, the degree of fragmentation of the leaves, brewing time, and conducting a health risk assessment for the consumer in Poland.
2. Materials and Methods
The research material consisted of 27 samples of tea of various types from different manufacturers purchased in stores in Lublin (Poland). Six samples of green leafy tea, three samples of pu-erh leafy tea, four samples of white leaf tea, six samples of black leaf tea, three samples of black granulated tea, and five samples of black express tea were purchased. To obtain a homogeneous sample in the case of black express tea, the contents of the bags were spilled and mixed.
Tea infusions were prepared according to PN-ISO 3103: 1996 Tea—Preparation of liquor for use in sensory tests. In short, 2 g of tea leaves, smaller than 2 mm and more than 1.5 mm, were added to 100 mL of deionized water (Hydrolab system HLP10p, Poland) at 100 °C and brewed under cover for 6 min. Then the infusion was filtered through Whatman No.1 to a volumetric flask, and after cooling to room temperature, deionized water was added to make up 100 mL volume. The amount of fluoride in tea infusions was determined by the potentiometric method, according to Shyu []. That is, 20 mL was taken from the prepared sample, 20 mL of Tisab I (Sigma-Aldrich, St. Louis, MO, USA) solution was added, then the content was mixed, and fluoride was measured by the potentiometric technique. ISE-F/IJ-F Ionode Pty Ltd. (Australia) fluoride ion-selective electrode and the Hi 221 m from Hanna Instruments (USA) were used. Each tea infusion sample was analyzed in three repetitions.
A primary solution was prepared to make a calibration curve by adding 10 mL of a certified reference solution of fluoride ions 1000 mg/L ± 4 mg/L TraceCERT (Sigma-Aldrich) to a 100 mL volumetric flask. The appropriate volume was measured in a 20 mL volumetric flask from the prepared primary solution to obtain solutions in the concentration range of 0.5 mg/L–10 mg/L. Calibration was performed before each measuring series.
To examine the effect of fragmentation of the leaf, the leafy tea samples (green, pu-erh, white, and black) were sieved through the sieve with the size of the stitches 2.5, 2, 1.5, 1.02, 0.75, and 0.5 mm, and each of the fractions was brewed for 6 min. The effect of brewing time (2, 4, 6, 8, and 10 min) on the fluoride content in the tea infusion was examined on one sample of each type of tea. In the case of leafy teas, a fraction with the size of leaves smaller than 2 mm and larger than 1.5 mm was used. The correctness of fluoride ion analysis was confirmed by analyzing the certified reference material sample (SPS-NUTR WW1, SpectraPure Standards) and comparison of the obtained measurement value 1.02 ± 0.3 mg/L with an accredited value of 1.00 ± 0.01 mg/L.
Data were analyzed using one-way ANOVA, followed by Duncan’s test, using the SAS statistical system (SAS version 9.1; SAS Inst., Cary, NC, USA). The significance of all the tests was set at p ≤ 0.05.
The health risk assessment (noncarcinogenic hazard) related to the ingestion of fluoride from tea infusion was performed using the target hazard quotient (THQ) calculated by the formula []:
where the chronic daily intake (CDI) is the estimated amount of fluoride intake per kilogram of body weight, and the RfD is the oral fluoride intake reference dose of 0.06 (mg/kg/day) []. A THQ of <1 indicates an insignificant risk level, whereas a THQ of >1 implies a potential noncancer-causing health impact.
THQ = CDI/RfD
The CDI value was calculated using the equation:
where C is the fluoride concentration in tea infusion (mg/L), DI is the average daily intake rate of tea (L/day), EF is exposure frequency (day/year), ED is the exposure duration (year), BW is body weight (kg), and AT is the averaging time (days). The health risk assessment was carried out with the division of the population in terms of age and gender. The average daily intake of tea infusion was determined based on sufficient water intake for a given population group, assuming that 70% of this intake is provided in the form of liquids and that 50% of these liquids are provided in the form of tea infusion. The value of the daily consumption of tea infusion determined in this way is presented in Table 1 and marked with the abbreviation DI50%. The division of the population into groups and the adopted values of body weight and the value of sufficient water intake were adopted in accordance with the nutritional standards for the Polish population [] and are presented in Table 1.
CDI = (C × DI × EF × ED)/(BW × AT)

Table 1.
Data used to calculate chronic daily intake of fluoride from tea infusion [].
3. Results
3.1. Comparison of Fluoride Content in Tea Infusion with Different Degrees of Leaf Fragmentation
The data presented in Figure 1 indicate that regardless of the type of tea used to prepare the infusion, the highest fluoride content is found in the infusion prepared from leaves with the highest degree of fragmentation—leaves with a size of 0.5 to 0.75 mm. Among the tested tea leaf size ranges, the most statistically significant difference can be observed only between the highest degree of fragmentation and the rest of the analyzed ranges. The increase in fluoride content in the infusion between the highest and lowest degree of leaf fragmentation was different for the studied types of tea and amounted to 30.1% for green tea, 26.9% for pu-erh tea, 22.7% for black tea, and 14.5% for white tea.
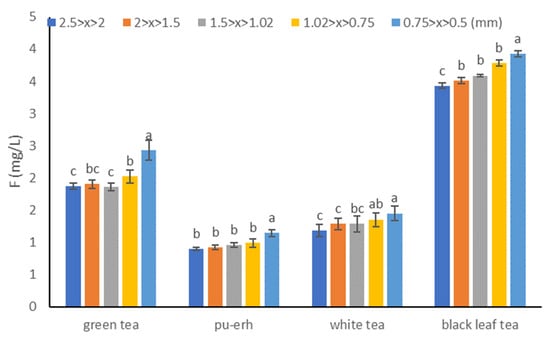
Figure 1.
Mean and SD fluoride concentration (mg/L) in the tea infusions for different degrees of leaf fragmentation. Different letters (a, b, c, etc.) show a significant difference with p < 0.05. The differences relate to each type of tea separately.
3.2. Influence of Brewing Time on Fluoride Content in Tea Infusions
The results concerning the fluoride content in the infusions of the analyzed types of tea depending on the brewing time are presented in Figure 2. They indicate an increase in the fluoride content in the infusion with the lengthening of the brewing time. After 2 min of brewing, 77.3% fluoride was extracted in the black tea-in-bags infusion compared to 10 min, which was the highest value. This is probably related to the degree of tea fragmentation because it was the largest in the case of this tea. Other types of tea can be ranked as follows: black granulated (70.9%), black leaf (69.2%), white (57.1%), pu-erh (55.0%), and green (48.7%).
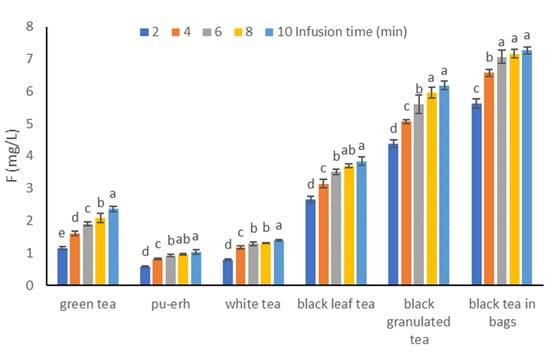
Figure 2.
Mean and SD fluoride concentration (mg/L) in the tea infusions for 2, 4, 6, 8, and 10 min infusions. Different letters (a, b, c, etc.) show a significant difference with p < 0.05. The differences relate to each group of tea separately.
The highest increase in fluoride content in the infusion was observed when the brewing time was changed from 2 to 4 min and amounted to 49.0%, 42.3%, 40.4%, 18.4%, 16.9%, and 15.8%, respectively, for white, pu-erh, green, black leaf, and black express and granulated. After 6 min of brewing, more than 90% of fluorides were extracted for four types of tea compared to 10 min (black tea bags 97.1%, white tea 92.6%, black leaf tea 91.5%, and black granulated tea 90.6%), and in the case of pu-erh tea and green, these ratios were 88.0% and 80.5%, respectively.
3.3. Fluoride Concentration in Infusions of Different Types of Tea
The results of the fluoride content analysis in tea infusions are presented in Table 2, and the results are grouped for individual types of tea in Figure 3. Infusions of different types of tea showed significantly different contents of fluoride ions in the range from 0.71 to 7.96 mg/L. Statistically, the most fluorides were found in infusions of granulated black tea and black tea in bags, and the average content was 6.33 ± 0.8 and 6.13 ± 1.50 mg/L, respectively. Lower content of fluorides in infusions was found in black leaf tea (average 3.72 ± 1.53 mg/L). Comparable to black leaf tea, fluoride content was found in green tea infusions (average 2.40 ± 0.93 mg/L). The lowest fluoride content was found in pu-erh tea infusions (average 0.89 ± 0.16 mg/L), although they did not differ statistically significantly from the content of white tea infusions (average 1.57 ± 0.32 mg/L).
Table 2.
Content of fluoride (mg/L) in infusions of selected teas.
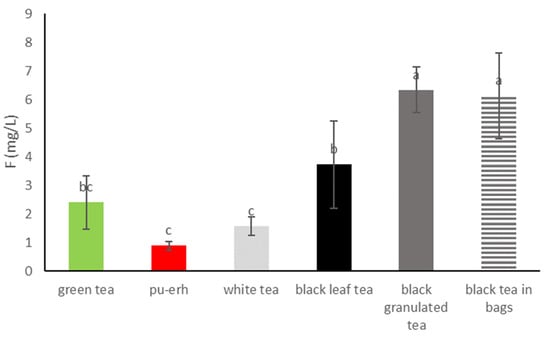
Figure 3.
Mean and SD fluoride concentration (mg/L) in the tea groups. Different letters (a, b, c, etc.) show a significant difference with p < 0.05.
4. Discussion
The tea leaf size is an important parameter affecting the release of fluoride during tea brewing. With the increase in leaf fragmentation, the surface area through which fluoride extraction can occur increases, probably accelerating their transition to the infusion. To our knowledge, no studies have been published describing the exact effect of tea leaf size on fluoride content in the infusion. Pattaravisitsate et al. [] published a study showing that the average fluoride concentration in infusions prepared from fragmented tea leaves was higher than that of unfragmented tea leaves. In this study, significant differences in leaf size were observed in the unfragmented tea samples (average 17.7 ± 12.2 mm; range 0.6–41.1 mm), and the particle size of the fragmented tea samples was smaller, 0.4–0.6 mm. Similar conclusions were reached by Gulati et al. [], who found that fluoride leaching is the lowest in the case of leaf tea compared to powdered tea, but they did not precisely characterize the size of the tea leaves used to prepare the infusion.
Gulati et al. [] researched the effect of brewing time (2, 4, 6, 8, and 10 min) on the fluoride content in the infusion. They showed that after 6 min of brewing, the fluoride content reaches its maximum. Our results indicate that increasing the brewing time from 6 to 10 min further increases the fluoride content in the infusion. These observations are consistent with the data presented in the literature [,,,,]. Chan et al. [] examined the effect of brewing time on fluoride content in the 2, 10, and 30-min range. They showed that most of the fluoride was extracted into the tea infusion after 10 min because they did not observe significant differences in the fluoride content between 10 and 30 min of infusion time.
Lu et al. [] showed that the fluoride content in tea indicates its quality. They observed significant negative correlations between the content of fluoride and the content of total polyphenols and amino acids. Older tea leaves containing more fluoride are used to produce lower-quality teas, such as tea in bags and granules. Studies by Szmagara et al. [] and Malinowska et al. [] showed that significantly higher fluoride content was found in black tea infusions made from bags than from leaves. On the other hand, Valadas et al. [] found that the fluoride content in leaf tea infusions is higher than in tea in bags. Due to the high variability of the fluoride content in tea leaves resulting from many factors (place of cultivation, rainfall, plant genetics, etc.) and various tea brewing conditions (time, tea weight to water volume ratio, and form of tea), the fluoride content in the infusion may be within a wide range. This is reflected in the literature data, according to which the fluoride content in tea infusions ranges for black leaf tea from 0.32 to 6.81 mg/L, black tea in bags from 0.6 to 6.01 mg/L, black granulated tea from 1.06 to 6.87 mg/L, leafy green from 0.06 to 5.31 mg/L, white from 0.37 to 5.39 mg/L, and pu-erh from 0.39 to 2.87 mg/L [,,,,,,,,,,].
The noncarcinogenic risk of exposure to fluoride from tea infusions was assessed using the target hazard quotient (THQ), the values of which were calculated for different population groups and are presented in Table 3. This parameter was determined for each tea sample separately, giving a total of 459 possible cases. In 38.4% of all analyzed cases, this parameter exceeded the value of 1, indicating the likelihood of adverse health effects. When analyzing individual types of tea, it should be noted that in the case of pu-erh tea, the THQ parameter was lower than 1 in all studied cases. In the case of white tea, this parameter was greater than 1 in 1.5% of cases, and in the case of green tea, in 12.8%. In the case of these teas, the THQ parameter was greater than 1, especially in the group of children aged 3 to 9 years. Opydo-Szymaczek and Opydo [] researched the fluorine content in Polish drinks intended for feeding infants and small children (below 3 years of age). Forty-three brands of juices and juice-flavored drinks and twenty-three instant teas were evaluated. The results of the conducted studies indicate that consuming juices and juice drinks should not increase the risk of dental fluorosis in children because the fluoride values in all products are low. However, some tea drinks intended for children’s nutrition can significantly increase children’s exposure to fluoride.
Table 3.
Values of the THQ parameter for various population groups.
Black teas, in terms of the frequency of exceeding the THQ value above 1, can be ranked as follows: black leaf tea 41.2%, in bags 84.7%, and granulated 94.1%. Based on the presented results, it can be concluded that the consumption of fluoride from black tea infusions is characterized by a much higher health risk compared to other groups of teas. Exceptionally high risk is associated with consuming black tea infusions, granulated, and in bags. Very often, in the literature on determining the health risk associated with fluoride consumption from tea infusions, higher consumption of infusions of 1 L is assumed. If such intake is thought for age groups over 12 years, the THQ parameter is greater than 1 in 46.8% of cases, and individual types of tea can be ordered as follows: pu-erh 0%, white 1.5%, green 23.5%, black leafy 55.9%, black in bags 96.5%, and black granulated 100% (Table S1—Supplementary Material). This, of course, indicates that a higher daily intake increases the risk associated with the intake of fluoride from tea infusion. Particular attention should be paid to children’s consumption of black tea infusions. For example, a 3-year-old child consuming 0.438 L of black tea containing an average of 5.14 mg/L of fluoride (average of all types of black tea tested in this study) will consume 0.19 mgF/kg/day. This is approximately three to four times the optimal fluoride intake (0.5 to 0.7 mgF/kg/day) that should provide maximum protection against caries with minimal dental fluorosis []. At the same time, it is almost twice as high as the intake level (0.1 mgF/kg/day) above which fluorosis occurs according to some authors [].
The main limitation of the described research is that it represents only a particular segment of the tea market in Poland, and as we have shown earlier, the content of fluoride in infusions of various teas is very variable. To increase the representation of the tea market in Poland and better characterize the health risk for the consumer, the THQ parameter was determined based on the results of the recently presented research by Szmagara et al. [] (Tables S2–S9—Supplementary Material). Table 4 displays the percentage share of analyzed cases for which the THQ parameter exceeded the value of 1. In their research, Szmagara et al. used 5- and 15-min brewing times and a different tea weight to water volume ratio of 1:100. In our study, it is 2:100. Therefore, the THQ parameter calculated based on the results of Szmagara et al. was also determined for the case assuming the ratio of tea weight to the water volume of 2:100 (Table 4). For these cases, it was considered that the concentration of fluoride in the infusion would increase twice in relation to the ratio of tea weight to the water volume of 1:100. The analysis of the data contained in Table 4 allows us to conclude that tea infusions in bags, green and black, are characterized by the highest rate of exceeding the threshold THQ value. Infusions of the same teas but in the leaf form had the lowest index, so consuming infusions prepared from tea in bags is associated with a much higher risk of adverse health effects. Unfortunately, this form of tea is sold most often in Poland; in 2021, 85% of tea was sold in this form, 11% in leaf form, and 4% in the granulated form []. It should also be noted that green tea, traditionally produced from young leaves and buds, should be low in fluoride. The presented results and those of Szmagara et al. [] suggest, however, that some green teas sold in Poland, especially in the form of bags, are produced from other parts of the Camellia sinensis plant, such as older leaves or stems. This may cause an increased health risk associated with fluoride intake, especially for people who believe that green tea is healthier than black tea and, therefore, may consume more significant amounts of its infusions. Kombucha is produced by fermenting tea with added sugar using SCOBY (symbiotic culture of bacteria and yeast). It was demonstrated that kombucha is a major dietary source of fluoride and that the type of tea used significantly affects its chemical composition. Therefore, making the beverage with white or red tea is recommended due to the lowest fluoride content and ensuring food safety []. Another tea product is Matcha, powdered green tea (Camellia sinensis) of the Tencha type. Jakubczyk et al. [] showed that matcha infusions have a high fluorine content regardless of the water temperature or harvest time—about 4 mg/L. Matcha tea can therefore be the main source of fluoride in the human diet, which is why it is important to control the amount of matcha in the daily diet.
Table 4.
The percentage share of analyzed cases for which the THQ parameter exceeded the value of 1. The THQ parameter was determined based on the results of the study by Szmagara et al. [] obtained under the brewing conditions presented in the table.
Tea quality control becomes essential to protect humans from excessive fluoride intake from infusions. Excessive fluoride intake with tea infusion, especially in regions with high fluoride concentrations in drinking water, increases the risk of fluorosis. In Poland, drinking water is not fluoridated, and in most of the country, the fluoride concentration is below 0.3 mg/L, and only in a few localities, it exceeds 2 mg/L []. Some regions of Poland are characterized by a natural, increased amount of fluoride in the environment, including drinking water. One of them is Malbork and its surroundings. Peplińska et al. [] conducted research to assess fluorosis and caries in the population of Malbork children who, in the years corresponding to the period of incisor mineralization, lived in areas with an average fluoride content in drinking water of 2.25 mg/L. The authors found fluorosis in 84.54% of the examined children aged 13–16. Czarnowski et al. [] conducted research aimed at determining the level of fluoride in tap waters in various towns in northern and central Poland and examining whether there is a correlation between the content of fluoride in water and the concentration of fluoride in the urine of residents. These studies found no significant correlation between fluoride concentrations in drinking water and human urine. This suggests that elevated levels of fluoride in the urine may be caused by more than just fluoride from the water. Diet is another source of fluoride. Dębinski et al. [] determined the Polish population’s daily exposure to fluoride from dietary sources. They indicated that tea infusions are its primary source in the diet.
5. Conclusions
Summarizing the results of the presented study, we can conclude that fluoride content in infusions of various teas is very variable. The fluoride content in the infusion depends on the brewing conditions and the tea type and form. Tea leaf size is an important parameter affecting fluoride’s release during tea brewing. Probably, with the increase in the degree of fragmentation of the leaves, the surface through which fluoride extraction can occur increases, accelerating its transition to infusion. However, thorough research needs to be carried out to confirm this. An increase in fluoride content in the infusion was also shown with the extension of the brewing time. Based on the results of the analyzed samples, infusions of various types of tea can be ranked in terms of fluoride content from the highest: black, green, white, and pu-erh tea. It was also shown that significantly higher fluoride content was found in infusions of black tea prepared from tea in bags than from “loose” leaves.
The conducted health risk assessment for the consumer in Poland indicates the possibility of adverse health effects caused by fluoride consumption, particularly from infusions of black and green tea purchased in the form of bags. This risk can be reduced by shortening the brewing time, consumption of white tea, or pu-erh infusions purchased in leaf form. It would be necessary to introduce information on the fluoride content on tea packaging by tea producers and to increase public awareness of the risks associated with excessive fluoride consumption, especially in areas with its high content in drinking water. It seems necessary to conduct epidemiological studies to assess the scale of adverse health effects associated with fluoride intake to a greater extent. On their basis, it would be possible to determine the safe level of fluoride content in tea and the daily consumption of tea infusion to minimize the risk of fluorosis.
Supplementary Materials
The following supporting information can be downloaded at https://www.mdpi.com/article/10.3390/app13085075/s1, Table S1. Values of the THQ parameter for various population groups. The average daily tea consumption for age groups above 12 years is 1 L. Table S2. THQ parameter determined based on the results of the work of Szmagara et al. [] obtained under the following brewing conditions: average daily intake rate of tea: DI50%, tea (g):water (mL) ratio: 1:100; time of brewing: 5 min. Table S3. THQ parameter determined based on the results of the work of Szmagara et al. [] obtained under the following brewing conditions: average daily intake rate of tea: DI50%, tea (g):water (mL) ratio: 1:100; time of brewing: 15 min. Table S4. THQ parameter determined based on the results of the work of Szmagara et al. [] obtained under the following brewing conditions: average daily intake rate of tea for age groups above 12 years is 1 L, tea (g):water (mL) ratio: 1:100; time of brewing: 5 min. Table S5. THQ parameter determined based on the results of the work of Szmagara et al. [] obtained under the following brewing conditions: average daily intake rate of tea for age groups above 12 years is 1 L, tea (g):water (mL) ratio: 1:100; time of brewing: 15 min. Table S6. THQ parameter determined based on the results of the work of Szmagara et al. [] obtained under the following brewing conditions: average daily intake rate of tea: DI50%, tea (g):water (mL) ratio: 2:100; time of brewing: 5 min. Table S7. THQ parameter determined based on the results of the work of Szmagara et al. [] obtained under the following brewing conditions: average daily intake rate of tea: DI50%, tea (g):water (mL) ratio: 2:100; time of brewing: 15 min. Table S8. THQ parameter determined based on the results of the work of Szmagara et al. [] obtained under the following brewing conditions: average daily intake rate of tea for age groups above 12 years is 1 L, tea (g):water (mL) ratio: 2:100; time of brewing: 5 min. Table S9. THQ parameter determined based on the results of the work of Szmagara et al. [] obtained under the following brewing conditions: average daily intake rate of tea for age groups above 12 years is 1 L, tea (g):water (mL) ratio: 2:100; time of brewing: 15 min.
Author Contributions
Conceptualization, A.M.; methodology, A.M.; validation, G.K., M.W.-S. and R.K.; formal analysis, A.M., M.W.-S. and J.W.; investigation, G.K., R.K. and M.W.-S.; resources, J.W.; data curation, A.M. and J.W.; writing—original draft preparation, A.M., G.K. and M.W.-S.; writing—review and editing, G.K. and M.W.-S.; visualization, J.W. All authors have read and agreed to the published version of the manuscript.
Funding
This research received no external funding.
Institutional Review Board Statement
Not applicable.
Informed Consent Statement
Not applicable.
Data Availability Statement
Not applicable.
Conflicts of Interest
The authors declare no conflict of interest.
References
- Pérez-Jiménez, J.; Neveu, V.; Vos, F.; Scalbert, A. Identification of the 100 Richest Dietary Sources of Polyphenols: An Application of the Phenol-Explorer Database. Eur. J. Clin. Nutr. 2010, 64, S112–S120. [Google Scholar] [CrossRef] [PubMed]
- Zijp, I.M.; Korver, O.; Tijburg, L.B.M. Effect of Tea and Other Dietary Factors on Iron Absorption. Crit. Rev. Food Sci. Nutr. 2000, 40, 371–398. [Google Scholar] [CrossRef]
- Hayat, K.; Iqbal, H.; Malik, U.; Bilal, U.; Mushtaq, S. Tea and Its Consumption: Benefits and Risks. Crit. Rev. Food Sci. Nutr. 2015, 55, 939–954. [Google Scholar] [CrossRef]
- Yamaguchi, M. Fluoride and Bone Metabolism. Clin. Calcium 2007, 17, 217–223. [Google Scholar] [PubMed]
- Shu, W.S.; Zhang, Z.Q.; Lan, C.Y.; Wong, M.H. Fluoride and Aluminium Concentrations of Tea Plants and Tea Products from Sichuan Province, PR China. Chemosphere 2003, 52, 1475–1482. [Google Scholar] [CrossRef]
- Klepacka, J.; Tońska, E.; Rafałowski, R.; Czarnowska-Kujawska, M.; Opara, B. Tea as a Source of Biologically Active Compounds in the Human Diet. Molecules 2021, 26, 1487. [Google Scholar] [CrossRef]
- Fung, K.F.; Zhang, Z.Q.; Wong, J.W.C.; Wong, M.H. Aluminium and Fluoride Concentrations of Three Tea Varieties Growing at Lantau Island, Hong Kong. Env. Geochem. Health 2003, 25, 219–232. [Google Scholar] [CrossRef] [PubMed]
- Hayacibara, M.F.; Queiroz, C.S.; Tabchoury, C.P.M.; Cury, J.A. Fluoride and Aluminum in Teas and Tea-Based Beverages. Rev. Saude Publica 2004, 38, 100–105. [Google Scholar] [CrossRef]
- Carr, H.P.; Lombi, E.; Küpper, H.; McGrath, S.P.; Wong, M.H. Accumulation and Distribution of Aluminium and Other Elements in Tea (Camellia sinensis) Leaves. Agronomie 2003, 23, 705–710. [Google Scholar] [CrossRef]
- Commission European for Health Directorate-General Consumers. Critical Review of Any New Evidence on the Hazard Profile, Health Effects, and Human Exposure to Fluoride and the Fluoridating Agents of Drinking Water; European Commission: Brussels, Belgium, 2013. [Google Scholar]
- Fordyce, F.M. Fluorine: Human Health Risks. In Encyclopedia of Environmental Health; Nriagu, J.O., Ed.; Elsevier: Amsterdam, The Netherlands, 2011; Volume 2, pp. 776–785. [Google Scholar]
- Krishnankutty, N.; Storgaard Jensen, T.; Kjær, J.; Jørgensen, J.S.; Nielsen, F.; Grandjean, P. Public-Health Risks from Tea Drinking: Fluoride Exposure. Scand. J. Public. Health 2022, 50, 355–361. [Google Scholar] [CrossRef]
- Błaszczyk, I.; Ratajczak-Kubiak, E.; Birkner, E. Advantageous and Harmfully Effect of Fluoride. Farm. Pol. 2009, 65, 623–626. [Google Scholar]
- Cook, F.J.; Seagrove-Guffey, M.; Mumm, S.; Veis, D.J.; McAlister, W.H.; Bijanki, V.N.; Wenkert, D.; Whyte, M.P. Non-Endemic Skeletal Fluorosis: Causes and Associated Secondary Hyperparathyroidism (Case Report and Literature Review). Bone 2021, 145, 115839. [Google Scholar] [CrossRef]
- Johnson, J.E.H.; Kearns, A.E.; Doran, P.M.; Khoo, T.K.; Wermers, R.A. Fluoride-Related Bone Disease Associated With Habitual Tea Consumption. Mayo Clin. Proc. 2007, 82, 719–724. [Google Scholar] [CrossRef]
- Joshi, S.; Hlaing, T.; Whitford, G.M.; Compston, J.E. Skeletal Fluorosis Due to Excessive Tea and Toothpaste Consumption. Osteoporos. Int. 2011, 22, 2557–2560. [Google Scholar] [CrossRef]
- Whyte, M.P.; Totty, W.G.; Lim, V.T.; Whitford, G.M. Skeletal Fluorosis From Instant Tea. J. Bone Miner. Res. 2008, 23, 759–769. [Google Scholar] [CrossRef]
- Whyte, M.P.; Essmyer, K.; Gannon, F.H.; Reinus, W.R. Skeletal Fluorosis and Instant Tea. Am. J. Med. 2005, 118, 78–82. [Google Scholar] [CrossRef] [PubMed]
- Izuora, K.; Twombly, J.G.; Whitford, G.M.; Demertzis, J.; Pacifici, R.; Whyte, M.P. Skeletal Fluorosis from Brewed Tea. J. Clin. Endocrinol. Metab. 2011, 96, 2318–2324. [Google Scholar] [CrossRef]
- Kakumanu, N.; Rao, S.D. Skeletal Fluorosis Due to Excessive Tea Drinking. N. Engl. J. Med. 2013, 368, 1140. [Google Scholar] [CrossRef] [PubMed]
- Pattaravisitsate, N.; Phetrak, A.; Denpetkul, T.; Kittipongvises, S.; Kuroda, K. Effects of Brewing Conditions on Infusible Fluoride Levels in Tea and Herbal Products and Probabilistic Health Risk Assessment. Sci. Rep. 2021, 11, 14115. [Google Scholar] [CrossRef]
- Wen, C.; Zhang, Q.; Xie, F.; Jiang, J. Brick Tea Consumption and Its Relationship with Fluorosis in Tibetan Areas. Front. Nutr. 2022, 9, 1030344. [Google Scholar] [CrossRef]
- Waugh, D.T.; Potter, W.; Limeback, H.; Godfrey, M. Risk Assessment of Fluoride Intake from Tea in the Republic of Ireland and Its Implications for Public Health and Water Fluoridation. Int. J. Environ. Res. Public Health 2016, 13, 259. [Google Scholar] [CrossRef]
- Waugh, D.; Godfrey, M.; Limeback, H.; Potter, W. Black Tea Source, Production, and Consumption: Assessment of Health Risks of Fluoride Intake in New Zealand. J. Environ. Public Health 2017, 2017, 5120504. [Google Scholar] [CrossRef]
- Shao, L.; Xu, S.; Wang, G.; Yang, L.; Li, R.; Zhu, J.; Chen, J.; Jiang, D. Fluoride in Tea from Shandong Province, China and Exposure Assessment. Food Addit. Contam. Part B 2020, 13, 77–81. [Google Scholar] [CrossRef]
- Miri, M.; Bhatnagar, A.; Mahdavi, Y.; Basiri, L.; Nakhaei, A.; Khosravi, R.; Eslami, H.; Ghasemi, S.M.; Balarak, D.; Alizadeh, A.; et al. Probabilistic Risk Assessment of Exposure to Fluoride in Most Consumed Brands of Tea in the Middle East. Food Chem. Toxicol. 2018, 115, 267–272. [Google Scholar] [CrossRef]
- Maleki, A.; Daraei, H.; Mohammadi, E.; Zandi, S.; Teymouri, P.; Mahvi, A.H.; Gharibi, F. Daily Fluoride Intake from Iranian Green Tea: Evaluation of Various Flavorings on Fluoride Release. Env. Health Insights 2016, 10, EHI.S38511. [Google Scholar] [CrossRef]
- Chan, L.; Mehra, A.; Saikat, S.; Lynch, P. Human Exposure Assessment of Fluoride from Tea (Camellia sinensis L.): A UK Based Issue? Food Res. Int. 2013, 51, 564–570. [Google Scholar] [CrossRef]
- Ruxton, C.H.S.; Bond, T.J. Fluoride Content of Retail Tea Bags and Estimates of Daily Fluoride Consumption from Typical Tea Drinking in UK Adults and Children. Nutr. Bull. 2015, 40, 268–278. [Google Scholar] [CrossRef]
- Satou, R.; Oka, S.; Sugihara, N. Risk Assessment of Fluoride Daily Intake from Preference Beverage. J. Dent. Sci. 2021, 16, 220–228. [Google Scholar] [CrossRef] [PubMed]
- Koblar, A.; Tavčar, G.; Ponikvar-Svet, M. Fluoride in Teas of Different Types and Forms and the Exposure of Humans to Fluoride with Tea and Diet. Food Chem. 2012, 130, 286–290. [Google Scholar] [CrossRef]
- Das, S.; de Oliveira, L.M.; da Silva, E.; Liu, Y.; Ma, L.Q. Fluoride Concentrations in Traditional and Herbal Teas: Health Risk Assessment. Environ. Pollut. 2017, 231, 779–784. [Google Scholar] [CrossRef]
- Zhang, D.; Xu, X.; Wu, X.; Lin, Y.; Li, B.; Chen, Y.; Li, X.; Shen, J.; Xiao, L.; Lu, S. Monitoring Fluorine Levels in Tea Leaves from Major Producing Areas in China and the Relative Health Risk. J. Food Compos. Anal. 2023, 118, 105205. [Google Scholar] [CrossRef]
- Cao, J.; Zhao, Y.; Liu, J.; Xirao, R.; Danzeng, S.; Daji, D.; Yan, Y. Brick Tea Fluoride as a Main Source of Adult Fluorosis. Food Chem. Toxicol. 2003, 41, 535–542. [Google Scholar] [CrossRef] [PubMed]
- Cai, H.; Zhu, X.; Peng, C.; Xu, W.; Li, D.; Wang, Y.; Fang, S.; Li, Y.; Hu, S.; Wan, X. Critical Factors Determining Fluoride Concentration in Tea Leaves Produced from Anhui Province, China. Ecotoxicol. Environ. Saf. 2016, 131, 14–21. [Google Scholar] [CrossRef] [PubMed]
- Mazur, M.; Ndokaj, A.; Jedlinski, M.; Ardan, R.; Bietolini, S.; Ottolenghi, L. Impact of Green Tea (Camellia sinensis) on Periodontitis and Caries. Systematic Review and Meta-Analysis. Jpn. Dent. Sci. Rev. 2021, 57, 1–11. [Google Scholar] [CrossRef] [PubMed]
- Wojciechowska-Mazurek, M.; Starska, K.; Mania, M.; Rebeniak, M.; Karłowski, K. Pierwiastki Szkodliwe Dla Zdrowia w Herbacie. Bromatol. Chem. Toksykol. 2010, 3, 233–239. [Google Scholar]
- Malinowska, E.; Inkielewicz, I.; Czarnowski, W.; Szefer, P. Assessment of Fluoride Concentration and Daily Intake by Human from Tea and Herbal Infusions. Food Chem. Toxicol. 2008, 46, 1055–1061. [Google Scholar] [CrossRef]
- Szmagara, A.; Krzyszczak, A.; Stefaniak, E.A. Determination of Fluoride Content in Teas and Herbal Products Popular in Poland. J. Environ. Health Sci. Eng. 2022, 20, 717–727. [Google Scholar] [CrossRef]
- Shyu, T.-H.; Chen, J.-H.; Lee, Y.-H. Determination of Fluoride in Tea Leaves and Tea Infusions by Ion Selective Electrode. J. Food Drug. Anal. 2020, 17, 9. [Google Scholar] [CrossRef]
- USEPA. Risk Assessment: Guidance for Superfund. In Human Health Evaluation Manual (Part A), Interim Final; Office of Emergency and Remedial Response, U.S. Environmental Protection Agency: Washington, DC, USA, 1989; Volume 1. [Google Scholar]
- IRIS Fluorine (Soluble Fluoride). Available online: https://iris.epa.gov/ChemicalLanding/&substance_nmbr=53 (accessed on 30 January 2023).
- Jarosz, M.; Rychlik, E.; Stoś, K.; Charzewska, J. Normy Żywienia Dla Populacji Polski i Ich Zastosowanie; Narodowy Instytut Zdrowia Publicznego—Państwowy Zakład Higieny: Warsaw, Poland, 2020; ISBN 978-83-65870-28-5. [Google Scholar]
- Gulati, P.; Singh, V.; Gupta, M.K.; Vaidya, V.; Dass, S.; Prakash, S. Studies on the Leaching of Fluoride in Tea Infusions. Sci. Total Environ. 1993, 138, 213–221. [Google Scholar] [CrossRef]
- Zerabruk, S.; Singh Chandravanshi, B.; Zewge, F. Fluoride in Black and Green Tea (Camellia sinensis) Infusions in Ethiopia: Measurement and Safety Evaluation. Bull. Chem. Soc. Ethiop. 2010, 24, 327–338. [Google Scholar] [CrossRef]
- Lu, Y.; Guo, W.-F.; Yang, X.-Q. Fluoride Content in Tea and Its Relationship with Tea Quality. J. Agric. Food Chem. 2004, 52, 4472–4476. [Google Scholar] [CrossRef] [PubMed]
- Valadas, L.A.R.; Girão Júnior, F.J.; Lotif, M.A.L.; Fernández, C.E.; Bandeira, M.A.M.; Fonteles, M.M.D.F.; Bottenberg, P.; Squassi, A. Fluoride Concentration in Teas Derived from Camellia sinensis Produced in Argentina. Environ. Monit. Assess. 2022, 194, 682. [Google Scholar] [CrossRef] [PubMed]
- Esfehani, M.; Ghasemzadeh, S.; Mirzadeh, M. Comparison of Fluoride Ion Concentration in Black, Green and White Tea. Int. J. Ayurvedic Med. 2019, 9, 263–265. [Google Scholar] [CrossRef]
- Embiale, A.; Chandravanshi, B.S.; Zewge, F. Levels of Fluoride in the Ethiopian and Imported Black Tea (Camellia sinensis) Infusions Prepared in Tap and Fluoride-Rich Natural Waters. Int. J. Food Eng. 2014, 10, 447–455. [Google Scholar] [CrossRef]
- Emekli-Alturfan, E.; Yarat, A.; Akyuz, S. Fluoride Levels in Various Black Tea, Herbal and Fruit Infusions Consumed in Turkey. Food Chem. Toxicol. 2009, 47, 1495–1498. [Google Scholar] [CrossRef] [PubMed]
- Cao, J.; Zhao, Y.; Li, Y.; Deng, H.J.; Yi, J.; Liu, J.W. Fluoride Levels in Various Black Tea Commodities: Measurement and Safety Evaluation. Food Chem. Toxicol. 2006, 44, 1131–1137. [Google Scholar] [CrossRef]
- Rodríguez, I.; Burgos, A.; Rubio, C.; Gutiérrez, A.J.; Paz, S.; Rodrigues da Silva Júnior, F.M.; Hardisson, A.; Revert, C. Human Exposure to Fluoride from Tea (Camellia sinensis) in a Volcanic Region—Canary Islands, Spain. Environ. Sci. Pollut. Res. 2020, 27, 43917–43928. [Google Scholar] [CrossRef]
- Opydo-Szymaczek, J.; Opydo, J. Fluoride Content of Beverages Intended for Infants and Young Children in Poland. Food Chem. Toxicol. 2010, 48, 2702–2706. [Google Scholar] [CrossRef]
- Buzalaf, M.A.R. Review of Fluoride Intake and Appropriateness of Current Guidelines. Adv. Dent. Res. 2018, 29, 157–166. [Google Scholar] [CrossRef]
- Forsman, B. Early Supply of Fluoride and Enamel Fluorosis. Eur. J. Oral Sci. 1977, 85, 22–30. [Google Scholar] [CrossRef]
- Kucia, K. Rynek Herbaty. Available online: https://markethub.pl/rynek-herbaty-w-polsce/ (accessed on 31 January 2023).
- Jakubczyk, K.; Gutowska, I.; Antoniewicz, J.; Janda, K. Evaluation of Fluoride and Selected Chemical Parameters in Kombucha Derived from White, Green, Black and Red Tea. Biol. Trace Elem. Res. 2021, 199, 3547–3552. [Google Scholar] [CrossRef] [PubMed]
- Jakubczyk, K.; Ligenza, A.; Gutowska, I.; Janda-Milczarek, K.; Jakubczyk, K.; Ligenza, A.; Gutowska, I.; Janda-Milczarek, K.; Pl, K. Fluoride Content of Matcha Tea Depending on Leaf Harvest Time and Brewing Conditions. Nutrients 2022, 14, 2550. [Google Scholar] [CrossRef] [PubMed]
- Czarnowski, W.; Wrześniowska, K.; Krechniak, J. Fluoride in Drinking Water and Human Urine in Northern and Central Poland. Sci. Total Environ. 1996, 191, 177–184. [Google Scholar] [CrossRef] [PubMed]
- Peplińska, M.; Emerich, K.; Michałek, A.; Dziarska, A.; Gruber-Miazga, J.; Korcala, R. Clinical Manifestation of Dental Fluorosis Based on Dean’s Index and TF Index and Caries Levels in Children Living in the Areas Supplied with Drinking Water Containing 2.25 Mg/l of Fluoride. Ann. Acad. Med. Gedanensis 2015, 45, 35–43. [Google Scholar]
- Dębinski, A.; Nowicka, G.; Sekula, W.; Figurska, K. Assessment of Fluoride Intake from Diet in Polish Population. Zyw. Człowieka Metab. 2006, 33, 300–308. [Google Scholar]
Disclaimer/Publisher’s Note: The statements, opinions and data contained in all publications are solely those of the individual author(s) and contributor(s) and not of MDPI and/or the editor(s). MDPI and/or the editor(s) disclaim responsibility for any injury to people or property resulting from any ideas, methods, instructions or products referred to in the content. |
© 2023 by the authors. Licensee MDPI, Basel, Switzerland. This article is an open access article distributed under the terms and conditions of the Creative Commons Attribution (CC BY) license (https://creativecommons.org/licenses/by/4.0/).