Article

Ontology with Deep Learning for Forest Image Classification

by
Clopas Kwenda
*,
Mandlenkosi Gwetu
and
Jean Vincent Fonou-Dombeu
School of Mathematics, Statistics and Computer Science, University of KwaZulu Natal, Pietermaritzburg 3209, South Africa
*
Author to whom correspondence should be addressed.
These authors contributed equally to this work.
Appl. Sci. 2023, 13(8), 5060; https://doi.org/10.3390/app13085060
Submission received: 21 March 2023 / Revised: 14 April 2023 / Accepted: 15 April 2023 / Published: 18 April 2023

Abstract

:
Most existing approaches to image classification neglect the concept of semantics, resulting in two major shortcomings. Firstly, categories are treated as independent even when they have a strong semantic overlap. Secondly, the features used to classify images into different categories can be the same. It has been demonstrated that the integration of ontologies and semantic relationships greatly improves image classification accuracy. In this study, a hybrid ontological bagging algorithm and an ensemble technique of convolutional neural network (CNN) models have been developed to improve forest image classification accuracy. The ontological bagging approach learns discriminative weak attributes over multiple learning instances, and the bagging concept is adopted to minimize the error propagation of the classifiers. An ensemble of ResNet50, VGG16, and Xception models is used to generate a set of features for the classifiers trained through an ontology to perform the image classification process. To the authors’ best knowledge, there are no publicly available datasets for forest-type images; hence, the images used in this study were obtained from the internet. Obtained images were put into eight categories, namely: orchards, bare land, grassland, woodland, sea, buildings, shrubs, and logged forest. Each category comprised 100 images for training and 19 images for testing; thus, in total, the dataset contained 800 images for training and 152 images for testing. Our ensemble deep learning approach with an ontology model was successfully used to classify forest images into their respective categories. The classification was based on the semantic relationship between image categories. The experimental results show that our proposed model with ontology outperformed other baseline classifiers without ontology with 96% accuracy and the lowest root-mean-square error (RMSE) of 0.532 compared to 88.8%, 86.2%, 81.6%, 64.5%, and 63.8% accuracy and 1.048, 1.094, 1.530, 1.678, and 2.090 RMSE for support-vector machines, random forest, k-nearest neighbours, Gaussian naive Bayes, and decision trees, respectively.

1. Introduction

The majority of classification algorithms treat classes or categories of images independently both in terms of visual and semantic aspects [1]. In contrast, human beings use semantic relationships when classifying images into their respective categories [2]. For instance, it might seem unreasonable to distinguish “tree” from “vegetation” since a “tree” is a kind of “vegetation”. Generally, human beings use features to distinguish different kinds of objects. For example, the NDVI (normalized difference vegetation index) is an essential feature for distinguishing between vegetation and water, while shapes can discriminate between broad-shaped leaves and needle-shaped leaves. Most classification algorithms achieved better performance results on easy image classification datasets such as Caltech 256 [3] and Caltech 101 [4]; however, they neglected the concept of semantics [5], which led to poor results on fine-grained images [6]. An ontology is a hierarchical structure of a particular domain that consists of all classes or categories as well as relationships such as “is-a” and “kind-of”. It captures semantic relationships between classes or categories in a manner that is close to human perception.
The adoption of ontologies in image classification algorithms incorporates semantics tools, thus leading to increases in image classification accuracy. Traditional ontology-based algorithms hugely suffer from the problem of error propagation because these ontology classifications are based on having classifiers at every ontological node, such that node subcategories are discriminated. Such errors were caused by intra-class variations of super-categories. The previous uses of ontologies in classification focused on improving speed rather than accuracy. Ontologies revolve around the use of semantic relationships, and data are expressed more at the semantic level, thus accounting for better classification. This study proposes an image classification model based on ontology and an ensemble stack of the Xception, VGG16, and ResNet50 models, which are employed to generate a set of features that are used by merged classifiers driven by taxonomic relationships in an ontology to improve image classification accuracy. The three pre-existing models, Xception, VGG-16, and ResNet50, have been adopted in this study via transfer learning because they have an innately dissimilar architecture that abstracts unrelated information from the images used for the classification purposes [7]. Some potential applications of ontological bagging in forestry include species classification. Information relating to forest tree species plays a critical role in ecology and forest management [8]. Our proposed ontological bagging model can be employed to improve the accuracy of species classification in forestry. Vegetation is an important part of an ecosystem because it provides oxygen and a suitable place for human beings to live [9]. Therefore, information concerning vegetation is very critical; hence, our proposed model can be used to classify vegetation into different types and categories. Our model can also be used to classify fruits into their respective categories. Fruit classification plays an important role in many industrial applications, including supermarkets and factories. The importance of fruit classification can be seen in people with special dietary requirements; in this case, they can be assisted in selecting categories of fruits [10]. The contribution of the study is summarised as follows:
  • We integrate semantic ontologies and aggregate outputs from hypernym–hyponym classifiers to increase image category distinction and also eliminate error propagation problems, hence increasing image classification accuracy.
  • We propose a new approach to image classification that uses an ensemble of Xception, ResNet50, and VGG16, whereby features obtained from Xception, ResNet50, and VGG16 are integrated together to produce all possible features, which are, in turn, used by an ontological bagging algorithm for subsequent classification.
The rest of the paper is structured as follows. Section 2 discusses related work. Section 3 discusses the dataset used for the study. Section 4 describes the deep learning architectures. Section 5 describes the ontological bagging algorithm used in the study. Section 6 describes the proposed algorithm. Section 7 outlines the experimental setup. Section 8 describes the experimental results. Section 9 discusses the results obtained from the experiment. Section 10 concludes the paper.

2. Related Works

Image classification has received much attention in the fields of computer vision and image processing [11,12,13,14,15,16]. A study [11] developed a model that harmonized ontology and HMAX features to perform image classification using merged classifiers. The basic idea behind the model was to exploit ontological relationships that exist between image classes or categories. For better discrimination between classes, the procedure involved training visual feature classifiers and merging outputs of hypernym–hyponym classifiers. The model included three components: (1) feature extraction, (2) ontology building, and (3) image classification. The visual features were obtained from the training dataset, and ontology building was carried out by mainly following the process of concept extraction and relationship generation. Visual features extracted from the training set and the ontology were used to perform image classification using a linear orange support-vector machine (SVM) classifier. In terms of accuracy, the model achieved an accuracy of 0.63, while the baseline method without ontology obtained an accuracy of 0.59. However, as coined by [12], HMAX does not perform very well in terms of feature extraction over a limited dataset. To circumvent this shortcoming, the proposed model in this study has adopted an ensemble of CNNs to generate features for subsequent image classification.
Another study [1] proposed an ontological random forest algorithm for forest image classification. The algorithm’s basic idea was that the semantic relationships between categories determined the splitting of the decision tree. Multiple-instance learning was used to provide a learning platform for generating hierarchical features that were then used to capture visual dissimilarities at various concept levels. Semantic splitting was used to build decision trees, and semantic relationships were used to learn hierarchical weak features. The experimental results showed that the approach not only outperformed state-of-the-art approaches but was also capable of identifying semantic features at different concept levels. The drawback of this study was that feature generation was hugely dependent on weak attribute learning. To solve this problem, the proposed study used an ensemble deep learning approach to generate all plausible features for subsequent image classification.
An algorithm that automatically builds image classification trees was proposed in [17]. A set of categories was recursively divided into two minimally confused subsets and achieved 5–20-fold speedups over other methods. Other authors [18] used lexical semantic networks to integrate knowledge about inter-category relationships into the learning process of visual appearance. A semantic hierarchy of discriminative classifiers was used for object detection. The challenge encountered was that object recognition was marred by the fact that the algorithm did not support weak attribute reasoning. To overcome this challenge, the proposed study incorporated the bagging algorithm because it has the ability to learn weak attributes.
A new formalism that incorporated hierarchy and exclusion (HEX) graphs to perform object classification by exploiting the rich structure of real-world labels was introduced [19]. The new formalism has the ability to capture semantic relationships between any two labels on the same object. Results obtained from the model showed an improvement in object classification as a result of exploiting label relationships. However, the major limitation of the approach is that it is too general in nature and is only limited to domains with hierarchical and exclusion relationships.
A study [20] developed a deep learning model for multiple-instance learning (MIL) frameworks, whose goal was to perform vision tasks such as classification and image annotation. In the model, each image object uses two instance sets of object proposals and text annotations to perform vision tasks. The main merit of the model is its ability to learn relationships between objects and annotation proposals. The study contributed extensively to solving computer vision tasks, and it performed well both in image classification and image auto-annotation. However, the shortcomings of the model were that it required fine tuning on the orange dataset, which is time-consuming.
A unified CNN-RNN model for multi-class image classification was proposed in [21]. The classification process consisted of learning semantic redundancy and the co-occurrence dependency in an end-to-end way. The model has the ability to obtain semantic level dependency and image label relevance by learning the joint image label embedding. The model could also be trained from scratch to integrate both pieces of information in a unified framework. The results obtained show better performance in terms of classification than the state-of-the-art multi-label classification model.The shortcomings of the model were that it fails to make a prediction on small objects that have little covariance dependencies with other, larger objects.
Considering that microscopic imaging technology is rapidly advancing, bio-image-based approaches to protein subcellular localization have sparked a lot of interest. However, there are fewer techniques for predicting protein location, with the majority of them relying on automatic single-label classification. Therefore, a study [22] developed an artificial intelligence (AI)-based stacked ensemble approach for the prediction of protein subcellular localization in confocal microscopy images. The ensemble approach was built by stacking ResNet152, DenseNet169, and VGG16 as base learners, and their predictions were integrated and fed as input to the meta-learner. The model was implemented on an image dataset obtained from Human Protein Atlas Image Classification on Kaggle and attained precision, F1-score, and recall of 0.71, 0.72, and 0.70, respectively. The main difficulty encountered in the study was a huge imbalance of images in the image categories, as some classes had very few images, which were insufficient to train the model. In our study, we used a data augmentation technique to determine image balance across categories. The evolution of AI applications has significantly increased the utilization of smart imaging devices. Convolutional neural networks (CNNs) are widely used in image classification because they do not require any handcrafted features to influence performance. However, fruit classification in the horticulture field suffers from the significant disadvantage of requiring an expert with extensive knowledge and experience. To address this issue, a study [23] developed MobileNetV2 with a deep learning technique for fruit image classification. The study did not require the intervention of experts. The model used 26,149 images of 40 different fruit types from a Kaggle public dataset and achieved 99% accuracy. The model could be improved using a larger variety of fruits for broader fruit classification.
The idea of annotating images has received a significant amount of attention due to the sharp increase in volumes of images. By considering the area of agriculture, a study [24] proposed a deep learning repetitive annotation approach for recognizing a variety of fruits and classifying the ripeness of oil palm fruit. The model was implemented on 3500 fruit images and achieved an accuracy of 98.7% for classifying oil palm fruit and 99.5% for recognizing a variety of fruits. CNNs are also used in agriculture for seed classification, despite the inherent limitations of traditional machine-learning approaches in extracting features and information from image data. Ref. [25] created a deep CNN based on MobileNetV2 with a simple architecture for seed classification. The model was applied to a seed dataset with 14 different seed classes and achieved an accuracy of 95% and 98% on testing and training, respectively. However, future research will need to compare various CNN architectures to determine the best model for solving the problem at hand.
Recent trends have shown that image collection has significantly increased, thereby activating further research in image classification and annotation. A technique based on bag of visual words (BoVW), which relies on ontology, has been widely used in this area. However, problems relating to ambiguities between image categories have posed challenges with regard to image classification and annotation. A study in [26] proposed a hierarchical max pooling (HMAX) model based on ontology to classify images of animals into their respective categories. The contribution of their model was the exploitation of semantic relationships between image categories as a way of eliminating the problem of ambiguity between image categories. The model performed well as it achieved an accuracy of 80%. However, HMAX is not a desirable technique for producing features; hence, our study has used an ensemble of CNNs for feature production.
CNNs have been widely employed to solve image classification problems, attributed to their power in extracting features and always making continuous breakthroughs in the field of image recognition. However, they suffer from a huge overhead, requiring a lot of time for the training process. To alleviate this challenge, a study [27] developed a hybrid of deep learning and random forest algorithm to solve an image classification problem. The sole purpose of the CNN is for feature extraction, and the classification process is handled by the random forest algorithm. Random forest (RF) has the advantages of fast training speed and high classification accuracy. The model was effective as it produced a low error rate of 9.18%. The model did not carry out a comparative assessment against other baseline classifiers, which is accounted for in our study.
A supervised deep-learning approach based on a stacked auto-encoder was used in [28] for the classification of forest areas. The study used unmanned aerial vehicle (UAV) datasets because they have been found to be quite useful for forest feature identification due to their relatively high spatial resolution. Through cross-validation, the model achieved an accuracy of 93%. However, one significant limitation of deep learning is that it requires more computing power than other machine learning algorithms.

3. Dataset

Given the scarcity of publicly available forest-type image datasets [29], we downloaded 35 images for each class from the internet [30,31]. Considering that the obtained image dataset was too limited for the proposed model, the geometric transformation data augmentation technique from the scikit-learn library in Python was employed to produce 65 more images for each class in the training dataset and 9 more images in the testing dataset. Hence, the resulting dataset constituted a total of 952 images, from which 800 were set aside for training and 152 were reserved for testing. Table 1 shows the corresponding forest-type image dataset distribution.
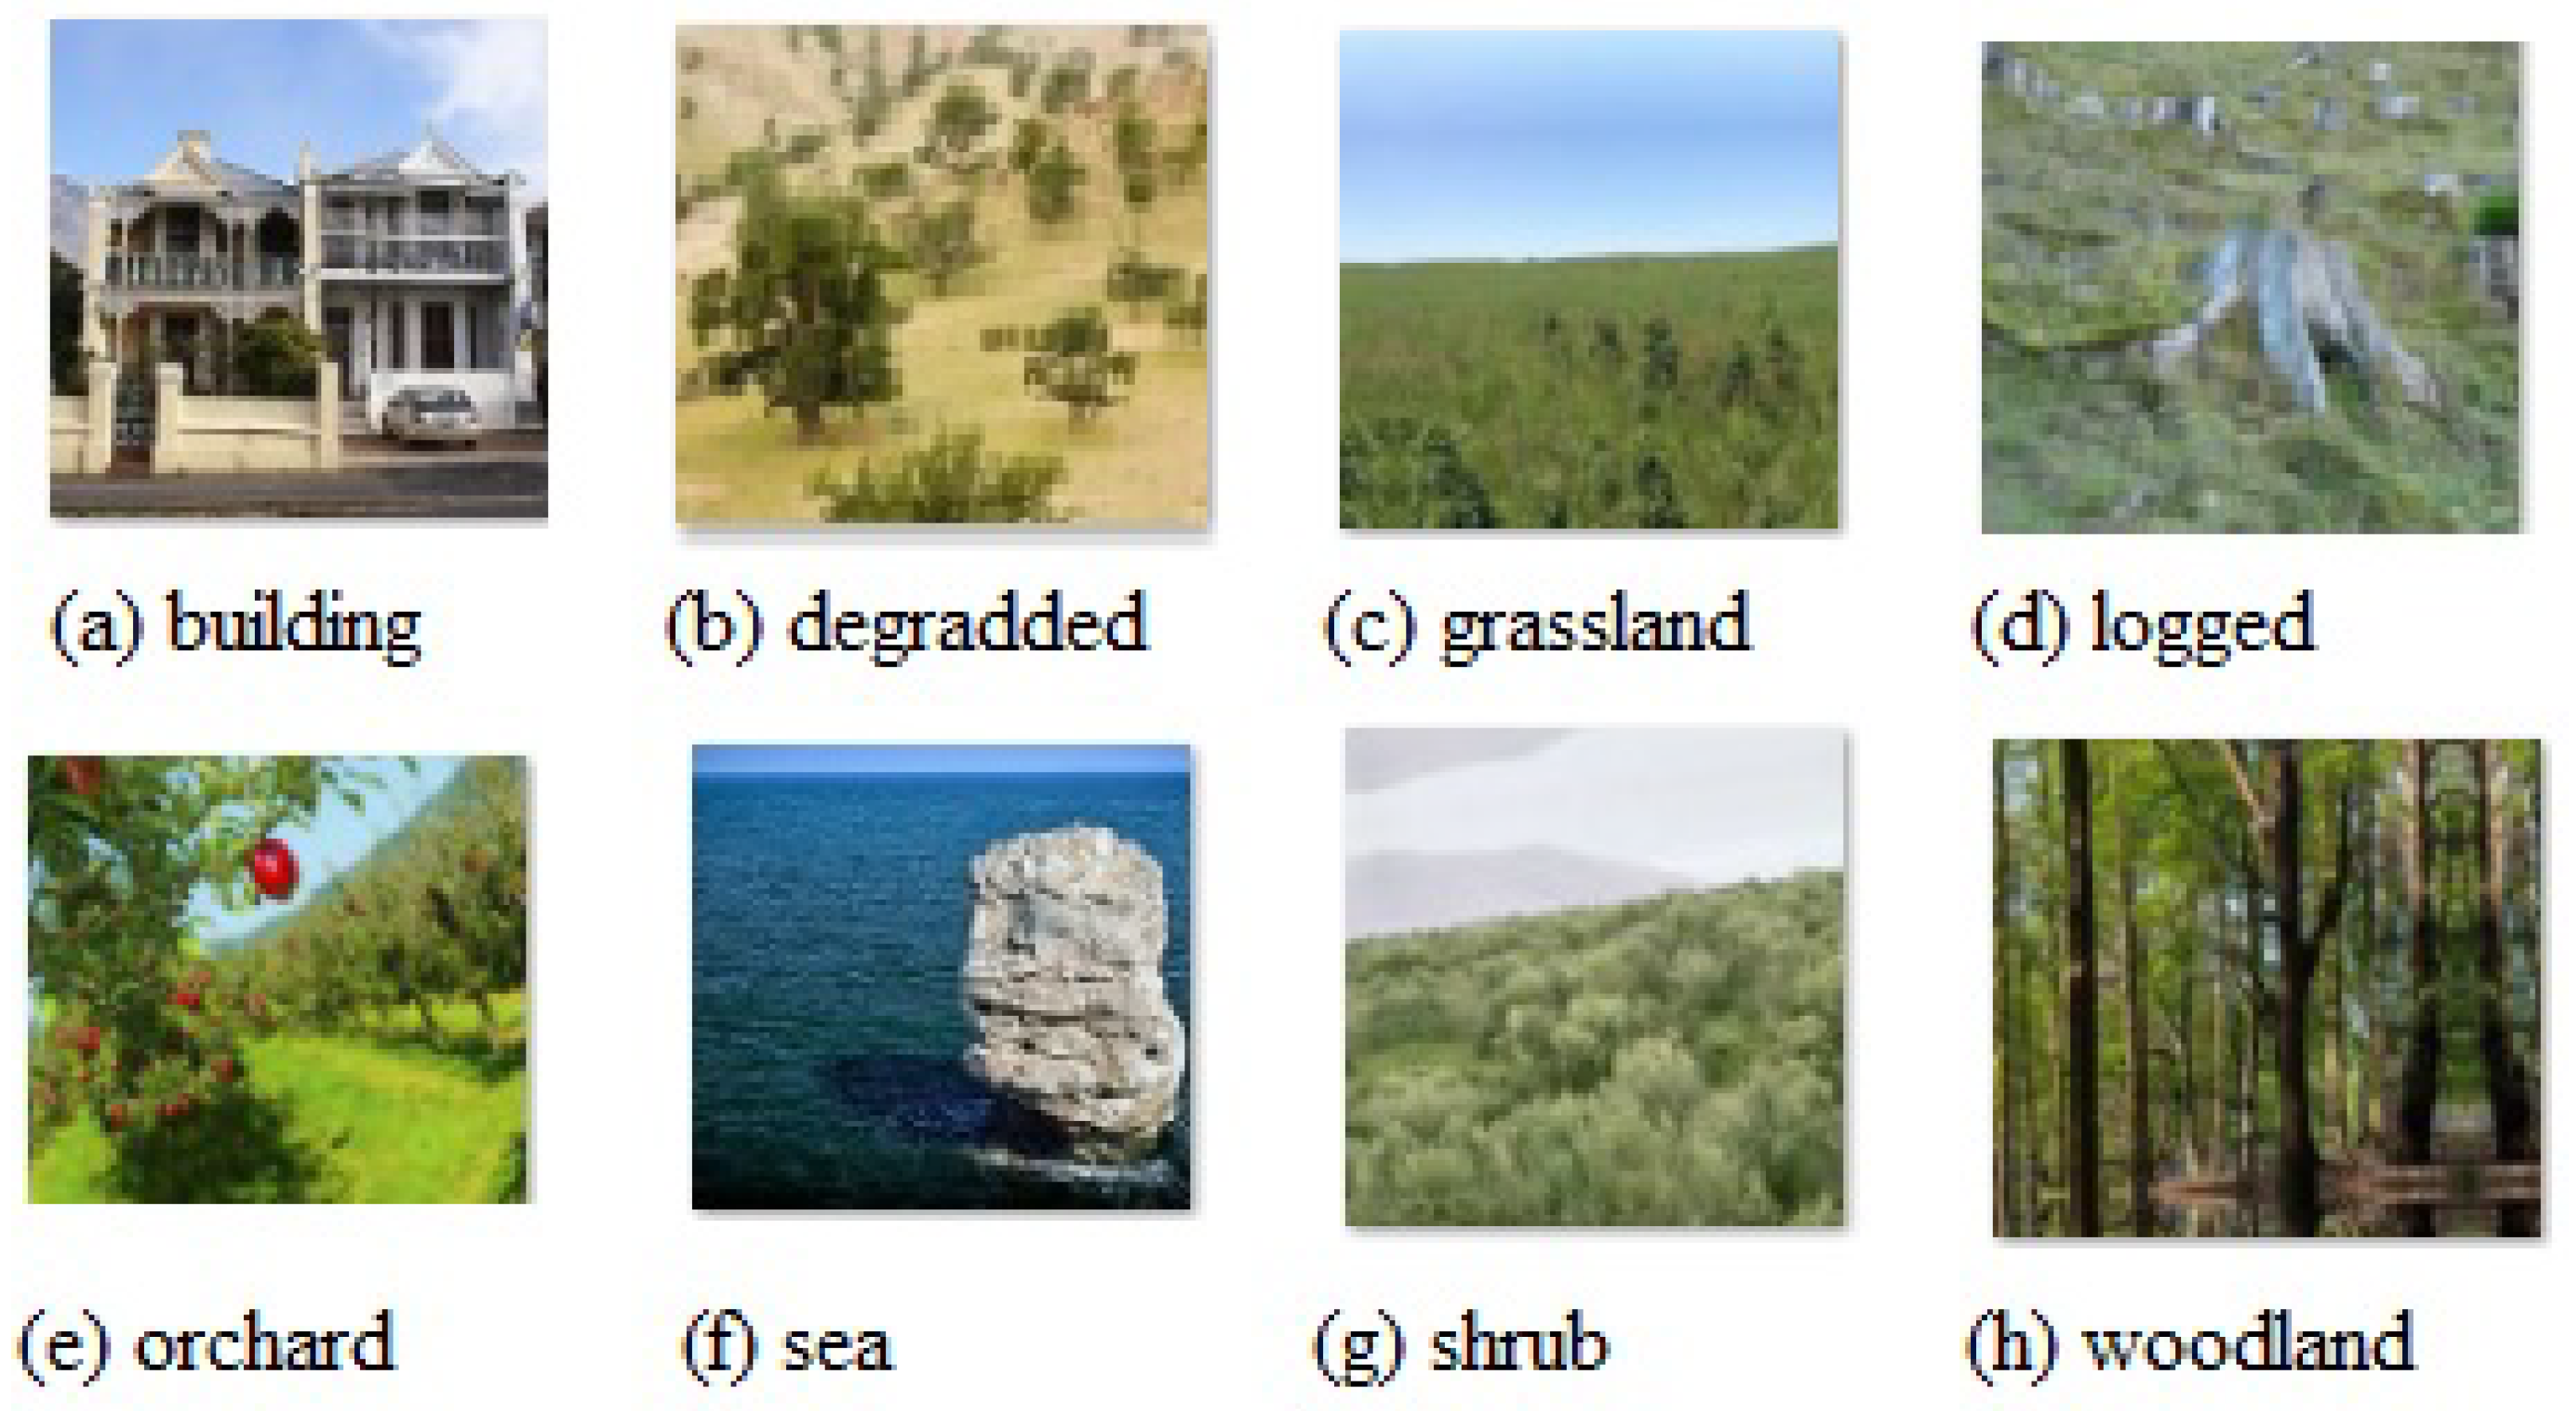
Data augmentation is a technique that artificially increases the image dataset by creating additional modified copies of already existing data. Table 2 depicts the parameter configuration used in this study to perform data augmentation, where the first column represents the set of geometric properties that require fine-tuning, and the second column represents the set value for each geometric property. In this study, class labels were used as categorical data, and the label-encoder function from the scikit-learn library in Python was employed to convert string categorical data into numerical values. Class labels in this study represent image categories such as woodlands, shrubs, sea, orchards, logged forests, grassland, degraded land, and buildings. The class labels were transformed into distinct numerical values between 0 and 7. As presented in Table 3, the first column represents the transformed numerical values, and the second column represents the corresponding class labels. Since images were of different sizes, the resize function from scikit-learn was employed to resize all images to 226 × 226 pixels. For each category, 19 images were set aside for testing, and 100 images were reserved for training. Figure 1 shows a sample of the images used in the study.

4. Deep Learning Architectures

4.1. Xception Architecture

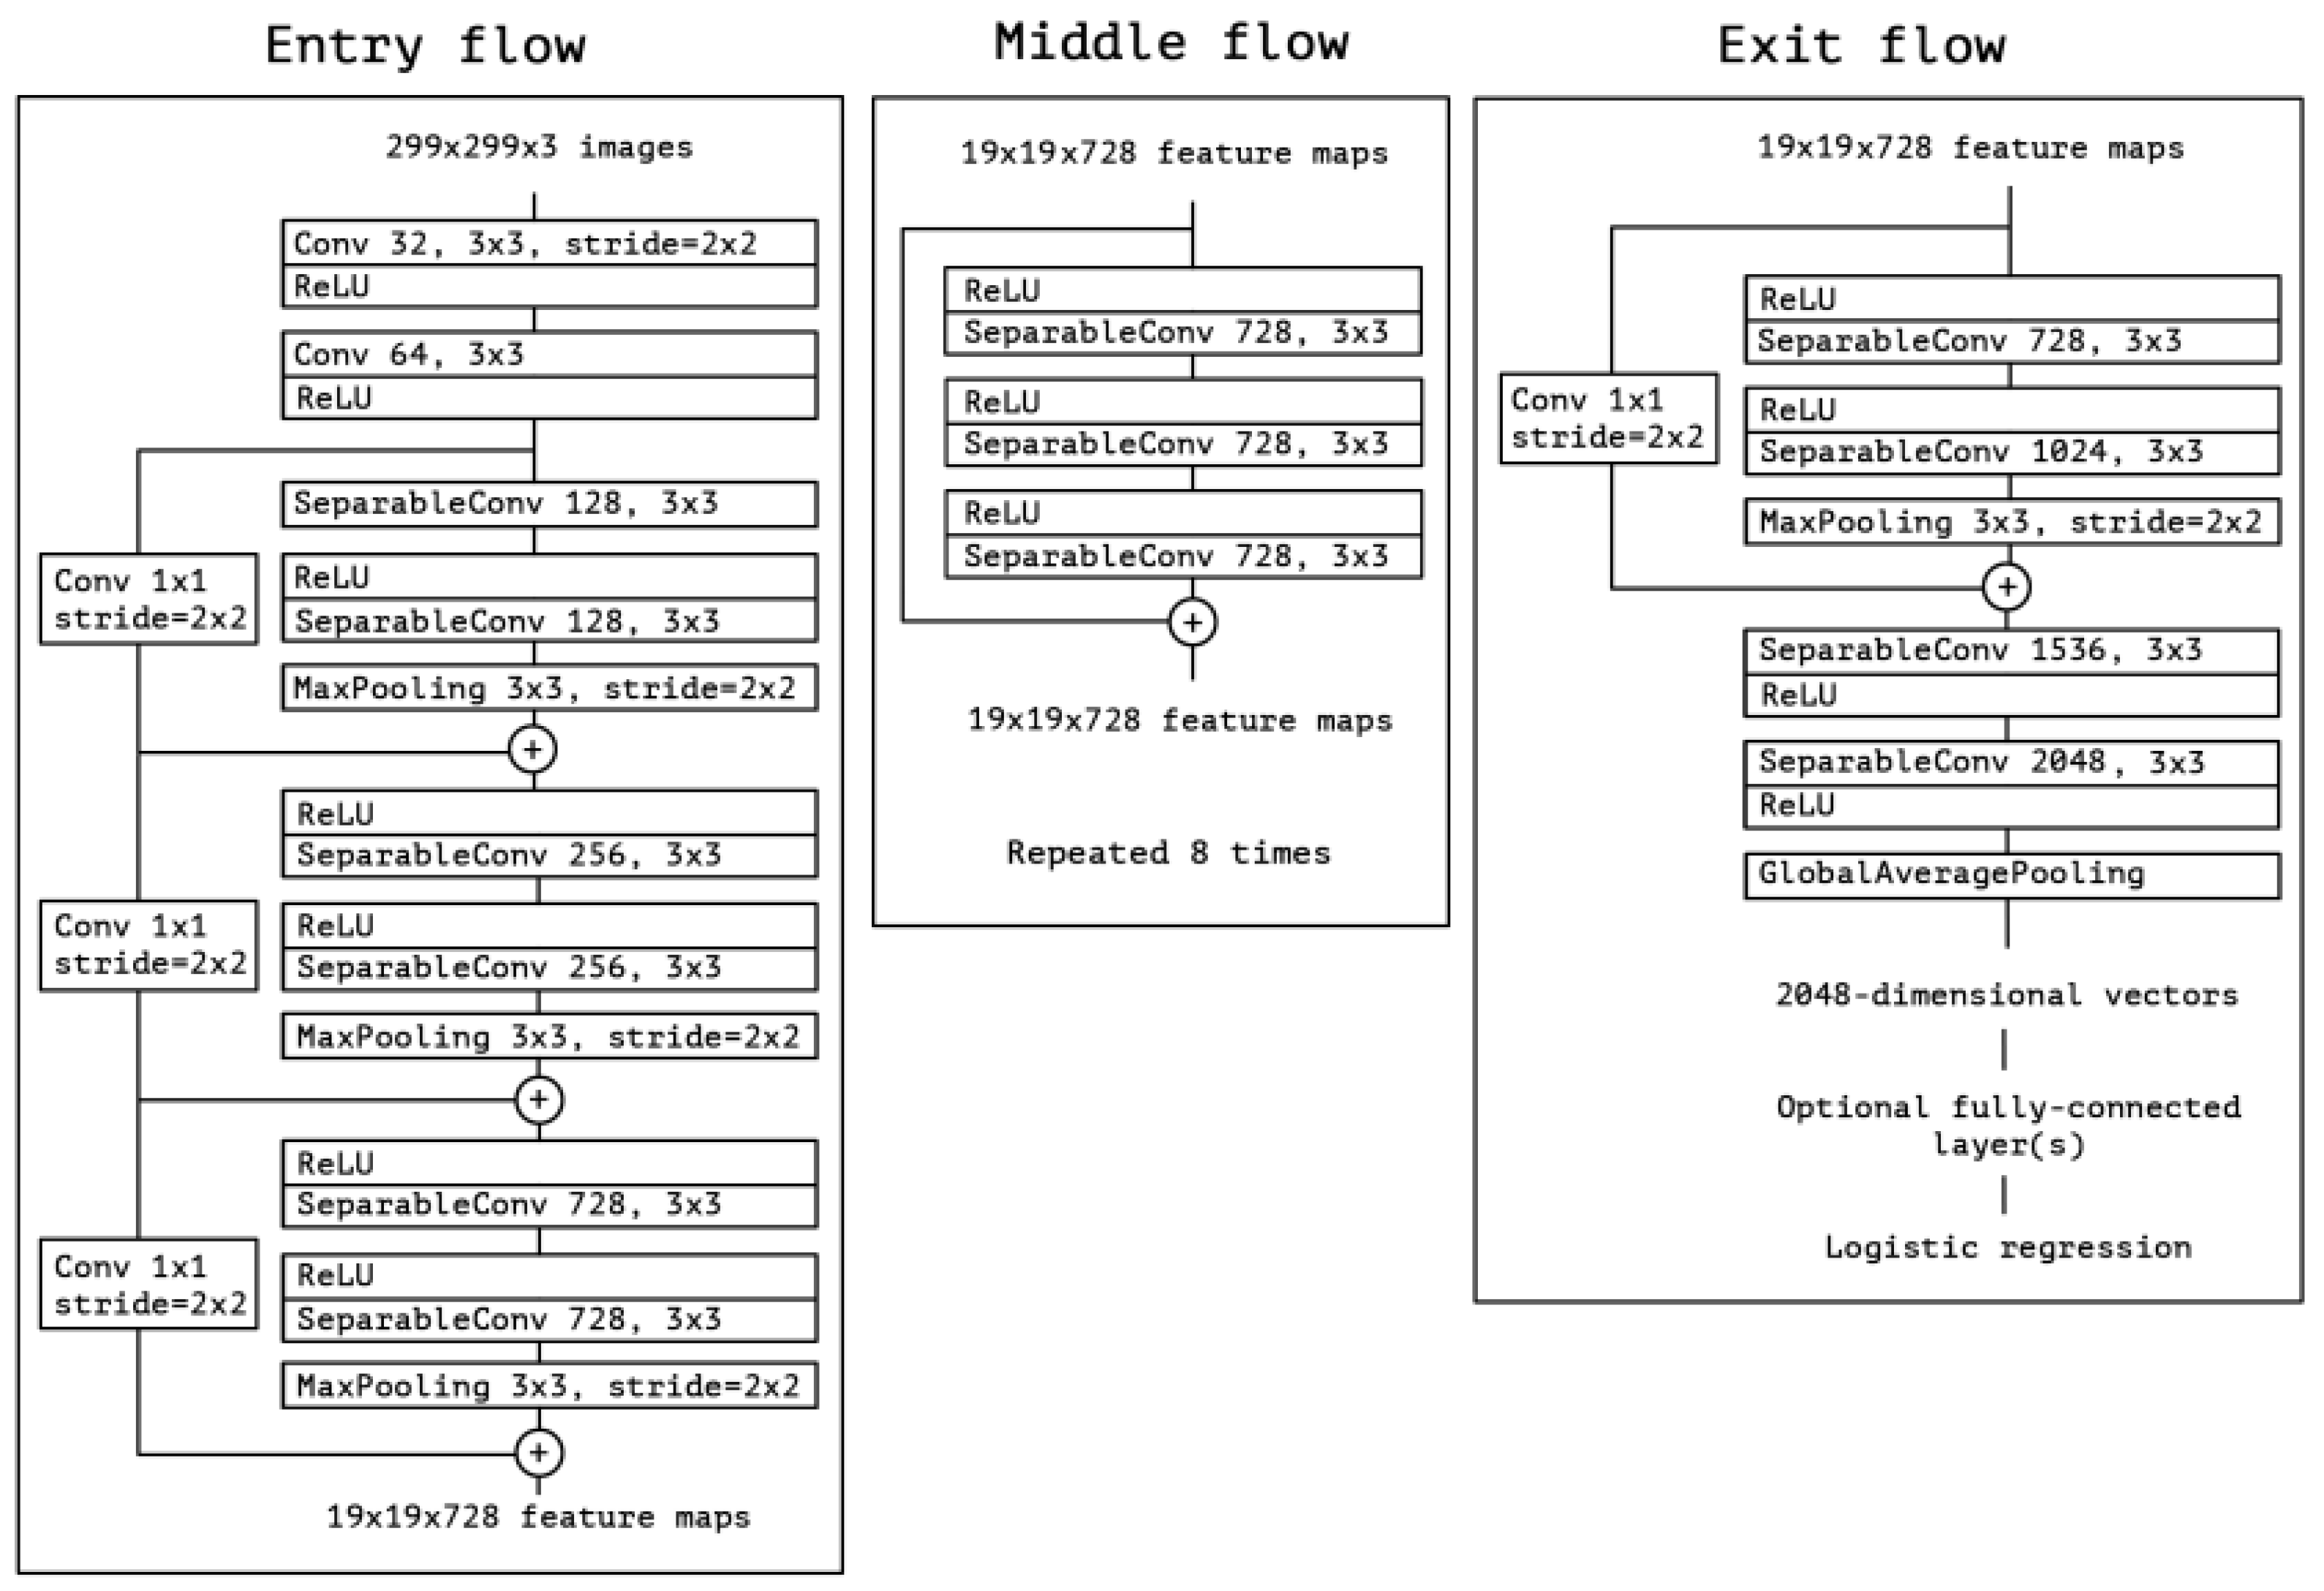
Xception is expressed as “Extreme Inception”. The feature extraction base of the Xception architecture has 36 convolutional layers. With the exception of the first and last modules, the convolutional layers are divided into 14 modules, all of which have linear residual connections surrounding them. The Xception architecture is briefly described as a linear stack of depthwise separable convolutional layers with residual connections. Such an architecture is very easy to define as it only takes about 30 to 40 lines of code to implement using libraries such as Keras or Tensorflow. As shown in Figure 2, images are taken as input through the entry flow section, and then subsequently channeled into the middle flow section, where the feature map process is repeated 8 times; finally, they are channeled through the exit window.

4.2. VGG-16 Architecture

VGG-16 is a CNN network that has received huge attention in the area of computer vision due to its high classification accuracy of 92.7% when implemented on 1000 images of 1000 different categories on the ImageNet dataset [33]. The 16 in the VGG-16 architecture represents 16 convolutional layers with learnable parameters. Overall, it is composed of 13 convolutional layers, 5 pooling layers, and 3 dense layers, which gives a total of 21 layers; however, it has only 16 weight layers with learnable parameters. What is unique about VGG-16 is that it disregards a large number of hyper-parameters and instead uses 3 × 3 filter convolutional layers with stride 1 and max-pooling layers of 2 × 2 filters.

4.3. ResNet-50 Architecture

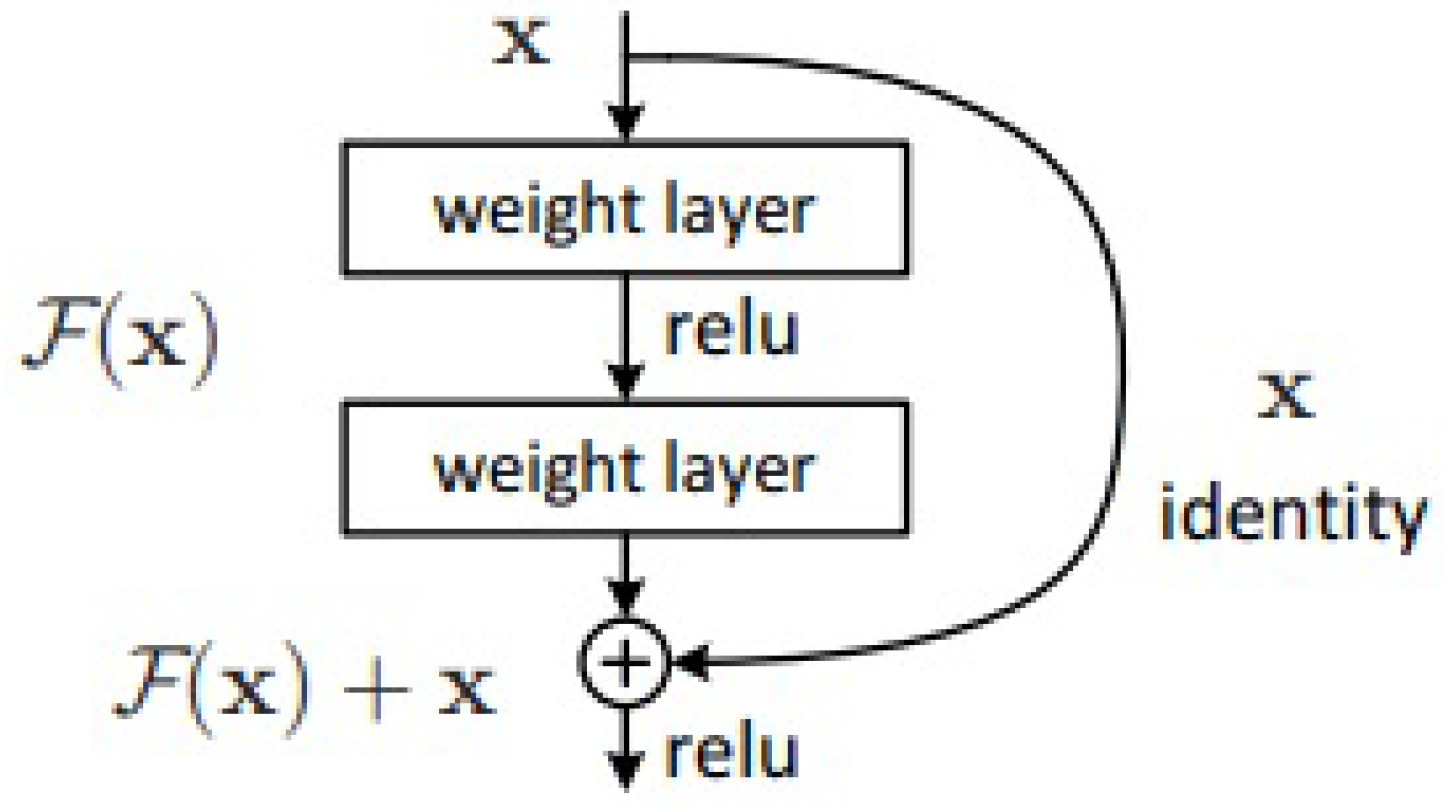
The ResNet-50 architecture was developed to overcome the degradation problem by using residual learning. It is an extremely deep type of CNN with 48 convolutional layers, 1 max pooling layer, and 1 average pooling layer. An input instance and an output instance are summed up such that the original mapping function
H ( x ) = F ( x ) x
is redefined as
H ( x ) = F ( x ) + x .
The refinement of the mapping function greatly approximates the desired functions while also making learning simple. This reformulation was initiated to mitigate the degradation problem. The redefined mapping function in Equation (2) is implemented by having feed-forward neural networks with short connections, as shown in Figure 3.
The shortcut connections carry out identity mapping operations, and the results are added to the outputs of the stacked layers. If the additional layers can be built as identity mappings, the training error of a deeper model should be no greater than that of its shallower counterpart.

5. Ontological Bagging Algorithm

The ontological bagging algorithm enhances semantic relationships, which in turn increases image classification accuracy. The idea behind this is to create sub-classes or categories at each ontological node based on the ontological structure. For each sub-class, weak attributes are learned, and they serve as image features for node training such that the node will be able to discriminate between the node’s sub-classes.

5.1. Semantic Grouping

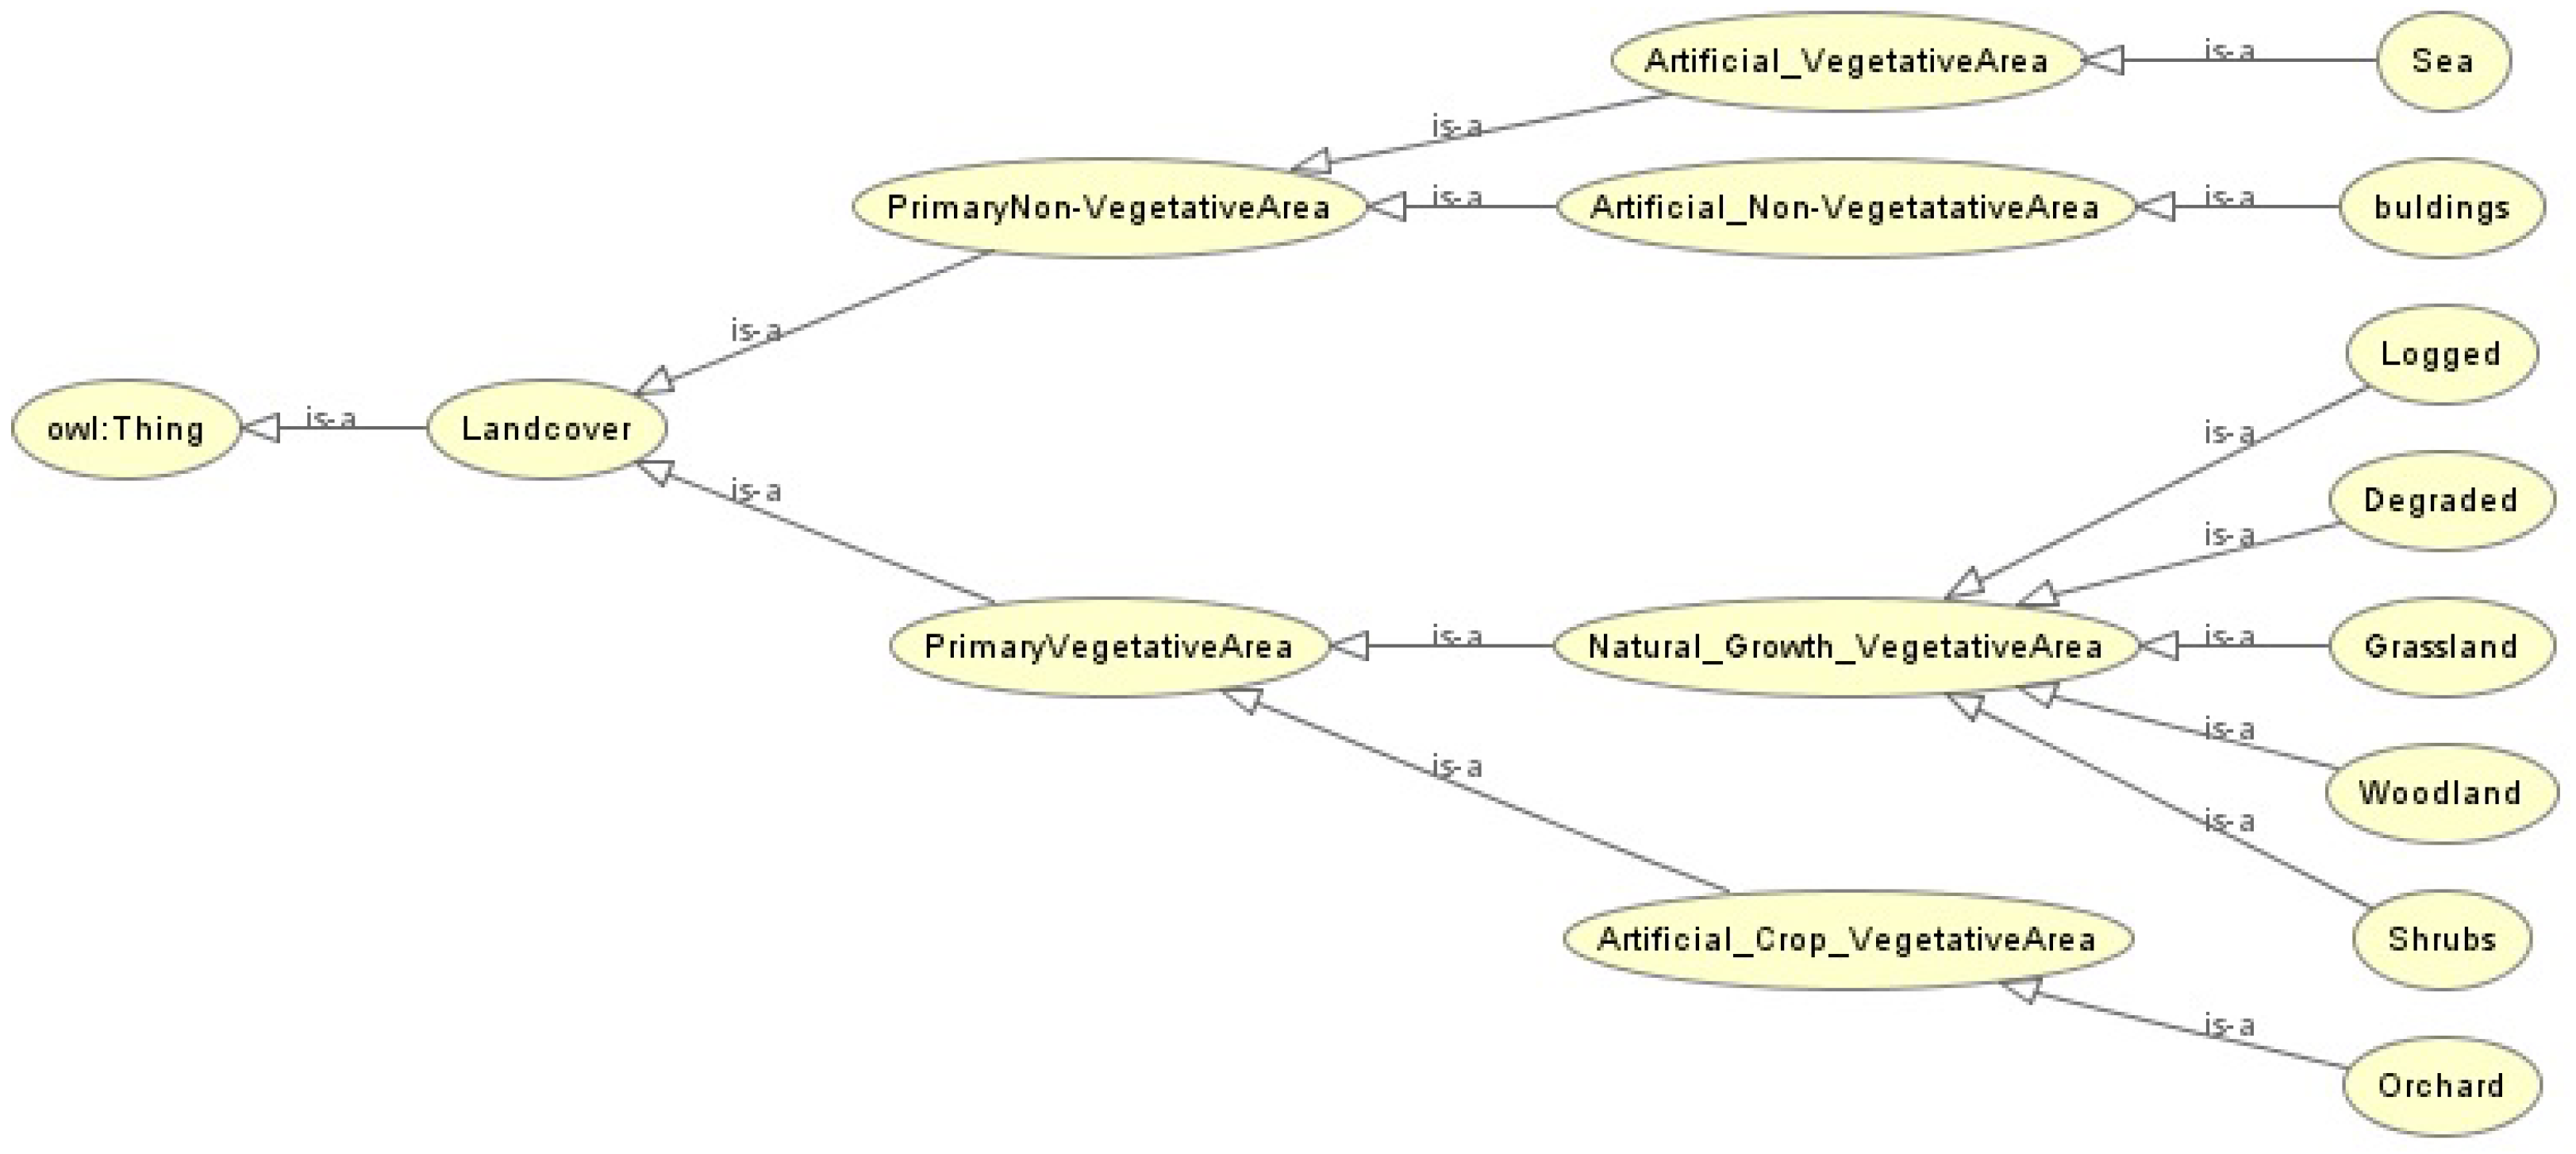
In order to build a hierarchical classifier, all images for all classes designated for training are required in an ontology. The naive approach of creating a semantic group involves recursively collecting only images of a particular leaf category. With the help of semantic relationships, training images for classes at the subsequent intermediate semantic levels can be accomplished by grouping together images of their offspring. At a given ontological node S, its subsequent children S 1 , …, S N are referred to as super-classes or categories, where N is the total number of children. Images belonging to category c i will be denoted as m i if c i is a child of m i . For instance, considering that the super-classes at the root node are “artificial crop vegetation” and “natural crop vegetation”, then the training images of “natural crop vegetation” will comprise the training images of “field” and “orchard”. As presented in Figure 4, logged and degraded forests are children of the “Natural Growth Vegetative Area” class rather than the “Artificial Growth Vegetative Area” class, even though both classes belong to the “Primary Vegetative Area” parent class.

5.2. Weak Attribute Learning

The bagging algorithm automatically learns many features or attributes from labeled super-category images over multiple instances. Some images belonging to one particular super-category are treated as positive bags, and the rest are treated as negative bags. Images sampled from these two bags will serve as instances of the bag. Given a super-category Q, the ontology bagging algorithm learns M unique weak features. Several image windows ( r i , t i ) are selected for each training image. Each image window r i j consists of a latent variable b i j ( 0 , 1 , , S ) . If b i j = s ( 1 , , S ) , r i j denotes a positive instance of the s t h weak feature of S. If b i j is evaluated as zero, then r i j is the negative instance. Weak features are learned by giving solutions to the following objective function:
m i n w , b i j s = 0 S | | w s | | 2 + γ i j m a x ( 0 , 1 + w p i j T r i j w b i j T r i j ) ,
which is subject to the following constraints:
if t i = Q , j b i j > 0 otherwise , r i j = 0 ,
where p i j = argmax s ( 0 , , S ) , s b i j w s T r i j . Each w k represents the kth positive weak feature, while w 0 represents the negative weak feature. After learning features from all images belonging to one particular super-category at a given node, the final image features are constructed on the basis of the responses of the weak attributes or features.

6. Proposed Model

In this section, the proposed image classification model and its components are explicitly described. As presented in Figure 5, the image classification approach is made up of 3 components, i.e., (1) feature extraction, (2) domain ontology construction, and (3) forest-type image classification. In the proposed model, an ensemble stack of ResNet50, Xception, and VGG16 is used to generate a feature vector (top of Figure 5) required to perform the image classification process. Image categories from the dataset are set to be used for building the ontology, which forms the basis of establishing semantic relationships between concepts of the forest domain (bottom right of Figure 5). A linear SVM multi-classifier is selected to classify images into their respective categories (bottom left of Figure 5).

6.1. Feature Extraction

The feature selection preprocessing step plays a significant role in tasks relating to image classification. The ensemble stacked model of VGG16, Xception, and ResNet50 (top of Figure 5) was used to obtain features from the training dataset. The composite set of features obtained by the three deep learning techniques was used as a feature vector for the model. The ensemble technique helps to increase the scope of the feature vector. A single feature selection method only selects an optimal subset of features from the training dataset; hence, the final feature vector may not be a true reflective set to serve as a basis for the subsequent image classification process. Ensemble feature selection may produce a more accurate outcome by combining the different outputs of various techniques.

6.2. Ontology Building

The process of building an ontology was systematically broken into two main steps: (1) concept extraction and (2) relation generation. All concepts within the forest image dataset were extracted, and relationships between these concepts were generated. In particular, this study considered only the hyponymy and hypernymy relationships. Concepts are organized hierarchically, e.g., an image object classified as an “orchard” is an instance of the “artificial vegetation concept”. The visualization of the ontology is seen as the taxonomic relationship between concepts. OWL API was used to construct the ontology with Algorithm 1.
Algorithm 1 An algorithm for ontology construction
1:
Input: f o r e s t 1 : classes, x: lexical resource
2:
Output: θ : Ontology
3:
Initialisation: θ ( r o o t : v e g e t a t i o n )
4:
concepts e x t r a c t c o n c e p t s ( f o r e s t 1 )
5:
subconcepts f i n d h y p o c o n ( r o o t , c o n c e p t s , x )
6:
while ( | s u b c o n c e p t s | > 0 ) do
7:
     foreach ( S s u b c o n c e p t s ) do
8:
        hyperconcepts f i n d h y p e r c o n ( θ , S , x )
9:
        T c r e a t e T a x o n o m i c R ( h y p e r c o n c e p t , S )
10:
      AddTaxonomic ( θ , T )
11:
     Endforeach
12:
     subconcepts f i n d h y p o c o n ( s u b c o n c e p t s , c o n c e p t , x )
13:
end while
14:
Return θ

6.3. Image Classification

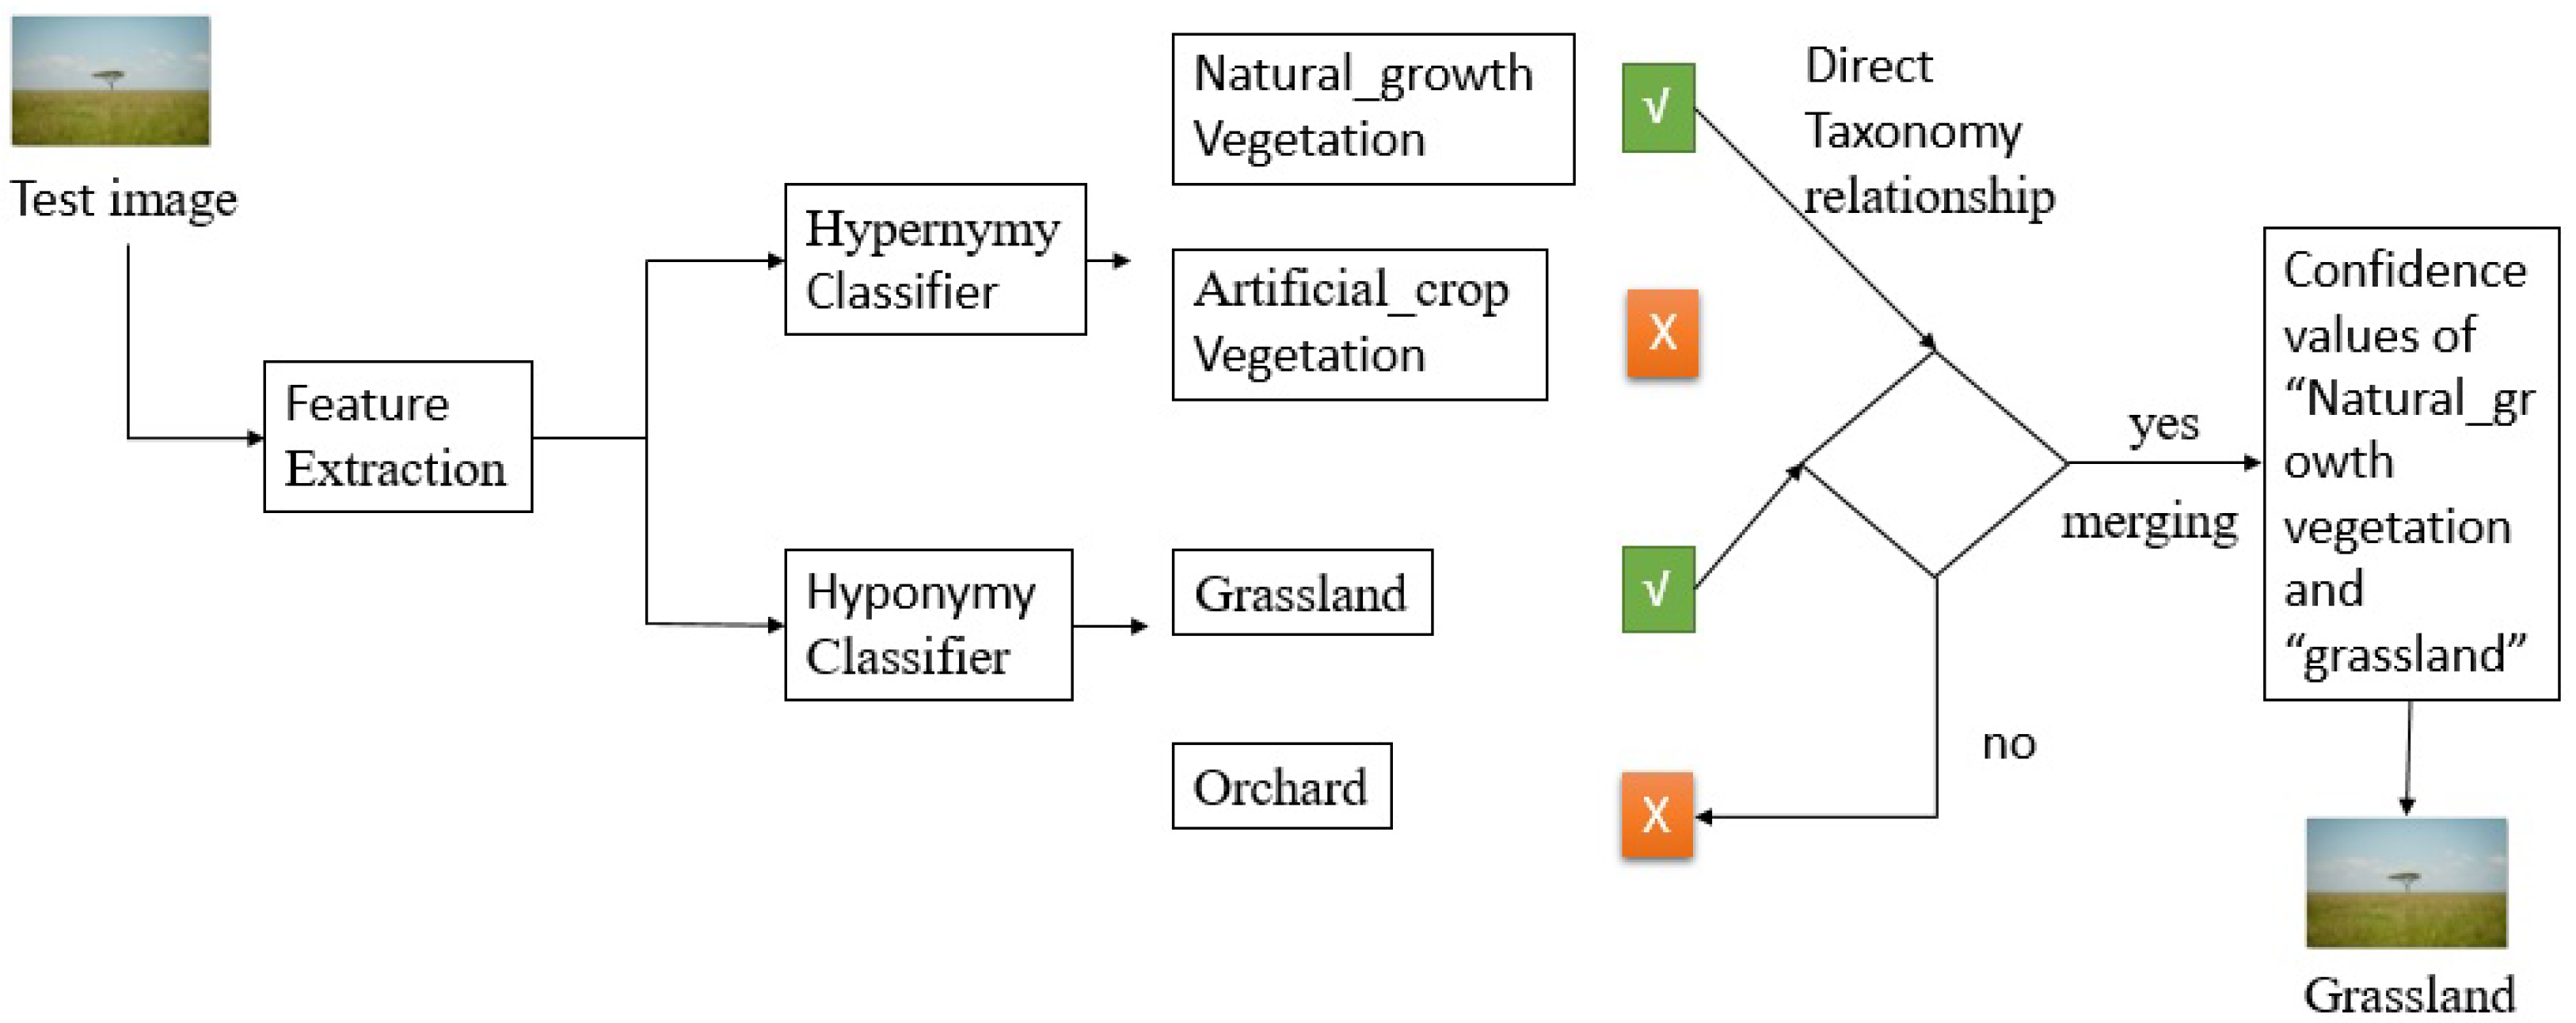
This section describes the image classification process. As presented in Figure 5, the feature vector is obtained through an ensemble stacked model, and the ontology is used to perform an image classification task. The features are provided as input to a linear SVM classifier. Linear SVM is appropriate for all cases where there is a diversity of image categories [11]. The feature vector obtained from training images is used to train a one-vs.-all SVM classifier for each category in order to distinguish a given category from other categories. Each classifier will compute a confidence value that will be used to determine the appropriate category of an image. The training is based on the taxonomical relationship between ontology concepts. To begin with, all categories at each node of the ontology are bagged into a super-category in order to train hypernym classifiers. The classification of a given test image is carried out using both the hyponymy and hypernymy classifiers, as shown in Figure 6. A test image is allocated to a category with the best hypernymy classifier, i.e., “artificial crop vegetation” (because it has the highest confidence value). The same test image is also assigned to the best hyponymy classifier (grassland), in which the classification process is performed using the hyponymy classifiers. If the best hyponymy class and the best hypernymy class have a direct relationship, the output of both classifiers will be merged together by combining their confidence values. If there is no direct relationship between the classifiers, the best hyponymy class will be considered.

7. Experimental Setup

The experiments were carried out on the Google Colab platform, which offers free TPU and GPU on cloud resources. Training with GPU is faster than without GPU. Three deep learning models, namely, ResNet50, VGG16, and Xception, were adopted via transfer learning using the Python Keras library of the GPU with a Tensorflow GPU backend to perform feature extraction on images from the dataset. The hardware and software specifications for the experiments are detailed in Table 4. The features obtained from the three deep learning models were aggregated using the sum function. Owlready2, which is a module in ontology-oriented programming in Python, was used to generate the taxonomical relationships between image categories. The resulting ontology is shown in Figure 4. The set of features obtained from the sum aggregate function was used to train the classifiers according to the taxonomical relationship between image categories.

Proposed Model Evaluation Metrics

The performance of the proposed model was evaluated using metrics such as accuracy, root-mean-square error (RMSE), a confusion matrix, and the receiver operating characteristic (ROC) area under the curve (AUC), commonly referred to as the ROC curve. Accuracy is a measure of how close the obtained values are to the accepted values. Accuracy is defined in Equation (5).
A c c u r a c y = T N + T P T N + T P + F P + F N ,
where TP, TN, FN, and FN denote true positives, true negatives, false negatives, and false positives, respectively. The root-mean-square error RMSE is the square root of the mean square of all errors. Because it is scale-dependent, RMSE is a good measure of accuracy for comparing forecasting errors of different models or model configurations for a specific variable but not between variables. It is calculated in Equation (6).
R M S E = 1 n i = 1 n ( O i P i ) 2 ,
where O i are the actual values and P i are the predicted values.
The confusion matrix helps to provide a visualization of the performance of the classifiers. The visualization platform allows for easy identification of confusion between categories or classes, e.g., it is easy to identify classes that have more mislabeled data than others. The ROC curve, also known as the measure of sensitivity, is a plot of the true-positive rate versus the false-positive rate. A model with a curve that is far from the median position indicates a better classification performance. The ROC curve approximates the performance of a model across all thresholds in a plot. The bigger the area, the better the model. One of the advantages of the ROC curve is that it facilitates the comparative evaluation of results from different models without any need to balance issues related to sensitivity and specificity.

8. Experimental Results

The aim of this study is to assess the effect of ontologies in the image classification task. With that in mind, the proposed ontology-based forest-type image classification model was compared against other baseline models such as random forest (RF), K-nearest neighbor (KNN), SVM, and Gaussian naive Bayes. The features extracted using an ensemble of deep learning models were used to train the classifiers based on an ontology that describes taxonomic relationships between image classes. For a particular test image, the classification task was performed both by the hypernym and hyponym classifiers. First, the classification process began by assigning the test image to the hyponym and hypernym classifiers with the highest confidence values. The hyponym and the hypernym classifiers ran in parallel. If there was a direct relationship between hypernym and hyponym classifiers, their confidence values were merged, and the test image was assigned to the best hyponym classier. If there was no relationship between the classifiers, the next best hyponym classifier was considered, and the same process repeats.
The results presented in Table 5 show that the ontological bagging algorithm based on linear SVM outperformed other models with respect to RMSE and accuracy. The high accuracy is attributed to the ability of the model to suppress the error propagation of hierarchical classifiers.
The results were further presented in terms of the confusion matrix and ROC curves.
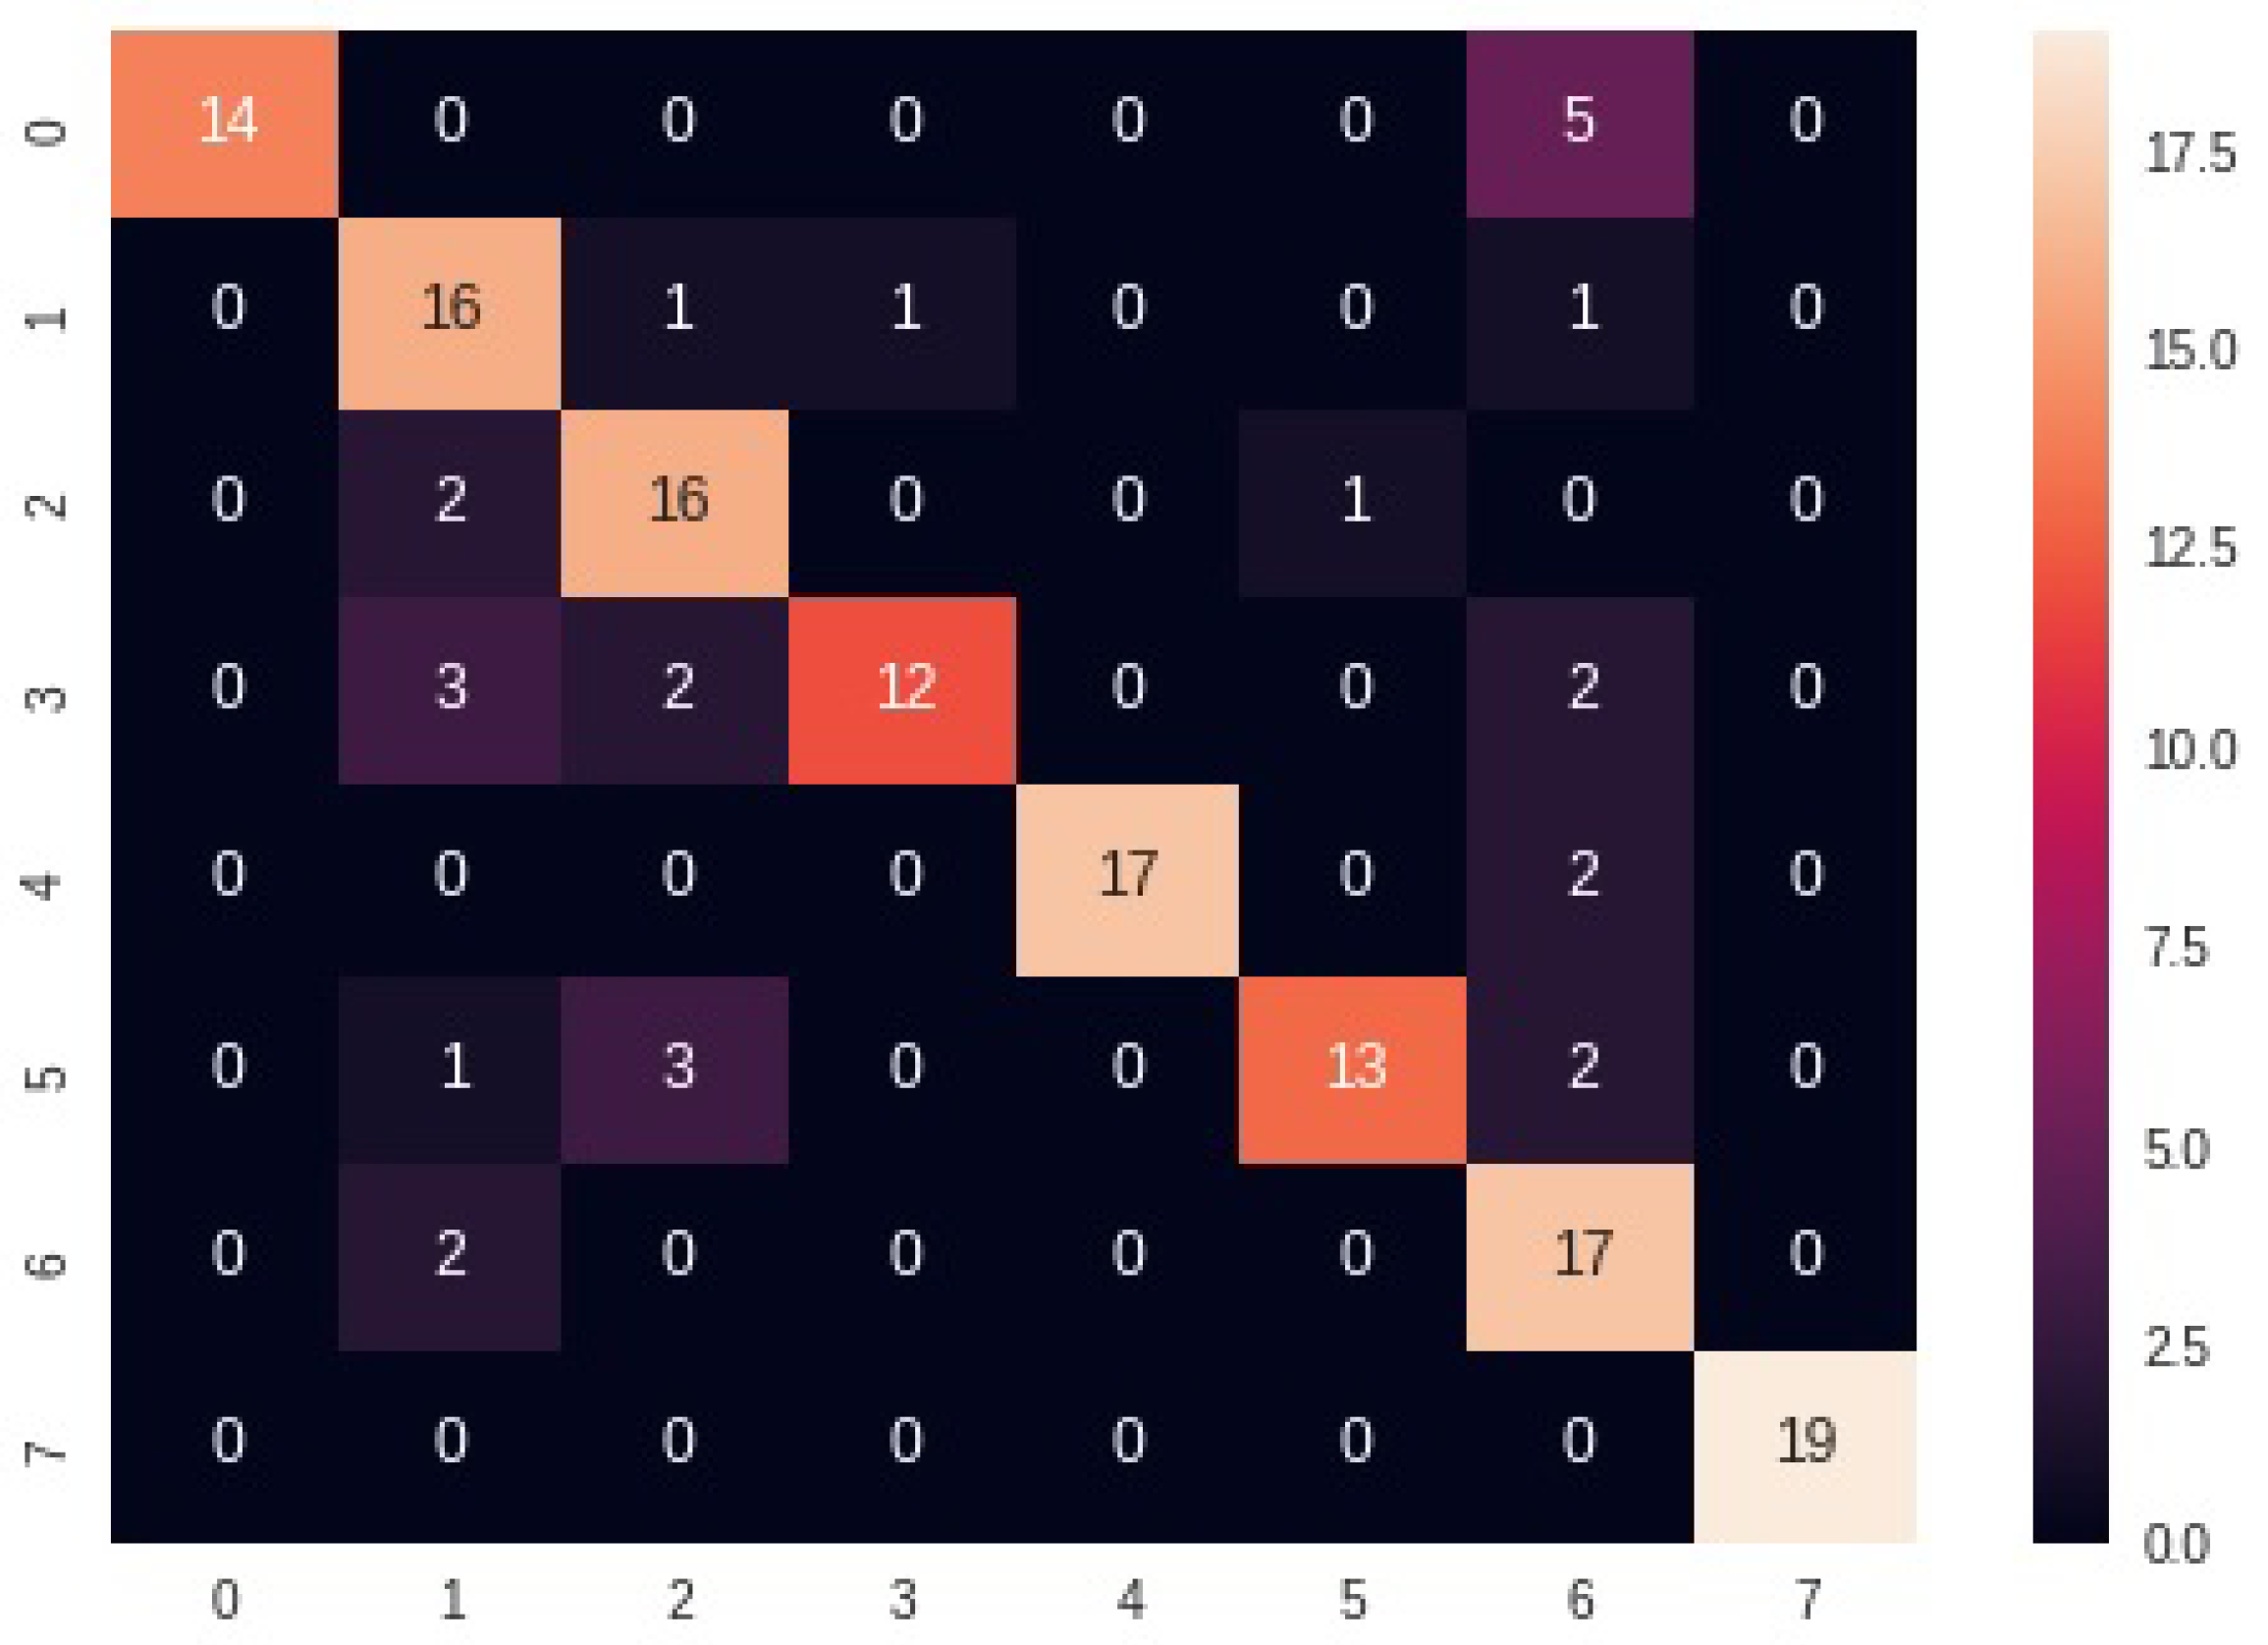
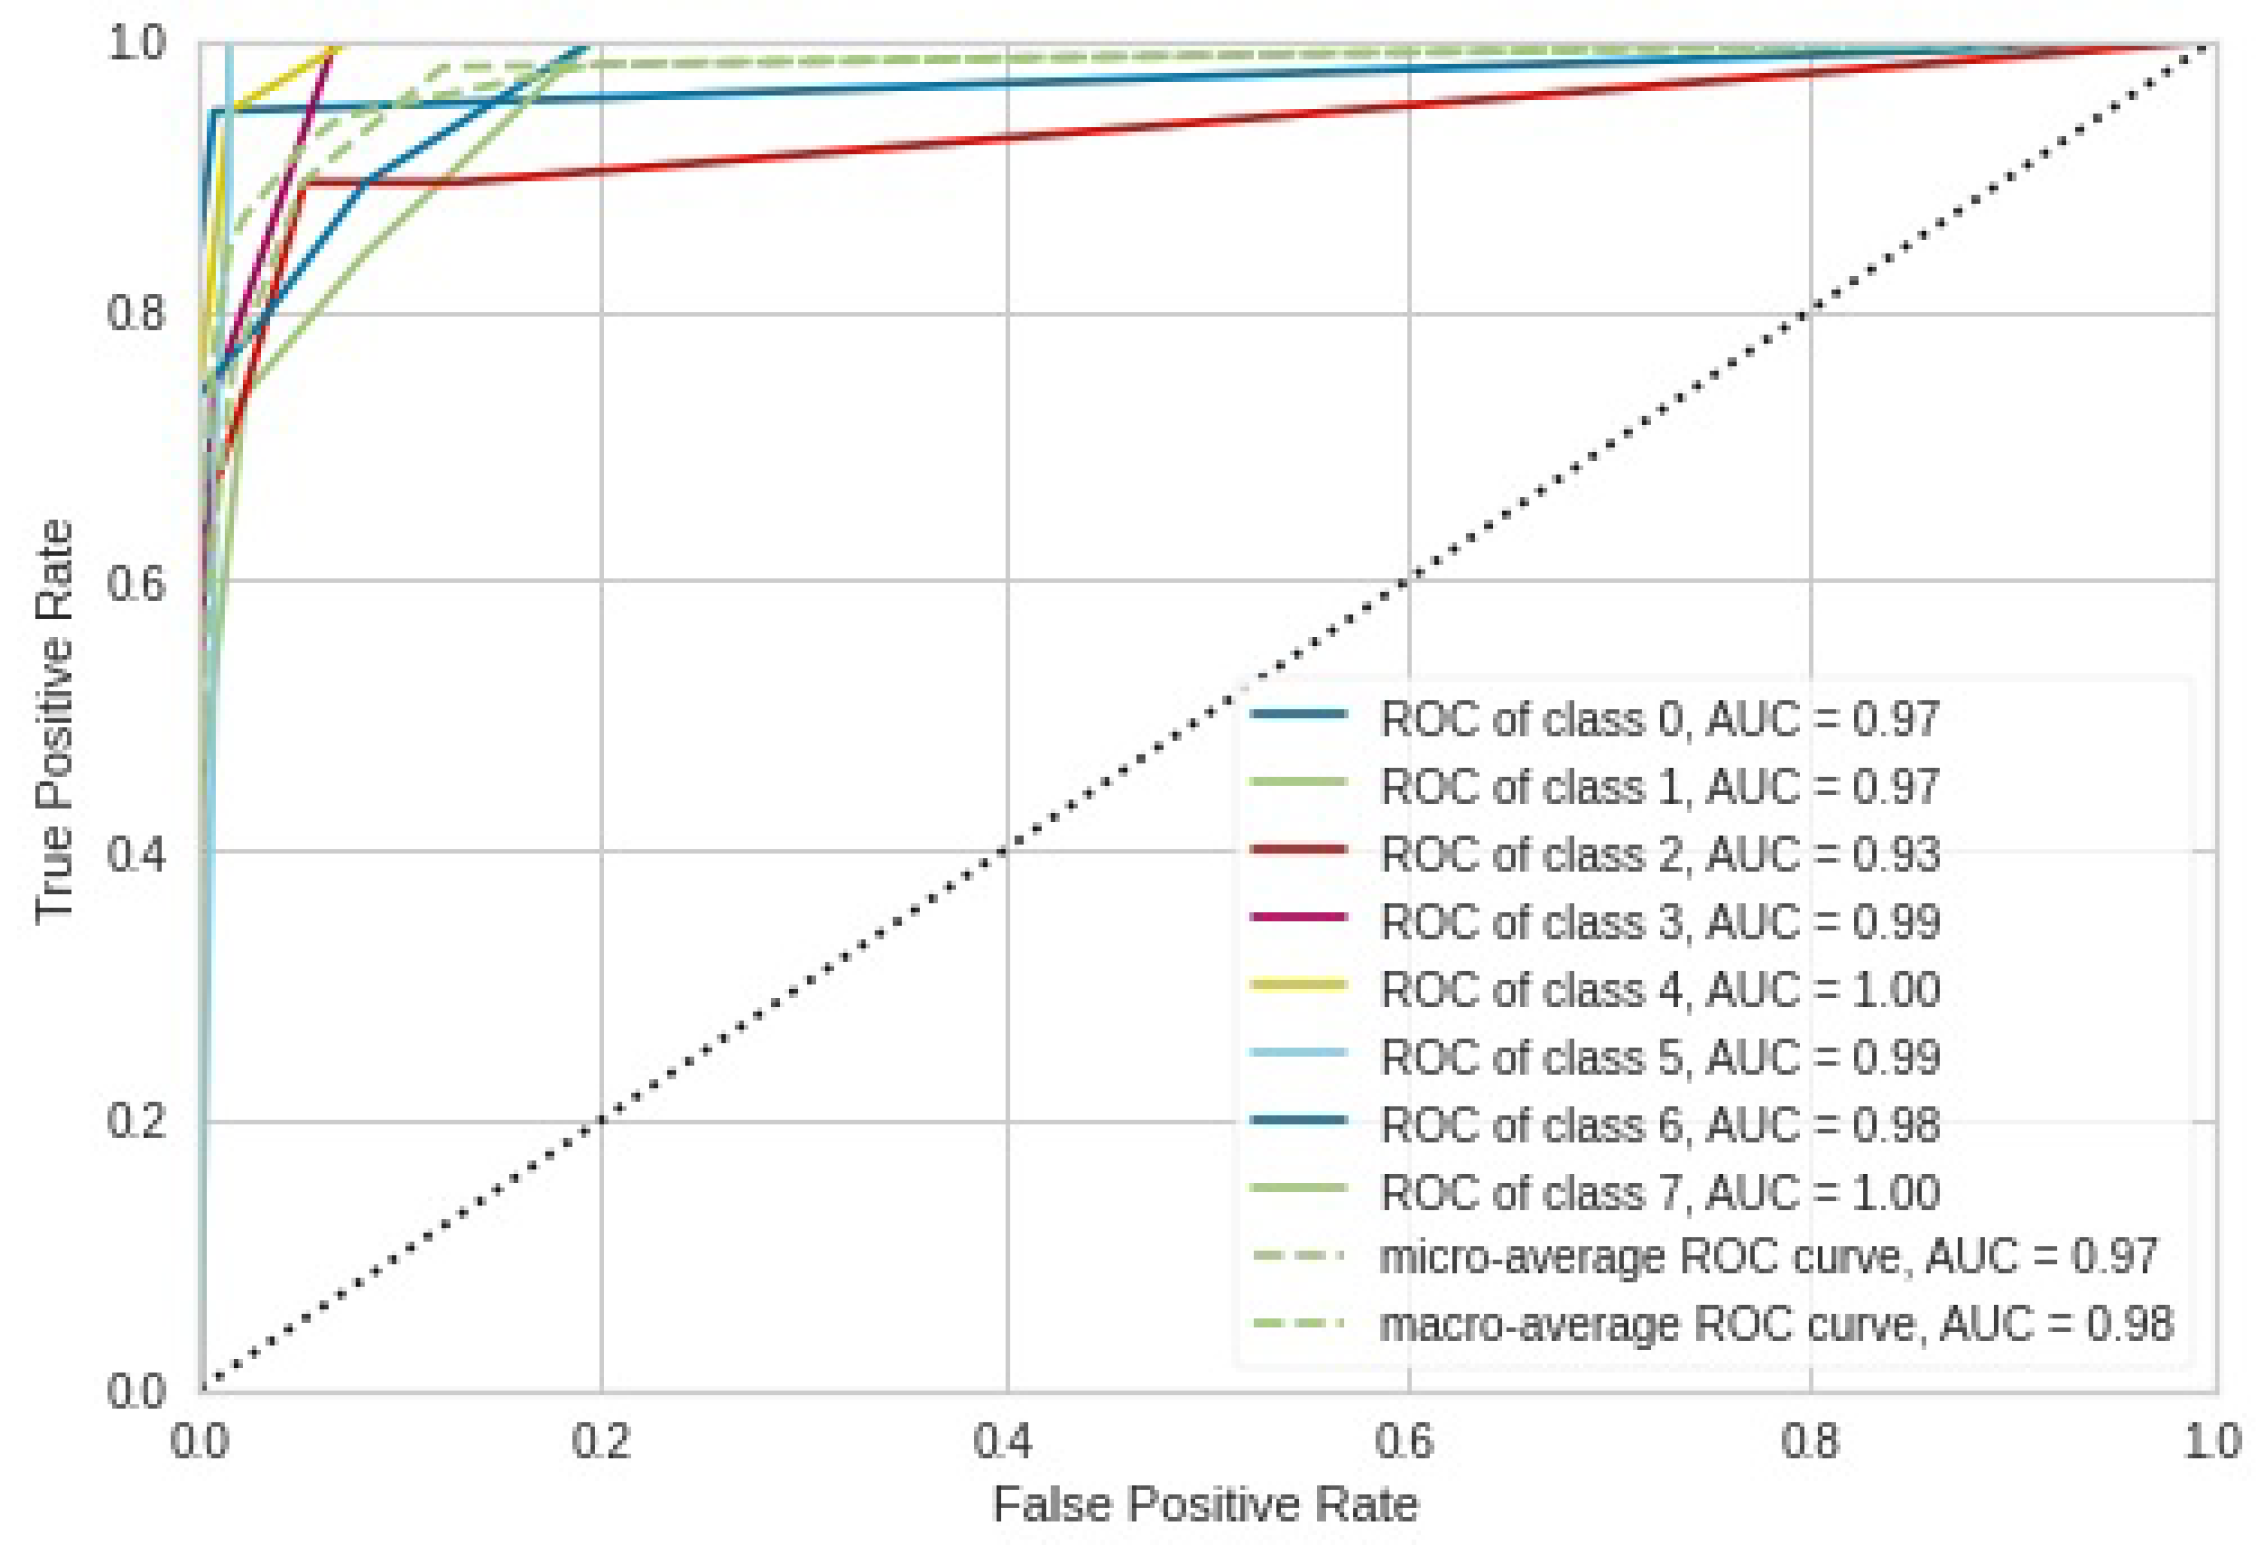
The confusion matrix for the kNN model is illustrated in Figure 7. It is shown that the kNN model absolutely managed to correctly classify all nineteen images for class 9. Similarly, the model correctly classified seventeen test images for classes 4 and 5, but class 5 received twelve more test images from classes 0, 1, 3, 4, and 5. The kNN performed poorly in classes 3 and 5, misclassifying seven and six test images into classes 1 and 2, respectively. The associated ROC curve for the kNN model in Figure 8 produced a perfect match for classes 7 and 4 by having an ROC AUC value of 1.0. In the corresponding confusion matrix of kNN, class 4 did not receive any false-positive test images, though two test images were misclassified into class 6.
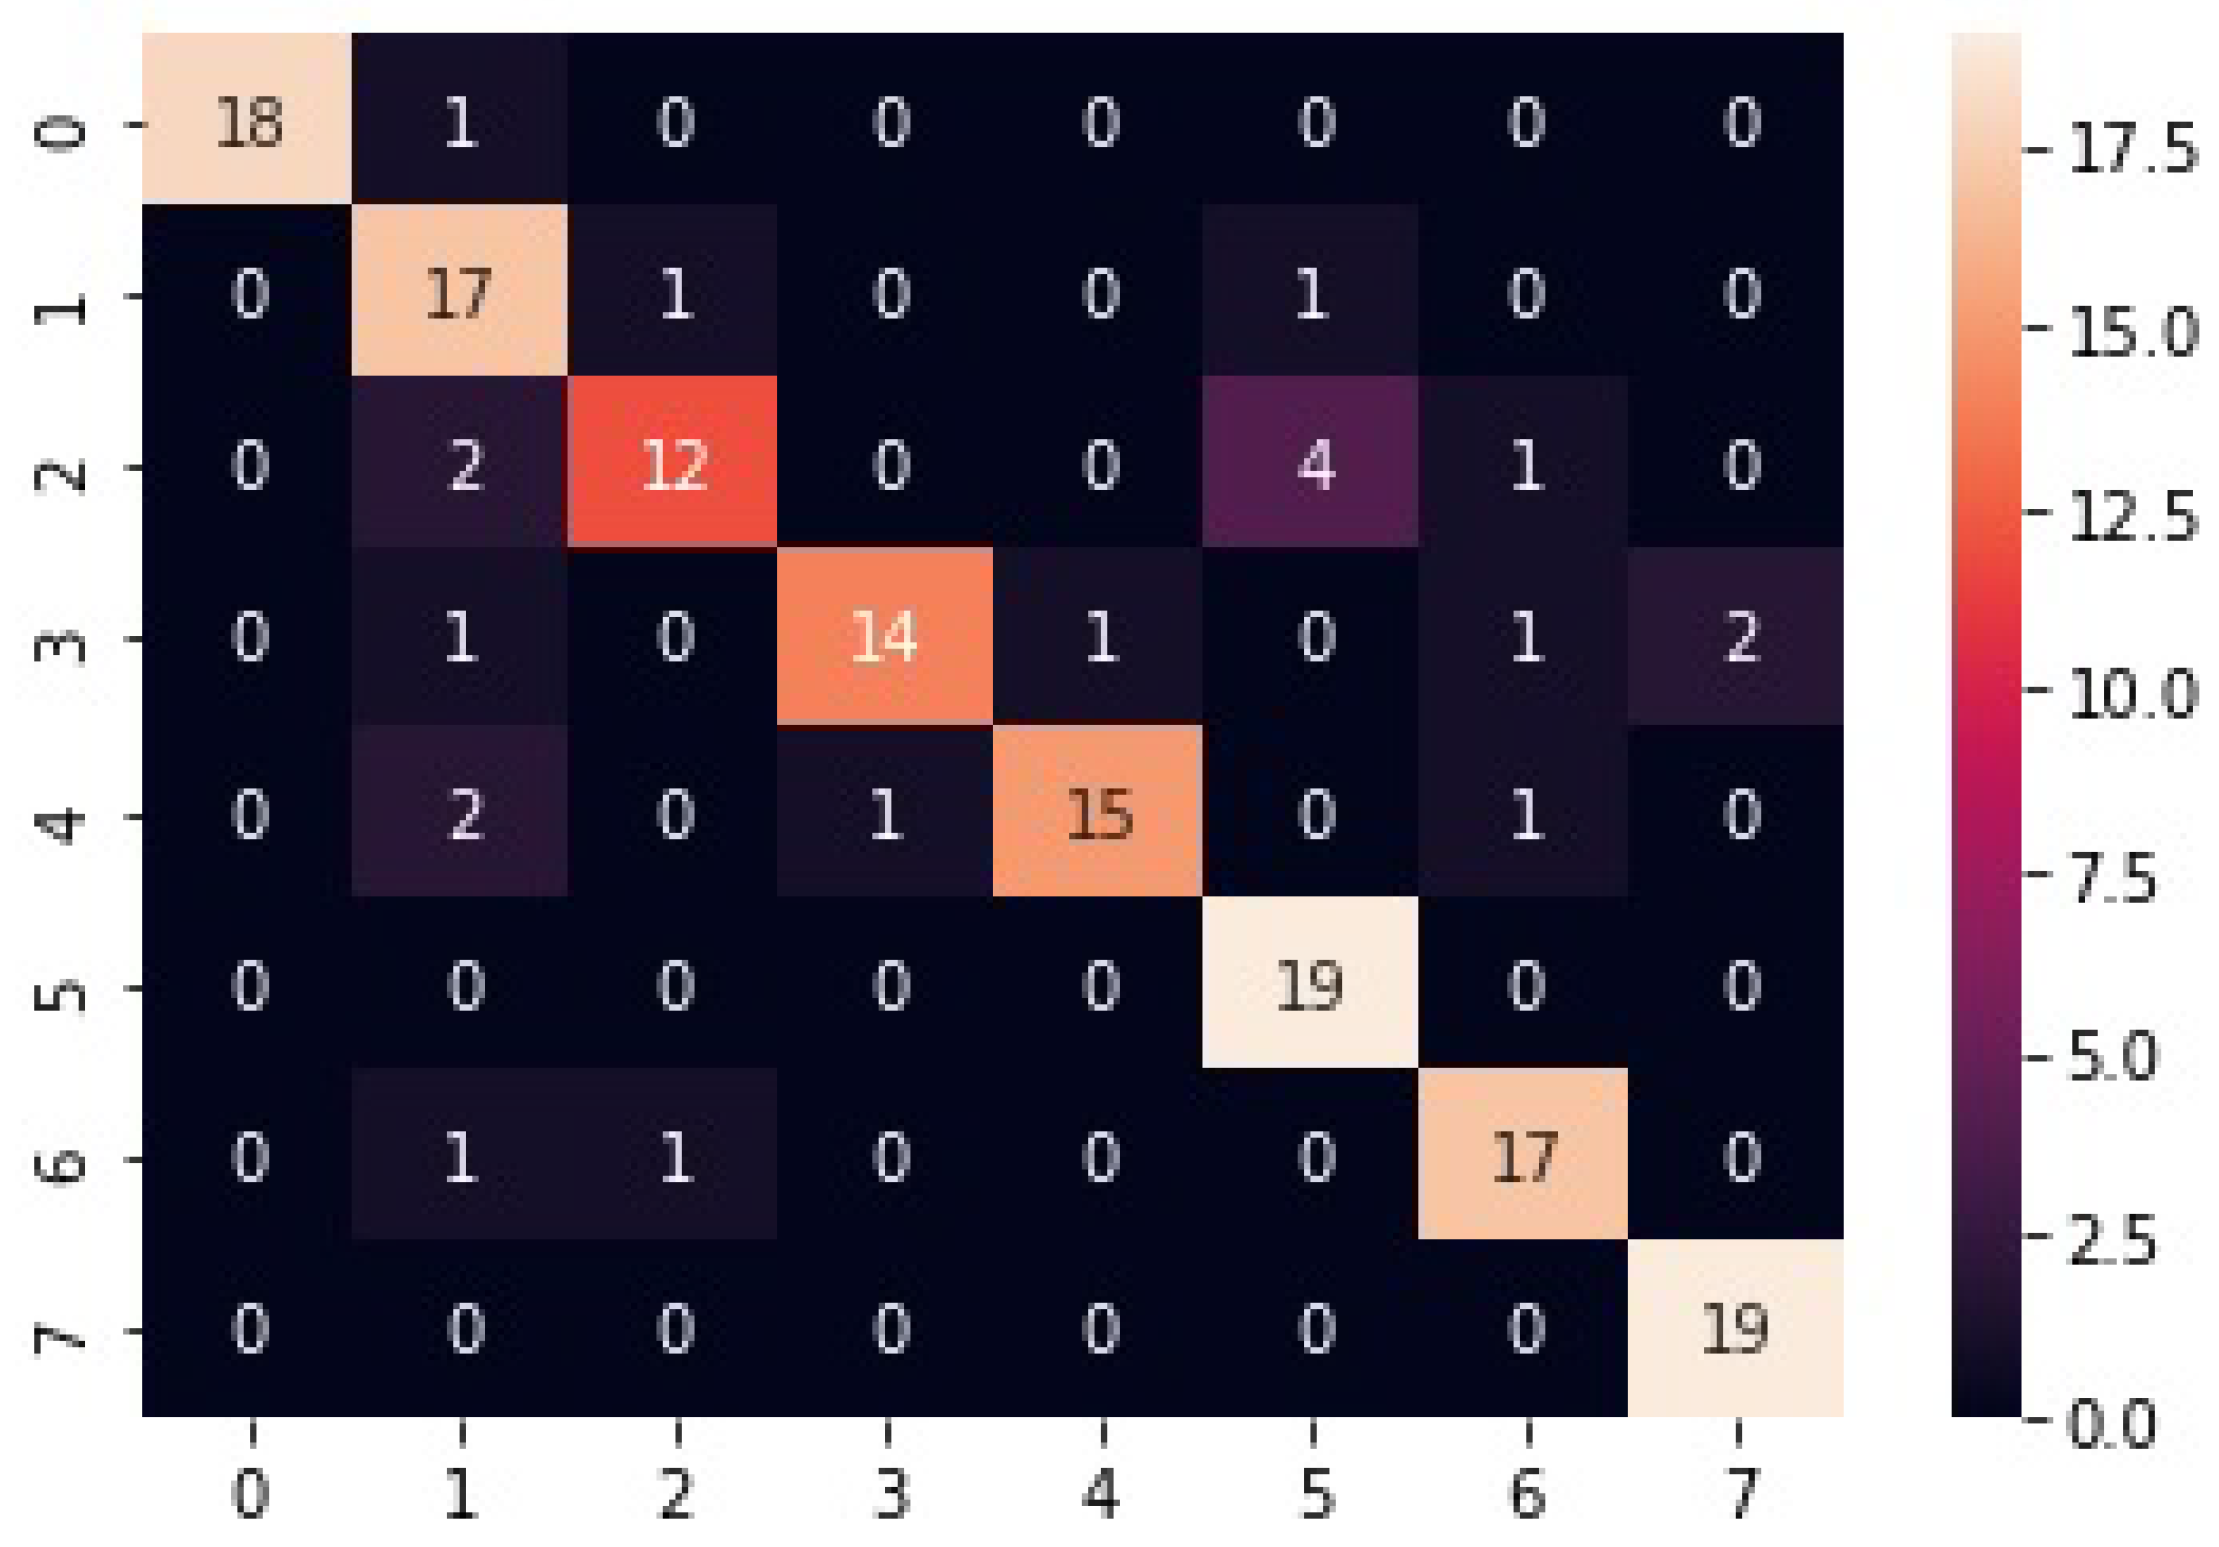
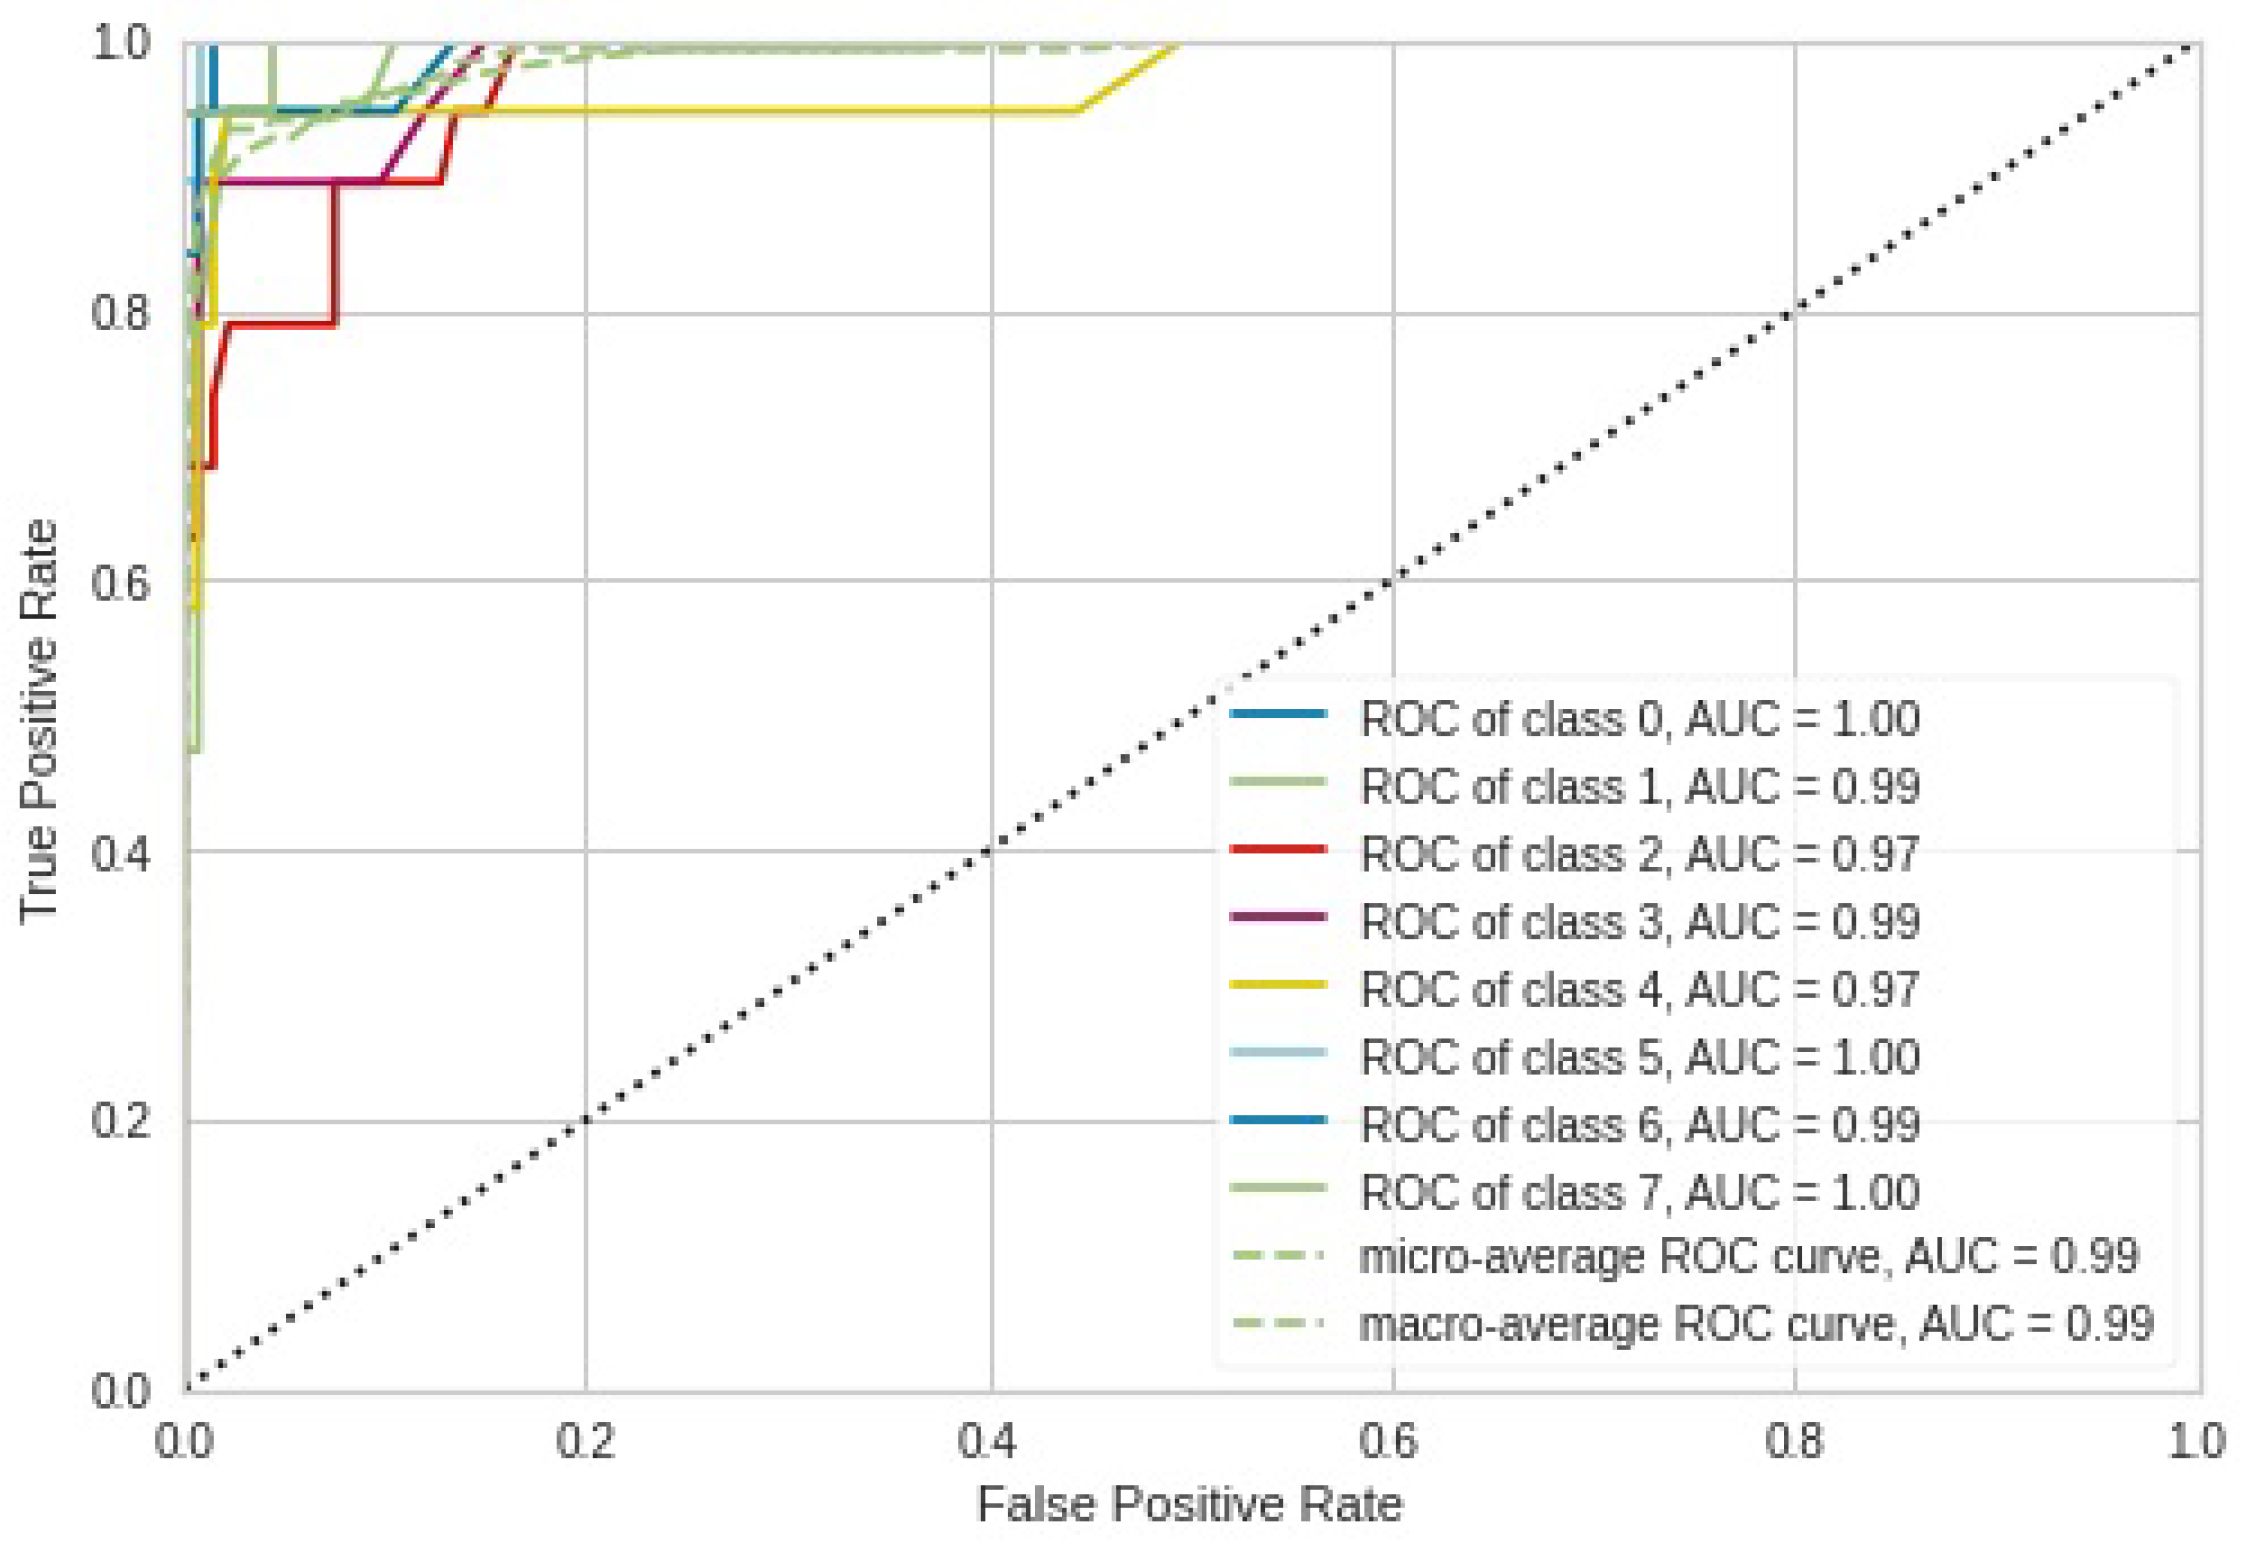
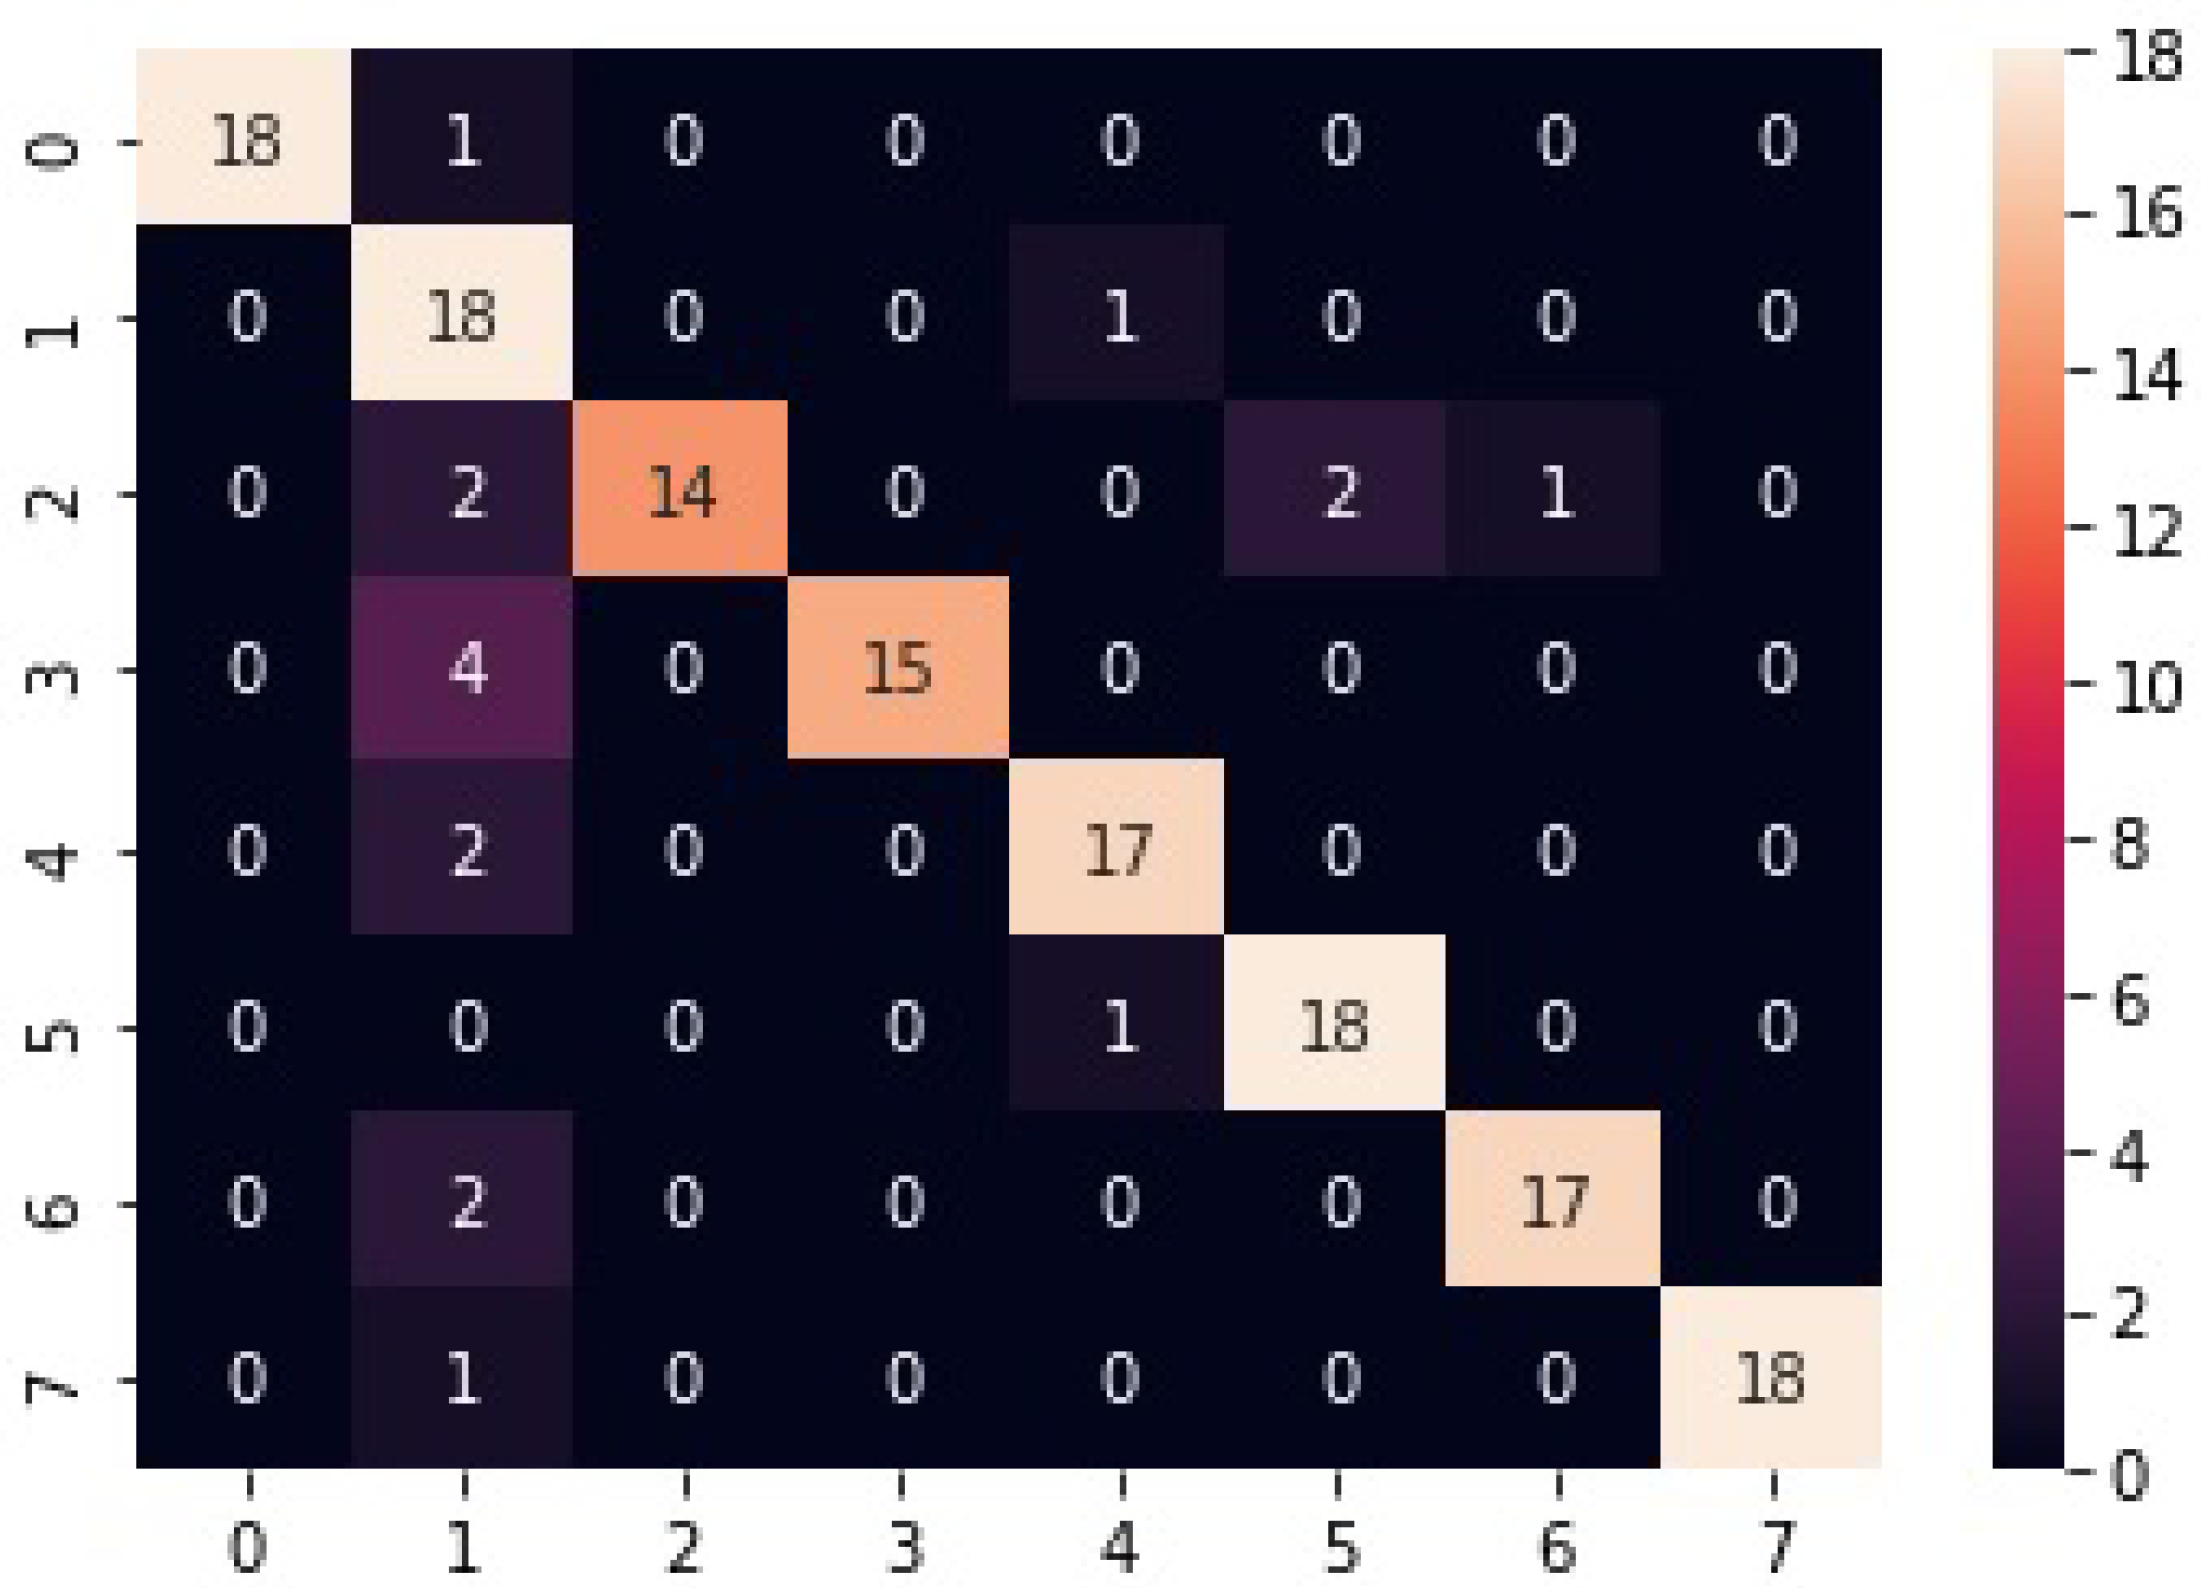
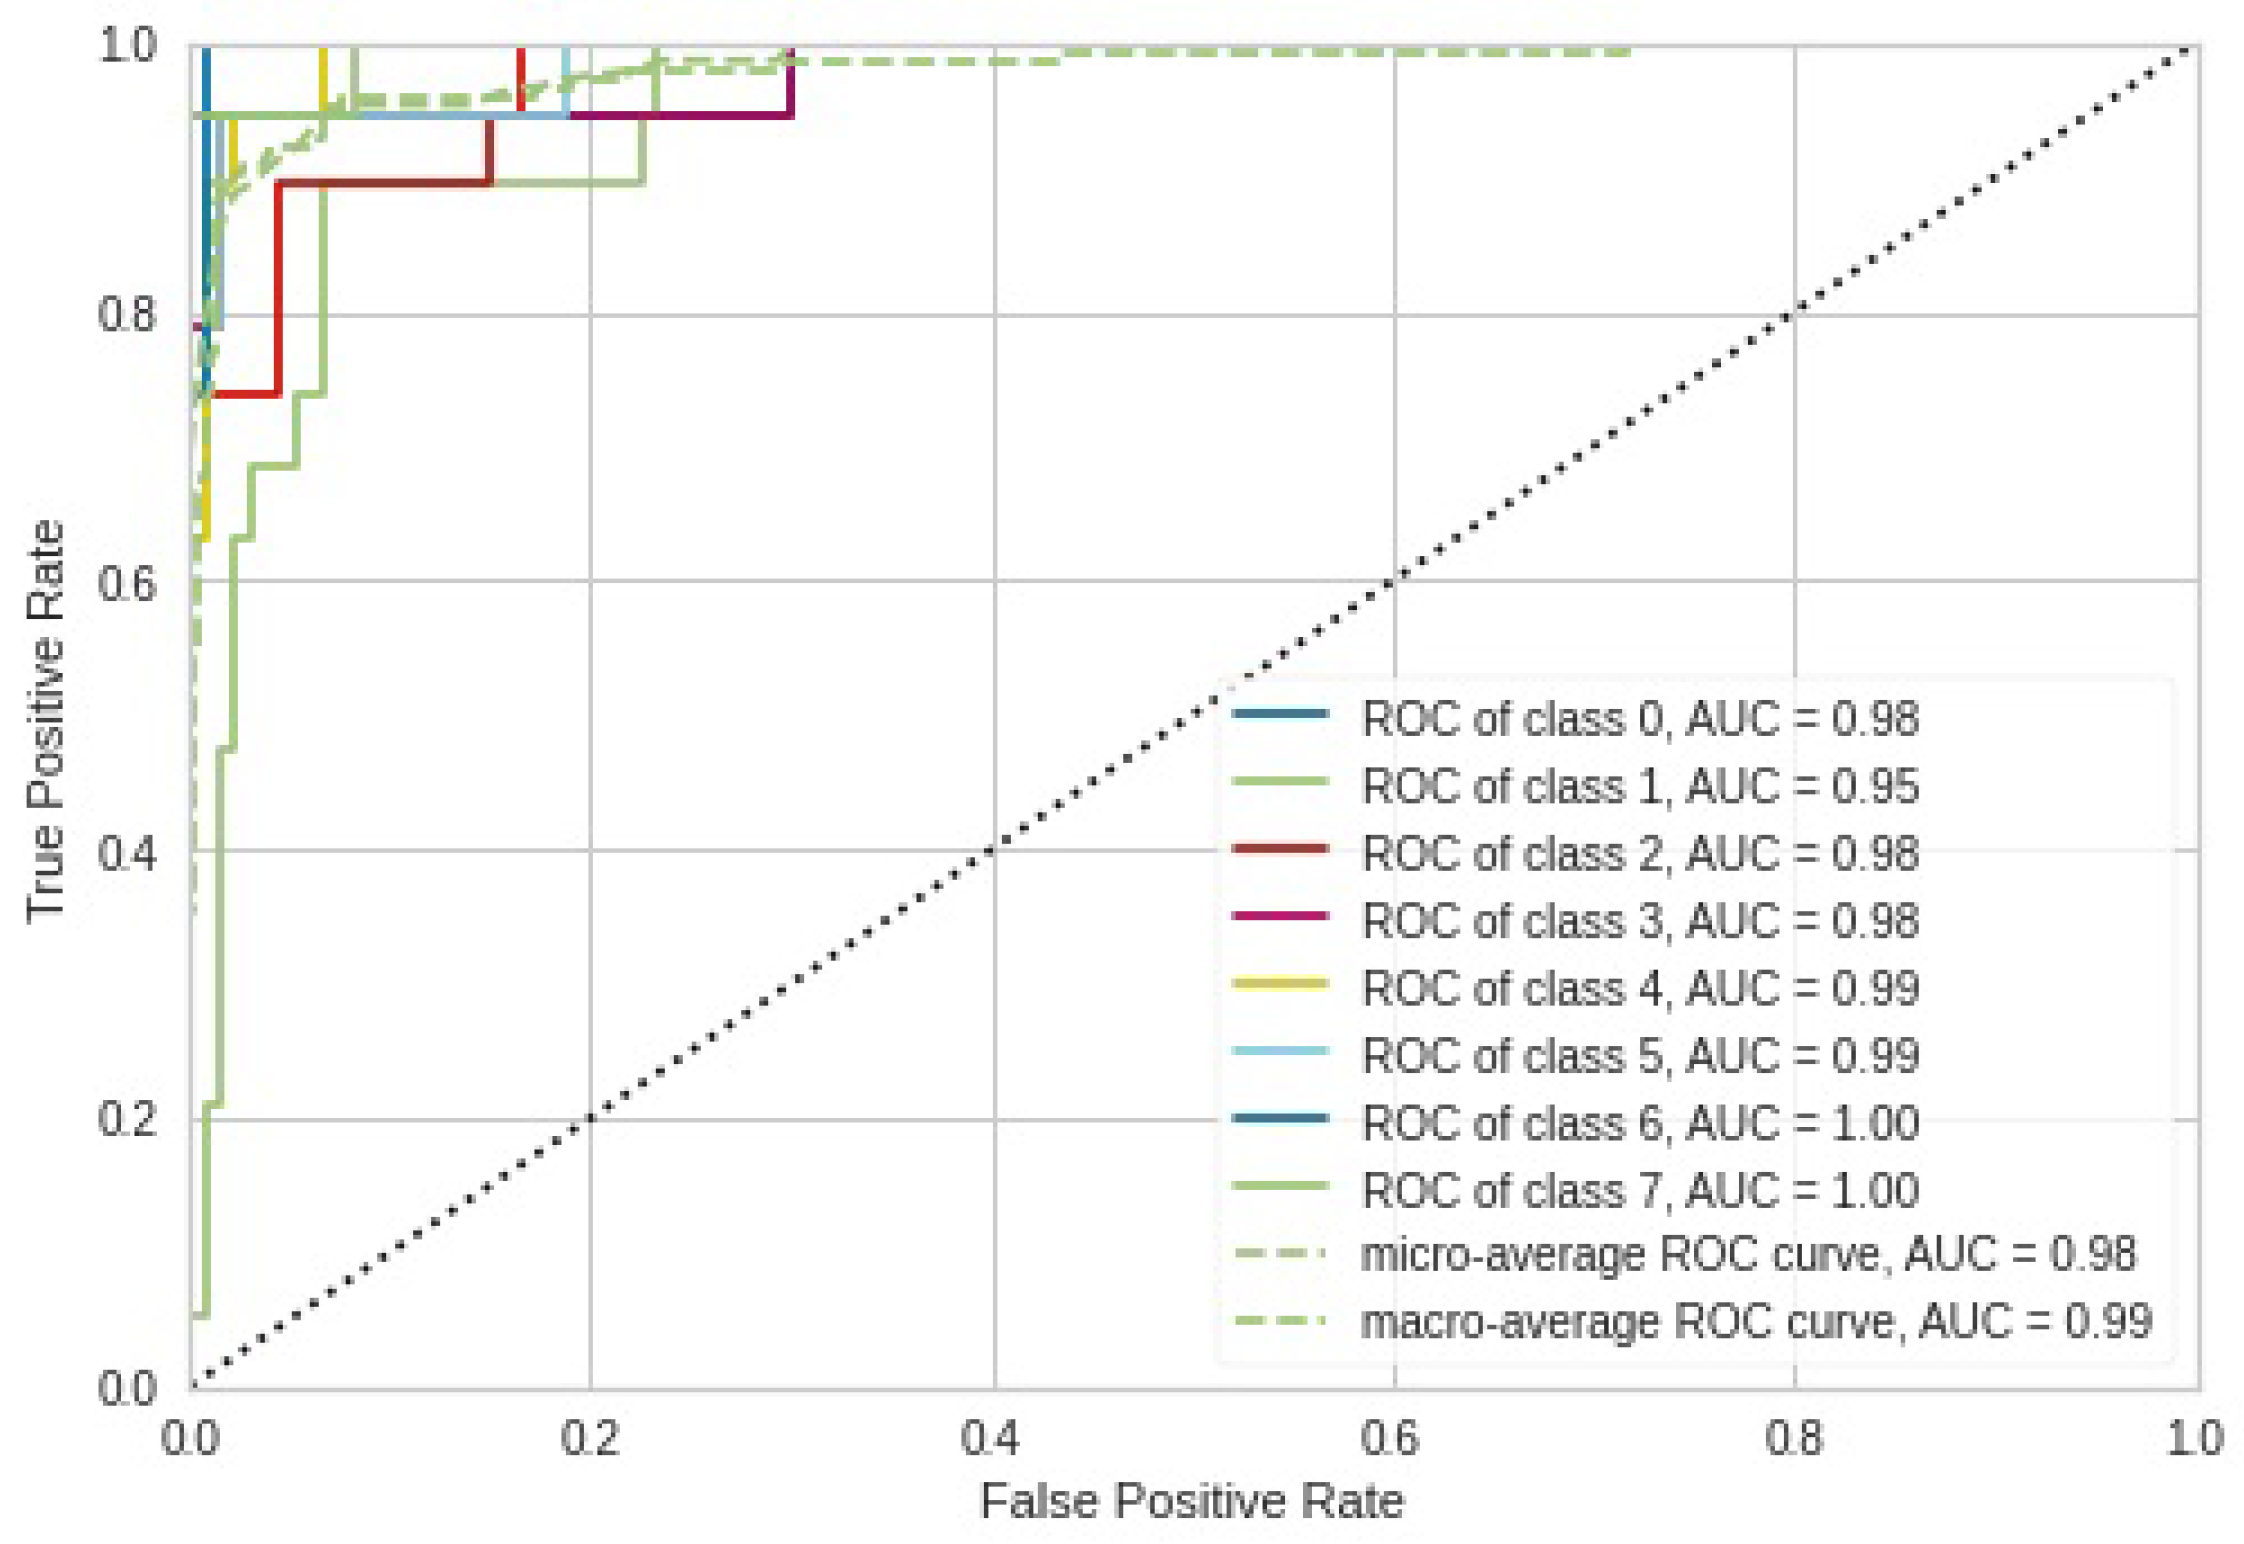
The confusion matrix of our ontological bagging approach in Figure 9 provides a better alternative to image classification, as evidenced by its ability to correctly classify all nineteen test images for classes 0, 4, 5, 6, and 7, despite the fact that class 5 received two additional test images from class 2. Only one test image was misclassified for classes 1 and 3. The corresponding ROC AUC curve (Figure 10) of our model produced a perfect match for classes 0, 3, 4, 5, and 7, i.e., the model managed to precisely distinguish between positive classes and negative classes. For all the classes, the model performed the worst for class 2, and this is consistent with the corresponding results from the confusion matrix, where four false-negative test images were recorded. Class 3 obtained a perfect match because one false-positive test image and one false-negative test image canceled each other out. In contrast to the confusion matrix results, class 5 did not produce a perfect match because there was an imbalance between false positives and false negatives, as the class received more false-negative test images than false-positive test images.
As illustrated in Figure 11, the RF-based model correctly classified all nineteen test images for classes 5 and 7. Only one test image for class 0 was misclassified into class 1. The RF model performed the worst for class 2, where seven test images were misclassified into other classes. The ROC AUC curves for the RF-based classifier presented in Figure 12 produced perfect matches for classes 0, 5, and 7. These results also go in tandem with the corresponding confusion matrix results in Figure 11. All the classes have ROC AUC values that are greater than 0.9, implying that the model performed better.
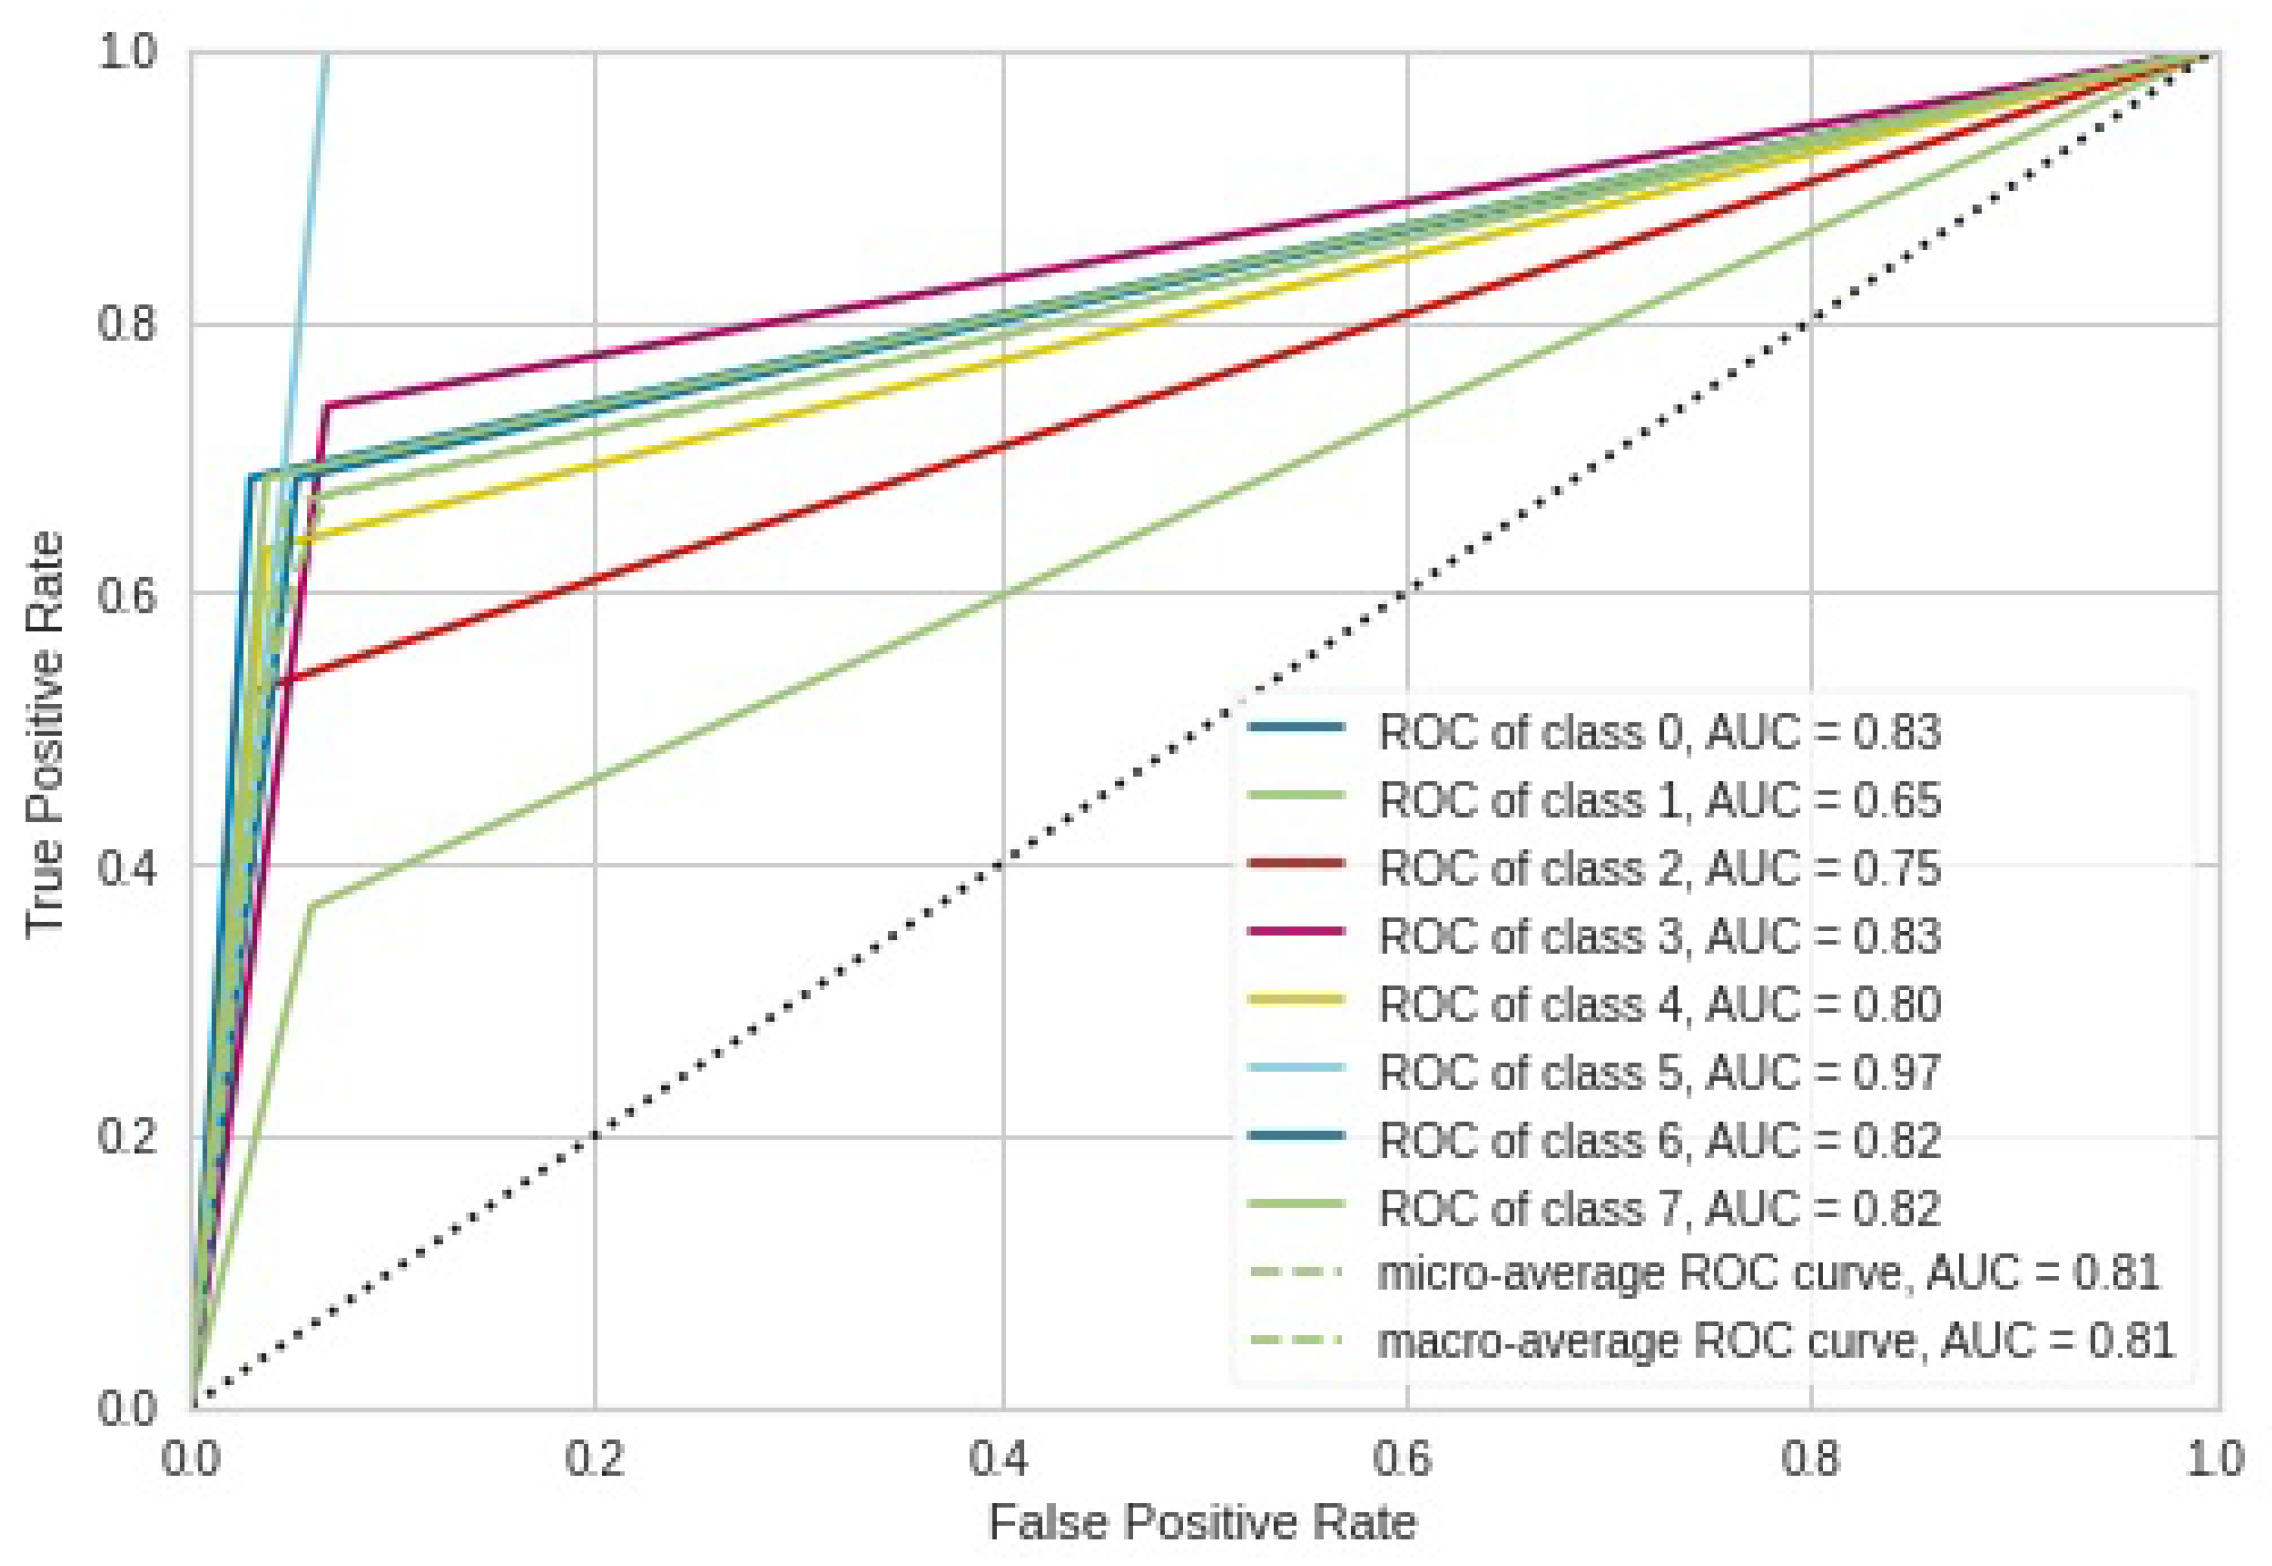
Overall, As shown in Figure 13, the decision-tree-based model registered the worst performance as compared to the other models for all the classes, except class 5, where all nineteen test images were correctly classified despite the fact that the same class received nine more test images from other classes. The corresponding ROC AUC curves for the decision tree in Figure 14 show that class 5 with its ROC AUC of 0.96 performed the best, and class 2 performed the worst with its ROC AUC of 0.75. This is also in line with the results obtained from the corresponding confusion matrix.
The confusion matrix of the SVM-based model presented in Figure 15 shows that a range of two to three test images out of nineteen was misclassified for classes 0, 1, 4, 5, 6, and 7. Class 2 had the worst performance with regard to the number of misclassified test images; five test images were misclassified into classes 1, 5, and 6. The associated ROC AUC curves of the SVM-based model in Figure 16 show that class 1 with its ROC AUC value of 0.95 performs the worst, as it registered fourteen false-positive test images.
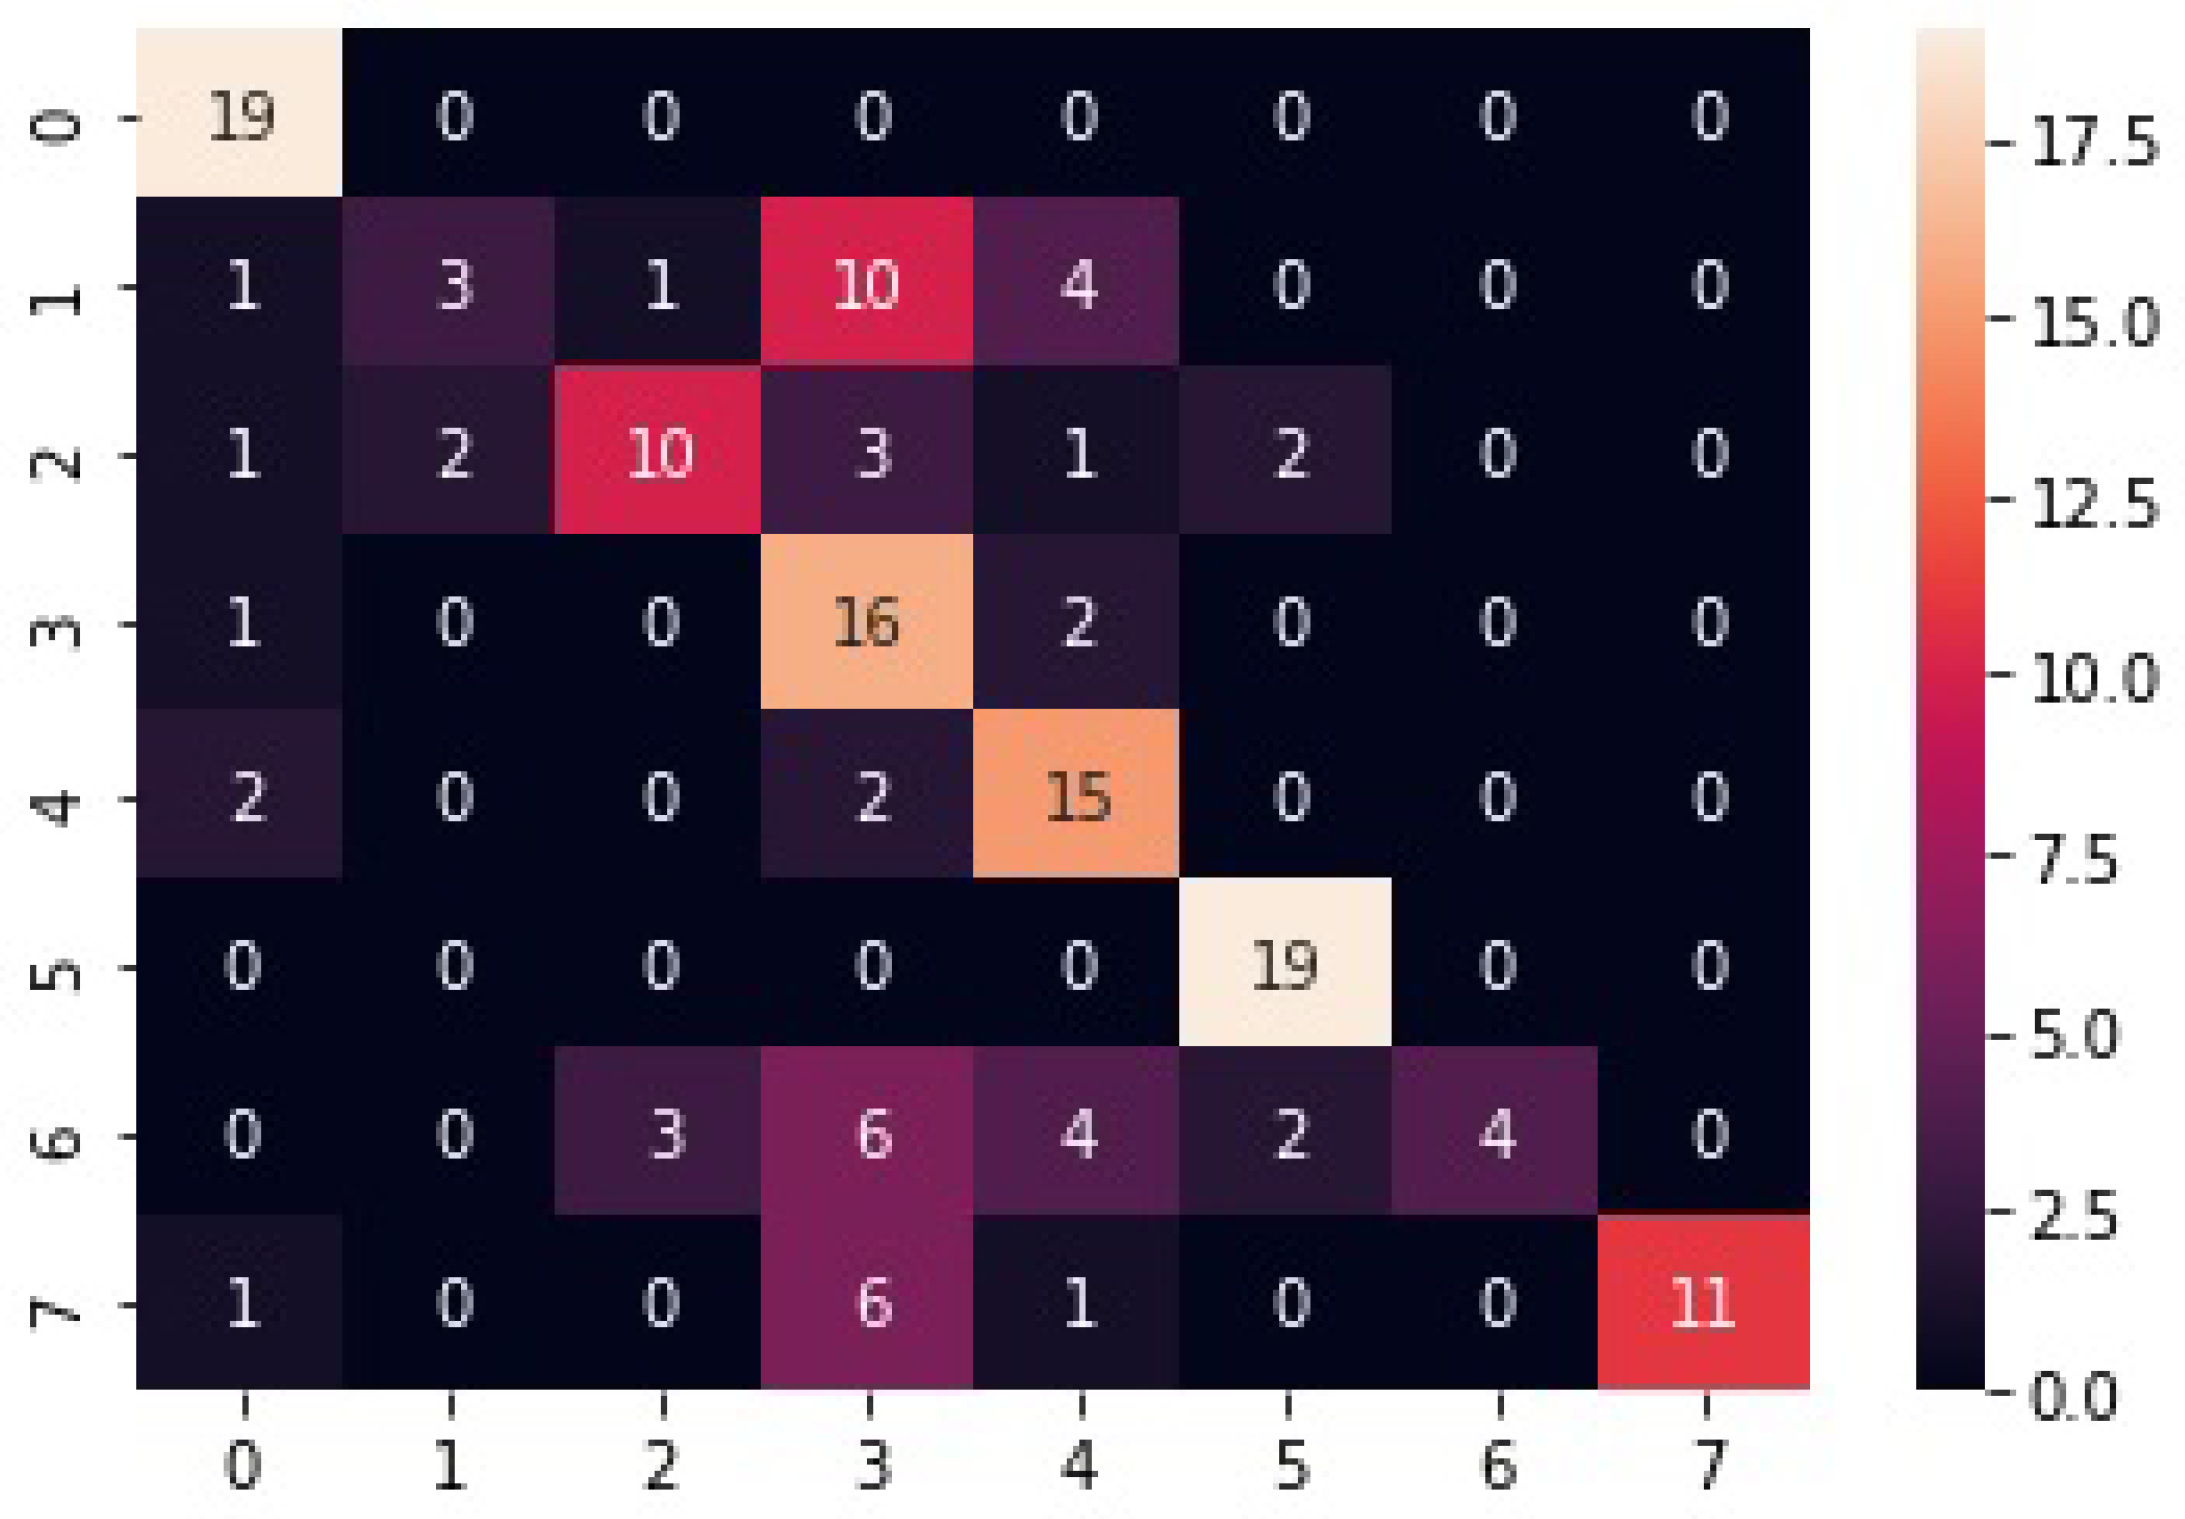
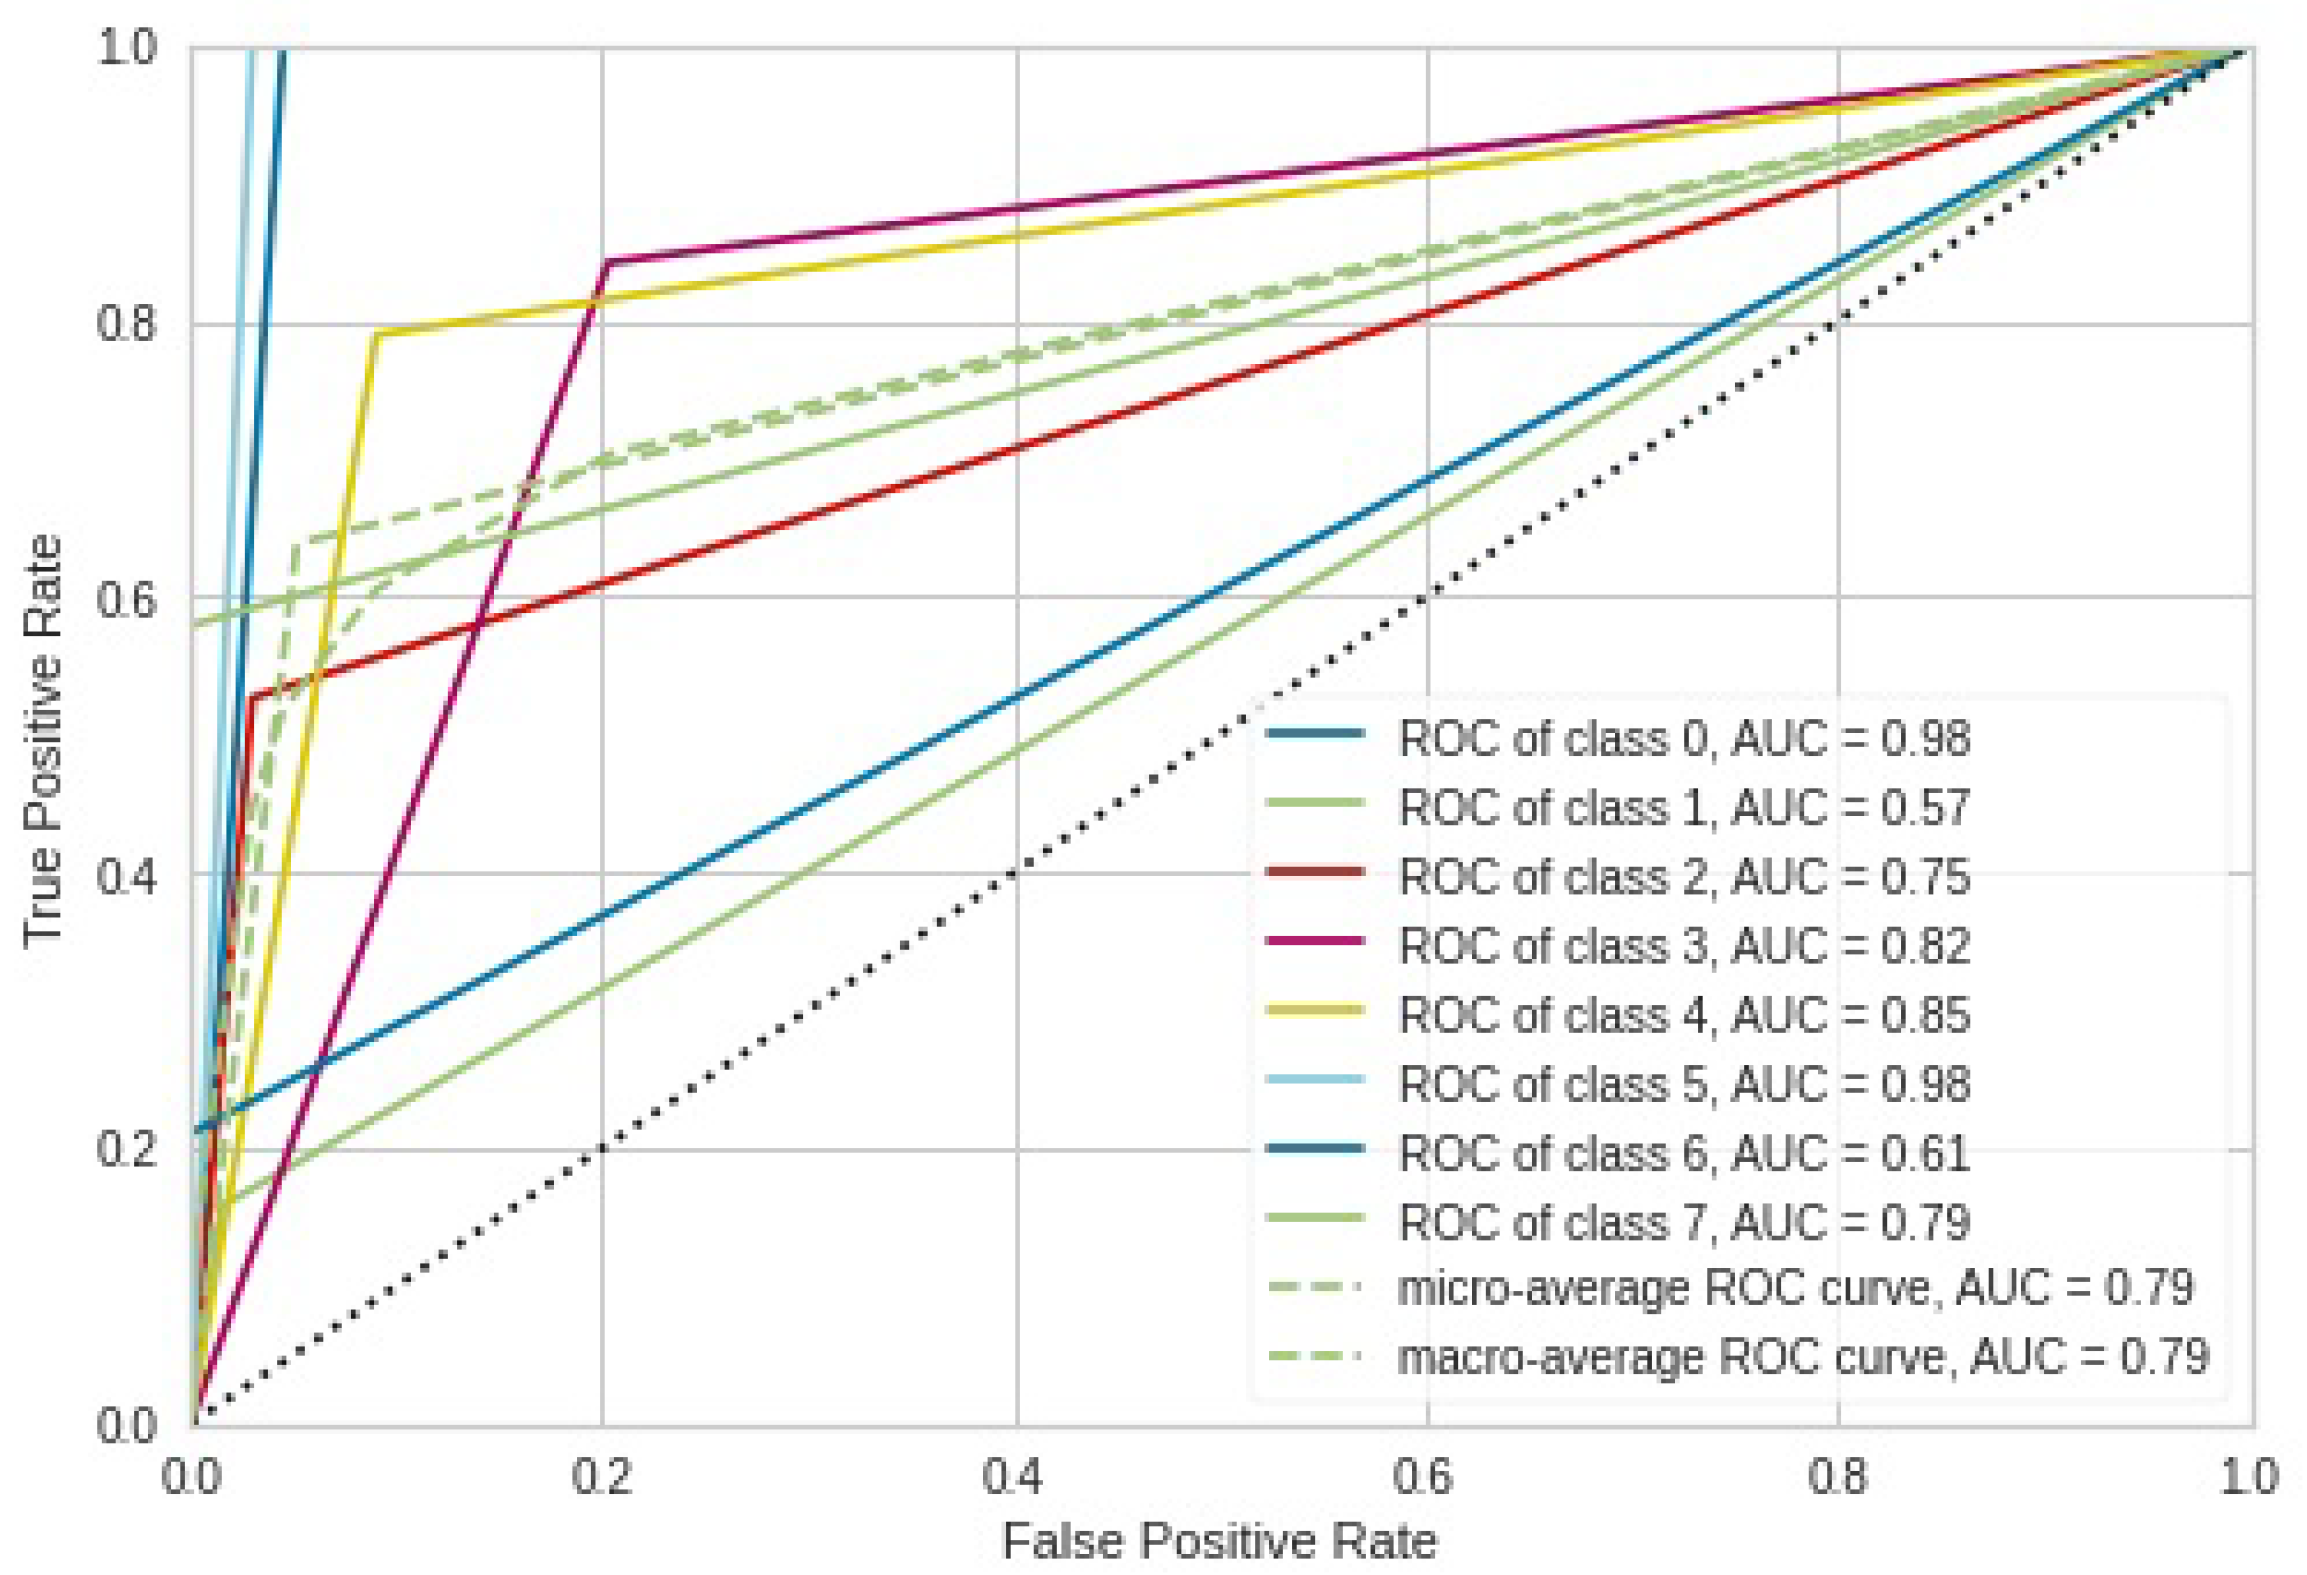
The GaussianNB-based model presented in Figure 17 classified all nineteen test images for class 0 and class 5 despite class 5 receiving four extra test images, two from class 2 and two from class 6, and class 0 receiving 6 extra test images from classes 1, 2, 3, 4 and 7. However, the GaussianNB under-performed in classes 1 and 6, misclassifying 16 and 15 test images, respectively. Most of the test images for class 1 were misclassified into class 3, implying that most degraded land images were mistakenly viewed as logged forest images. With reference to the ROC AUC curves presented in Figure 18, the GaussianNB-based model performed best for classes 0 and 5 and performed extremely poorly for class 2. These findings also go in hand with the confusion matrix results presented in Figure 17.
Table 6 shows that our proposed ontological bagging approach outperformed other classifiers in terms of accuracy, RMSE, and ROC AUC. The results also demonstrate that our model has the strongest predictive power as it managed to correctly classify 146 out of 152 test images, followed by SVM, which correctly classified 135 test images. Our model registered the lowest RMSE of 0.532, implying that the model’s predictions are much closer to the actual values as compared to other models. Alongside RF, our ontological bagging algorithm recorded the highest ROC AUC value of 0.99, meaning that the model did well in separating classes as compared to other models. GaussianNB performed the worst out of all the classifiers in terms of ROC AUC and accuracy and misclassified 55 test images into the wrong classes. The outright performance of our model is attributed to the adoption of semantic relationships between image categories for the classification process; additionally, the bagging concept helped to minimize the error propagation of classifiers.

9. Discussion

The evaluation of image classification results is of paramount importance in order to determine the best suitable model for a given application. Classification performance is dependent on the types of images used and the domain application. Images are generally categorized into remote sensing images, natural images, medical images, and synthetic images; therefore, the performance of image classification approaches varies according to the type of images used. It is possible that a particular algorithm produces good results in remote sensing images but poor results in synthetic images. For this study, image classifications based on an ontology with deep learning were obtained for natural forest images. The classes used for the study were grassland, orchards, bare land, degraded forest, woodlands, sea, buildings, and shrubs. The results presented in Table 2 show that the ontological bagging algorithm based on linear SVM outclassed other models with respect to RMSE and accuracy. The high accuracy is attributed to the ability of the model to suppress the error propagation of hierarchical classifiers. As presented in Table 7, our ontological-based model managed to outperform other models such as [11], which used ontology and an HMAX model to classify bird images into categories; ref. [1] for classifying vehicles into their respective categories; ref. [35] based on ontology and a CNN to classify natural images from an ImageNet dataset; and [36] for natural image classification through the transfer learning of images obtained from the Caltech-101 image dataset. However, the ontology-based classification model presented in [37] for classifying objects in urban and peri-urban areas slightly outperformed our model, with a classification score of 98%. A hybrid model of deep learning and SVM designed in [38] to perform image classification on the Fashion-MNIST, Cifar10, Cifar100, and Animal10 datasets also attained a classification accuracy of 99%. The reason could be attributed to the nature and quality of the image dataset generated by the data augmentation process used in the study.
10. Conclusions

The proposed model for classifying images in this study uses features extracted by an ensemble deep learning technique to train classifiers, and the training is based on the taxonomic relationships between categories. Metrics such as accuracy, RMSE, confusion matrix, and ROC AUC curves were used to evaluate the model’s performance.
Concepts related to image categories and the associated taxonomic relationship between them were both used to build the ontology. The ontology provided the graphical semantic information that describes the training images. Hypernym classifiers were trained recursively using features obtained from each super-image category. Lastly, the test images were classified into their respective classes by using both the hypernym and hyponym classifiers. It is noteworthy that the proposed model of harmonizing deep learning models and ontology obtained superior performance when compared to baseline methods. The ontological bagging approach can be used in the forestry domain to classify trees according to their species and to classify vegetation into different types and categories. Ontological bagging classification can also be used to categorize fruits into their respective classes in situations such as supermarkets and factories. In the future, it is recommended to employ high-resolution networks (HRNets) as an alternative to Xception, VGG16, and Resnet50. In fact, because of their ability to convert low-resolution representation to high-level representation, which is associated with efficient block architectures developed according to new standards, they are excellent for vision tasks, such as feature extraction, semantic segmentation, and object detection [40].

Author Contributions

Introduction and related work, J.V.F.-D. Model design, M.G. Implementation and discussion section, C.K. All authors have read and agreed to the published version of the manuscript.

Funding

This research received no external funding.

Institutional Review Board Statement

Not applicable.

Informed Consent Statement

Not applicable.

Data Availability Statement

The data that support the findings of this study are available on request from the corresponding author (C. Kwenda). The forest image dataset that was generated through the data augmentation process was obtained from [30,31]. The authors confirm that the data supporting the findings of this study are available within the article.

Acknowledgments

The authors thank the University of KwaZulu Natal for providing financial assistance in accessing all resources and tools required to undertake this study.

Conflicts of Interest

The funders had no role in the design of the study; in the collection, analyses, or interpretation of data; in the writing of the manuscript; or in the decision to publish the results.

References

  1. Xu, N.; Wang, J.; Qi, G.; Huang, T.S.; Lin, W. Ontological random forests for image classification. In Computer Vision: Concepts, Methodologies, Tools, and Applications; IGI Global: Hershey, PA, USA, 2018; pp. 784–799. [Google Scholar]
  2. Collin, C.A.; Mcmullen, P.A. Subordinate-level categorization relies on high spatial frequencies to a greater degree than basic-level categorization. Percept. Psychophys. 2005, 67, 354–364. [Google Scholar] [CrossRef] [PubMed]
  3. Griffin, G.; Holub, A.; Perona, P. Caltech-256 Object Category Dataset. 2007. Available online: https://resolver.caltech.edu/CaltechAUTHORS:CNS-TR-2007-001 (accessed on 2 September 2022).
  4. Fei-Fei, L.; Fergus, R.; Perona, P. Learning generative visual models from few training examples: An incremental bayesian approach tested on 101 object categories. In Proceedings of the 2004 Conference on Computer Vision and Pattern Recognition Workshop, Washington, DC, USA, 27 June–2 July 2004; p. 178. [Google Scholar]
  5. Shao, M.; Li, S.; Liu, T.; Tao, D.; Huang, T.S.; Fu, Y. Learning relative features through adaptive pooling for image classification. In Proceedings of the 2014 IEEE International Conference on Multimedia and Expo (ICME), Chengdu, China, 14–18 July 2014; pp. 1–6. [Google Scholar]
  6. Griffin, G.; Holub, A.; Perona, P. Caltech-UCSD Birds 200. 2010. Available online: https://resolver.caltech.edu/CaltechAUTHORS:20111026-155425465 (accessed on 2 September 2022).
  7. Biswas, S.; Chatterjee, S.; Majee, A.; Sen, S.; Schwenker, F.; Sarkar, R. Prediction of covid-19 from chest ct images using an ensemble of deep learning models. Appl. Sci. 2021, 11, 7004. [Google Scholar] [CrossRef]
  8. He, T.; Zhou, H.; Xu, C.; Hu, J.; Xue, X.; Xu, L.; Lou, X.; Zeng, K.; Wang, Q. Deep Learning in Forest Tree Species Classification Using Sentinel-2 on Google Earth Engine: A Case Study of Qingyuan County. Sustainability 2023, 15, 2741. [Google Scholar] [CrossRef]
  9. Ahmad, A.M.; Minallah, N.; Ahmed, N.; Ahmad, A.M.; Fazal, N. Remote sensing based vegetation classification using machine learning algorithms. In Proceedings of the 2019 International Conference on Advances in the Emerging Computing Technologies (AECT), Al Madinah Al Munawwarah, Saudi Arabia, 10 February 2020; pp. 1–6. [Google Scholar]
  10. Joseph, J.L.; Kumar, V.A.; Mathew, S.P. Fruit classification using deep learning. In Innovations in Electrical and Electronic Engineering, Proceedings of the ICEEE 2021, Torino, Italy, 2–3 January 2021; Springer: Berlin/Heidelberg, Germany, 2021; pp. 807–817. [Google Scholar]
  11. Filali, J.; Zghal, H.B.; Martinet, J. Ontology and hmax features-based image classification using merged classifiers. In Proceedings of the International Conference on Computer Vision Theory and Applications 2019 (VISAPP’19), Prague, Czech Republic, 25–27 February 2019. [Google Scholar]
  12. Filali, J.; Zghal, H.B.; Martinet, J. Comparing HMAX and BoVW Models for Large-Scale Image Classification. Procedia Comput. Sci. 2021, 192, 1141–1151. [Google Scholar] [CrossRef]
  13. Guo, Y.; Gu, S. Multi-label classification using conditional dependency networks. In Proceedings of the Twenty-Second International Joint Conference on Artificial Intelligence, Barcelona, Spain, 16–22 July 2011. [Google Scholar]
  14. Frome, A.; Corrado, G.S.; Shlens, J.; Bengio, S.; Dean, J.; Ranzato, M.; Mikolov, T. Devise: A deep visual-semantic embedding model. In Proceedings of the Advances in Neural Information Processing Systems, Lake Tahoe, NV, USA, 5–8 December 2013; Volume 26. [Google Scholar]
  15. Cisse, M.M.; Usunier, N.; Artieres, T.; Gallinari, P. Robust bloom filters for large multilabel classification tasks. In Proceedings of the Advances in Neural Information Processing Systems, Lake Tahoe, NV, USA, 5–8 December 2013; Volume 26. [Google Scholar]
  16. Cabral, R.; Torre, F.; Costeira, J.P.; Bernardino, A. Matrix completion for multi-label image classification. In Proceedings of the Advances in Neural Information Processing Systems, Granada, Spain, 12–15 December 2011; Volume 24. [Google Scholar]
  17. Griffin, G.; Perona, P. Learning and using taxonomies for fast visual categorization. In Proceedings of the 2008 IEEE Conference on Computer Vision and Pattern Recognition, Anchorage, AK, USA, 23–28 June 2008; pp. 1–8. [Google Scholar]
  18. Marszalek, M.; Schmid, C. Semantic hierarchies for visual object recognition. In Proceedings of the 2007 IEEE Conference on Computer Vision and Pattern Recognition, Minneapolis, MN, USA, 17–22 June 2007; pp. 1–7. [Google Scholar]
  19. Deng, J.; Ding, N.; Jia, Y.; Frome, A.; Murphy, K.; Bengio, S.; Li, Y.; Neven, H.; Adam, H. Large-scale object classification using label relation graphs. In Proceedings of the European Conference on Computer Vision, Zurich, Switzerland, 6–12 September 2014; Springer: Berlin/Heidelberg, Germany, 2014; pp. 48–64. [Google Scholar]
  20. Wu, J.; Yu, Y.; Huang, C.; Yu, K. Deep multiple instance learning for image classification and auto-annotation. In Proceedings of the IEEE Conference on Computer Vision and Pattern Recognition, Boston, MA, USA, 7–12 June 2015; pp. 3460–3469. [Google Scholar]
  21. Wang, J.; Yang, Y.; Mao, J.; Huang, Z.; Huang, C.; Xu, W. Cnn-rnn: A unified framework for multi-label image classification. In Proceedings of the IEEE Conference on Computer Vision and Pattern Recognition, Las Vegas, NV, USA, 27–30 June 2016; pp. 2285–2294. [Google Scholar]
  22. Aggarwal, S.; Gupta, S.; Gupta, D.; Gulzar, Y.; Juneja, S.; Alwan, A.A.; Nauman, A. An Artificial Intelligence-Based Stacked Ensemble Approach for Prediction of Protein Subcellular Localization in Confocal Microscopy Images. Sustainability 2023, 15, 1695. [Google Scholar] [CrossRef]
  23. Gulzar, Y. Fruit Image Classification Model Based on MobileNetV2 with Deep Transfer Learning Technique. Sustainability 2023, 15, 1906. [Google Scholar] [CrossRef]
  24. Mamat, N.; Othman, M.F.; Abdulghafor, R.; Alwan, A.A.; Gulzar, Y. Enhancing Image Annotation Technique of Fruit Classification Using a Deep Learning Approach. Sustainability 2023, 15, 901. [Google Scholar] [CrossRef]
  25. Hamid, Y.; Wani, S.; Soomro, A.B.; Alwan, A.A.; Gulzar, Y. Smart seed classification system based on MobileNetV2 architecture. In Proceedings of the 2022 2nd International Conference on Computing and Information Technology (ICCIT), Tabuk, Saudi Arabia, 25–27 January 2022; pp. 217–222. [Google Scholar]
  26. Filali, J.; Zghal, H.B.; Martinet, J. Ontology-based image classification and annotation. Int. J. Pattern Recognit. Artif. Intell. 2020, 34, 2040002. [Google Scholar] [CrossRef]
  27. Xi, E. Image classification and recognition based on deep learning and random forest algorithm. Wirel. Commun. Mob. Comput. 2022, 2022, 2013181. [Google Scholar] [CrossRef]
  28. Haq, M.A.; Rahaman, G.; Baral, P.; Ghosh, A. Deep learning based supervised image classification using UAV images for forest areas classification. J. Indian Soc. Remote Sens. 2021, 49, 601–606. [Google Scholar] [CrossRef]
  29. Tang, Y.; Feng, H.; Chen, J.; Chen, Y. ForestResNet: A deep learning algorithm for forest image classification. J. Phys. Conf. Ser. 2021, 2024, 012053. [Google Scholar] [CrossRef]
  30. Images, G. Forest. 2023. Available online: https://www.istockphoto.com/photos/forest (accessed on 2 January 2023).
  31. Punnet, B. Intel Image Classification Image Scene Classification of Multiclass. 1999. Available online: https://www.kaggle.com/datasets/puneet6060/intel-image-classification?resource=download (accessed on 30 August 2022).
  32. Chollet, F. Xception: Deep learning with depthwise separable convolutions. In Proceedings of the IEEE Conference on Computer Vision and Pattern Recognition, Honolulu, HI, USA, 21–26 July 2017; pp. 1251–1258. [Google Scholar]
  33. Qassim, H.; Verma, A.; Feinzimer, D. Compressed residual-VGG16 CNN model for big data places image recognition. In Proceedings of the 2018 IEEE 8th Annual Computing and Communication Workshop and Conference (CCWC), Las Vegas, NV, USA, 8–10 January 2018; pp. 169–175. [Google Scholar]
  34. He, K.; Zhang, X.; Ren, S.; Sun, J. Deep residual learning for image recognition. In Proceedings of the IEEE Conference on Computer Vision and Pattern Recognition, Las Vegas, NV, USA, 27–30 June 2016; pp. 770–778. [Google Scholar]
  35. Lei, J.; Guo, Z.; Wang, Y. Weakly supervised image classification with coarse and fine labels. In Proceedings of the 2017 14th Conference on Computer and Robot Vision (CRV), Edmonton, AB, Canada, 17–19 May 2017; pp. 240–247. [Google Scholar]
  36. Bansal, M.; Kumar, M.; Sachdeva, M.; Mittal, A. Transfer learning for image classification using VGG19: Caltech-101 image data set. J. Ambient. Intell. Humaniz. Comput. 2021, 14, 3609–3620. [Google Scholar] [CrossRef] [PubMed]
  37. Durand, N.; Derivaux, S.; Forestier, G.; Wemmert, C.; Gançarski, P.; Boussaid, O.; Puissant, A. Ontology-based object recognition for remote sensing image interpretation. In Proceedings of the 19th IEEE International Conference on Tools with Artificial Intelligence (ICTAI 2007), Patras, Greece, 29–31 October 2007; Volume 1, pp. 472–479. [Google Scholar]
  38. Tan, S.; Pan, J.; Zhang, J.; Liu, Y. CASVM: An Efficient Deep Learning Image Classification Method Combined with SVM. Appl. Sci. 2022, 12, 11690. [Google Scholar] [CrossRef]
  39. Abdollahpour, Z.; Samani, Z.R.; Moghaddam, M.E. Image classification using ontology based improved visual words. In Proceedings of the 2015 23rd Iranian Conference on Electrical Engineering, Tehran, Iran, 10–14 May 2015; pp. 694–698. [Google Scholar]
  40. Alzubaidi, L.; Zhang, J.; Humaidi, A.J.; Al-Dujaili, A.; Duan, Y.; Al-Shamma, O.; Santamaría, J.; Fadhel, M.A.; Al-Amidie, M.; Farhan, L. Review of Deep Learning: Concepts, CNN Architectures, Challenges, Applications, Future Directions; Springer International Publishing: Berlin/Heidelberg, Germany, 2021; Volume 8. [Google Scholar] [CrossRef]
Figure 1. Sample of different types of forest images used in this study.
Applsci 13 05060 g001
Figure 2. The Xception architecture [32].
Applsci 13 05060 g002
Figure 3. Building block of residual learning [34].
Applsci 13 05060 g003
Figure 4. Ontology of Forest Types.
Applsci 13 05060 g004
Figure 5. The proposed model.
Applsci 13 05060 g005
Figure 6. Classification using merging classifiers.
Applsci 13 05060 g006
Figure 7. kNN-based confusion matrix.
Applsci 13 05060 g007
Figure 8. ROC AUC Curves for kNN model-based classifier.
Applsci 13 05060 g008
Figure 9. Ontological-bagging-based confusion matrix.
Applsci 13 05060 g009
Figure 10. ROC AUC Curves for ontological-bagging-based classifier.
Applsci 13 05060 g010
Figure 11. Random-forest-based confusion matrix.
Applsci 13 05060 g011
Figure 12. ROC AUC Curves for Random-Forest-based classifier.
Applsci 13 05060 g012
Figure 13. Decision-tree-based confusion matrix.
Applsci 13 05060 g013
Figure 14. ROC AUC Curves for Decision-tree-based classifier.
Applsci 13 05060 g014
Figure 15. Support-Vector-Machine-based confusion matrix.
Applsci 13 05060 g015
Figure 16. ROC AUC Curves for Support-Vector-Machine-based classifier.
Applsci 13 05060 g016
Figure 17. Gaussian-naive-Bayes-based confusion matrix.
Applsci 13 05060 g017
Figure 18. ROC AUC Curves for Gaussian-naive-Bayes-based classifier.
Applsci 13 05060 g018
Table 1. Forest type image dataset distribution.
Training ImagesTesting ImagesClass
10019Grassland
10019Woodland
10019Orchards
10019Bare land
10019Logged forests
10019Degraded land
10019Sea
10019Buildings
Table 2. Data Augmentation Properties.
PropertyValue
rotation range45
width shift range0.2
height shift range0.2
zoom range0.2
horizontal flipTrue
fill modereflect
Table 3. Class labels.
Numerical ValueClass
0Buildings
1Degraded land
2Grassland
3Logged forests
4Orchards
5sea
6Shrubs
7Woodlands
Table 4. Hardware and software specifications for the experiment.
HardwareSoftware
Processor: core i5 2.2 gigahertzProgramming language: Python version 3.9
RAM: 32 gigabytesOWLReady: under the GNU LGPL licence v3
Graphical Processing Unit (GPU)Backend: Tensorflow GPU
Hard drive: 500 gigabytesDeep learning API: Keras GPU
NDVIDIA, 16 gigabytes RAM
Table 5. Accuracy and RMSE scores of the proposed model against baseline models such as kNN, GaussianNB, SVM, RF, and decision trees.
ModelRMSEAccuracy
kNN model1.5300.816
GaussianNB model1.6780.638
SVM model1.0480.888
RF model1.0940.862
Decision tree model2.0900.625
Ontological bagging model0.5320.961
Table 6. Quantitative comparison of models.
ModelTest ImagesCorrectly ClassifiedMisclassifiedROC AUCRMSEAccuracy
kNN152124280.971.5300.816
Ontological Bagging15214660.990.5320.961
RF152131210.991.0940.862
Decision Tree15298540.812.0900.645
SVM152135170.981.0480.888
GaussianNB15297550.791.6780.638
Table 7. Accuracy obtained from other models.
ModelAccuracy
Ontology and Hmax model [11]63%
Ontological random forest [1]55%
Ontology and CNN [35]67.27%
Deep learning model [36]93.73%
Ontology and bag of visual words [39]59%
Ontological-based model [37]98%
Efficient deep learning combined with SVM [38]99%
Ontological bagging algorithm based on linear SVM96%
Disclaimer/Publisher’s Note: The statements, opinions and data contained in all publications are solely those of the individual author(s) and contributor(s) and not of MDPI and/or the editor(s). MDPI and/or the editor(s) disclaim responsibility for any injury to people or property resulting from any ideas, methods, instructions or products referred to in the content.