Abstract
Diatoms are one of the main species of interest due to their possible impact on the maintenance of ecosystems, as well as their photosynthetic capacity and biotechnological applications. Reliable, easy, rapid identification of diatoms remains a highly desirable goal to avoid the difficulty for experts in the visual analysis of frustules; a method commonly used to compare the distinctive traits of diatoms, such as ornaments and the marks from images taken by optical and electronic microscopy for identification. This study proposed three simple morphometric methods based on fractal dimension measurements in conjunction with 2D cross-correlation parameters to analyze diatom images. This novel approach demonstrates the differentiation feasibility between a wide variety of diatom species with heterogeneity in their structures and shapes, which could possibly expand the application of this preprocessing process for the identification of new types of images or other biological species.
1. Introduction
Diatoms (Bacillariophyceae) are microscopic photosynthetic algae that grow in freshwater or saltwater environments but are rich in dissolved silica. Volcanic activity is a decisive factor for dissolved silica in a body of water. The frustule or skeleton of diatoms is composed of opaline or biogenic silica (comprised of two shells = “valves,” joined by parallel overlapping strips of silica = “copulae”) and serves as a morphological synapomorphy to define the clade [1]. It is symmetric in shape, with a large proportion of voids, decorated with a unique pattern of nanometer-sized features (pores, channels, spines). The most common forms are cylindrical, spherical, or circular discs; with dimensions between 1 and 500 microns. Diatoms are part of the phylum Ochrophytas, from the Chromista kingdom [2,3]. It is one of the most diverse eukaryotic algae. There are more than 200 genera of living diatoms [4], with an overall number of around 200,000 species having complex variability in dimensions and shapes [5]. Most live pelagically in fresh and marine water, wastewater, rivers, and oceans, although some live at the water-sediment interface (benthic) as surface films or even under damp atmospheric conditions [4].
Taken together, the diatoms constitute the most abundant group of marine eukaryotic phytoplankton. They are essential for both nutrient cycling and for the leading primary producers of the tropic chains in aquatic ecosystems (accounts for >40% of global primary productivity, which is equivalent biomass to that of all tropical rain forests on earth) [4,6,7]. Moreover, diatoms play important roles in the marine ecosystem; they are fundamental in carbon fixation from the atmosphere and 20% oxygen production [5,8,9] and emit a wide range of chemically active trace gases, including dimethyl sulfide, organohalogens, and volatile isoprenoids [10]. As a primary producer in the marine ecosystem, as a significant carbon carrier to the deep ocean is one of the major components of the so-called biological carbon pump, and additionally as a significant source of petroleum deposits [4].
Evolutionarily, diatoms were derived from a secondary endosymbiotic event, which occurred between an unknown eukaryotic cell and a red alga. In this process, the diatom acquired genes from two eukaryotic genomes. In addition, there is an increasing body of evidence that suggests the occurrence of a considerable level of horizontal gene transfer among marine organisms [11,12]. Such an evolutionary background renders algae a “melting pot” of genes and provides them with a particular opportunity to evolve new gene and metabolic networks [13]. Despite this fact, a large number of diatom proteins are shared by many groups of photosynthetic eukaryotes, namely red alga, green plant, and cyanobacterium, and many of them are likely involved in chloroplast functions [4].
Currently, the interest in and biotechnological uses of microalgae in the agri-food and pharmaceutical fields are increasing [14,15]. It is due to the importance of these species in the ecosystem’s maintenance, as well as their photosynthetic capacity and to produce active metabolites. Furthermore, the diversity of diatoms represents a variety of environments because they are used to estimate the integrity of ecosystems and assess eutrophication and water quality [16,17]. Likewise, diatoms are used in other applications such as forensic analysis for location estimates, exploration of oil reserves, silica biomineralization [17,18], biofuel production, drug delivery systems, analytical tools, biosensors and nanomaterials and nanoparticles. However, diatoms also have other fascinating applications in environment monitoring, animal feed, and aquaculture, which indeed have a considerable potential considering climate change and the devastating impacts of globalization on ecology and environment [5].
These species are found grouped in colonies or unicellular form. Additionally, they can be reproduced in a sexual or asexual way. In addition, diatoms are characterized by having a silica capsule (frustule) that allows them to be preserved as microfossils [3,19]. The frustule has rounded or elongated shapes and bilateral or radial symmetry, and they are formed by two valve faces or theca (epitheca and hypotheca) joined at their margins. They can be pinnate; some have a central longitudinal groove named “the raphe,” which forms stigmas [3]. The frustules have ornaments and mark often used as distinctive features for their classification [20,21]. In the theca, they have regular or irregular striae (stigmas), and they can also present pores or chambers and thin transverse ribs [3].
Common methods for the physical classification of diatoms are based on optical microscopy, which uses quantitative and qualitative morphological traits for their identification [21]. Through optical microscopy, Campo determines the length and width of the frustules, the density of striae, symmetry and the presence or absence of raphe and ornaments [20,22], followed by other characteristics, such as ultrastructure, sexual reproduction, and the development of auxospores [23]. Other methods, such as electron microscopy and DNA sequence analysis, allow better differentiation between species with similar morphology or homoplastic [22], the combination of morphological, molecular, and chemical data, referred to as the polyphasic or integrative approach [23]. Additionally, molecular techniques are used by the diatom’s identification through the sequence amplification and analysis of the 18S ribosomal RNA gene, the large subunit of RuBisCO rbcL gene and psb C, being the metagenomic analysis, a fundamental approach to understanding better the diversity of these species [1,24], another approach is the untargeted UPLC-HR-MS/MS metabolomic approach, used for detection of key biomarkers and particularly, metabolic fingerprinting has been shown to be a promising method in the classification and taxonomy of filamentous fungi, yeast and microalgae. Secondary metabolites profiling has a high differentiation at order, genus and species levels in seaweeds [25], microalgae [26] and diatoms [23]. However, despite efficient molecular and biochemical methods, morphological identification cannot be ruled out because it provides essential and more accessible information. Therefore, there is interest in creating AI algorithms or using machine learning techniques that could rapidly and efficiently determine internal and external specific traits of microalgae rapidly and efficiently [27]. Bioprospecting and multiple uses of diatoms generate the need to develop new rapid, sensitive, and inexpensive identification methods. Methodologies using neural networks have been published, in the case of Yong-Zheng et al., four algorithms with relatively balanced complexity and accuracy among deep learning image classification algorithms for automatic diatom recognition; the inception-dependent model was more accurate; this has stronger directivity and targeting in feature extraction of diatom and the best performance on diatom identification [28].
A fractal dimension is an index for characterizing fractal patterns or sets by quantifying their complexity as a ratio of the change in detail to the change in scale. Several types of fractal dimensions can be measured theoretically and empirically. Fractal dimensions are used to characterize a wide spectrum of objects ranging from abstract to practical phenomena, including turbulence river networks, urban growth, human physiology, medicine, and market trends [29,30,31]. Cross-correlation is a measure of the similarity of two series as a function of the displacement of one relative to the other and this is used in signal processing. This is also known as a sliding dot product or sliding inner product. In statistics, cross-correlation is sometimes used to refer to the covariance cov(X, Y) between two random vectors X and Y. In signal processing, cross-correlation (or sometimes called “cross-covariance”) is a measure of the similarity between two signals, often used to find relevant features in an unknown signal by comparing it with a known signal. It has applications in pattern recognition, single particle analysis, electron tomography, averaging, cryptanalysis, and neurophysiology.
Deep learning and convolutional neural networks (CNN) are becoming extensively used techniques for image classification in a variety of problems. The use of this methodology in the classification of diatoms has been to demonstrate whether it is suitable for solving the classification problem [32].
In this manuscript, we propose three simple morphometric methods based on measurements of fractal dimension and 2D cross-correlation parameters to analyze diatoms images and thus achieve a correct identification. This novel approach demonstrates the differentiation feasibility between diatoms species with a wide variety of structures and shapes, which can also function as an image data pretreatment tool.
2. Materials and Methods
2.1. Diatom Images
Fifty focal planes (standard focus) images of diatoms were obtained from the database ADIAC, website link: https://websites.rbge.org.uk/ADIAC/db/adiacdb.htm (accessed on 24 December 2021) [33]. These fifty images were previously selected due to both the availability in the database and the wide geometrics heterogeneity shown in Figure 1.
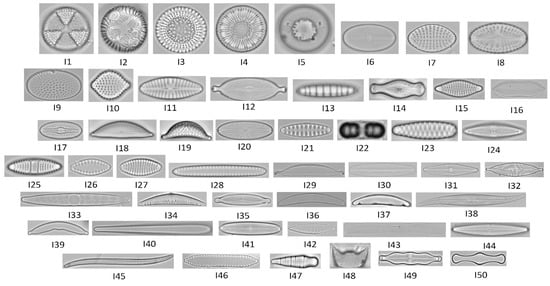
Figure 1.
Diatom images for each species taken by optical microscopy from ADIAC diatoms image database.
The scientific name and codification number for each diatom’s species are represented in Table 1.

Table 1.
Scientific names and codification numbers from each diatom species selected.
2.2. Fractal Dimension Analysis
For the images analysis, the Fractal Dimension (Nf) was calculated by the Hausdorff method [34] (Box-Counting) [35]. The Nf is an indicator of the geometry complexity from structural patterns, in this case, diatoms morphology. This statistical index is a comparison measurement of how the detail in a pattern change with the scale. This algorithm was obtained from the file exchange website on MATLAB® [36], and it was applied to the different diatoms images used in this study.
The Hausdorff dimension or Hausdorff-Besicovitch dimension is a metric generalization of the concept of the dimension of a topological space, which allows defining a fractional (not integer) dimension for a fractal object.
2.3. Power Spectra Analysis
Power spectrum analysis is a technique commonly used by tuning software and applies a fast Fourier transform (FFT) to the variation in a particular signal to compute its frequency spectrum. The result is presented as a plot of signal power against frequency and is referred to as its power spectrum. The result is presented as a plot of signal power against frequency and is referred to as its power spectrum. The power spectrum of a signal indicates the relative magnitudes of the frequency components that combine to make up the signal.
In MATLAB®, the FFT function computes the Fourier transform using a fast Fourier transform algorithm. Use FFT to compute the discrete Fourier transform of the signal. y = fft(x); plot the power spectrum as a function of frequency.
2.4. Two-Dimensional Cross-Correlation
Cross-correlation is a common signal processing used as a similarity measure through the comparison between time series as a function of the displacement of one with respect to the other. However, this signal processing must be applied to compare two images [37], in this case, called “2D-cross-correlation” (CC) [38]. In this study, the CC was used to find similarities between two images, comparing one diatom image with the same image modified by symmetry operations and between two different diatom images.
2.5. Software
The image processing, such as grayscale conversion, binary image, center image, and power spectrum; and calculation of Nf, CC and other parameters were achieved through MATLAB™ software (R2011b v.7.13; The MathWorks, Inc., Natick, MA, USA).
3. Results and Discussion
3.1. Self-Similarity and Symmetry
Most of the self-similarity from the natural structures occurs only at a finite number of stages with certain imperfections [39]. In fact, it is unlikely that a smaller cluster could be exactly the same as a larger cluster, i.e., the self-similarity is approximate [40]. Two parameters were considered in order to measure de self-similarity: Nf and the projection (θ).
The projection (θ) is a parameter calculated from two CC using Equation (1); the first CC is measured for the same image with and without a symmetry operation (plane of rotation), and the second CC is measured for the same image itself without symmetry operation, it is named autocorrelation (CCauto). The Nf parameter was calculated by the Hausdorff Box-Counting [34], which is widely used in biological systems [41] and θ was calculated as shown in the following equation:
where, I is the diatom image, Im is the diatom imagen with the symmetry operation, CC[I,Im] is the CC calculated between I and Im, and CCauto[I] is CC calculated for I (where the CC matrices became vectors). Basically, the projection between these two vectors is obtained by the dot product divided by the product of the norms of these.
If CC[I,Im] is exactly equal to CCauto[I], the θ value is zero indicating that the symmetry operation is typical of the image. However, in natural or biological structures it is not possible because there is always some imperfection. Therefore, the values of θ could be approximately zero or close to zero which indicates a high symmetry with respect to the operation. If the value of θ is ninety or close to ninety, it indicates a low symmetry for the operation.
Three symmetry operations to calculate θ were used: a reflection in the vertical plane (PSv), a reflection in the horizontal plane (PSo) and a rotation of 180 degrees (R180). All the preprocessing steps to calculate θ are outlined in Figure 2. For each symmetry operation was necessary the complete preprocessing steps, i.e., a θ value was obtained for each symmetry operation.
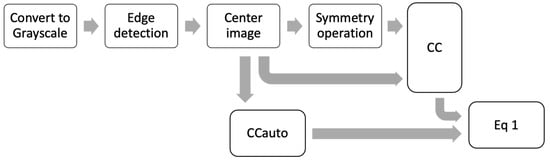
Figure 2.
Scheme of all preprocessing steps to calculate θ.
In Figure 2, the first step is to convert the image to grayscale, followed by a Canny Edge detection to generate an outline image. Next, this outline image is centered. Then, the CCauto is calculated, and at the same time, one of the three symmetry operations is applied, followed by the calculation of CC. Finally, the matrices CCauto and CC are converted to vectors in order to find the projection with Equation (1).
Two diatom images, I3 and I34, were used how examples using all the preprocessing steps to calculate the θ projection (see Figure 3a,b, respectively). Figure 3 shows the original images after edge detection and centering (B), and each symmetry operation applied (PSv, R180, PSo) for the two diatom images. Moreover, the CC for each symmetry operation is shown in Figure 3a,b (see blue circles in the bottom left), where the red line represents the CCauto for each image (I3 and I34). Additionally, three lineal correlation plots for the CCauto vs. CC calculated for each symmetry operation are shown in Figure 3a,b (bottom right). Lastly, the Nf and θ values are reported on the top right of Figure 3a,b.
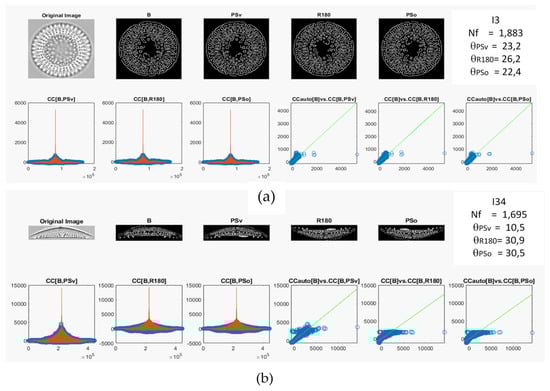
Figure 3.
Calculated 2D cross-correlation and preprocessing steps using symmetry operations from the (a) imagen I3 and (b) imagen I34. The red lines are the CCauto.
Figure 4a–c represents the polar plots of the Nf and θ parameters for all diatom images selected, where Nf was designated strategically as the radius and θ as the polar variable. This polar plot shows the difference in self-similarity for the diverse diatoms images after the symmetry operations were applied. From Figure 4a–c, the applied symmetry operations were PSv, R180, and PSo, respectively. Nevertheless, a complete separation between the diverse species of diatoms could not be achieved in each of the polar plots. It is indicative of a poor ability to differentiate. Therefore, combining the parameters in new variables was necessary, which could increase the differentiation of the diatom’s species. For this, a reduction of the dimensionality of the variables was generated through a Principal Component Analysis (PCA), as shown in Figure 4d. In this case, two Principal Components (PC) have been extracted with eigenvalues greater than or equal to 1.0. Together, they explain 85.1% of the variability in the original data. The first Principal Component (PC1) has a 55% variability with an eigenvalue of 2.2, and the second Principal Component (PC2) has a 30% variability with an eigenvalue of 1.2. Therefore, these are the most significant principal components, being able to discriminate between diatom species, as evidenced in Figure 4d.
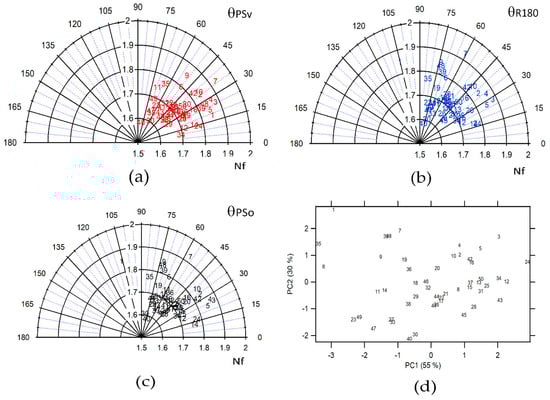
Figure 4.
Polar plot for all the diatom images where the radius is Nf and the angle is the projection for each symmetry operation (a) PSv, (b) R180, (c) PSo and (d) score plot PC 1 vs. PC2 for all diatoms images using Nf, and projection parameters.
The combination of the Nf parameter with the self-similarity describes the space of morphological differences of diatoms. Nf in geometry whose basic structure, fragmented or irregular, is repeated at different scales. Those diatoms whose dimension is fractional are easily differentiated from those that do not with this type of parameter. The fact that the diatom has self-similarity means that it can be easily measured in the case of fractional similarity; the fractal is the appropriate parameter.
3.2. Power Spectrum in the Self-Similarity and Symmetry
The preprocessing steps presented in Figure 2 only allow evaluating a symmetry rotation at 180° in the image (R180), where other applied rotations generate a different CC size than CCauto. For that reason, it is impossible to calculate the projections because the dimensions of the vectors are different. Furthermore, the centering of the image is critical in the θ calculation. Because of this, new preprocessing steps were proposed (see Figure 5). Where the image is resized to a square image (254 × 254) in order to match the dimension of the vector found with and without the symmetry operation (CC) to CCauto, and the power spectrum (PW) is determined by 2-D Fast Fourier Transform with a shift zero-frequency component to the center of the spectrum. Most of the information is obtained from the contrast image, whereby a grayscale preprocessing is applied before finding the PW [42].
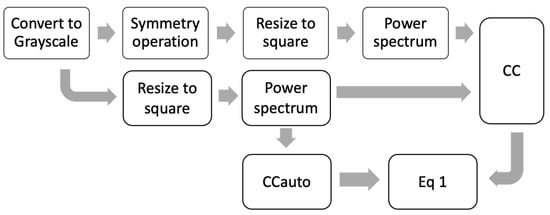
Figure 5.
Scheme preprocessing steps using power spectrum to calculate θ.
This PW preprocessing allows us to explore other symmetry operations, such as rotations in small angles of 90°, 60°, and 45°. Figure 6a shows the projection values for each symmetry operation. In this case, the symmetry operations used above (Psv, PSo, and R180) generated θ ranges lower than those for range for the preprocessing steps used in Figure 4. It is because the CC calculated for the images on the frequency scale is better aligned than the CC calculated in the spatial scale. The range for the smallest angle rotation (R90, R60, and R45) is higher than the other symmetry operation. The diatoms with the highest symmetry (see the first five diatoms images in Figure 1) have θ values close to zero, regardless of the operation applied, which is expected for structures with high symmetry similar to a disk. On the other hand, a PCA using Nf and projections parameters for all symmetry operations (see Figure 6b) shows discrimination for diatom’s species, classified by their similarities in structural geometry. Additionally, an analysis of the loading was conducted (see inset plot in Figure 6b), where it is evidenced that the symmetry operations that have the biggest contribution to the correct differentiation between diatoms species. The PSo operation shows a poor contribution in comparison with the other operations as R90, R60, R45, R180 and PSv, and the Nf parameter.
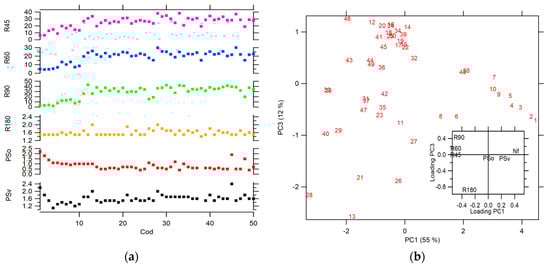
Figure 6.
(a) Projection for each symmetry operation (b) score plot PC 1 vs. PC2 for all diatoms images using Nf, and projections parameters, inset: loading plot of PC1 vs. PC2.
3.3. CC between Diatoms
One final preprocessing process was proposed using the CC between diatoms to calculate θ. As is shown in Figure 7, two diatom images are needed for the CCauto and CC to be calculated. The images are converted to grayscale, resized (254 × 254), and the PW is preprocessed. Basically, this preprocessing process is used to determine the similarity between two images.
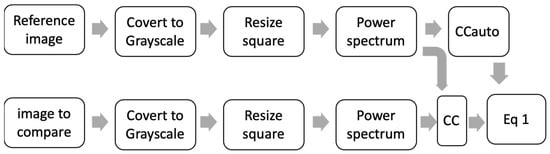
Figure 7.
Scheme preprocessing steps using CC between diatoms to calculate θ.
The similarity between diatoms is shown in a heat map in Figure 8. The heat map was generated θ between all the previously selected diatoms where red represents a poor similarity and blue color a high similarity. The central line value is zero indicating total similarity; higher zero values θ were found for any pair of diatoms; this shows that the θ parameter suggests a good differentiator between diatoms.
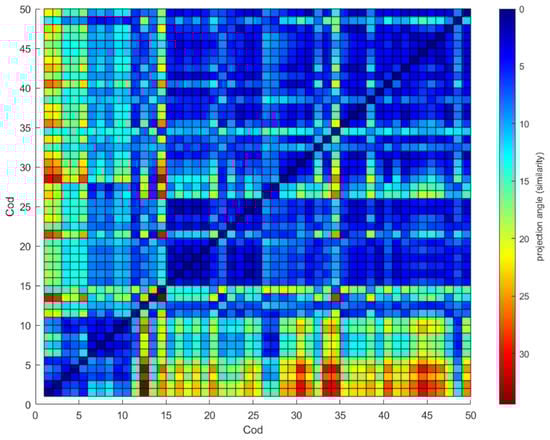
Figure 8.
Correlation map θ between diatoms.
Diatoms 6 to 9 and 15 to 17 show high similarity (see Figure 8), but the θ values, although close to zero, could be due to imperfections in the images and not show the fundamental differences between them, so it is essential to combine the θ parameter with other ways of measuring the differences between it, as is the case of Nf. In any case, if we review the use of all the parameters for the classification in the principal components analysis, we see a total separation between the diatoms 6 to 9 and 15 to 17 (see Figure 6a).
The Figure 8, the image is not two parts that mirror each other because the θ value is calculated based on the CCauto of the reference image; when changing the role of the images, the CCauto is different, and therefore the value of the projection is a bit different. This is seen more markedly between very different diatoms than between similar ones, where the figure’s mirror effect can be seen.
This methodology to classify diatoms differs from others in that only simple parameters are determined, and complex algorithms are unnecessary, as deep learning [28,32,43]. Since these parameters are calculated based on the natural symmetry of the entities and the complexity of their structure, we can call this the diatom fingerprint.
4. Conclusions
We introduce three preprocessing process approaches that enable the differentiation of diatoms species from optical and electronic microscope images by analyzing self-similarity and diatoms symmetry by combining 2D cross-correlation and fractal dimension parameters. Results show that applied to preprocess steps as the image resized and the power spectrum increases the use of the additional symmetry operation, which improves the application of this preprocessing process for the identification of a wide variety of diatom species with heterogeneity in their symmetries. In addition, reducing the information contained in the CC matrices to a relative parameter θ makes it possible to measure the self-similarity or the similarity between diatoms in a simple way. These θ parameters permit a physical characterization based on the geometry of the internal and external traits of the images.
Author Contributions
Data curation, R.V.-G. and L.C.P.-L.; formal analysis, R.V.-G.; investigation, Y.A.-D.; methodology, R.P.-N. and L.C.P.-L.; project administration, E.Y.-R.; resources, R.V.-G.; visualization, L.C.P.-L.; writing—original draft, N.J.G.-F., Y.A.-D., E.M.-S. and L.C.P.-L.; writing—review and editing, N.J.G.-F., E.M.-S. and L.C.P.-L. All authors have read and agreed to the published version of the manuscript.
Funding
This work was funded by the Science Technology and Innovation Fund of Colombia through the project entitled “Desarrollo de un prototipo de monitoreo e inspección de ecosistemas marinos para su uso en Pruebas en ambiente relevante, en la reserva de biosfera seaflower, en el archipielago de San An-drés” with code: BPIN 2020000100047.
Institutional Review Board Statement
This study did not require ethical approval.
Informed Consent Statement
Not applicable.
Data Availability Statement
Not applicable.
Acknowledgments
The authors by the Science Technology and Innovation Fund of Colombia and Roberto Pestana-Nobles would like to thank the “Programa de Becas de Excelencia Doctoral del Bicentenario 2019” which make possible the PhD studies.
Conflicts of Interest
The authors declare no conflict of interest.
References
- Ashworth, M.P.; Lobban, C.S.; Witkowski, A.; Theriot, E.C.; Sabir, M.J.; Baeshen, M.N.; Hajarah, N.H.; Baeshen, N.A.; Sabir, J.S.; Jansen, R.K. Molecular and Morphological Investigations of the Stauros-Bearing, Raphid Pennate Diatoms (Bacillariophyceae): Craspedostauros E.J. Cox, and Staurotropis T.B.B. Paddock, and Their Relationship to the Rest of the Mastogloiales. Protist 2017, 168, 48–70. [Google Scholar] [CrossRef]
- Cavalier-Smith, T. Kingdom Chromista and Its Eight Phyla: A New Synthesis Emphasising Periplastid Protein Targeting, Cytoskeletal and Periplastid Evolution, and Ancient Divergences. Protoplasma 2018, 255, 297–357. [Google Scholar] [CrossRef] [PubMed]
- Sánchez, C.; Cristóbal, G.; Bueno, G. Diatom Identification Including Life Cycle Stages through Morphological and Texture Descriptors. PeerJ 2019, 7, e6770. [Google Scholar] [CrossRef]
- Obata, T.; Fernie, A.R.; Nunes-Nesi, A. The Central Carbon and Energy Metabolism of Marine Diatoms. Metabolites 2013, 3, 325–346. [Google Scholar] [CrossRef] [PubMed]
- Sharma, N.; Simon, D.P.; Diaz-Garza, A.M.; Fantino, E.; Messaabi, A.; Meddeb-Mouelhi, F.; Germain, H.; Desgagné-Penix, I. Diatoms Biotechnology: Various Industrial Applications for a Greener Tomorrow. Front. Mar. Sci. 2021, 8, 636613. [Google Scholar] [CrossRef]
- Mann, D.G.; Droop, S.J.M. Biodiversity, Biogeography and Conservation of Diatoms. In Biogeography of Freshwater Algae; Springer: Dordrecht, The Netherlands, 1996; pp. 19–32. [Google Scholar]
- Guiry, M.D. How Many Species of Algae Are There? J. Phycol. 2012, 48, 1057–1063. [Google Scholar] [CrossRef] [PubMed]
- Saxena, A.; Tiwari, A.; Kaushik, R.; Iqbal, H.M.N.; Parra-Saldívar, R. Diatoms Recovery from Wastewater: Overview from an Ecological and Economic Perspective. J. Water Process Eng. 2021, 39, 101705. [Google Scholar] [CrossRef]
- Benoiston, A.-S.; Ibarbalz, F.M.; Bittner, L.; Guidi, L.; Jahn, O.; Dutkiewicz, S.; Bowler, C. The Evolution of Diatoms and Their Biogeochemical Functions. Philos. Trans. R. Soc. B Biol. Sci. 2017, 372, 20160397. [Google Scholar] [CrossRef]
- Srikanta Dani, K.G.; Silva Benavides, A.M.; Michelozzi, M.; Peluso, G.; Torzillo, G.; Loreto, F. Relationship between Isoprene Emission and Photosynthesis in Diatoms, and Its Implications for Global Marine Isoprene Estimates. Mar. Chem. 2017, 189, 17–24. [Google Scholar] [CrossRef]
- Coleman, M.L.; Sullivan, M.B.; Martiny, A.C.; Steglich, C.; Barry, K.; DeLong, E.F.; Chisholm, S.W. Genomic Islands and the Ecology and Evolution of Prochlorococcus. Science 2006, 311, 1768–1770. [Google Scholar] [CrossRef]
- Keeling, P.J.; Palmer, J.D. Horizontal Gene Transfer in Eukaryotic Evolution. Nat. Rev. Genet. 2008, 9, 605–618. [Google Scholar] [CrossRef] [PubMed]
- Curtis, B.A.; Tanifuji, G.; Burki, F.; Gruber, A.; Irimia, M.; Maruyama, S.; Arias, M.C.; Ball, S.G.; Gile, G.H.; Hirakawa, Y.; et al. Algal Genomes Reveal Evolutionary Mosaicism and the Fate of Nucleomorphs. Nature 2012, 492, 59–65. [Google Scholar] [CrossRef]
- Morais, W.G., Jr.; Gorgich, M.; Corrêa, P.S.; Martins, A.A.; Mata, T.M.; Caetano, N.S. Microalgae for Biotechnological Applications: Cultivation, Harvesting and Biomass Processing. Aquaculture 2020, 528, 735562. [Google Scholar] [CrossRef]
- Machado Sierra, E.; Serrano, M.C.; Manares, A.; Guerra, A.; Aranguren Díaz, Y. Microalgae: Potential for Bioeconomy in Food Systems. Appl. Sci. 2021, 11, 11316. [Google Scholar] [CrossRef]
- Blanco, S. Diatom Taxonomy and Identification Keys. In Modern Trends in Diatom Identification; Springer International Publishing: Cham, Switzerland, 2020; pp. 25–38. [Google Scholar]
- Jamali, A.A.; Akbari, F.; Ghorakhlu, M.M.; de la Guardia, M.; Khosroushahi, A.Y. Applications of Diatoms as Potential Microalgae in Nanobiotechnology. BioImpacts 2012, 2, 83–89. [Google Scholar] [CrossRef]
- Sun, X.W.; Zhang, Y.X.; Losic, D. Diatom Silica, an Emerging Biomaterial for Energy Conversion and Storage. J. Mater. Chem. A 2017, 5, 8847–8859. [Google Scholar] [CrossRef]
- Passy, S.I. Environmental Randomness Underlies Morphological Complexity of Colonial Diatoms. Funct. Ecol. 2002, 16, 690–695. [Google Scholar] [CrossRef]
- Rajkumar, R.; Yaakob, Z. The Biology of Microalgae. In Biotechnological Applications of Microalgae; Bux, F., Ed.; CRC Press: Boca Raton, FL, USA, 2013; pp. 7–16. ISBN 978-0-42908-711-0. [Google Scholar]
- Cristóbal, G.; Blanco, S.; Bueno, G. Modern Trends in Diatom Identification: Fundamentals and Applications; Springer: Berlin/Heidelberg, Germany, 2020; ISBN 978-3-03039-211-6. [Google Scholar]
- Blanco, S.; Borrego-Ramos, M.; Olenici, A. Disentangling Diatom Species Complexes: Does Morphometry Suffice? PeerJ 2017, 5, e4159. [Google Scholar] [CrossRef] [PubMed]
- Trentin, R.; Moschin, E.; Duarte Lopes, A.; Schiaparelli, S.; Custódio, L.; Moro, I. Molecular, Morphological and Chemical Diversity of Two New Species of Antarctic Diatoms, Craspedostauros ineffabilis Sp. Nov. and Craspedostauros zucchellii Sp. Nov. J. Mar. Sci. Eng. 2022, 10, 1656. [Google Scholar] [CrossRef]
- Liu, M.; Zhao, Y.; Sun, Y.; Li, Y.; Wu, P.; Zhou, S.; Ren, L. Comparative Study on Diatom Morphology and Molecular Identification in Drowning Cases. Forensic Sci. Int. 2020, 317, 110552. [Google Scholar] [CrossRef]
- Hughes, A.H.; Magot, F.; Tawfike, A.F.; Rad-Menéndez, C.; Thomas, N.; Young, L.C.; Stucchi, L.; Carettoni, D.; Stanley, M.S.; Edrada-Ebel, R.; et al. Exploring the Chemical Space of Macro- and Micro-Algae Using Comparative Metabolomics. Microorganisms 2021, 9, 311. [Google Scholar] [CrossRef]
- Silva, S.G.; Paula, P.; da Silva, J.P.; Mil-Homens, D.; Teixeira, M.C.; Fialho, A.M.; Costa, R.; Keller-Costa, T. Insights into the Antimicrobial Activities and Metabolomes of Aquimarina (Flavobacteriaceae, Bacteroidetes) Species from the Rare Marine Biosphere. Mar. Drugs 2022, 20, 423. [Google Scholar] [CrossRef] [PubMed]
- Xu, Z.; Jiang, Y.; Ji, J.; Ji, J.; Forsberg, E.; Li, Y.; He, S.; He, S. Classification, Identification, and Growth Stage Estimation of Microalgae Based on Transmission Hyperspectral Microscopic Imaging and Machine Learning. Opt. Express OE 2020, 28, 30686–30700. [Google Scholar] [CrossRef]
- Zhu, Y.-Z.; Zhang, J.; Cheng, Q.; Yu, H.-X.; Deng, K.-F.; Zhang, J.-H.; Qin, Z.-Q.; Zhao, J.; Sun, J.-H.; Huang, P. Comparison among Four Deep Learning Image Classification Algorithms in AI-Based Diatom Test. Fa Yi Xue Za Zhi 2022, 38, 31–39. [Google Scholar] [CrossRef]
- Chen, Y. Modeling Fractal Structure of City-Size Distributions Using Correlation Functions. PLoS ONE 2011, 6, e24791. [Google Scholar] [CrossRef] [PubMed]
- Popescu, D.P.; Flueraru, C.; Mao, Y.; Chang, S.; Sowa, M.G. Signal Attenuation and Box-Counting Fractal Analysis of Optical Coherence Tomography Images of Arterial Tissue. Biomed. Opt. Express 2010, 1, 268–277. [Google Scholar] [CrossRef] [PubMed]
- King, R.D.; George, A.T.; Jeon, T.; Hynan, L.S.; Youn, T.S.; Kennedy, D.N.; Dickerson, B. Characterization of Atrophic Changes in the Cerebral Cortex Using Fractal Dimensional Analysis. Brain Imaging Behav. 2009, 3, 154–166. [Google Scholar] [CrossRef] [PubMed]
- Pedraza, A.; Bueno, G.; Deniz, O.; Cristóbal, G.; Blanco, S.; Borrego-Ramos, M. Automated Diatom Classification (Part B): A Deep Learning Approach. Appl. Sci. 2017, 7, 460. [Google Scholar] [CrossRef]
- Du Buf, H.; Bayer, M.; Droop, S.; Head, R.; Juggins, S.; Fischer, S.; Bunke, H.; Wilkinson, M.; Roerdink, J.; Pech-Pacheco, J.; et al. Diatom Identification: A Double Challenge Called ADIAC. In Proceedings of the 10th International Conference on Image Analysis and Processing, Venice, Italy, 27–29 September 1999; pp. 734–739. [Google Scholar]
- Wu, J.; Jin, X.; Mi, S.; Tang, J. An Effective Method to Compute the Box-Counting Dimension Based on the Mathematical Definition and Intervals. Results Eng. 2020, 6, 100106. [Google Scholar] [CrossRef]
- Baranov, M.; Velichko, E.; Greshnevikov, K. Analysis of Fractal Structures in Dehydrated Films of Protein Solutions. Symmetry 2021, 13, 123. [Google Scholar] [CrossRef]
- Alceu Costa Hausdorff (Box-Counting) Fractal Dimension. Available online: https://www.mathworks.com/matlabcentral/fileexchange/30329-hausdorff-box-counting-fractal-dimension (accessed on 27 December 2021).
- Wang, X.; Lu, Y.; Liu, J. A Fast Image Alignment Approach for 2D Classification of Cryo-EM Images Using Spectral Clustering. Curr. Issues Mol. Biol. 2021, 43, 1652–1668. [Google Scholar] [CrossRef] [PubMed]
- Azar, R.Z.; Goksel, O.; Salcudean, S.E. Comparison between 2-D Cross Correlation with 2-D Sub-Sampling and 2-D Tracking Using Beam Steering. IEEE Trans. Ultrason. Ferroelectr. Freq. Control 2011, 58, 1534–1537. [Google Scholar] [CrossRef] [PubMed]
- Woodard, K.; Neustupa, J. Geometric Morphometrics of Bilateral Asymmetry in Eunotia Bilunaris (Eunotiales, Bacillariophyceae) as a Tool for the Quantitative Assessment of Teratogenic Deviations in Frustule Shapes. Symmetry 2022, 14, 42. [Google Scholar] [CrossRef]
- Pham, D.T.; Musielak, Z.E. Spectra of Reduced Fractals and Their Applications in Biology. arXiv 2021, arXiv:2111.01719. [Google Scholar] [CrossRef]
- Mandelbrot, B.B.; Wheeler, J.A. The Fractal Geometry of Nature. Am. J. Phys. 1983, 51, 286–287. [Google Scholar] [CrossRef]
- van der Schaaf, A.; van Hateren, J.H. Modelling the Power Spectra of Natural Images: Statistics and Information. Vis. Res. 1996, 36, 2759–2770. [Google Scholar] [CrossRef]
- Kloster, M.; Langenkämper, D.; Zurowietz, M.; Beszteri, B.; Nattkemper, T.W. Deep Learning-Based Diatom Taxonomy on Virtual Slides. Sci. Rep. 2020, 10, 14416. [Google Scholar] [CrossRef]


Disclaimer/Publisher’s Note: The statements, opinions and data contained in all publications are solely those of the individual author(s) and contributor(s) and not of MDPI and/or the editor(s). MDPI and/or the editor(s) disclaim responsibility for any injury to people or property resulting from any ideas, methods, instructions or products referred to in the content. |
© 2023 by the authors. Licensee MDPI, Basel, Switzerland. This article is an open access article distributed under the terms and conditions of the Creative Commons Attribution (CC BY) license (https://creativecommons.org/licenses/by/4.0/).