Abstract
Unlike the high imaging radiation dose of computed tomography (CT), cone-beam CT (CBCT) has smaller radiation dose and presents less harm to patients. Therefore, CBCT is often used for target delineation, dose planning, and postoperative evaluation in the image-guided radiotherapy (IGRT) of various cancers. In the process of IGRT, CBCT images usually need to be collected multiple times in a radiotherapy stage for postoperative evaluation. The effectiveness of radiotherapy is measured by comparing and analyzing the registered CBCT and the source CT image obtained before radiotherapy. Hence, the registration of CBCT and CT is the most important step in IGRT. CBCT images usually have poor visual effects due to the small imaging dose used, which adversely affects the registration performance. In this paper, we propose a novel adaptive visual saliency feature enhancement method for CBCT in IGRT. Firstly, we denoised CBCT images using a structural similarity based low-rank approximation model (SSLRA) and then enhanced the denoised results with a visual saliency feature enhancement (VSFE)-based method. Experimental results show that the enhancement performance of the proposed method is superior to the comparison enhancement algorithms in visual objective comparison. In addition, the extended experiments prove that the proposed enhancement method can improve the registration accuracy of CBCT and CT images, demonstrating their application prospects in IGRT-based cancer treatment.
1. Introduction
The purpose of radiotherapy is to deliver a planned radiation dose to a delineated cancerous region to kill cancer cells while preserving the surrounding normal structures and leaving tissues unharmed [1,2,3]. It is very difficult to accurately radiate the target region and ensure the surrounding normal areas are not damaged [4,5]. Image-guided radiotherapy (IGRT) is a new cancer treatment technology in which images are used to guide the whole radiation process including position guidance, pre-operative and postoperative analysis [6,7,8]. The key step of IGRT is to collect and analyze CT and CBCT images of the target area. High-quality CT images only need to be collected a few times for diagnosis and treatment planning, and CBCT images need to be collected many times for patient positioning guidance during the radiotherapy. CBCT imaging is used to replace CT imaging as much as possible to reduce the harm caused by the high dose of CT to patients. When IGRT-based treatment is implemented, some image technologies need to be used to supervise and guide the whole treatment process. Due to this process often requiring multiple acquisitions and analyses of images, CBCT, with its lower imaging dose, is usually used as the guidance image to reduce the harm to the patient [9,10]. In IGRT, the most important step is to analyze the position information between the CBCT image and the delineated CT images; that is, the radiologist needs to register and align the CBCT and the CT images.
As shown in Figure 1, CBCT images usually have low contrast and visual quality due to their small imaging dose compared with CT images. Compared with CT, CBCT has a small imaging dose, which means that its imaging is more susceptible to interference from environments such as a strong magnetic field, resulting in more noise in the CBCT image. The degradation of CBCT will reduce image contrast and increase the ambiguity of structures of important regions, which makes it unable to play its due role in IGRT [11]. Huang et al. proved that the accuracy of radiotherapy can be improved by using CBCT enhancement technology in IGRT [12]. Thus, it has become a new research topic to use image enhancement technology to improve the quality of CBCT.
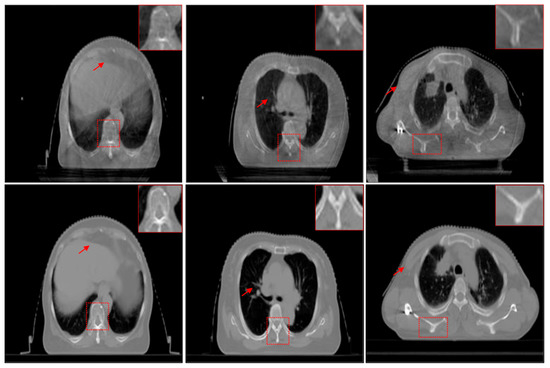
Figure 1.
Examples of unregistered CBCT (the first row) and CT (the second row) images.
In recent decades, different types of efficient methods have been proposed for image enhancement [13,14,15], such as the well-known histogram equalization (HE) method [16], dark channel prior (DCP) method [17], signal scale retinex (SSR) method [18], multiscale retinex with color restoration (MSRCR) method [19], semi-decoupled decomposition (SSD) method [20], and statistical methods with image processing concepts (SMIPC) [21]. Among them, HE is a classical image enhancement algorithm, which mainly improve the visual quality by calculating and adjusting the distribution of pixel values and increasing the gray level difference of the input image. The DCP method assumes that the image is degraded during the imaging process and then calculates a transmission map to estimate the degradation to enhance the degraded image. The DCP method has better performance in foggy image enhancement. SSR and MSRCR are typical methods based on retinex theory. SSR is a single-scale retinex algorithm, which achieves enhancement by establishing an illumination reflection model in the imaging process and performing high-frequency enhancement processing on the reflected component. MSRCR is a multi-SSR-based algorithm with a color restoration factor to adjust the contrast of the input image and improve the color information. SSD is a Gaussian total variation model performing retinex decomposition in a semi-decoupled fashion for simultaneous brightness enhancement and noise suppression. SMIPC-based methods enhance the contrast of medical images using statistical methods with image processing concepts. Although the above enhancement methods have their own advantages for different types of images, most of them ignore an important point for medical image enhancement, especially for CBCT images: the medical images may contain noise due to the interference of the surrounding environment [22]. Based on this motivation, we propose an adaptive visual saliency feature enhancement method of CBCT for image-guided radiotherapy, which takes the denoising process into account to overcome the influence of potential noise on the enhancement results. First, we propose a structural similarity-based low-rank approximation model (SSLRA) to construct the source CBCT images to denoise the noise that may exist. Low-rank approximation (LRA) is an extension of singular value decomposition (SVD) in machine learning. Unlike in our previous work [23], we propose an unsupervised adaptive denoising model based on structural similarity considering the characteristics of CBCT images. Then, we propose a visual saliency feature-based enhancement (VSFE) method to enhance the important regions in CBCT images.
The main contributions of this work are as follows: (1) A novel unsupervised adaptive denoising model called a structural similarity-based low-rank approximation (SSLRA) model is proposed for CBCT images. (2) A visual saliency feature enhancement (VSFE) method is proposed, in which more salient and important regions of CBCT can be enhanced. (3) By analyzing the support for subsequent registration tasks of CBCT and CT, we prove that the proposed method can effectively improve the registration performance, indicating its application prospects in IGRT.
2. Materials and Methods
We propose a novel adaptive visual saliency feature enhancement of CBCT for image-guided radiotherapy in this section. As shown in Figure 2, the proposed method consists of two steps: structural similarity-based low-rank approximation for denoising, and the visual saliency feature enhancement for improving detail.
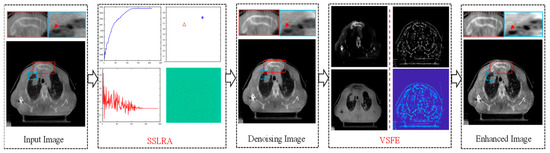
Figure 2.
Flowchart of the proposed method for CBCT image enhancement method, in which SSLRA denotes the proposed structural similarity-based low-rank approximation algorithm and VSFE denotes the proposed visual saliency feature based enhancement algorithm.
2.1. Structural Similarity-Based Low-Rank Approximation
Based on the singular value decomposition (SVD) algorithm [24,25,26,27], we propose a structural similarity-based low-rank approximation method (SSLRA) to reconstruct the input CBCT images so as to denoise the source image. The decomposition and reconstruction of the SVD of an image X with size can be expressed as:
where , , , and ; the columns of the matrix are the left singular vectors; and the rows of the matrix contain the elements of the right singular vectors. is the diagonal matrix, where and . In addition, if and if , where is the rank of X. Using Equation (1), the source image can be computed by three matrices. Then, the image X can be reconstructed by:
where and are the left singular vectors and right singular vectors in and , respectively, and is the singular value in .
The reconstruction result of different features can be obtained by:
where . When , the full rank reconstruction result is . That is, the denoised can be estimated from by solving:
where denotes the rank of the given data.
Equation (4) can be solved by the theorem of Eckart–Young–Mirsky. That is, for the given matrix with , the truncated matrix can be expressed by:
Next, for any given matrix with rank , the minimal error can be computed with :
The above Equations shows that can be as the optimal solution of in the Frobenius norms sense. That is, Equation (6) can be computed by:
By an optimal rank, the reconstruction result can be denoised with high imaging quality and more detailed information.
The proposed SSLRA are summarized in Algorithm 1, in which is defined as:
where are the local means of image and . and are the standard deviations and cross-covariance of and . can be computed by:
where is the gradient operator. Equation (9) is derived from total variation (TV) regularization. For an image U, the mean curvature of U is:
More details about Equation (10) can be found in our previous work [17].
| Algorithm 1 Structural similarity based low-rank approximation (SSLRA) |
| Input: CBCT image |
| Output: Denoised image |
| 1. for to do |
| 2. Compute |
| 3. Compute , |
| 4. while do |
| 5. Update , |
| end while |
| 6. end for |
| 7. |
| 8. Reconstruct by Equation (3) with |
| 9. return: |
Two examples of SSLRA are given in Figure 3. Figure 3a is the source CBCT image, and Figure 3b,c are the normalized curves of and , respectively. Figure 3d is the reconstructed image, and Figure 3e is the difference image between Figure 3a,d. From the difference image, it can be found that the proposed SSLRA method suppresses some discrete noise points during the reconstruction process. This is necessary for the next step of detail enhancement, and denoising using the proposed SSLRA first will avoid enhancing the noise that may exist in these source CBCT images.
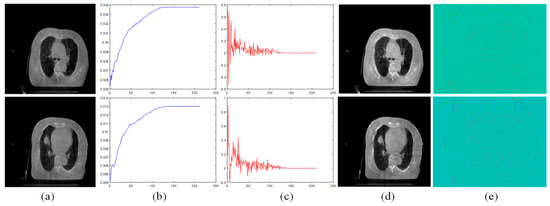
Figure 3.
Illustration of SSLRA. (a) Source CBCT images. (b) Normalized curves of . (c) Normalized curves of . (d) Reconstructed images. (e) Difference maps between (a,d).
2.2. Visual Saliency Feature-Based Enhancement
Visual saliency detection is used to make the region of our interest stand out more from its neighbors and surrounding pixels [28]. Some existing visual saliency detection methods highlight the edges and textures of the entire salient region. The saliency map can be obtained by computing the Euclidean distance in CIELab color space as follows:
where is the average pixels of the input image in CIELab color space and is the computed significance value at . is the corresponding pixel in the Gaussian blurred image of the input image, and denotes the norm. However, these methods compute the difference between the average pixels of the entire input image and its corresponding blurred version and often fail to maintain good performance when the input image has a noisy background or the imaging scene is large. Achanta et al. [29] proposed a maximum symmetric surround-based saliency detection method. For an input image with size , the symmetric surround saliency value at the given pixel can be computed as:
where is the average pixels of the sub-image centered at pixel in CIELab color space and computed as:
where is the local window size, and the area A of the sub-image is determined by:
When the visual saliency detection results are obtained by Equation (12), the salient region of the input image will be stretched and enhanced, as shown in Figure 4.
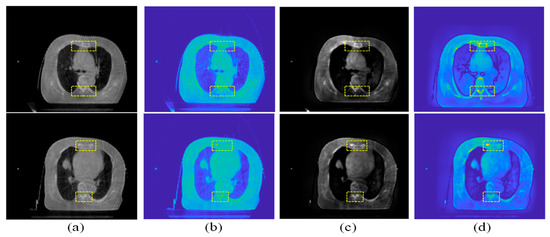
Figure 4.
Examples of visual saliency detection. (a) Source CBCT images. (b) Pseudo-color image of (a). (c) Saliency map of (a). (d) Pseudo-color image of (c).
In the proposed VSFE algorithm, the saliency detection result from Equation (12) will be used as the visual saliency decision map for further detail enhancement. The visual saliency enhancement can be computed by:
where is the enhancing weight parameter, is the reconstructed result by the SSLRA, and is the visual saliency map of .
Some examples of are given in Figure 5c. Compared with the reconstructed results in Figure 5b, the contrast of the visual saliency enhancement images is higher and the important regions are easier to observe.

Figure 5.
Examples of Enhancement. (a) Source CBCT image. (b) of (a). (c) of (a). (d) Final enhanced result of (a). (e) . (f) Difference map between (a,d).
It can be found that only enhances the salient features, and in the next step, we perform the overall detail enhancement on the images to further improve their quality. To enhance detail, the mutually guided image filter (MuGIF) method is adopted in the proposed VSFE algorithm. The MuGIF can be used to extract the relative structure of two images and the structure information of a single image [30,31,32]. The related structure of and of MuGIF is defined as:
where is the structure discrepancy of and . In Equation (16), the penalty term can be used to control the strength of the computed related structures. The solution of Equation (16) can be converted to:
where , , , and are the non-negative constants which are used to balance the corresponding terms. represents the norm. The norm in the above equation can be used to avoid the trivial solution through constraining and not to widely deviate from the input and , respectively. The filtered image can be obtained by solving:
where expresses the kth computing of iteration. are the initialization parameters of the MuGIF. The detail map of the input CBCT image is computed by:
The final enhanced result is determined by:
3. Experiments and Analysis
3.1. Dataset and Experimental Setting
The experimental data are shown in Figure 6, and all of them are acquired from the Affiliated Hospital of Yunnan University, decrypted, and anonymized. Both CBCT and CT images are acquired for each sample of the same patient. The CBCT images were obtained by linac (XVI, Elekta Solutions AB, Stockholm, Sweden), and the corresponding CT images were acquired by Philips Brilliance Big Bore CT equipment, with a slice thickness of 3 mm. All images in our experiment were resized to 256 × 256 pixels. For this work, we have acquired CBCT and CT image sequences of three patients, totaling 120 pairs of images. Since there is little difference between the different sequence images of the same patient, four sections with large differences were selected as experimental data for analysis.
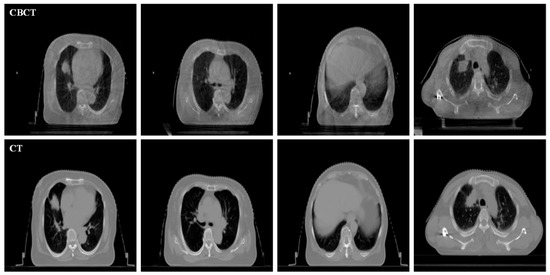
Figure 6.
Experimental data. The first line is CBCT and the second line is the corresponding CT.
To illustrate the superior performance of the proposed enhancement algorithm, six classical and effective enhancement algorithms are used for comparison in our experiment, including the multi-scale retinex (MSR) method [33], the multi-scale retinex with color restoration (MSRCR) method [19], the dark channel prior (DCP) method [17], the color balance and fusion (CBF) method [34], the robust retinex model (RRM) [35], and statistical methods with image processing concepts (SMIPC) [21]. For quantitative evaluation, the enhancement performance was summarized with four imaging quality evaluation metrics: average gradient (AG) [36], spatial frequency (SF) [37], edge intensity (EI) [38], and human visual system inspired quality measures (UIQM) [39]. Among them, AG represents the gradient information, and the higher the gradient value, the higher the structural contrast of the image. SF denotes the frequency information, and a higher SF value represents the more image information and abundant imaging frequency. EI is used to measure the edge intensity of a given image; the higher the EI value, the sharper and clearer the texture of the edge is. UIQM is an often-used image evaluation metric based on the human visual system for measuring the color, clarity, and contrast of the given image. We also use the structural similarity index measure (SSIM) values [40] before and after registration of CBCT and CT images to objectively measure the registration performance. The larger these metrics, the better the quality of the enhanced images. In the experiments, all the codes are used in the version provided by the corresponding authors, and the parameters are set the same as the authors. All the experiments are performed under the Matlab R2020a, on a PC with an AMD Ryzen 7, 16 G RAM, and a 3.2 GHz processor.
3.2. Subjective Comparison and Analysis
The visual comparison of different enhancement algorithms is shown in Figure 7, Figure 8, Figure 9 and Figure 10. Figure 7a is the source CBCT image, and Figure 7b is the image enhanced by MSR, which shows that the brightness of the source image is improved but with low contrast. Figure 7c,f,g show similar enhanced results with improved brightness but lacking in details. The DCP method improves the contrast of the source image, but does not enhance the details. As shown in Figure 7e, the CBF-based method shows good detail, but it still contains some noise. Compared with these methods, the proposed method shows better visual effects with higher contrast and richer detail, and the important regions are more significant.
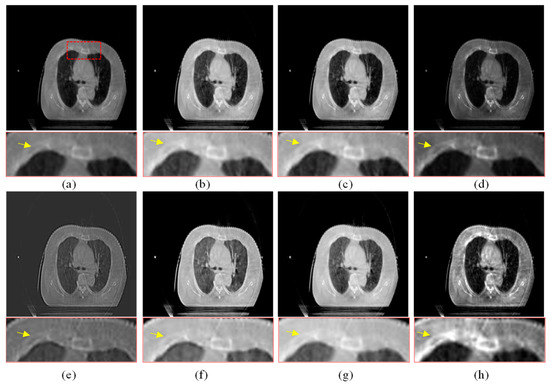
Figure 7.
Enhanced results of pair 1. (a) Source CBCT images. (b) MSR. (c) MSRCR. (d) DCP. (e) CBF. (f) RRM. (g) SMIPC. (h) Ours.
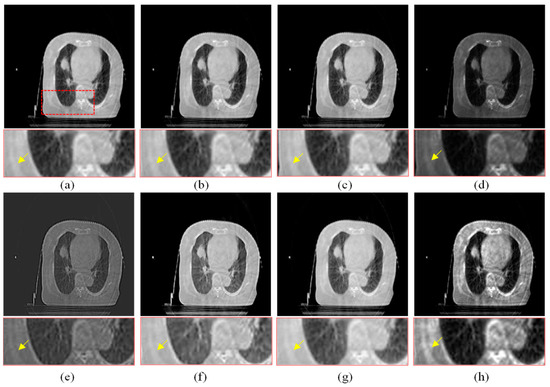
Figure 8.
Enhanced results of pair 2. (a) Source CBCT images. (b) MSR. (c) MSRCR. (d) DCP. (e) CBF. (f) RRM. (g) SMIPC. (h) Ours.
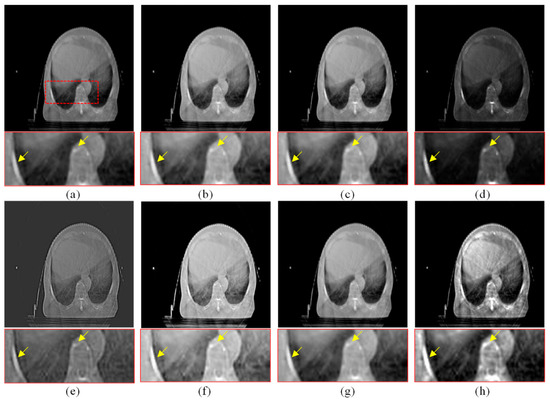
Figure 9.
Enhanced results of pair 3. (a) Source CBCT images. (b) MSR. (c) MSRCR. (d) DCP. (e) CBF. (f) RRM. (g) SMIPC. (h) Ours.
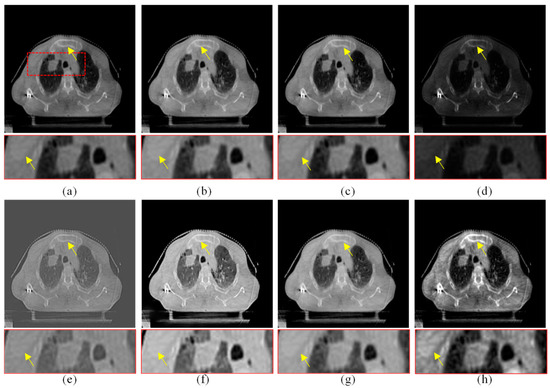
Figure 10.
Enhanced results of pair 4. (a) Source CBCT images. (b) MSR. (c) MSRCR. (d) DCP. (e) CBF. (f) RRM. (g) SMIPC. (h) Ours.
Another three sets of experiments are shown in Figure 8, Figure 9 and Figure 10. As can be seen from the enlarged regions and the yellow arrows in Figure 8, it is difficult to directly observe the presence of skeletal information at this position from the enlarged region in Figure 8a. The enhancement results of the comparison methods also did not improve the visual contrast in this region, but the skeletal information can be clearly observed in our result, which means our results outperform the comparison algorithms in terms of detail, contrast, and visualization effect.
The same conclusion can also be obtained in Figure 9 and Figure 10. Especially in the enalrged region in Figure 10, our results provide a much clearer organizational structural and edge infromation, which is very helpful for disease diagnosis and treatment. Through comparison, it can be found that the rigidity informaiton in our results is more significant, the tissue edge in our results is clearer, and the contrast of the texture structure is also better than that of the comparison algorithms. The observation effect is greatly improved by our enhancement method, proving that our method can effectively enhance the CBCT images.
3.3. Quantitative Analysis
Table 1, Table 2, Table 3 and Table 4 show the evaluation metrics of different methods on Pair 1 to Pair 4. The best results in these tables are highlighted in bold and the second-best results are highlighted in bold and italic. The proposed enhancement algorithm gives the best values of AG and EI on three image pairs and four of the second-best values of SF on all images. The average evaluation metrics on all the testing images of different methods are given in Figure 11. The proposed algorithm gives the best scores for AG and EI and the second-best scores for SF and UIQM. This means the enhancement results of the proposed algorithm contain more detailed texture and gradient information and are more consistent with the human visual system. The evaluation metrics in Table 1, Table 2, Table 3 and Table 4 also prove the superiority of the proposed method, which is consistent with the conclusion obtained by the visual comparison.

Table 1.
Quantitative metrics of different methods on pair 1.
Table 2.
Quantitative metrics of different methods on pair 2.
Table 3.
Quantitative metrics of different methods on pair 3.
Table 4.
Quantitative metrics of different methods on pair 4.
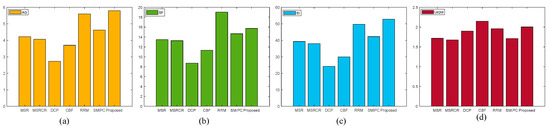
Figure 11.
Comparison of the average quantitative metrics of different methods. (a) AG. (b) SF. (c) EI. (d) UIQM.
4. Support for CBCT and CT Registration in IGRT
In this section, the registration results between the source CBCT and CT images and between the CBCT images enhanced using different enhanced algorithms and CT images are compared and analyzed. In this experiment, all the registration results are obtained by the same registration model [39]. In addition to visual analysis, we also give the SSIM values before and after the registration of these images to objectively measure the registration performance.
As shown in Figure 12, Figure 12a is the unregistered source CBCT and CT images. The SSIM value of the source images is 0.5532, and it can be seen from Figure 12a that the imaging position and size of the source CBCT and CT images are different. Figure 11b is the registration result by the source CBCT and CT, and the SSIM value is 0.7184 if the CBCT image is used directly for the registration task. In the enlarged image, the edge regions are not exactly aligned in Figure 12b. Except for the CBF enhancement method, the registration accuracy was improved after CBCT images were enhanced by other methods. For example, in Figure 12c, the SSIM value is 0.7486 by registering the MSR-enhanced CBCT and CT images, which shows improved accuracy of non-enhanced CBCT and CT registration. In other words, the enhancement of CBCT images is helpful to improve the registration accuracy of CBCT and CT, which is very critical and meaningful for IGRT.
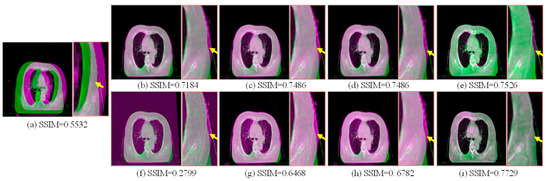
Figure 12.
Registration comparison. The positions of the two images are shown in different colors. (a) Source CBCT and CT images. (b) Registration results of source CBCT and CT images. (c) Registration results of MSR-enhanced CBCT and CT. (d) Registration results of MSRCR-enhanced CBCT and CT. (e) Registration results of DCP-enhanced CBCT and CT. (f) Registration results of CBF-enhanced CBCT and CT. (g) Registration results of RRM-enhanced CBCT and CT. (h) Registration results of SMIPC-enhanced CBCT and CT. (i) Registration results of CBCT and CT enhanced by our method.
From the yellow arrows, it can be seen that our method’s results have the highest registration accuracy and achieve the best SSIM value of 0.7729. In the enlarged image, it can be seen that the proposed method outperforms the comparison methods in the registration accuracy of the edge regions. This is because the proposed method enhances the saliency features, which plays a key role in the registration process. In addition, since the proposed method includes the denoising step, the noise points on the edges of image that may affect the registration were filtered out, which also helps to improve the registration accuracy.
5. Conclusions
We propose a novel adaptive visual saliency feature enhancement algorithm of CBCT images for IGRT in this paper. Firstly, to overcome the influence of the potential noise on the image enhancement and registration, we propose a structural similarity-based low-rank approximation (SSLRA) model. SSLRA can effectively enhance the structure and gradient information of the source image while denoising it. To improve the detail in important regions, we propose a visual saliency feature enhancement (VSFE) method. The main advantage of our VSFE method is that the saliency regions are enhanced first rather than enhancing the whole image directly; in this way, the problem of insufficient visual contrast caused by manipulating the whole image is avoided. Experimental results show that the SSIM value can be increased by 0.2197 using the proposed CBCT enhancement method. It also proves that the proposed algorithm outperforms other enhancement algorithms both in visual and objective evaluations for CBCT images. In addition, it is worth noting that the proposed method is more able to support the registration task of CBCT and CT images in IGRT, which is very critical and meaningful for IGRT tasks.
Author Contributions
Conceptualization, L.X. and K.H.; methodology, L.X. and K.H.; software, L.X.; validation, and D.X.; supervision, D.X.; project administration, D.X.; funding acquisition, D.X. All authors have read and agreed to the published version of the manuscript.
Funding
This work was supported in part by the Provincial Major Science and Technology Special Plan Projects under Grant 202202AD080003; in part by the National Natural Science Foundation of China under Grant 62202416, Grant 62162068, Grant 62172354, Grant 62162065; in part by the Yunnan Province Ten Thousand Talents Program and Yunling Scholars Special Project under Grant YNWR-YLXZ-2018-022; in part by the Yunnan Provincial Science and Technology Department-Yunnan University “Double First Class” Construction Joint Fund Project under Grant No. 2019FY003012; and in part by the Science Research Fund Project of Yunnan Provincial Department of Education under grant 2021Y027.
Institutional Review Board Statement
Not applicable.
Informed Consent Statement
Not applicable.
Data Availability Statement
Not applicable.
Conflicts of Interest
The authors declare no conflict of interest.
References
- Luo, Y.; Niu, T.; Jia, X.; Vela, P.A.; Zhu, L.; Tanenbaum, A.R. Joint CT/CBCT deformable registration and CBCT enhancement for cancer radiotherapy. Med. Image Anal. 2013, 17, 387–400. [Google Scholar]
- Kidar, H.S.; Azizi, H. Enhancement of Hounsfield unit distribution in cone-beam CT images for adaptive radiation therapy: Evaluation of a hybrid correction approach. Phys. Med. 2020, 69, 269–274. [Google Scholar] [CrossRef]
- Choi, Y.; Jang, Y.J.; Kim, K.B.; Bahng, J.; Choi, S.H. Characterization of Tissue Equivalent Materials Using 3D Printing for Patient-Specific DQA in Radiation Therapy. Appl. Sci. 2022, 12, 9768. [Google Scholar] [CrossRef]
- Zachiu, C.; De Senneville, B.D.; Tijssen, R.H.; Kotte, A.N.; Houweling, A.; Kerkmeijer, L.; Lagendijk, J.; Moonen, C.; Ries, M. Non-rigid CT/CBCT to CBCT registration for online external beam radiotherapy guidance. Phys. Med. Biol. 2017, 63, 015027. [Google Scholar] [CrossRef] [PubMed]
- Martin, C.; Gros, S.; Kron, T.; Wood, T.J.; Vassileva, J.; Small, W.; Min, U.N. Factors Affecting Implementation of Radiological Protection Aspects of Imaging in Radiotherapy. Appl. Sci. 2023, 13, 1533. [Google Scholar] [CrossRef]
- Xu, X.G. An exponential growth of computational phantom research in radiation protection, imaging, and radiotherapy: A review of the fifty-year history. Phys. Med. Biol. 2014, 59, R233. [Google Scholar] [CrossRef]
- Holmberg, O.; Malone, J.; Rehani, M.; McLean, D.; Czarwinski, R. Current issues and actions in radiation protection of patients. Eur. J. Radiol. 2010, 76, 15–19. [Google Scholar] [CrossRef]
- Khong, P.L.; Ringertz, H.; Donoghue, V.; Frush, D.; Rehani, M.; Appelgate, K.; Sanchez, R. ICRP publication 121: Radiological protection in paediatric diagnostic and interventional radiology. Ann. ICRP 2013, 155, 380–387. [Google Scholar] [CrossRef]
- Gianrico, S. Cone-Beam Computed Tomography and the Related Scientific Evidence. Appl. Sci. 2022, 12, 7140. [Google Scholar]
- Xie, L.; He, K.; Gong, J.; Xu, D. Multi-Intensity Optimization-Based CT and Cone Beam CT Image Registration. Electronics 2022, 11, 1862. [Google Scholar] [CrossRef]
- Gong, J.; He, K.; Xie, L.; Xu, D.; Yang, T. A Fast Image Guide Registration Supported by Single Direction Projected CBCT. Electronics 2022, 11, 645. [Google Scholar] [CrossRef]
- Hung, S.; Xiao, Y.; Li, H.; Li, D.; Xiao, Y.; Li, H.; Li, D. Research on improving radiotherapy accuracy based on Image-guided radiotherapy. Contrast Media Mol. Imaging 2022, 2022, 9696403. [Google Scholar] [CrossRef]
- He, K.; Tao, D.; Xu, D. Adaptive colour restoration and detail retention for image enhancement. IET Image Process. 2021, 15, 3685–3697. [Google Scholar] [CrossRef]
- Liu, R.; Ma, L.; Wang, Y.; Zhang, L. Learning converged propagations with deep prior ensemble for image enhancement. IEEE Trans. Image Process. 2018, 28, 1528–1543. [Google Scholar] [CrossRef]
- de Araujo, A.F.; Constantinou, C.E.; Tavares, J.M.R. New artificial life model for image enhancement. Expert Syst. Appl. 2014, 41, 5892–5906. [Google Scholar] [CrossRef]
- Yelmanova, E.S.; Romanyshyn, Y.M. Medical image contrast enhancement based on histogram. In Proceedings of the 2017 IEEE 37th International Conference on Electronics and Nanotechnology (ELNANO), Kyiv, Ukraine, 18–20 April 2017; pp. 273–278. [Google Scholar]
- He, K.; Sun, J.; Tang, X. Single image haze removal using dark channel prior. IEEE Trans. Pattern Anal. Mach. Intell. 2010, 33, 2341–2353. [Google Scholar]
- Jobson, D.J.; Rahman, Z.; Woodell, G.A. Properties and performance of a center/surround retinex. IEEE Trans. Image Process. 1997, 6, 451–462. [Google Scholar] [CrossRef]
- Parthasarathy, S.; Sankaran, P. An automated multi scale retinex with color restoration for image enhancement. In Proceedings of the 2012 National Conference on Communications (NCC), Kharagpur, India, 3–5 February 2012; pp. 1–5. [Google Scholar]
- Hao, S.; Han, X.; Guo, Y.; Xu, X.; Wang, M. Low-light image enhancement with semi-decoupled decomposition. IEEE Trans. Multimed. 2020, 22, 3025–3038. [Google Scholar] [CrossRef]
- Al-Ameen, Z. Contrast enhancement of medical images using statistical methods with image processing concepts. In Proceedings of the 2020 6th International Engineering Conference “Sustainable Technology and Development” (IEC), Erbil, Iraq, 26–27 February 2020; pp. 169–173. [Google Scholar]
- Cassetta, M.; Stefanelli, L.V.; Pacifici, A.; Pacifici, L.; Barbato, E. How accurate is CBCT in measuring bone density? A comparative CBCT-CT in vitro study. Clin. Implant Dent. Relat. Res. 2014, 16, 471–478. [Google Scholar] [CrossRef]
- He, K.; Zhang, X.; Xu, D.; Gong, J.; Xie, L. Fidelity-driven optimization reconstruction and details preserving guided fusion for multi-modality medical image. IEEE Trans. Multimed. 2022. [Google Scholar] [CrossRef]
- Wang, Y.; He, Q.; Luo, J. Fast randomized singular value decomposition-based clutter filtering for shear wave imaging. IEEE Trans. Ultrason. Ferroelectr. Freq. Control 2020, 67, 2363–2377. [Google Scholar] [CrossRef] [PubMed]
- Shi, M.; Zhang, F.; Wang, S.; Zhang, C.; Li, X. Detail preserving image denoising with patch-based structure similarity via sparse representation and SVD. Comput. Vis. Image Underst. 2021, 206, 103173. [Google Scholar] [CrossRef]
- Zeng, M.; Zhang, W.; Chen, Z. Group-based K-SVD denoising for bearing fault diagnosis. IEEE Sens. J. 2019, 19, 6335–6343. [Google Scholar] [CrossRef]
- Guo, Q.; Zhang, C.; Zhang, Y.; Liu, H. An efficient SVD-based method for image denoising. IEEE Trans. Circuits Syst. Video Technol. 2015, 26, 868–880. [Google Scholar] [CrossRef]
- Cong, R.; Lei, J.; Fu, H.; Cheng, M.; Lin, W.; Huang, Q. Review of visual saliency detection with comprehensive information. IEEE Trans. Circuits Syst. Video Technol. 2018, 29, 2941–2959. [Google Scholar] [CrossRef]
- Achanta, R.; Süsstrunk, S. Saliency detection using maximum symmetric surround. In Proceedings of the 2010 IEEE International Conference on Image Processing, Hong Kong, China, 26–29 September 2010; pp. 2653–2656. [Google Scholar]
- Ali, U.; Lee, I.H.; Mahmood, M.T. Guided image filtering in shape-from-focus: A comparative analysis. Pattern Recognit. 2021, 111, 107670. [Google Scholar] [CrossRef]
- Xu, S.; Zhang, J.; Wang, J.; Sun, K.; Zhang, C.; Liu, J.; Hu, J. A model-driven network for guided image denoising. Inf. Fusion 2022, 85, 60–71. [Google Scholar] [CrossRef]
- Guo, X.; Li, Y.; Ma, J. Mutually guided image filtering. In Proceedings of the 25th ACM International Conference on Multimedia, Mountain View, CA, USA, 23–27 October 2017; pp. 1283–1890. [Google Scholar]
- Petro, A.B.; Sbert, C.; Morel, J.M. Multiscale retinex. Image Process. On Line 2014, 4, 71–88. [Google Scholar] [CrossRef]
- Ancuti, C.O.; Ancuti, C.; De Vleeschouwer, C.; Bekaert, P. Color balance and fusion for underwater image enhancement. IEEE Trans. Image Process. 2017, 27, 379–393. [Google Scholar] [CrossRef]
- Li, M.; Liu, J.; Yang, W.; Sun, X.; Guo, Z. Structure-revealing low-light image enhancement via robust retinex model. IEEE Trans. Image Process. 2018, 27, 2828–2841. [Google Scholar] [CrossRef]
- Trier, O.D.; Taxt, T. Evaluation of binarization methods for document images. IEEE Trans. Pattern Anal. Mach. Intell. 1995, 17, 312–315. [Google Scholar] [CrossRef]
- Li, S.; Kwok, J.T.; Wang, Y. Combination of images with diverse focuses using the spatial frequency. Inf. Fusion 2001, 2, 169–176. [Google Scholar] [CrossRef]
- He, K.; Gong, J.; Xie, L.; Zhang, X.; Xu, D. Regions preserving edge enhancement for multisensor-based medical image fusion. IEEE Trans. Instrum. Meas. 2021, 70, 5008513. [Google Scholar] [CrossRef]
- Panetta, K.; Gao, C.; Agaian, S. Human-visual-system-inspired underwater image quality measures. IEEE J. Ocean. Eng. 2015, 41, 541–551. [Google Scholar] [CrossRef]
- Wang, Z.; Bovik, A.; Sheikh, H.; Simoncelli, E.P. Image quality assessment: From error visibility to structural similarity. IEEE Trans. Image Process. 2004, 13, 600–612. [Google Scholar] [CrossRef]


Disclaimer/Publisher’s Note: The statements, opinions and data contained in all publications are solely those of the individual author(s) and contributor(s) and not of MDPI and/or the editor(s). MDPI and/or the editor(s) disclaim responsibility for any injury to people or property resulting from any ideas, methods, instructions or products referred to in the content. |
© 2023 by the authors. Licensee MDPI, Basel, Switzerland. This article is an open access article distributed under the terms and conditions of the Creative Commons Attribution (CC BY) license (https://creativecommons.org/licenses/by/4.0/).