Featured Application
Protein and peptide identification based on tandem mass spectrometry is a pillar technology in proteomics research. In recent years, increasing numbers of researchers have utilized deep learning to tackle challenges in proteomics. For example, catalyzed by deep learning, AlphaFold has achieved unparalleled levels of accuracy in protein-structure prediction. Prior to studying the structure and function of proteins in cells or tissues, it is essential to determine the sequences of amino acids in peptides or proteins. De novo peptide sequencing can be used to directly infer the peptide sequence from a tandem mass spectrum without the requirement for a reference sequence database, making it particularly suitable for the determination of protein sequences of unknown species, monoclonal antibodies, and cancer neoantigens.
Abstract
The de novo peptide-sequencing method can be used to directly infer the peptide sequence from a tandem mass spectrum. It has the advantage of not relying on protein databases and plays a key role in the determination of the protein sequences of unknown species, monoclonal antibodies, and cancer neoantigens. In this paper, we propose a method based on graph convolutional neural networks and convolutional neural networks, Denovo-GCN, for de novo peptide sequencing. We constructed an undirected graph based on the mass difference between the spectral peaks in a tandem mass spectrum. The features of the nodes on the spectrum graph, which represent the spectral peaks, were the matching information of the peptide sequence and the mass spectrum. Next, the Denovo-GCN used CNN to extract the features of the nodes. The correlation between the nodes was represented by an adjacency matrix, which aggregated the features of neighboring nodes. Denovo-GCN provides a complete end-to-end training and prediction framework to sequence patterns of peptides. Our experiments on various data sets from different species show that Denovo-GCN outperforms DeepNovo with a relative improvement of 13.7–25.5% in terms of the peptide-level recall.
1. Introduction
De novo peptide sequencing enables the direct inference of a peptide’s sequence from a tandem mass spectrum with a given precursor ion mass [1,2,3]. This method does not require a protein sequence database and plays a key role in the determination of protein sequences of unknown species, monoclonal antibody sequencing [4], and other fields [5,6,7]. Currently, the main de novo peptide sequencing methods are based on spectrum graphs, machine learning, and deep learning.
The most critical step in the de novo peptide-sequencing method based on spectrum graph is to convert the mass spectrum into a directed acyclic graph (DAG). The mass spectrum can be transformed into a DAG by connecting two peaks if the difference between the two peaks is very close to the mass of an amino acid. The weight of each edge can be evaluated by a scoring function. Generally, the algorithm searches for multiple paths from the start node to the end node, and the amino-acid sequences on the paths are the candidate peptide sequences. Finally, a more thorough scoring function is used to select the peptide sequence with the highest score from the candidate peptide sequences as the inferred peptide sequence of the spectrum. Lutefisk [8,9,10], SeqMS [11], SHERENGA [12], PepNovo [13], AUDENS [14], pNovo [15], and pNovo+ [16] are all based on the spectrum-graph method. The design of the scoring function and the construction of the spectrum graph directly affect the performance of the spectrum-graph method. However, if some of the fragment peaks are absent from a spectrum, then the full-length path from the start node to the end node on its spectrum graph are not connected and, consequently, the entire peptide sequence cannot be obtained. In addition, due to the complexity and diversity of tandem mass spectra, the scoring function cannot distinguish correct peptides from candidate peptide sequences well, resulting in a low peptide-recall rate. With the rapid accumulation of high-resolution MS/MS spectra and the development of computing technology, many researchers are increasingly deploying deep learning [17,18,19,20,21] to improve the performance of de novo peptide sequencing.
In 2015, Ma et al. [22] developed the Novor software. This method used the decision-tree model to consider the relative intensity, ranking, and isotopic cluster of peaks. Two models were obtained through training, namely the fragmentation-position-scoring model and the amino-acid-scoring model. According to another article, Novor is 7–37% higher than PEAKS [23] in terms of amino-acid accuracy. However, some subsequent articles [24,25] reported that although Novor performed better on low-resolution collision-induced dissociation (CID) datasets than PEAKS, it performed poorly on high-resolution high-energy collision dissociation (HCD) datasets.
In 2017, Tran et al. first used deep-learning methods for de novo sequencing and developed DeepNovo [24]. This method combines CNN and long short-term memory (LSTM) models for data-dependent acquisition (DDA) mass-spectrum data, and the de novo peptide=sequencing performance exceeded those of the PEAKS, PepNovo, and Novor tools. However, this method is too complex, using two CNN models and a LSTM model. Additionally, DeepNovo needs to discretize the spectrum into a large vector in order to be applied to high-resolution mass-spectrum data, which increases the computational and memory overhead. In 2021, Tran et al. proposed PointNovo [26]. This method uses an order invariant network structure (T-Net) and a LSTM. Although T-Net can use the global features of peaks and does not discretize the mass spectrum into a large vector, it does not use local features, such as the relationship between spectral peaks.
In paper, we propose a de novo sequencing method, Denovo-GCN, based on GCN [27] and CNN. Denovo-GCN does not need to design a scoring function based on prior knowledge, and it is ready to be applied to high-resolution data without discretizing the spectrum into a very large vector. Denovo-GCN represents the spectrum as an undirected graph according to the mass difference between peaks. The spectrum graph is represented by an adjacency matrix that contains the relationship between spectral peaks. At the same time, when predicting the next amino acid, all the possible options are enumerated and the corresponding theoretical m/z is calculated. The feature of the node is expressed as the matching information of the theoretical m/z and the observed m/z. Denovo-GCN uses CNN to extract the features of the nodes. Furthermore, GCN aggregates the features of neighboring nodes through the adjacency matrix. Finally, Denovo-GCN provides an end-to-end training and prediction process. We evaluate our approach on publicly available nine-species benchmark data sets. Our experiment’s results show that Denovo-GCN outperforms DeepNovo with a relative improvement of 13.7–25.5% in terms of the peptide-level recall.
2. Materials and Methods
2.1. Tandem Mass Spectrometry
Tandem Mass Spectrometry (MS/MS) is a powerful tool in the field of proteomics. The samples are loaded into a mass spectrometer and ionized through an ion-source device. Next, these ions are selected according to their mass-to-charge ratio (m/z) and are subjected to fragmentation. Finally, ion detector detects the resulting ions and records their abundance. The outputs of a mass spectrometer are spectra. Each spectrum is a set of peaks, each containing a pair of m/z and intensity. The intensity value represents the abundance of ions.
Figure 1 shows the generation process of MS2. First, biologists use an enzyme, such as trypsin, to cleave protein samples into short peptides. When the peptide mixture enters the mass spectrometer, the output spectrum is denoted as MS1 spectrum. Each signal in the MS1 spectrum is called a precursor ion, which represents a peptide. Next, some precursor ions are selected to be fragmented into fragment ions by a dissociation technique, such as high-energy collision dissociation (HCD). These fragment ions are placed in another mass spectrometer to obtain MS2 spectrum.
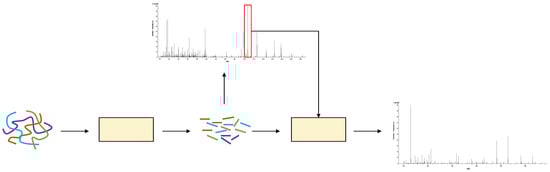
Figure 1.
The process of mass-spectrum generation.
2.2. Spectrum Graph
Each mass-spectrum datum is a set of peaks (m/z, intensity). The spectrum is vectorized into a very large vector in DeepNovo. It also increases computational complexity and memory overhead to adapt to high-resolution data. Here, we refer to the previous method of constructing a spectrum graph. We describe the spectrum graph as an undirected graph, in contrast to the prior approach, and construct features for each node in the graph. The benefit of performing this step is that the weights of edges can be evaluated without a scoring function based on prior knowledge. The scoring function of the current predicted amino acid can be automatically learned by GCN model.
Each spectrum has a different number of peaks. We fixed the number of peaks to 500 to ease the subsequent model training. Since the majority of peaks in the spectrum may be lower than 500, we utilized 0 to pad if a spectrum had fewer than 500 peaks. Finally, we denoted as the observed m/z vector and as intensity vector. Before constructing the graph, four virtual peaks needed to be added to the spectrum: proton mass, H2O mass, peptide mass, and the mass of the peptide loss H2O. The intensities of virtual peaks were set to the max of intensity vector. These peaks were not included in the original spectrum, but the determination of amino acids at both ends of the peptide sequence is crucial. The four virtual peaks were used as the starting node and end node of the N-terminal and C-terminal pathways. Here, we have:
where represents the transposition of M and is the matrix of masses of different amino acids. The absolute value of the difference between any two spectral peaks is first calculated, and the difference is then compared to the mass of amino acids. Each element of matrix represents the matching error of amino-acid mass and difference between peaks. Next, if the error is within a given (by default ), the corresponding element of A is marked as 1; otherwise, it is marked as 0. In high-resolution tandem-mass-spectrum data, the fragment-ion error is generally not more than 0.02 Da, so we set here. The A denotes the adjacency matrix of the spectrum graph.
In addition, we construct features for each peak based on the currently predicted amino-acid sequence. We enumerate all possible amino acids and consider different fragment-ion types formed by different amino acids. Here, we consider 26 different amino acids and 12 different fragment-ion types. The 26 amino acids include 20 amino acids, 3 special symbols, and 3 variable modifications. The three special symbols are “start”, “end,” and “pad,” and the three variable modifications are oxidation of M and deamidation of NQ. The 12 fragment-ion types include twelve types of ion: b, y, a, b2+, y2+, a2+, b-H2O, y-H2O, a-H2O, b-NH3, y-NH3, and a-NH3. Next, we obtain the theoretical fragment-ion m/z matrix of shape (26,12). We reshape the theoretical fragment ion m/z matrix to shape (1, 26 × 12). Here we have:
where represents the theoretical fragment-ion matrix. Firstly, we can compute the m/z difference matrix E, in which each element represents the difference between the m/z value for an observed peak and the theoretical m/z for a token and ion-type pair. Here, the exponential and absolute operations are all element-wise operations and set c = 100. However, according to previous studies, the outcomes of the model of set c as a trainable parameter and direct setting as 100 training are essentially the same. In order to reduce the complexity, here we directly set the value to 100. The ⊕ represents concatenation along the second dimension. Finally, we concatenate the error matrix and intensity vector and obtain the node features .
2.3. Convolutional Neural Networks
Convolutional neural networks play a major role in natural language processing, image classification, and other fields because of their powerful feature-extraction capabilities. The essence of convolution is to filter the signal to extract useful information. In Section 2.2, we construct features for each node. The features reflect the matching information between the theoretical fragment ions and the observed peaks. The node feature is a discrete vector. Here, we use three one-dimensional convolutional layers to extract the features of the nodes, and then input the extracted features to the following graph convolutional neural networks.
2.4. Graph Convolutional Neural Networks
Images and languages belong to the data of European space. The data of European space is characterized by regular structure. However, in real life, there are many irregular data structures; typical examples include graph structures, or topological structures, such as social networks, chemical molecular structures, and knowledge graphs. The spectrum graph constructed in this paper is also a type of graph structure. The structure of a graph is generally very irregular, and it has no translation invariance. The data of this structure make the traditional CNN and RNN invalid. The GCN solves this problem well. It designs a method to extract features from graph data, so that we can use these features to perform node classification, graph classification, and so on [28,29,30,31]. Here we have:
where is the adjacency matrix of the spectrum graph with added self-connections, I is an identity matrix, and is the degree matrix of , in which h . The is a trainable-weight matrix. The σ(·) denotes the activation function, such as ReLU. The is the matrix of activations in the layer; .
2.5. Denovo-GCN Network
Figure 2 describes the network architecture of Denovo-GCN. For the input spectrum, Denovo-GCN regards peaks as nodes and constructs a spectrum graph. At the same time, Denovo-GCN calculates the features matrix X of the nodes. The network layers mainly include two parts, CNN model and GCN model. The CNN model uses three layers of one-dimensional convolution to extract node features. The GCN model uses two GCN layers to aggregate the features of first-order neighboring nodes. Finally, the predicted amino acids are output through three linear layers and a Softmax layer.
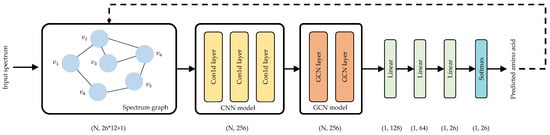
Figure 2.
Denovo-GCN network architecture.
Similar to DeepNovo, in the process of iteratively predicting amino acids to obtain peptide sequences, we also use the knapsack dynamic-programming algorithm to limit the search space. When predicting the next amino acid, the amino acid with the highest probability is sometimes not the real next amino acid. This is because for a given precursor ion mass, if the amino acid with the highest probability does not match the precursor ion mass, it is obviously the incorrect amino acid. Given the peptide mass and the prefix mass, Denovo-GCN calculates the suffix mass and uses the knapsack dynamic-programming algorithm to filter out the amino acids with masses that do not fit the suffix mass. The predicted amino-acid sequence has the correct precursor ion mass.
2.6. Data Sets and Evaluation Metrics
We use the nine-species benchmark data set and evaluation framework first introduced by DeepNovo. The nine datasets were acquired from the Thermo Scientific Q-Exactive with the HCD technique. All the original data were first searched against the UniProt database by PEAKS DB software (version 8.0) [32] with a false-discovery rate of 1%. A total of about 1.5 million peptide-spectrum matches (PSMs) were obtained. We use the same cross-species evaluation scheme used by DeepNovo, in which eight data sets are used for training and a remaining data set is used for testing. This cross-species evaluation framework is widely used to evaluate the performance of de novo peptide sequencing, because the peptides in the training set are almost completely separated from the peptides of the remaining species. Most practical applications of de novo peptide sequencing use it to directly infer a peptide sequence that has never been seen.
We calculated the amino-acid precision, amino-acid recall, and peptide recall. A predicted amino acid matched a real amino acid if their mass difference was smaller than 0.1 Da and if the prefix masses before them varied by less than 0.5 Da. If the total number of matched amino acids was equal to the total length of the peptide sequence, the peptide sequence was recalled. This is also the evaluation metric adopted by DeepNovo. The is defined as the total number of matched amino acids. The is defined as the total number of predicted amino acids. The is defined as the total number of correctly predicted peptide sequences. The is defined as the number of all peptides in the test set. To evaluate the success of the model, we calculate three performance criteria:
In addition, we describe the precision-recall curve by sorting the prediction results according to the confidence score provided by the model. At the same time, we calculate the area under the precision-recall curve. Finally, we provide the overall calculation process in Figure 3.
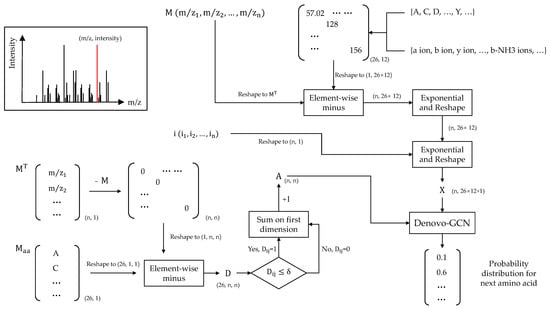
Figure 3.
Calculation process.
3. Results
We used the previously described data sets and performance metrics to evaluate Denovo-GCN and compared it with the neural-network-based method, DeepNovo. For a fair comparison with DeepNovo, we set the same post-translational modifications (PTMs), including the fixed-modification carbamidomethylation of C, variable modification oxidation of M, and deamidation of NQ. To characterize the performance of DeepNovo, we relied on the results published in a previous article [15].
Figure 4 shows the total precision and recall of DeepNovo and Denovo-GCN on nine species datasets. It can be seen that Denovo-GCN is better than DeepNovo. Denovo-GCN outperformed DeepNovo, with mean improvements of 0.023 and 0.028 in amino-acid precision and recall, respectively. Figure 4c shows that Denovo-GCN outperforms DeepNovo with a mean improvement of 0.068 in peptide recall.
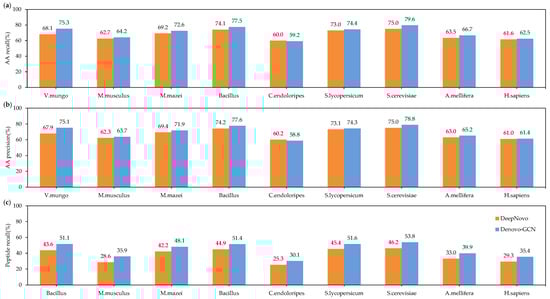
Figure 4.
(a) Amino-acid-recall comparisons between Denovo-GCN and DeepNovo on the nine species data. (b) Amino-acid-precision comparisons between three types of software on the nine species data. (c) Comparisons between three types of software on the nine species data.
It is important to note that on the Candidatus endoloripes (C. endoloripes) dataset, Denovo-GCN performed somewhat worse than DeepNovo in precision and recall for amino acids, although it displayed a substantially greater peptide recall than DeepNovo. This demonstrates that while DeepNovo can recall more amino acids for a peptide sequence than Denovo-GCN, the latter can recall the right peptide sequence. This occurs due to the close proximity of the mass of an individual amino acid or to the combination of two amino acids in a peptide sequence. For example, the masses of N (deamidation; asparagine with deamidation modification, 115.02695) and D (aspartic acid, 115.02694) were quite close to each other, as were those of AG (alanine and glycine, 128.05857) and Q (glutamine, 128.05858). In consideration of three variable modifications (deamidation on NQ, oxidation on M), there are 177 cases mentioned above. Therefore, DeepNovo can recall most amino acids for a peptide sequence, but it is not good as Denovo-GCN at distinguishing these amino acids or amino-acid combinations with very similar masses. Since biologists usually prefer to obtain a complete and correct peptide sequence rather than a portion of the right peptide sequence, this is an advantage in practical applications.
We performed a more detailed analysis of the test results from Denovo-GCN and DeepNovo on the C. endoloripes dataset. The test results from both methods were split into three groups: correct peptides, incorrect peptides due to interchange of two amino acids or isobaric combination of amino acids, and other incorrect peptides. Although there was no significant increase or decrease in the proportion of correct peptides and other incorrect peptides, as shown in Figure 5a, it can be seen from Figure 5b that the number of correct peptides identified by Denovo-GCN alone was 12,199, which is more than two times that of DeepNovo. We selected the false peptides with one or two amino acids determined by DeepNovo and Denovo-GCN. It can be seen from Figure 5c that among them, about 27% of the peptides from the Denovo-GCN gave the correct sequence. Although this is still a small proportion, it was twice that of the DeepNovo. This proves that Denovo-GCN is better than DeepNovo at recalling complete and correct peptide sequences.
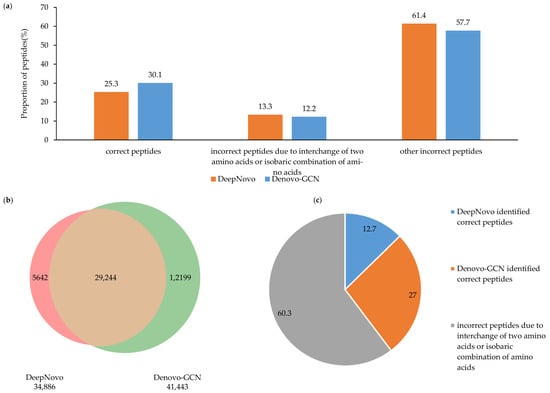
Figure 5.
(a) DeepNovo- and Denovo-GCN-identified number distributions of spectra of different types of peptide. (b) The Venn diagram of correct peptides identified by DeepNovo and Denovo-GCN. (c) The proportion of correct peptides identified by DeepNovo and Denovo-GCN, respectively.
In order to evaluate the performances of Denovo-GCN and DeepNovo better, we describe the precision-recall curve on nine species datasets. The curves were computed by sorting the predicted peptides according to their confidence scores. For the amino-acid-level curves, all the amino acids within a given peptide received equal scores. It can be seen from Figure 6 that the curve of the Denovo-GCN was generally above that of the DeepNovo curve. At the same time, we calculated the area under the precision-recall curve at the amino-acid level and the peptide level, respectively. Figure 7 shows the AUC comparison of DeepNovo and Denovo-GCN on nine species datasets. The Denovo-GCN showed a mean improvement of 0.095 and 0.05 relative to the DeepNovo in peptide level and amino-acid level.
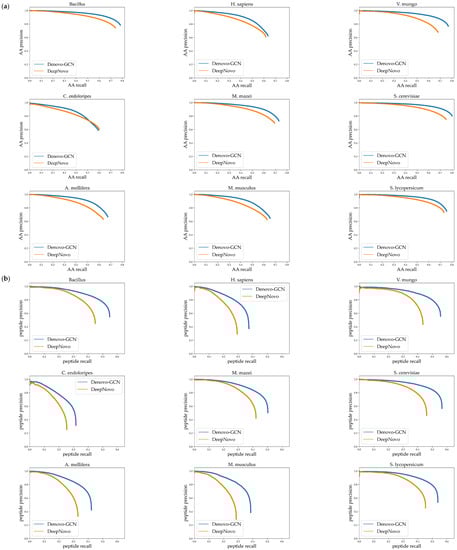
Figure 6.
(a) Precision-recall curves for amino acids on nine species data sets. (b) Precision-recall curves for peptides on nine species.
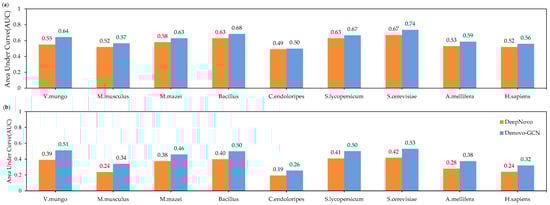
Figure 7.
The areas under precision-recall curves of DeepNovo and Denovo-GCN on nine high-resolution datasets. (a) AUCs at amino-acid level. (b) AUCs at peptide level.
Figure 8 shows four specific examples of fragment ions and peptide-sequence-matching results. In these four examples, Denovo-GCN identified the correct peptide sequence, while DeepNovo identified the false peptide sequence. We matched the fragment ions and peptide sequences. The more fragment ions were labeled, the better the result of the peptide-spectrum matching. We matched the fragment ions for all the peptide sequences.
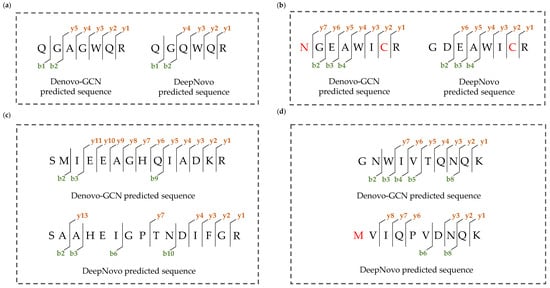
Figure 8.
Specific examples of fragment ions and peptide-sequence-matching results. (a) DeepNovo predicted an incorrect peptide due to isobaric combination of amino acids and Denovo-GCN predicted correct peptide. (b) DeepNovo predicted an incorrect peptide due to interchange of two amino acids and similar amino acid mass, and Denovo-GCN predicted correct peptide. (c) DeepNovo predicted an almost completely incorrect peptide and Denovo-GCN predicted correct peptide with continuous fragment ions. (d) The peptide sequence predicted by Denovo-GCN has better peptide spectrum matching results and DeepNovo predicted incorrect peptide.
It can be seen from Figure 8a,b that the incorrect peptide sequence was very similar to the correct peptide sequence. This was due to the similar masses of some of the amino acids. DeepNovo cannot distinguish these amino acids with similar masses, but Denovo-GCN can, as well as recalling the correct peptide sequence. Because Denovo-GCN takes into account the relationship between the peaks and the more abundant ion types, it captures the characteristics of y4 ions. As shown in Figure 8c,d, the peptide sequence predicted by DeepNovo was almost completely different from that predicted by Denovo-GCN. The correct peptide sequence had more complete and continuous fragment ions, but the fragment ions matched by DeepNovo were discontinuous and the number was lower than that of Denovo-GCN. It can be seen from the matching of the fragment ions and peptide sequences that Denovo-GCN is better than DeepNovo.
In addition, in order to prove the effectiveness of the GCN model and the CNN model, we conducted ablation experiments on one of the nine species of Bacillus dataset, and calculated the recall at the peptide level using different models. As shown in Figure 9a, in the case of only using the GCN model, the Denovo-GCN model improved the peptide recall by 2.3% compared with DeepNovo. After adding the CNN model, the peptide recall improved by 6.5%. At the same time, we compared the use of different models in different peptide lengths. Figure 9b shows that there were increases in peptide length of 11–15 and 16–20, and the recall improved by 9.6% and 10.5%, respectively.
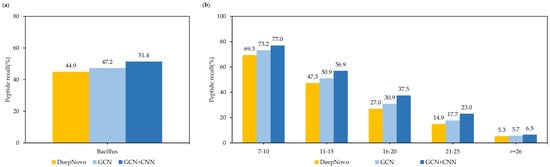
Figure 9.
(a) Comparison of peptide recall of different designs on Bacillus datasets. (b) Comparison of peptide recall of different designs for different peptide lengths on Bacillus datasets.
4. Discussion
Among the existing de novo peptide-sequencing methods, the methods based on spectrum graphs need to design a scoring function. The information taken into account by the scoring function is not comprehensive due to the complexity and diversity of tandem-mass-spectrum data, making it challenging to recall the correct peptide sequences. At present, the method based on deep learning is mainly used to extract features directly from spectrum, but does not consider the correlation between peaks, and the spectrum needs to be vectorized into a very large vector in order to be applied to high-resolution spectrum data. Based on these problems, we proposed Denovo-GCN, which applies graph convolutional neural networks to de novo peptide sequencing for the first time, and combines convolutional neural networks for feature extraction. Finally, an end-to-end training-and-testing framework was completed.
First of all, we compared Denovo-GCN with DeepNovo, which also uses deep learning from de novo sequencing, on the standard benchmark data set. Our experiments show that Denovo-GCN is better than DeepNovo at amino-acid precision and recall and peptide recall. In addition, in order to compare the two methods in more detail, we described the precision-recall curve and closely analyzed the differences between their results. Denovo-GCN has advantages in distinguishing similar peptide sequences, recalling more complete and correct peptide sequences instead of recalling parts of the peptide sequence.
Graph convolutional neural networks can combine the method of spectrum graphs with the method of deep learning. This paper presented the first attempt in this area, with excellent results. The graph convolutional neural networks are based on the adjacency matrix to aggregate the features of the first-order neighboring nodes. However, the features of adjacent spectral peaks can aggregate, which we need to explore in future research. The question of how to better combine the method of spectrum graphs with the method of deep learning is worthy of further exploration by researchers.
Author Contributions
Conceptualization, H.W.; methodology, H.W. and R.W. (Ruitao Wu); software, R.W. (Ruitao Wu); validation, R.W. (Ruitao Wu) and H.W.; formal analysis, H.W., R.W. (Ruitao Wu); investigation, R.W. (Ruitao Wu). and X.Z.; resources, H.W.; data curation, R.W. (Ruitao Wu), X.Z. and R.W. (Runtao Wang); writing—original draft preparation, R.W. (Ruitao Wu); writing—review and editing, H.W.; visualization, R.W. (Ruitao Wu); supervision, H.W.; project administration, H.W.; funding acquisition, H.W. All authors have read and agreed to the published version of the manuscript.
Funding
Support Program for Outstanding Youth Innovation Teams in Higher Educational Institutions of Shandong Province (2019KJN048).
Institutional Review Board Statement
Not applicable.
Informed Consent Statement
Not applicable.
Data Availability Statement
All training and testing datasets can be downloaded from the link provided by DeepNovo [15]. The source data can be downloaded from the ProteomeXcharge (link: http://www.proteomexchange.org/) with the accession number PXD005025, PXD004948, PXD004325, PXD004565, PXD004536, PXD004947, PXD003868, PXD004467, PXD004424.
Conflicts of Interest
The authors declare no conflict of interest. The funders had no role in the design of the study; in the collection, analyses, or interpretation of data; in the writing of the manuscript, or in the decision to publish the results.
References
- Sakurai, T.; Matsuo, T.; Matsuda, H.; Katakuse, I. PAAS 3: A computer program to determine probable sequence of peptides from mass spectrometric data. J. Mass Spectrom. 1984, 11, 396–399. [Google Scholar] [CrossRef]
- Ishikawa, K.; Niwa, Y. Computer-aided peptide sequencing by fast atom bombardment mass spectrometry. J. Mass Spectrom. 1986, 13, 373–380. [Google Scholar] [CrossRef]
- Yates, J.R.; Griffin, P.; Hood, L.; Zhou, J. Computer-Aided Interpretation of Low-Energy MS/MS Mass-Spectra of Peptides. Tech. Protein Chem. Second edition. 1991, 46, 477–485. [Google Scholar]
- Tran, N.H.; Rahman, M.Z.; He, L.; Xin, L.; Shan, B.; Li, M. Complete de novo assembly of monoclonal antibody sequences. Sci. Rep. 2016, 6, 1–10. [Google Scholar] [CrossRef]
- Faridi, P.; Li, C.; Ramarathinam, S.H.; Vivian, J.P.; Illing, P.T.; Mifsud, N.A.; Ayala, R.; Song, J.; Gearing, L.J.; Hertzog, P.J.; et al. A subset of HLA-I peptides are not genomically templated: Evidence for cis- and trans-spliced peptide ligands. Sci. Immunol. 2018, 3, eaar3947. [Google Scholar] [CrossRef] [PubMed]
- Jumper, J.; Evans, R.; Pritzel, A.; Green, T.; Figurnov, M.; Ronneberger, O.; Tunyasuvunakool, K.; Bates, R.; Žídek, A.; Potapenko, A.; et al. Highly accurate protein structure prediction with AlphaFold. Nature 2021, 596, 583–589. [Google Scholar] [CrossRef]
- Laumont, C.M.; Vincent, K.; Hesnard, L.; Audemard, É.; Bonneil, É.; Laverdure, J.-P.; Gendron, P.; Courcelles, M.; Hardy, M.-P.; Côté, C.; et al. Noncoding regions are the main source of targetable tumor-specific antigens. Sci. Transl. Med. 2018, 10, eaau5516. [Google Scholar] [CrossRef]
- Taylor, J.A.; Johnson, R.S. Implementation and uses of automated de novo peptide sequencing by tandem mass spectrometry. Anal. Chem. 2001, 73, 2594–2604. [Google Scholar] [CrossRef]
- Taylor, J.A.; Johnson, R.S. Sequence database searches via de novo peptide sequencing by tandem mass spectrometry. Rapid Commun. Mass Spectrom. 1997, 11, 1067–1075. [Google Scholar] [CrossRef]
- Johnson, R.S.; Taylor, J.A. Searching sequence databases via de novo peptide sequencing by tandem mass spectrometry. Methods Mol. Biol. 2002, 22, 301–315. [Google Scholar] [CrossRef]
- Fernandez-de-Cossio, J.; Gonzalez, J.; Betancourt, L.; Besada, V.; Padron, G.; Shimonishi, Y.; Takao, T. Automated interpretation of high-energy collision-induced dissociation spectra of singly protonated peptides by ‘SeqMS’, a software aid for de novo sequencing by tandem mass spectrometry. Rapid Commun. Mass Spectrom. 1998, 12, 1867–1878. [Google Scholar] [CrossRef]
- Dančík, V.; Addona, T.A.; Clauser, K.R.; Vath, J.E.; Pevzner, P.A. De Novo Peptide Sequencing via Tandem Mass Spectrometry. J. Comput. Biol. 1999, 6, 327–342. [Google Scholar] [CrossRef]
- Frank, A.; Pevzner, P. PepNovo: De novo peptide sequencing via probabilistic network modeling. Anal. Chem. 2005, 77, 964–973. [Google Scholar] [CrossRef]
- Grossmann, J.; Roos, F.F.; Cieliebak, M.; Lipták, Z.; Mathis, L.K.; Müller, M.; Gruissem, W.; Baginsky, S. AUDENS: A tool for automated peptide de novo sequencing. J. Proteome Res. 2005, 4, 1768–1774. [Google Scholar] [CrossRef] [PubMed]
- Chi, H.; Sun, R.-X.; Yang, B.; Song, C.Q.; Wang, L.H.; Liu, C.; Fu, Y.; Yuan, Z.-F.; Wang, H.-P.; He, S.-M.; et al. pNovo: De novo peptide sequencing and identification using HCD spectra. J. Proteome Res. 2010, 9, 2713–2724. [Google Scholar] [CrossRef]
- Chi, H.; Chen, H.; He, K.; Wu, L.; Yang, B.; Sun, R.-X.; Liu, J.; Zeng, W.-F.; Song, C.-Q.; He, S.-M.; et al. pNovo+: De novo peptide sequencing using complementary HCD and ETD tandem mass spectra. J. Proteome Res. 2013, 12, 615–625. [Google Scholar] [CrossRef]
- Ciresan, D.; Giusti, A.; Gambardella, L.M.; Schmidhuber, J. Deep neural networks segment neuronal membranes in electron microscopy images. Neural Inf. Process. Syst. 2012, 25, 2843–2851. [Google Scholar]
- Krizhevsky, A.; Sutskever, I.; Hinton, G. ImageNet classification with deep convolutional neural networks. Neural Inf. Process. Syst. 2012, 25, 1097–1105. [Google Scholar] [CrossRef]
- Sutskever, I.; Vinyals, O.; Le, Q. Sequence to sequence learning with neural networks. Neural Inf. Process. Syst. 2014, 27, 3104–3112. [Google Scholar]
- Karpathy, A.; Li, F.F. Deep Visual-Semantic Alignments for Generating Image Description. In Proceedings of the Computer Vision and Pattern Recognition, Boston, MA, USA, 7–12 June 2015; pp. 3128–3137. [Google Scholar]
- Vinyals, O.; Toshev, A.; Bengio, S.; Erhan, D. Show and tell: A Neural Image Caption Generator. In Proceedings of the Computer Vision and Pattern Recognition, Boston, MA, USA, 7–12 June 2015; pp. 3156–3164. [Google Scholar]
- Ma, B. Novor: Real-Time Peptide de Novo Sequencing Software. J. Am. Soc. Mass Spectrom. 2015, 11, 1885–1894. [Google Scholar] [CrossRef]
- Ma, B.; Zhang, K.; Hendrie, C.; Liang, C.; Li, M.; Doherty-Kirby, A.; Lajoie, G. PEAKS: Powerful software for peptide de novo sequencing by tandem mass spectrometry. Rapid Commun. Mass Spectrom. 2003, 17, 2337–2342. [Google Scholar] [CrossRef]
- Tran, N.H.; Zhang, X.; Lei, X.; Shan, B.; Ming, L. De novo peptide sequencing by deep learning. Proc. Natl. Acad. Sci. USA 2017, 114, 8247–8252. [Google Scholar] [CrossRef]
- Muth, T.; Renard, B.Y. Evaluating de novo sequencing in proteomics: Already an accurate alternative to database-driven peptide identification? Brief Bioinform. 2018, 19, 954–970. [Google Scholar] [CrossRef]
- Qiao, R.; Tran, N.H.; Xin, L.; Chen, X.; Li, M.; Shan, B.; Ghodsi, A. Computationally instrument-resolution-independent de novo peptide sequencing for high-resolution devices. Nat. Mach. Intell. 2021, 3, 420–425. [Google Scholar] [CrossRef]
- Thomas, N.K.; Welling, M. Semi-Supervised Classification with Graph Convolution Networks. In Proceedings of the Machine Learning. Palais des Congrès Neptune, Toulon, France, 9 September 2016. [Google Scholar] [CrossRef]
- Hamilton, W.L.; Ying, R.; Leskovec, J. Inductive representation learning on large graphs. Neural Inf. Process. Syst. (NIPS) 2017. [Google Scholar]
- Veličković, P.; Cucurull, G.; Casanova, A.; Romero, A.; Liò, P.; Bengio, Y. Graph Attention Networks. In Proceedings of the Machine Learning, Vancouver, BC, Canada, 4 February 2018. [Google Scholar]
- Guo, K.; Wang, P.; Shi, P.; He, C.; Wei, C. A New Partitioned Spatial–Temporal Graph Attention Convolution Network for Human Motion Recognition. Appl. Sci. 2023, 13, 1647. [Google Scholar] [CrossRef]
- Wan, H.; Tang, P.; Tian, B.; Yu, H.; Jin, C.; Zhao, B.; Wang, H. Water Extraction in PolSAR Image Based on Superpixel and Graph Convolutional Network. Appl. Sci. 2023, 13, 2610. [Google Scholar] [CrossRef]
- Bioinformatics Solutions Inc. PEAKS Studio, Version 8.0; Bioinformatics Solutions Inc.: Waterloo, ON, Canada, 2017. [Google Scholar]


Disclaimer/Publisher’s Note: The statements, opinions and data contained in all publications are solely those of the individual author(s) and contributor(s) and not of MDPI and/or the editor(s). MDPI and/or the editor(s) disclaim responsibility for any injury to people or property resulting from any ideas, methods, instructions or products referred to in the content. |
© 2023 by the authors. Licensee MDPI, Basel, Switzerland. This article is an open access article distributed under the terms and conditions of the Creative Commons Attribution (CC BY) license (https://creativecommons.org/licenses/by/4.0/).