Abstract
The automated detection of distress such as cracks or potholes is a key basis for assessing the condition of pavements and deciding on their maintenance. A fine-grained pavement distress-detection algorithm based on integrated data using a digital twin is proposed to solve the challenges of the insufficiency of high-quality negative samples in specific scenarios An asphalt pavement background model is created based on UAV-captured images, and a lightweight physical engine is used to randomly render 5 types of distress and 3 specific scenarios to the background model, generating a digital twin model that can provide virtual distress data. The virtual data are combined with real data in different virtual-to-real ratios (0:1 to 5:1) to form an integrated dataset and used to fully train deep object detection networks for fine-grained detection. The results show that the YOLOv5 network with the virtual-to-real ratio of 3:1 achieves the best average precision for 5 types of distress (asphalt pavement MAP: 75.40%), with a 2-fold and 1.5-fold improvement compared to models developed without virtual data and with traditional data augmentation, respectively, and achieves over 40% recall in shadow, occlusion and blur. The proposed approach could provide a more reliable and refined automated method for pavement analysis in complex scenarios.
1. Introduction
Road construction is the basis for a country’s economic development, and road transport allows for the exchange of resources. During road operation, the climate, environment and age may cause pavements to crack and potholes and other symptoms of distress to develop continuously. The presence of these distress features not only reduces the serviceability and shortens the service life of pavement, but also can even lead to the collapse or failure of the pavement structure, seriously threatening the safety of road traffic [1,2]. Timely and accurate detection of the type and amount of disease is a key basis for the assessment of pavement conditions and deciding what maintenance is required [3].
The detection of pavement distress has developed from manual visual inspection to automated inspection based on machine vision [4]. Thanks to the widespread use of UAVs and pavement digital inspection vehicles, automated machine vision-based pavement-distress inspection methods have improved in accuracy and efficiency compared to manual visual inspections, which are highly subjective and costly [5,6,7,8]. Machine vision-based methods for automatic pavement-distress detection mainly consist of image processing, machine learning, and deep learning. Among these, image processing methods, represented by edge detection, threshold segmentation, and region growing use heuristic rules to distinguish distressed areas of pavement from normal areas [9,10,11,12]. Since these heuristic rules rely on manual design, they can only handle shallow features and are poorly adapted to complex detection scenarios such as noise and uneven lighting [13]. Machine learning approaches are based on training classifiers such as support vector machines (SVM), naive Bayesian classifiers (NBC), and artificial neural networks (ANN) to identify different types of pavement distress by learning limited and perceptible features [14,15,16,17]. Xu et al. [18] used and revised the BP neural network for pavement surface crack image processing and utilized the self-studying feature of the network to identify cracks. Wang et al. [19] proposed three SVM models for classifying five types of pavement cracks to intelligently identify cracking types in an automated manner. These methods convert image recognition to probabilistic assessment; However, the extraction of these features also relies on prior knowledge and engineering experience, which inevitably reflect the high specificity, low generality and complexities of image processing-based techniques [20,21]. Furthermore, pavement distress images have the characteristics of small differences between the background and the target, and are always with noise, making feature recognition difficult. Also, it is difficult to guarantee the accuracy and consistency of detection results for pavement crack images with a complex topology, which require some targeted and refined algorithms to be designed for specific scenarios.
The representatives of deep learning methods, convolutional neural networks (CNN), can automatically extract rich, highly abstracted features from the inspection data to achieve the accurate detection of pavement distress [22,23,24,25,26,27,28]. Xiao [29] proposed a CrackFormer framework for pavement-crack detection, which employs a transformer-based high-resolution network architecture to gain a multi-scale feature semantics of cracks, achieving an overall precision exceeding 90% as tested on seven crack datasets. Gopalakrishnan et al. [8] transferred the parameters and fine-grained the last layers of the VGG-16 DCNN pre-trained on the ImageNet to solve the crack detection problem of an asphalt and concrete pavement, a process that achieved excellent detection results in a classification study. Zhang et al. [30] designed a CrackNet model to detect cracks in 3D asphalt pavements based on images captured by pavement digital inspection vehicles, resulting in an increase in accuracy of over 20% compared to conventional 3D shadow modelling and the HOG feature-based SVM method. Zhu et al. [31] identified six types of damage quickly and accurately from a high-quality pavement distress dataset collected by UAVs based on a fully trained YOLOv3 network. This method adapted well to interference from environmental factors such as shadows, trees and pavement markings. Kim et al. [32] transferred the R-CNN model to effectively identify and quantify cracks of bridges captured by UAVs. Li et al. [33] introduced the DenxiDeepCrack method to automatically detect pavement cracks based on UAV images by assessing high-level feature representations. Liu et al. [34] proposed an image enhancement algorithm for the detection of road tunnel cracks, using road crack images to address the problem of insufficient image datasets for cracks on road tunnel surfaces. However, the accuracy and reliability of deep learning-based pavement-distress detection methods are highly dependent on the adequacy of large-scale, high-quality datasets, which often pose high acquisition costs [35]. In particular, the difficulty of obtaining timely negative samples for specific working conditions severely hampers the application of deep learning methods in automated pavement-distress detection [36]. Although some open- access datasets containing common pavement distresses provide sufficient negative samples, most of these datasets are high-quality images collected in the laboratory under specific scenarios, providing monotonous backgrounds, uniform illumination and clear imaging. However, existing deep learning models have to deal with some low-quality on-site acquisition data in practical detections. Interference scenario similar to cracks or potholes, uneven illumination and noise can significantly reduce the accurate assessment of distress from the background, and there is hardly an optimal deep-learning model that can extract the most discriminative features from low-quality images with limited negative samples to accurately identify cracks.
Accordingly, this paper proposes a fine-grained pavement-distress detection method based on digital twin integrated data. The UAV-based asphalt pavement background model is first established; then a lightweight physics engine is used to render different types of pavement distress and specific working conditions on the background model, generating a digital twin model that reflects the distressed condition of the pavement, simulating the camera parameters and flight path of the UAV to obtain a virtual dataset with rich distress characteristics. These findings are finally mixed with the initial small sample dataset collected by the UAV in different proportions to obtain an integrated dataset. The integrated dataset is used to fully train the deep-object detection network to achieve refined detection of pavement distress under complex working conditions.
The remainder of the paper is organized as follows: Section 2 critically reviews the techniques associated with the proposed approach. Section 3 systematically presents the framework and network structure of the proposed fine-grained method. Section 4 explains the experimental settings and evaluation metrics. Section 5 discusses the experimental results and compares and evaluates them with existing approaches, followed by the concluding remarks in Section 6.
2. Related Work
This section critically reviews the studies associated with the proposed fine-grained distress detection method. One of the main challenges encountered in deep learning-based damage analysis is the scarcity of abundant, high-quality negative samples in specific regions and environmental conditions. Over the past decade, researchers have experienced great success in using synthetic images to help train deep neural networks to solve a variety of problems. Two effective approaches for tackling this challenge are performing few-shot learning (FSL) with limited data and creating physics-based virtual models based on entities to generate labeled data required for training.
2.1. Few-Shot Learning
Few-shot learning is also called one-shot learning, which aims at achieving a knowledge transfer by assessing the similarities and differences between previous and new categories with very little data, enabling the trained model to classify new categories with a high degree of accuracy. In general, few-shot learning techniques can be classified into three categories: hallucination-based data argumentation, meta-learning, and metric-learning. Data augmentation techniques are used to generate additional training data by synthesizing new examples from existing ones. The generative-model-based augmentation method has attracted significant attention in recent times (as with a generative adversarial network (GAN) or a variational autoencoder (VAE)) to assess data distribution to generate new images that are similar in style and content to the original images. Subedi et al. [37] built the f-DAGAN model to generate realistic images, which showed the feasibility of synthesized data generation based on adversarial training in few-shot learning, where a few hard data can lead to sound results. Chen et al. [38] proposed a new hierarchical graphical neural network (HGNN) for FSL, which can keep hierarchical correlations among nodes and extract the discriminative features of categories from individual samples. Episodic training based on the signal of node losses is utilized to update parameters, resulting in a well-generalizable model that can accurately identify new classes with limited labeled data. Wu et al. [39] used focal loss instead of cross-entropy loss to help assess the sample relationship through using different penalty factors on the object and its background to optimize the model trained by imbalanced data with a few negative samples. The objective of metric learning is to learn a function that maps similar examples more closely to each other and dissimilar examples farther apart in a high-dimensional feature space. Duan et al. [40] developed a deep adversarial metric learning (DAML) method for producing synthetic hard negatives from the observed negative examples, which can serve as additional training data for evaluation. Wang et al. [41] employed multiple deep learning models to predict the width of cracks in a dam and analyzed the significance of influential factors in crack formation. These works indicate that the integration of deep learning models with appropriate targets is successful in learning the similarities. Meta-learning few-shot focuses on training models to quickly learn new concepts with limited training examples to lead to comprehensive understanding acquired through learning diverse assignments and generalizing acquired knowledge to new tasks. Dong et al. [42] proposed a novel pavement detection based on the metric learning approach, which can lead to developing new categories from a few labeled images. The approach incorporates a new metric loss function to encourage the proximity of similar samples and separation of dissimilar samples and leverages cosine similarity between the support and test sets to infer new pavement-distress categories. Xu et al. [43] proposed an embedded internal-attribute-based meta-learning classification model for structural damage identification through learning the common inter-class damage attributes, which achieves better performance compared with supervised learning.
The above few-shot learning methods successfully use a limited quantity of preparatory information to deal with a learning model. However, the models often fall short of expectation when trained with limited shot information, so that numerous tasks for training are required. This is costly and sometimes fails because of the instability of information across different undertakings.
2.2. Physics-Based Virtual Models
Developing physics-based virtual models to generate distress across complex scenarios is an effective way for driving pixel-level deep learning models to extract more discriminative features when deployed in practice. Hoskere et al. [44] developed texture- graphical models of virtual inland shipping infrastructure and demonstrated that synthesizing labeled data has the effect of training deep-learning models for damage detection. Hoskere et al. [45] also pointed out that synthesizing virtual cracks based on nonlinear finite element models leads to a 10% improvement in IoU of pixel-level deep learning models compared with using only real data. Pyle et al. [46] used efficient hybrid finite elements (FE) and ray-based simulation to train CNNs for characterizing real cracks in a refined manner. Hakim et al. [47] generated vibration data used to train ANN through experimental modal analysis and finite element modeling, which improved the accuracy of the prediction results of the damage severity and the location of I-beam structures. Siu et al. [48] used the game engine to generate sewer pipe damage in virtual environments with different lighting and camera angles, which allowed an average improvement of 5.8% in AP of Faster RCNN compared with using only real data. Xu et al. [49] proposed the Synthetic Object IMPLantation (SIMPL) method to create abundant synthetic overhead training data for specific target objects by superimposing 3-D object models onto real-world overhead imagery within a virtual environment. Richter et al. [50] proposed an approach to fast-produce pixel-level labels for synthesized images in computer games to supplement real-world data. This resulted in a significant increase in accuracy and a reduction of the amount of manual labelling work required. Renderings of object models have been used to study and understand the sensitivity of CNN process-specific features in images [51,52].
However, adequate training on virtual data generated by finite element models does not directly mean good generalization to real data in complex scenarios. Although various finite-element models enable accurate simulation of an arbitrary number of various crack types of different material properties with almost no acquisition cost, the difference between virtual and real crack features is also a key factor that results in the reduced robustness of deep learning when deployed in practice. The digital twin method is a digitized mirror of physical entities based on sensor data and physical models and establishes a highly self-updating and on-site responsive digital twin (DT) to support decision-making activities throughout the lifecycle of physical entities. The method has characteristics such as high fidelity and interoperability. Digital twin models based on physical entities, virtual entities, and the interaction between them enable 3D dynamic perception for infrastructure damage states with a higher degree of simulation [53,54]. A large number of researchers have used monitoring and inspection data of structures to build full life-cycle digital twin models, which have been explored in industrial manufacturing and some civil engineering fields. Tuegel et al. [55] developed a digital twin model with ultrahigh fidelity for aircraft components to study the evolution of structural deformation and damage under different flight conditions. Shim et al. [56] developed a 3D prestressed concrete bridge digital twin model based on a damage code system to identify the damaged state of a bridge and predict its development. Karve et al. [57] used digital twin models to analyze historical data on the damaged state of infrastructure to predict future developments, reducing the interference of noisy or erroneous data. Booyse et al. [58] used deep learning to extract historical data features to develop digital twin models for fault detection, diagnosis, and evolutionary mechanism mining. Aivaliotis et al. [59] demonstrated that the use of digital twin models for the in-depth analysis of structural damage states and development mechanisms is a key route to predictive maintenance. The generated data based on digital twin models not only reproduces the actual damage characteristics realistically, but also simulates a variety of structural scenarios compared with finite-element models set up in specific boundary conditions.
3. Methodology
This paper proposes a refined pavement distress detection method based on the digital twin model and deep-object detection algorithms. The method consists of two stages: the generation of an integrated digital twin-based pavement distress dataset and the refined detection of deep object network-based pavement distress detection method. In the first stage, the digital twin model is generated by a UAV-based pavement background modelling and a virtual disease rendering based on a lightweight physics engine and is used to simulate the damaged state of the pavement. The virtual inspection data generated by the digital twin model is integrated with the small-scale real data captured by the UAV in a certain proportion to obtain a rich pavement-distress dataset required for training deep learning models. In the second stage, six deep-object detection networks are fully trained based on the integrated dataset for accurate and efficient detection of different types of pavement distress, and the performance of the deep-object detection networks is evaluated in terms of the data integration ratio and complex deployment scenarios. The architecture of the method is shown in Figure 1.
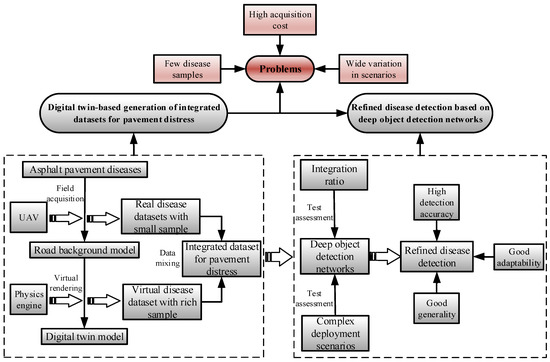
Figure 1.
Total architecture of refined detection algorithm for asphalt pavement distress based on integrated data using digital twin.
3.1. Digital Twin-Based Generation of Integrated Dataset for Pavement Distress
The digital twin-based integrated data generation consists of four modules: on-site data collection, original background model construction, digital twin model generation, and pavement distress dataset integration, as shown in Figure 2. First, the UAV is used to collect orthophotos in the road inspection area with a pre-determined route and fixed altitude, while image control points are placed within the inspection area to establish a uniform level and elevation reference surface, eliminating modelling layering or misalignment caused by overlap between UAV take-offs and landings and inspection areas. Second, the matching points of the overlapping images are extracted from the acquired orthophotos, and aerial triangulation is performed to estimate the position of each image and generate a dense point cloud with the position information. An irregular triangular network is then created based on the dense point cloud, and a polygon network is created for the whole inspection area based on the orthophoto stitching results and aerial triangulation results of the image control points, obtaining the digital orthophoto map of the whole inspection area, that is, the pavement background model, which reconstructed background control information of the asphalt pavement. Third, the original pavement background model is imported into an Unreal Engine (UE4.26) for analysis and rendering. UE4.26 is a cross-platform game engine that creates 3D interactive experiences, enabling the visual deployment and interpretation of 3D models in multiple formats. The blueprint of pavement distress from the UE4.26 physics engine is deployed in the original pavement background model for random virtual deployment, while common inspection scenarios (e.g., pavement shadows, foreign object occlusions and focus blurs) are simulated to generate a digital twin model capable of simulating the damaged state of the pavement. Finally, a virtual camera in the UE4.26 physics engine is used for the UAV inspection simulation, and a virtual disease dataset containing transverse cracks, longitudinal cracks, cross cracks, alligator cracks and potholes is created based on the digital twin model. The virtual disease dataset is fused with the small-sample real dataset captured by the UAV in five virtual-to-real ratios (0:1 to 5:1) to obtain the pavement-distress-integrated dataset for the training of the deep-object detection networks.
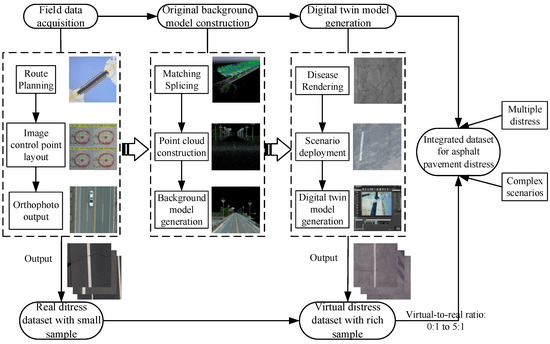
Figure 2.
Flow of integrated dataset generation for asphalt pavement distress based on digital twin.
3.1.1. On-Site Data Collection Based on UAV
The quadrotor UAV (Phantom4 RTK) manufactured by the DJI company is used to capture the asphalt pavement-distress images, and a controllable (pitch angle: −90° to +30°) three-axis head is installed on the bottom of the UAV to hold a high- precision camera for image collection (shown in Figure 3). The selected section of road is a two-way four-lane asphalt road. The optimal flight altitude of the UAV is tested before deployment to ensure the flight stability and area clearance requirements while providing complete coverage of a two-way four-lane road area. In addition, the accuracy of the construction of the digital orthophoto image (pavement background model) is ensured by setting a reasonable flight speed to control the overlap rate of two consecutive images: that is, the minimum overlap rate should be above 80% for frontal overlap and above 75% for lateral overlap, respectively. The parameter setting of the UAV are shown in Table 1.
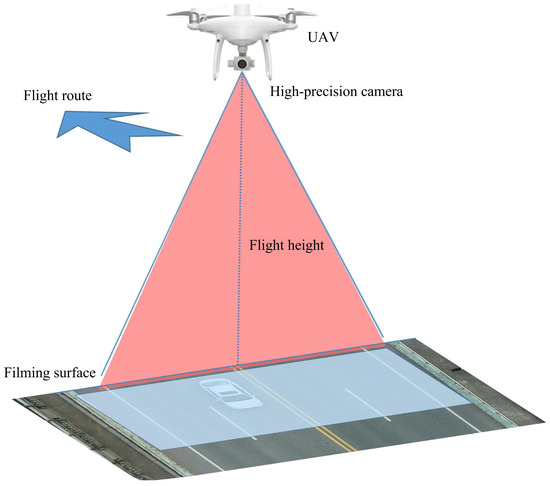
Figure 3.
Schematic diagram of UAV-based image acquisition of asphalt pavement.

Table 1.
Parameters of high-precision cameras used in UAV.
3.1.2. Virtual Distress Rendering Based on a Lightweight Physics Engine
Based on the inspection images collected by the UAV, a Pix4D Mapper is used to perform image stitching, air triangulation, point-cloud creation and polygon-network generation, obtaining a digital orthophoto image of the inspection area (pavement background model). The generated pavement background model (.obj format) was further imported into the UE4.26 physics engine, and a renderer capable of accurately modelling asphalt materials is used to create virtual blueprints of five types of disease (including transverse cracks, longitudinal cracks, cross cracks, alligator cracks, and potholes) based on real pavement distress. These are randomly deployed in the pavement background model, as shown in Figure 4. In addition, complex working scenarios such as shadows, occlusions and blurs are simulated using light and environment renderers in UE 4.26, which are shown in Figure 5. These scenarios are deployed randomly to the pavement background model to generate a digital twin model capable of simulating the damage state of the asphalt pavement.
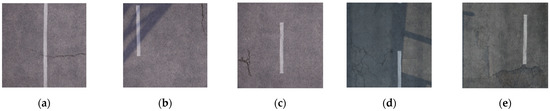
Figure 4.
Schematic diagram of 5 types of virtual pavement distress. (a) Transverse crack. (b) Longitudinal crack. (c) Cross crack. (d) Alligator crack. (e) Pothole.
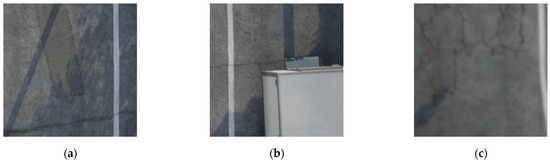
Figure 5.
Schematic diagram of 3 types of virtual pavement distress under complex scenarios. (a) Shadow. (b) Occlusion. (c) Blur.
3.1.3. Integrated Dataset Generation with Different Virtual-to-Real Ratios
The virtual camera in UE4.26 is used for virtual-image acquisition based on the digital twin model, maintaining the same acquisition angle (orthophoto) and image output frame rate as the UAV. The sizes of the virtual pavement images are adjusted into 640 pixels × 640 pixels. Finally, six integrated datasets are constructed based on the real and virtual data of asphalt pavement distress, each including 0, 100, 200, 300, 400, 500 virtual distress images and 100 original real distress images, respectively, as shown in Table 2.
Table 2.
Integrated datasets with different virtual-to-real ratios.
3.2. Fine-Grained Pavement Distress Detection Based on Deep-Object Detection Networks
This paper first trains six typical deep object detection networks using a dataset with a virtual-to-real ratio of 0:1 to reveal the most discriminative network structures for the five different types of pavement distress. The most discriminative deep object detection network is then fully trained using each of the six integrated datasets with virtual-to-real ratios from 0:1 to 5:1, respectively, and evaluated on the same test set to reveal the optimal virtual-to-real ratio of the integrated dataset, which can achieve refined detection of pavement distress with the highest detection accuracy. Finally, the fully trained deep object detection network with two virtual-to-real ratios (0:1 and the optimal ratio) is used to test pavement inspection images under complex deployment scenarios (shadows, occlusions and blurs), respectively, to evaluate their versatility and adaptability to different application conditions.
3.2.1. Image Annotation
The training dataset is not made up by captured images. The original images need to experience a series of labeling operations to turn them into corresponding format data for training. For each image, the objects of interest in the image are manually labeled, such as alligator cracks (AC), cross cracks (CC), longitudinal cracks (LC), potholes (P), and transverse cracks (TC) in the pavement images. The XML files correspond to the target information of the objects of interest in the annotation image, including the target size and type, generally represented with rectangular box boundary coordinates and the label name, respectively. In this paper, the labeling tool (Labelimg) is used to label five different types of pavement distresses into PASCAL VOC format, and each image corresponds to an XML file, which is then converted into a TXT file for model training, and the annotation results are recorded in the txt file. The annotation process is shown in Figure 6.
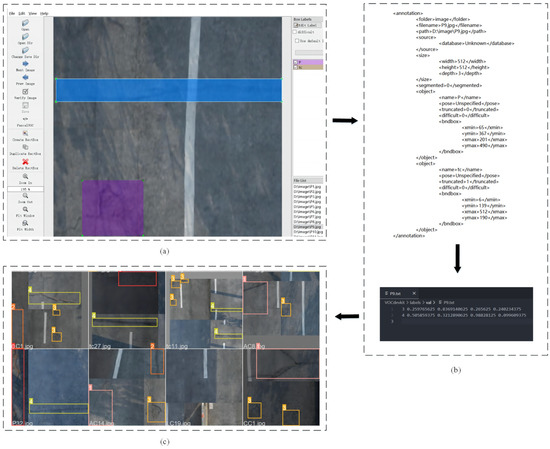
Figure 6.
Images annotation process.(a) Annotation by Labelimg. (b) Convert the XML file to a TXT file. (c) Training results visualization.
3.2.2. Deep Object Detection Network Construction
The objective of this study is to automatically classify and localize pavement distress images based on object detection models. The object detection network is composed of three components: backbone, neck and head. The backbone acts as the main feature extractor, which takes images as input and outputs the corresponding feature maps. Accuracy, speed, and efficiency are the critical metrics in selecting the backbone part. The neck is for collecting different feature maps, such as the representatives: Spatial Pyramid Pooling (SPP), Path Aggregation Network (PAN) and Feature Pyramid Network (FPN). The head is for prediction. There are mainly two typical detectors in head-part naming: the one-stage detector and the two-stage detector, respectively. The two-stage detector goes through a regional proposal network (RPN) during the first stage and experiences a region-of-interest (RoI) pooling network at second stage. The RPN layer feeds region proposals into classifier and regressor for classification and bounding box regression. While the one-stage detector predicts bounding boxes from input images directly without a region-proposal step, the latter combines location regression and classification into a single stage.
3.2.3. YOLOv5 Detector
You only look once (YOLO) [60] is a one-stage object detection system proposed by Redmon et al. to directly predict bounding boxes and the confidence and class probabilities of object from input images, and the quantity of bounding boxes per image predicted is much less than Faster R-CNN, achieving end-to-end real-time detection. YOLOv5 is an enhanced model built on the success of previous versions of YOLO [61], and YOLOv5 has an improvement over Faster R-CNN [62], YOLOv3, and YOLOv4 in terms of accuracy, speed, and simplicity [63,64]. The fundamental principle of YOLOv5 is based on YOLOv4. The biggest feature of YOLOv5 is the use of Focus and a CSP (cross-stage partial connections) [65] backbone network architecture. The focus layer allows for better feature representation while reducing the computation and memory overheads of traditional down sampling methods and achieves better accuracy and faster inference times. The YOLOv5 Focus layer replaces the first three layers of YOLOv3 [66] with a single layer. The CSP layer extends to shallow information in the focus layer to better integrate information across the network’s feature maps. Meanwhile, the feature extraction module is iterated to extract more comprehensive and detailed information [67]. YOLOv5 not only uses CSPNet for the backbone but also uses the same for the neck to fuse different levels of the feature maps compared with YOLOv4. In addition, the feature pyramid part uses a path aggregation network (PANet) [68] for parameter aggregation with the FPN (Feature Pyramid Network) [69]. Furthermore, the bag of freebies (BoF) of YOLOv5 used for training are Mosaic data enhancement, adaptive anchor box calculation and adaptive image scaling. YOLOv5 has four different versions, namely YOLOv5s, YOLOv5m, YOLOv5l, and YOLOv5x, which differ in their memory storage size. However, the underlying principle is the same for all versions, with YOLOv5x having the largest storage size and YOLOv5s having the smallest storage size. We used the most basic YOLOv5s in this experiment. Its structure is shown in Figure 7.
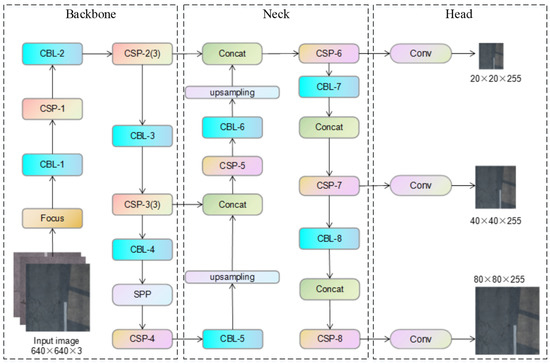
Figure 7.
Structure of YOLOv5 deep object detection network.
3.2.4. Overall Loss
The purpose of training is to optimize the performance of the model, which is achieved by reducing the loss function. The loss function of YOLOv3 is mainly composed of three components: bounding box regression loss, confidence loss and classification loss. The loss function is shown in Equation (1). The bounding box regression loss function usually uses Mean Squared Error (MSE) to directly perform regression on the center point coordinates and height and width of bounding box [70]. The confidence and classification loss function are analyzed by binary cross-entropy loss. Compared with YOLOv3, the loss function of YOLOv5 only innovates in bounding box regression by replacing MSE with CIOU [71], and the other two parts do not change substantially. The CIOU considers the scale information of border overlap, center distance and aspect ratio on the basic of IOU. The CIOU loss function is shown in Equation (2).
where the meaning of is as follows: coordinate location of the box center point, coordinate location of the box center point, weight of the box, and height of the box, respectively. is a symbol that indicates the value is 1 if the box has an object; otherwise it is 0.
In which, and are the weight and height of the ground truth bbox respectively; and h are the weight and height of the prediction box respectively. And and are penalty terms for the aspect ratio, is a positive number and measures the consistency of aspect ratio.
4. Experiment
4.1. Experimental Environment and Hyperparameters
In this paper, we conducted hyperparameter tuning experiments with a GPU as the computational core (CPU: AMD2990WX@3.0GHz, RAM = 64GB; GPU: NVIDIA GeForce RTX 2080Ti), relying on PyTorch 1.2.0 developed by Facebook, and conducted hyperparameter tuning experiments through 10-fold cross-validation on 100 training images and 30 validation images to obtain the best hyperparameters for the YOLOv5 network, as shown in Table 3.
Table 3.
Experimental hyperparameter setting.
4.2. Evaluation Metrics
The mean of the average precision (AP) of all classes of detected objects represents the detection performance of the deep-object detection network. The key to calculating MAP is to calculate Intersection over Union (IoU), which is defined as the degree of overlap between the predicted region and ground truth, and the mathematical expression is shown in Equation (3) and Figure 8.
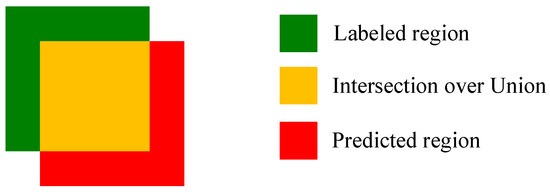
Figure 8.
Schematic diagram of the predicted and labeled regions.
The IoU threshold is usually predefined (set to 0.5 in this paper) and when the IoU between the predicted bounding box and the ground truth bounding box is greater than this threshold, the object within the predicted bounding box is defined as a positive sample. Otherwise it is a negative sample. In addition, the confidence threshold of the prediction-bounding box was also used to determine positive or negative prediction results. True positive (TP) is indicated when the predicted IoU is greater than 0.5 and the prediction result is correct. False positive (FP) is indicated when the predicted IoU is less than 0.5 or the prediction result is incorrect, and false negative (FN) is indicated when there is no IoU with an annotated bounding box, indicating that the model is unable to detect any object labels from the manual annotation.
Precision and Recall can be further determined based on the above metrics. Precision is defined as the proportion of correctly detected objects to the total number of detections, and Recall is defined as the proportion of correctly detected objects to the total number of actual objects. The mathematical expressions are shown in Equations (4) and (5). The P-R curve can be obtained by calculating the accuracy and recall of the YOLOv5 network on the test set at different confidence thresholds, and the value of AP is obtained by integrating the P-R curve, which represents the area enclosed by the P-R curve and the coordinate axis. The MAP is obtained by calculating the average value of AP for each category of test object, and the mathematical expression is shown in Equation (6).
where is the category of the test object.
5. Results and Discussion
5.1. Model Comparison
The dataset is divided into two parts: training set and test set. The training set is used to train the weight parameters of the model, and the test set is used to evaluate the performance of the model. Five typical deep-object detection networks (YOLOv3, YOLOv5, YOLOv7, YOLOX and Faster R-CNN) are fully trained, using an asphalt pavement-distress dataset (100 training images) with a real-to-virtual ratio of 0:1, and the models are tested based on the test set (30 test images) to reveal the most discriminative network structure for asphalt pavement-distress detection. The loss curve of the training results and the MAP of the test results of YOLOv5 model with an input size of 640 pixels × 640 pixels are shown in Figure 9. The loss value starts with a relatively high learning rate and gradually decreases with the increase of training epochs, and finally has reached convergence and stability at an approximately equal value after 600 epochs of training. In the fitting state, the peak value of the accuracy for the training set appears in the 960th epoch, reaching 39.5%. Compared to the other four models, YOLOv5 has a higher average detection accuracy and a lower computational cost (single image processing time) of 0.0283 s/image. The transformer has recently shown outstanding performance in natural language processing and computer vision tasks such as object detection [72,73,74,75]. The transformer-based encoder employs a self-attention mechanism to improve the detection performance. Unlike convolutional neural networks (CNNs) used in traditional backbones, the transformer can capture long-range dependencies between image features and thus provide more effective feature representation. We further replace the CNN layer of the backbone of YOLOv5 with a transformer to investigate the effectiveness of the transformer-based YOLOv5 architecture in pavement object detection tasks. The results show that the YOLOv5 network based on CNN has the best detection performance for the pavement distress dataset. The average detection accuracy of the transformer-based YOLOv5 model for the five pavement injuries is slightly lower than the that of the CNN-based YOLOv5 model, with an MAP of 38.5%. However, the training time of the model is about 40 times longer than that of the model of the CNN backbone. Because the encoders in the transformer are independent of each other and do not share parameters and the self-attentive mechanism in the encoder needs to calculate the interactions between all positions, a surge in the number of parameters and a longer training time ensues. The comparison of MAP and calculation time for different models is shown in Figure 10.
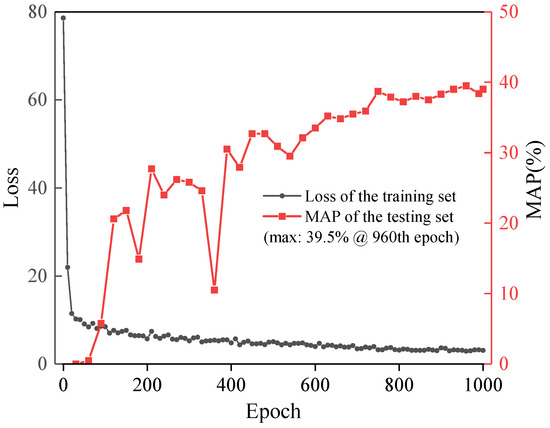
Figure 9.
MAP and Loss-epoch curves of the YOLOv5 model.
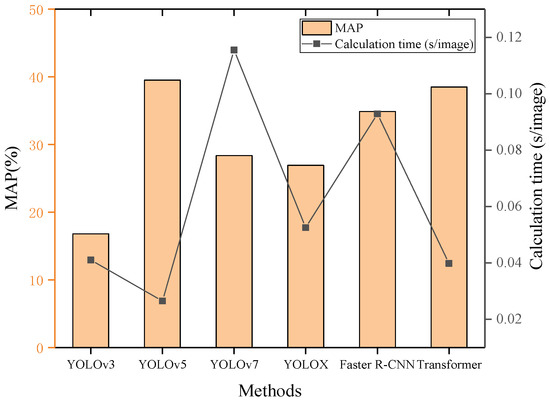
Figure 10.
Performance comparison of different algorithms.
5.2. Comparison of the Results for Different Virtual-to-Real Ratios
The results of pavement-distress detection for the YOLOv5 network fully trained on integrated datasets with six virtual-to-real ratios (0:1 to 5:1) are shown in Figure 11. Comparing the average precision of the YOLOv5 network on each integrated dataset, the results show that the larger the proportion of virtual disease data in the integrated dataset, the faster the MAP of the YOLOv5 network reaches its peak and stabilizes. The MAP of the YOLOv5 network is significantly increased by almost 30% when the ratio of virtual-to-real is 2:1, compared with the MAP with the ratio of 0:1 (65.10% vs. 39.5%).The MAP of the YOLOv5 network reaches an optimal value of 76.53% when the virtual-to-real ratio is expanded to 3:1. However, when the virtual-to-real ratio is further expanded to 4:1 and 5:1, the MAP gradually decreases, indicating that too much virtual data might generate a large number of redundant features, which results in the loss of the most discriminative and effective features and widens the difference between real pavement-distress features and virtual features, leading to a decrease in overall detection accuracy.
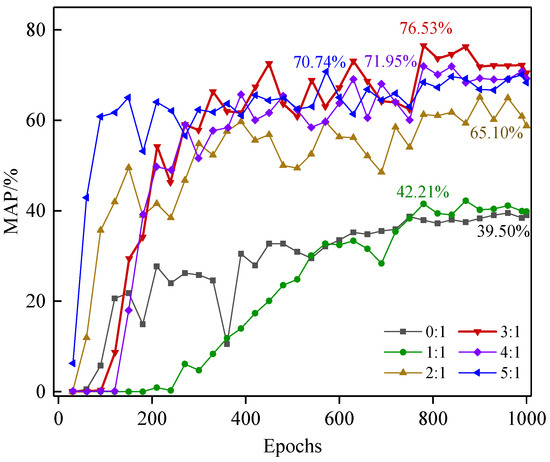
Figure 11.
MAP for the integrated dataset of six virtual-to-real ratios.
Another data augmentation dataset based on traditional pre-processing such as rotation and mirroring is produced to compare with an integrated dataset with a virtual-to-real ratio of 3:1 and an only real dataset, as shown in Table 4. The results show that image augmentation methods can effectively improve the accuracy of pavement-distress detection, among which the integration of the real and virtual data augmentation method outperforms the traditional data augmentation method. To be specific, the network trained on the integrated dataset with a virtual-to-real ratio of 3:1 achieves the AP of more than 50% for all five types of pavement distress (transverse cracks, longitudinal cracks, cross cracks, alligator cracks and potholes). In particular, the AP for pavement cross cracks achieves 96.97% and the MAP is 76.53%, which is twice that of the only real dataset without data augmentation (MAP: 39.5%) and 1.5 times that of the traditional data augmentation dataset (MAP: 46.9%). In summary, the YOLOv5 network trained on the integrated dataset with a virtual-to-real ratio of 3:1 enables obtaining more refined detection results for the identification of five types of asphalt pavement distress than with traditional data augmentation methods.
Table 4.
Comparison of two data augmentation methods.
When the IOU threshold is set at 0.5 and the confident threshold is set at 0.5, the Precision-Recall (P-R) curves and corresponding AP values of five types of asphalt pavement distress in different virtual-to-real ratios based on YOLOv5 model are shown in Figure 12a–e. The AP values for all five types of pavement distress rise correspondingly with the increase in the virtual-to-real ratio. The AP of the detection of transverse cracks, longitudinal cracks, cross cracks, and alligator cracks increases more than twice compared to the absence of virtual data, where the detection of cross cracks reached an accuracy of 96.97%. In addition, the AP for transverse cracks, longitudinal cracks and alligator cracks all peak at the maximum virtual-to-real ratio (5:1), while the AP for cross cracks and potholes peaks at the virtual-to-real ratio of 3:1, indicating that the features of these two distress features have a high complexity, low consistency and uncertainty. It is difficult for the virtual data to comprehensively and systematically reproduce all valid feature information in the real data, resulting in a decrease in detection accuracy when there are too many virtual data. In summary, the YOLOv5 network can obtain the best results when the ratio of virtual pavement-distress data to real asphalt pavement-distress data is 3:1.
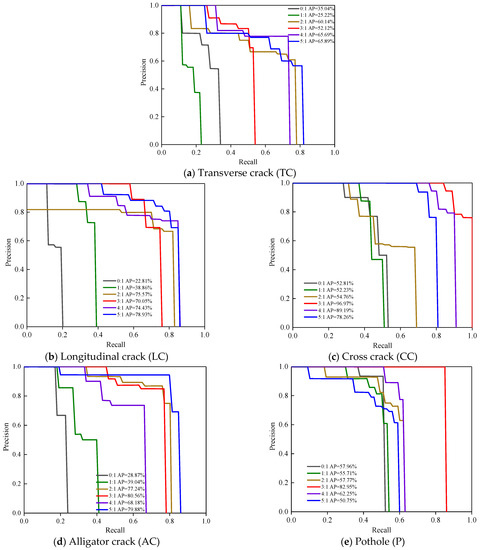
Figure 12.
Precision-recall curves of five types of defects based on integrated datasets with different virtual-to-real ratios. Detection results of YOLOv5 network for (a) transverse cracks (b) longitudinal cracks (c) cross cracks (d) alligator cracks (e) potholes.
In order to dig into the influence of the number of real data in the training set on the ability of effective feature extraction of the YOLOv5 model in the pavement-distress detection task, under the condition of 3:1 virtual-to-real ratio, this paper further trains the YOLOv5 network with 25, 50, 75 and 100 real images combined with the corresponding number of virtual data forming integrated datasets, respectively, and tests them on the same 100 real pavement-distress images. The results show that the MAP of the model trained with 25 real images is about 50%, and when the number of real images is increased to 75, the MAP increases by almost 30%, reaching 76.19%. If the number of real images is increased to 100, the detection accuracy is further improved (MAP:76.53%), but the improvement is not significant. These results demonstrate that training the network model using 75 and 100 real images is sufficient for the model to extract the most discriminative features of the pavement-distress images, justifying the setting of 100 real images to train the YOLOv5 network in this paper. The MAP of the YOLOv5 network trained using different numbers of real data is shown in Table 5.
Table 5.
The MAP of the YOLOv5 network trained using a different number of real data.
5.3. Comparison of Results for Different Detection Scenarios
The light and environment renderer in the UE4.26 physics engine is used to generate three types of poor detection scenarios, namely shadow, occlusion and blur, and 25 images (5 images per distress category) of pavement distress from the rendered images are selected to test the effectiveness and adaptability of the YOLOv5 network under poor detection scenarios after fully training on two types of datasets. The two types of datasets are the integrated dataset with the best virtual-to-real ratio of 3:1 and the dataset with a virtual-to-real ratio of 0:1 (the only real dataset).
Precision, the proportion of correctly detected objects to the total number of detections, usually represents the wrong detections, while recall, the proportion of correctly detected objects to the total number of actual objects, represents the missed detections. Since missed detections of diseases in complex detection scenarios are more likely to occur than wrong detections and could lead to serious consequences, this section uses recall to evaluate the effects of the YOLOv5 network trained on different datasets, as shown in Figure 13. The YOLOv5 network fully trained with the best virtual-to-real ratio (3:1) integrated dataset achieves more than 40% recall for all five pavement-distress types in the three poor detection scenarios (presented by the bar chart), with optimal adaptation to the shadow scenario, achieving 100% recall for longitudinal cracks, cross cracks, alligator cracks and potholes. In contrast, the YOLOv5 network trained on the only real dataset achieves less than 20% recall in shadow and occlusion scenarios (presented in the line chart), and performs best in blur scenarios, but the recall is about 40% lower than the YOLOv5 network fully trained on the virtual-to-real ratio (3:1) integrated dataset.
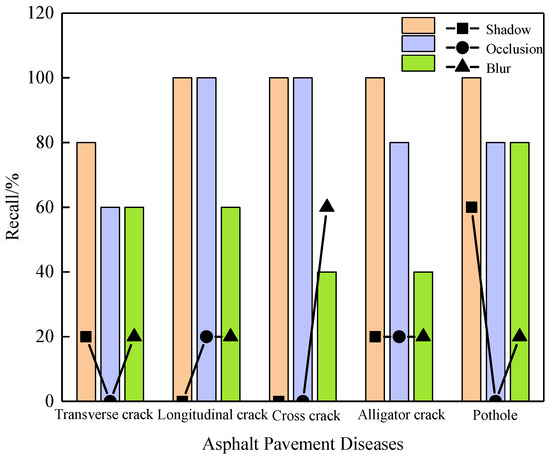
Figure 13.
Recall of YOLOv5 network trained on the integrated dataset with the best virtual-to-real ratio of 3:1 for three adverse-detection scenarios.
Figure 14 shows a portion of the detection results for the asphalt pavement distress. The YOLOv5 network, fully trained with the optimal virtual-to-real ratio (3:1) integrated dataset, enables the correct detection of all five pavement-distress types in the three poor detection scenarios, with a confidence level of over 90% for all predicted labels. The YOLOv5 network trained on the real dataset sometimes makes wrong detections in shadow and blur scenarios; for example, it mistakes shadow objects and normal pavements for distress, and the confidence level of the predicted labels is mostly below 50%, which makes it difficult to effectively detect the five types of pavement distress and poorly adapted to complex detection scenarios.
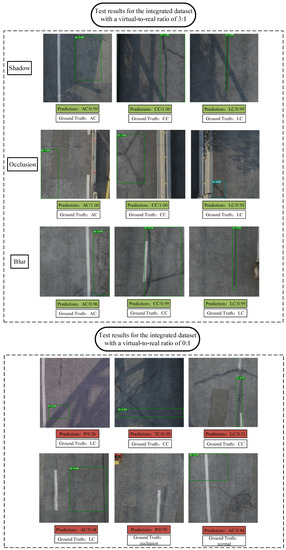
Figure 14.
Test results of YOLOv5 network trained on two datasets.
5.4. Comparison of Results for Different Pavement Texture Conditions
To confirm the effectiveness of virtual data augmentation methods in the detection of pavement defects with different textures, this paper applies virtual data to concrete pavement scenarios and compares the average detection accuracy results. Specifically, concrete pavement defect datasets containing transverse cracks, longitudinal cracks, cross cracks, alligator cracks and potholes are constructed using concrete pavement crack images from the open CrackForest-dataset (CFD) and concrete pavement distress images collected by UAVand are combined with the virtual data generated by the digital twin model according to six virtual-to-real ratios (0:1–5:1) to construct six integrated datasets. Finally, the trained YOLOv5 model was tested on the same 100 images of real concrete pavement distress. The results show that applying the virtual data generated by the digital twin model to concrete pavement distress detection results in a rise in accuracy compared to the detection results without data augmentation, and there is no significant decrease in accuracy compared to the asphalt pavement distress detection results, demonstrating the general applicability of the virtual data augmentation method. The best detection result (MAP of 68.31%) is obtained in the concrete pavement distress test set when the virtual-to-real ratio is 3:1, which is consistent with the above asphalt pavement-distress detection results, demonstrating the generalization of the 3:1 virtual-to-real ratio. The schematic diagram of 5 types of concrete pavement distress is shown in Figure 15, and the MAP for the integrated dataset of six virtual-to-real ratios on concrete pavements is shown in Figure 16.
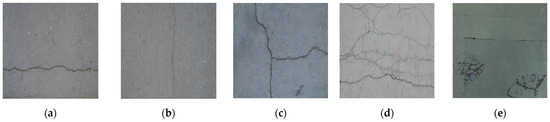
Figure 15.
Schematic diagram of 5 types of concrete pavement distress. (a) Transverse crack. (b) Longitudinal crack. (c) Cross crack. (d) Alligator crack. (e) Pothole.
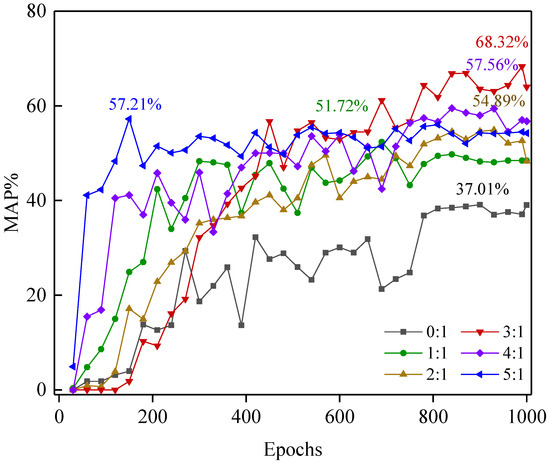
Figure 16.
MAP for the integrated dataset of six virtual-to-real ratios on concrete pavement.
6. Conclusions
This paper proposes a pavement-distress fine-tuned detection method based on a digital twin model and a deep-object detection algorithm, which creatively enables accurate and efficient detection and classification of five types of pavement distress and obtains good results in adverse scenarios such as shadow, occlusion and blur. Compared to traditional data augmentation methods, the virtual data augmentation method based on a digital twin model improves detection accuracy and yields positive general results. This method effectively addresses the challenges of low detection accuracy, high deployment cost, and poor adaptability caused by the lack of high-quality pavement distress samples. From our experiments, we can draw several conclusions.
(1) The fine-grained pavement-distress detection method using a digital twin model is proposed. Through pavement background modelling based on UAV and a virtual disease rendering based on the lightweight physics engine, a digital twin model capable of simulating the damaged state of the pavement is generated which can reproduce the pavement distress features realistically and simulate a variety of pavement scenarios. The virtual data generated by the digital twin model and the real data are integrated to fully train deep-object detection networks. The integrated dataset produces high-quality pavement disease samples, improving detection accuracy and the robustness of the model and reducing deployment costs. This effectively addresses the challenges of low detection accuracy, high deployment cost and poor adaptability caused by the lack of high-quality pavement-distress samples.
(2) The YOLOv5 network is fully trained with an integrated dataset with six virtual-to-real ratios, among which the model with a virtual-to-real ratio of 3:1 achieves the optimal detection results for asphalt pavement-distress detection, with the MAP of 76.53% for transverse cracks, longitudinal cracks, cross cracks, alligator cracks and potholes, which is twice that without virtual data (MAP: 39.5%) and 1.5 times that with traditional data augmentation (MAP: 46.9%). The larger the proportion of virtual data in the integrated dataset, the faster the MAP of the YOLOv5 network reaches its peak and stabilizes. However, when the virtual-to-real ratio exceeds 3:1, the non-critical redundant features are generated, which influences the feature extraction ability of the model, leading to a loss of the most discriminative and effective features and a reduction in detection accuracy. FurthermoreFurthermore, training the network model using 100 real images is sufficient for the model to extract the most discriminative features of the pavement distress images.
(3) This paper further tests the adaptability and generalization of the YOLOv5 network trained with virtual data augmentation in terms of different detection scenarios and different pavement texture. The YOLOv5 network fully trained with an integrated dataset with the optimal virtual-to-real ratio (3:1) achieves a recall of over 40% for all five pavement distress types in shadow, occlusion and blur scenarios, functionally improving the effectiveness and adaptability of complex pavement-detection scenarios and reducing the missed detection rate of distress compared to the training results without virtual data. When virtual data is applied to concrete pavement scenarios, the best detection result (MAP of 68.31%) is obtained in the concrete pavement distress test set when the virtual-to-real ratio is 3:1, demonstrating the general applicability of the virtual data augmentation method and the 3:1 virtual-to-real ratio.
Author Contributions
Funding acquisition, supervision, W.W.; Writing—original draft, methodology, X.X.; Investigation, visualization, J.P.; Software, supervision, writing-Review, W.H.; Data curation, D.W. All authors have read and agreed to the published version of the manuscript.
Funding
This research was funded by High-Speed Railway Infrastructure Joint Fund of the National Natural Science Foundation of China, No. U1734208; and National Natural Science Foundation of China, No. 52178442.
Institutional Review Board Statement
Not applicable.
Informed Consent Statement
Not applicable.
Data Availability Statement
Not applicable.
Conflicts of Interest
The authors declare no conflict of interest.
References
- Ceravolo, R.; Miraglia, G.; Surace, C.; Fragonara, L.Z. A Computational Methodology for Assessing the Time-Dependent Structural Performance of Electric Road Infrastructures. Comput. Civ. Infrastruct. Eng. 2016, 31, 701–716. [Google Scholar] [CrossRef]
- Qiao, Y.; Dawson, A.; Huvstig, A.; Korkiala-Tanttu, L. Calculating rutting of some thin flexible pavements from repeated load triaxial test data. Int. J. Pavement Eng. 2015, 16, 467–476. [Google Scholar] [CrossRef]
- Jia, Y.; Wang, S.; Huang, A.; Gao, Y.; Wang, J.; Zhou, W. A comparative long-term effectiveness assessment of preventive maintenance treatments under various environmental conditions. Constr. Build. Mater. 2021, 273, 121717. [Google Scholar] [CrossRef]
- Cao, W.; Liu, Q.; He, Z. Review of Pavement Defect Detection Methods. IEEE Access 2020, 8, 14531–14544. [Google Scholar] [CrossRef]
- Ai, D.; Jiang, G.; Lam, S.-K.; He, P.; Li, C. Computer vision framework for crack detection of civil infrastructure—A review. Eng. Appl. Artif. Intell. 2023, 117, 105478. [Google Scholar] [CrossRef]
- Du, Z.; Yuan, J.; Xiao, F.; Hettiarachchi, C. Application of image technology on pavement distress detection: A review. Measurement 2021, 184, 109900. [Google Scholar] [CrossRef]
- Hu, W.; Wang, W.; Ai, C.; Wang, J.; Wang, W.; Meng, X.; Liu, J.; Tao, H.; Qiu, S. Machine vision-based surface crack analysis for transportation infrastructure. Autom. Constr. 2021, 132, 103973. [Google Scholar] [CrossRef]
- Gopalakrishnan, K.; Khaitan, S.K.; Choudhary, A.; Agrawal, A. Deep Convolutional Neural Networks with transfer learning for computer vision-based data-driven pavement distress detection. Constr. Build. Mater. 2017, 157, 322–330. [Google Scholar] [CrossRef]
- Hoang, N.-D.; Nguyen, Q.-L. A novel method for asphalt pavement crack classification based on image processing and machine learning. Eng. Comput. 2018, 35, 487–498. [Google Scholar] [CrossRef]
- Zhou, Y.; Wang, F.; Meghanathan, N.; Huang, Y. Seed-Based Approach for Automated Crack Detection from Pavement Images. Transp. Res. Rec. 2016, 2589, 162–171. [Google Scholar] [CrossRef]
- Li, Q.; Zou, Q.; Zhang, D.; Mao, Q. FoSA: F* Seed-growing Approach for crack-line detection from pavement images. Image Vis. Comput. 2011, 29, 861–872. [Google Scholar] [CrossRef]
- Tsai, Y.C.; Chatterjee, A. Pothole Detection and Classification Using 3D Technology and Watershed Method. J. Comput. Civ. Eng. 2018, 32, 04017078. [Google Scholar] [CrossRef]
- Dorafshan, S.; Thomas, R.J.; Maguire, M. Comparison of deep convolutional neural networks and edge detectors for image-based crack detection in concrete. Constr. Build. Mater. 2018, 186, 1031–1045. [Google Scholar] [CrossRef]
- Shi, Y.; Cui, L.; Qi, Z.; Meng, F.; Chen, Z. Automatic Road Crack Detection Using Random Structured Forests. IEEE Trans. Intell. Transp. Syst. 2016, 17, 3434–3445. [Google Scholar] [CrossRef]
- Huyan, J.; Li, W.; Tighe, S.; Deng, R.; Yan, S. Illumination Compensation Model with k -Means Algorithm for Detection of Pavement Surface Cracks with Shadow. J. Comput. Civ. Eng. 2020, 34. [Google Scholar] [CrossRef]
- Li, H.; Song, D.; Liu, Y.; Li, B. Automatic Pavement Crack Detection by Multi-Scale Image Fusion. IEEE Trans. Intell. Transp. Syst. 2018, 20, 2025–2036. [Google Scholar] [CrossRef]
- Eidgahee, D.R.; Jahangir, H.; Solatifar, N.; Fakharian, P.; Rezaeemanesh, M. Data-driven estimation models of asphalt mixtures dynamic modulus using ANN, GP and combinatorial GMDH approaches. Neural Comput. Appl. 2022, 34, 17289–17314. [Google Scholar] [CrossRef]
- Xu, G.; Ma, J.; Liu, F.; Niu, X. Automatic Recognition of Pavement Surface Crack Based on BP Neural Network. In Proceedings of the 2008 International Conference on Computer and Electrical Engineering, Phuket, Thailand, 20–22 December 2008; IEEE: Piscataway, NJ, USA, 2008; pp. 19–22. [Google Scholar] [CrossRef]
- Wang, S.; Qiu, S.; Wang, W.; Xiao, D.; Wang, K.C.P. Cracking Classification Using Minimum Rectangular Cover–Based Support Vector Machine. J. Comput. Civ. Eng. 2017, 31, 04017027. [Google Scholar] [CrossRef]
- Cha, Y.-J.; Choi, W.; Büyüköztürk, O. Deep Learning-Based Crack Damage Detection Using Convolutional Neural Networks. Comput. Civ. Infrastruct. Eng. 2017, 32, 361–378. [Google Scholar] [CrossRef]
- Wang, W.; Hu, W.; Wang, W.; Xu, X.; Wang, M.; Shi, Y.; Qiu, S.; Tutumluer, E. Automated crack severity level detection and classification for ballastless track slab using deep convolutional neural network. Autom. Constr. 2021, 124, 103484. [Google Scholar] [CrossRef]
- Hou, Y.; Li, Q.; Han, Q.; Peng, B.; Wang, L.; Gu, X.; Wang, D. MobileCrack: Object Classification in Asphalt Pavements Using an Adaptive Lightweight Deep Learning. J. Transp. Eng. Part B Pavements 2021, 147, 04020092. [Google Scholar] [CrossRef]
- Song, L.; Wang, X. Faster region convolutional neural network for automated pavement distress detection. Road Mater. Pavement Des. 2019, 22, 23–41. [Google Scholar] [CrossRef]
- Mandal, V.; Uong, L.; Adu-Gyamfi, Y. Automated road crack detection using deep convolutional neural networks. In Proceedings of the 2018 IEEE International Conference on Big Data (Big Data), Seattle, WA, USA, 10–13 December 2018; pp. 5212–5215. [Google Scholar] [CrossRef]
- Zhang, L.; Yang, F.; Zhang, Y.D.; Zhu, Y.J. Road crack detection using deep convolutional neural network. In Proceedings of the 2016 IEEE International Conference on Image Processing, ICIP, Phoenix, AZ, USA, 25–28 September 2016; IEEE: Piscataway, NJ, USA, 2016; pp. 3708–3712. [Google Scholar] [CrossRef]
- Nhat-Duc, H.; Nguyen, Q.-L.; Tran, V.-D. Automatic recognition of asphalt pavement cracks using metaheuristic optimized edge detection algorithms and convolution neural network. Autom. Constr. 2018, 94, 203–213. [Google Scholar] [CrossRef]
- Zhang, K.; Cheng, H.D.; Zhang, B. Unified Approach to Pavement Crack and Sealed Crack Detection Using Preclassification Based on Transfer Learning. J. Comput. Civ. Eng. 2018, 32, 04018001. [Google Scholar] [CrossRef]
- Rajadurai, R.-S.; Kang, S.-T. Automated Vision-Based Crack Detection on Concrete Surfaces Using Deep Learning. Appl. Sci. 2021, 11, 5229. [Google Scholar] [CrossRef]
- Xiao, S.; Shang, K.; Lin, K.; Wu, Q.; Gu, H.; Zhang, Z. Pavement crack detection with hybrid-window attentive vision transformers. Int. J. Appl. Earth Obs. Geoinf. 2023, 116, 103172. [Google Scholar] [CrossRef]
- Zhang, A.; Wang, K.C.P.; Li, B.; Yang, E.; Dai, X.; Peng, Y.; Fei, Y.; Liu, Y.; Li, J.Q.; Chen, C. Automated Pixel-Level Pavement Crack Detection on 3D Asphalt Surfaces Using a Deep-Learning Network. Comput. Aided Civ. Infrastruct. Eng. 2017, 32, 805–819. [Google Scholar] [CrossRef]
- Zhu, J.; Zhong, J.; Ma, T.; Huang, X.; Zhang, W.; Zhou, Y. Pavement distress detection using convolutional neural networks with images captured via UAV. Autom. Constr. 2021, 133, 103991. [Google Scholar] [CrossRef]
- Kim, I.-H.; Jeon, H.; Baek, S.-C.; Hong, W.-H.; Jung, H.-J. Application of Crack Identification Techniques for an Aging Concrete Bridge Inspection Using an Unmanned Aerial Vehicle. Sensors 2018, 18, 1881. [Google Scholar] [CrossRef]
- Li, Y.; Ma, J.; Zhao, Z.; Shi, G. A Novel Approach for UAV Image Crack Detection. Sensors 2022, 22, 3305. [Google Scholar] [CrossRef]
- Liu, J.; Zhao, Z.; Lv, C.; Ding, Y.; Chang, H.; Xie, Q. An image enhancement algorithm to improve road tunnel crack transfer detection. Constr. Build. Mater. 2022, 348, 128583. [Google Scholar] [CrossRef]
- Hou, Y.; Li, Q.; Zhang, C.; Lu, G.; Ye, Z.; Chen, Y.; Wang, L.; Cao, D. The State-of-the-Art Review on Applications of Intrusive Sensing, Image Processing Techniques, and Machine Learning Methods in Pavement Monitoring and Analysis. Engineering 2020, 7, 845–856. [Google Scholar] [CrossRef]
- Spencer, B.F., Jr.; Hoskere, V.; Narazaki, Y. Advances in Computer Vision-Based Civil Infrastructure Inspection and Monitoring. Engineering 2019, 5, 199–222. [Google Scholar] [CrossRef]
- Subedi, B.; Sathishkumar, V.E.; Maheshwari, V.; Kumar, M.S.; Jayagopal, P.; Allayear, S.M. Feature Learning-Based Generative Adversarial Network Data Augmentation for Class-Based Few-Shot Learning. Math. Probl. Eng. 2022, 2022, 9710667. [Google Scholar] [CrossRef]
- Chen, C.; Li, K.; Wei, W.; Zhou, J.T.; Zeng, Z. Hierarchical Graph Neural Networks for Few-Shot Learning. IEEE Trans. Circuits Syst. Video Technol. 2021, 32, 240–252. [Google Scholar] [CrossRef]
- Wu, S.; Fang, J.; Zheng, X.; Li, X. Sample and Structure-Guided Network for Road Crack Detection. IEEE Access 2019, 7, 130032–130043. [Google Scholar] [CrossRef]
- Duan, Y.Q.; Zheng, W.Z.; Lin, X.D.; Lu, J.W.; Zhou, J. Deep adversarial metric learning. In Proceedings of the IEEE Conference on Computer Vision and Pattern Recognition, Long Beach, CA, USA, 25 October 2019; pp. 2780–2789. [Google Scholar] [CrossRef]
- Wang, J.; Zou, Y.S.; Lei, P.; Sherratt, R.S.; Wang, L. Research on recurrent neural network based crack opening prediction of concrete dam. J. Internet Technol. 2020, 21, 1161–1169. [Google Scholar] [CrossRef]
- Dong, H.; Song, K.; Wang, Q.; Yan, Y.; Jiang, P. Deep Metric Learning-Based for Multi-Target Few-Shot Pavement Distress Classification. IEEE Trans. Ind. Inform. 2021, 18, 1801–1810. [Google Scholar] [CrossRef]
- Xu, Y.; Bao, Y.; Zhang, Y.; Li, H. Attribute-based structural damage identification by few-shot meta learning with inter-class knowledge transfer. Struct. Health Monit. 2020, 20, 1494–1517. [Google Scholar] [CrossRef]
- Hoskere, V.; Narazaki, Y.; Spencer, B.F.; Smith, M.D. Deep Learning-based Damage Detection of Miter Gates Using Synthetic Imagery from Computer Graphics. In Proceedings of the 12th International Workshop on Structural Health Monitoring: Enabling Intelligent Life-Cycle Health Management for Industry Internet of Things (IIOT), Stanford, CA, USA, 10–12 September 2019; pp. 3073–3080. [Google Scholar] [CrossRef]
- Hoskere, V.; Narazaki, Y.; Spencer, B.F. Learning to detect important visual changes for structural inspections using phys-icsbased graphics models. In Proceedings of the 9th International Conference on Structural Health Monitoring of Intelligent Infrastructure (ISHMII), St. Louis, MI, USA, 4–7 August 2019; pp. 1484–1490. Available online: http://www.scopus.com/inward/record.url?scp=85090588897&partnerID=8YFLogxK (accessed on 1 January 2019).
- Pyle, R.J.; Bevan, R.L.T.; Hughes, R.R.; Rachev, R.K.; Ali, A.A.S.; Wilcox, P.D. Deep Learning for Ultrasonic Crack Characterization in NDE. IEEE Trans. Ultrason. Ferroelectr. Freq. Control 2020, 68, 1854–1865. [Google Scholar] [CrossRef]
- Hakim, S.; Razak, H.A.; Ravanfar, S. Fault diagnosis on beam-like structures from modal parameters using artificial neural networks. Measurement 2015, 76, 45–61. [Google Scholar] [CrossRef]
- Siu, C.; Wang, M.; Cheng, J.C. A framework for synthetic image generation and augmentation for improving automatic sewer pipe defect detection. Autom. Constr. 2022, 137, 104213. [Google Scholar] [CrossRef]
- Xu, Y.; Huang, B.; Luo, X.; Bradbury, K.; Malof, J.M. SIMPL: Generating Synthetic Overhead Imagery to Address Custom Zero-Shot and Few-Shot Detection Problems. IEEE J. Sel. Top. Appl. Earth Obs. Remote Sens. 2022, 15, 4386–4396. [Google Scholar] [CrossRef]
- Richter, S.R.; Vineet, V.; Roth, S.; Koltun, V. Playing for Data: Ground Truth from Computer Games. In Proceedings of the Computer Vision–ECCV 2016: 14th European Conference, Amsterdam, The Netherlands, 11–14 October 2016; Springer International: Berlin/Heidelberg, Germany, 2016; pp. 102–118. [Google Scholar] [CrossRef]
- Zhang, Y.; Song, S.; Yumer, E.; Savva, M.; Lee, J.-Y.; Jin, H.; Funkhouser, T. Physically-Based Rendering for Indoor Scene Understanding Using Convolutional Neural Networks. In Proceedings of the 2017 IEEE Conference on Computer Vision and Pattern Recognition (CVPR), Honolulu, HI, USA, 21–26 July 2017; pp. 5287–5295. [Google Scholar] [CrossRef]
- Tobin, J.; Fong, R.; Ray, A.; Schneider, J.; Zaremba, W.; Abbeel, P. Domain randomization for transferring deep neural networks from simulation to the real world. In Proceedings of the 2017 IEEE/RSJ International Conference on Intelligent Robots and Systems (IROS), Vancouver, BC, Canada, 24–28 September 2017; IEEE: Piscataway, NJ, USA, 2017; pp. 23–30. [Google Scholar] [CrossRef]
- Jiang, F.; Ma, L.; Broyd, T.; Chen, K. Digital twin and its implementations in the civil engineering sector. Autom. Constr. 2021, 130, 103838. [Google Scholar] [CrossRef]
- Ritto, T.; Rochinha, F. Digital twin, physics-based model, and machine learning applied to damage detection in structures. Mech. Syst. Signal Process. 2021, 155, 107614. [Google Scholar] [CrossRef]
- Tuegel, E.; Ingraffea, A.R.; Eason, T.G.; Spottswood, S.M. Reengineering Aircraft Structural Life Prediction Using a Digital Twin. Int. J. Aerosp. Eng. 2011, 2011, 154798. [Google Scholar] [CrossRef]
- Shim, C.-S.; Dang, N.-S.; Lon, S.; Jeon, C.-H. Development of a bridge maintenance system for prestressed concrete bridges using 3D digital twin model. Struct. Infrastruct. Eng. 2019, 15, 1319–1332. [Google Scholar] [CrossRef]
- Karve, P.M.; Guo, Y.; Kapusuzoglu, B.; Mahadevan, S.; Haile, M.A. Digital twin approach for damage-tolerant mission planning under uncertainty. Eng. Fract. Mech. 2019, 225, 106766. [Google Scholar] [CrossRef]
- Booyse, W.; Wilke, D.N.; Heyns, S. Deep digital twins for detection, diagnostics and prognostics. Mech. Syst. Signal Process. 2020, 140, 106612. [Google Scholar] [CrossRef]
- Aivaliotis, P.; Georgoulias, K.; Alexopoulos, K. Using digital twin for maintenance applications in manufacturing: State of the Art and Gap analysis. In Proceedings of the 2019 IEEE International Conference on Engineering, Technology and Innovation (ICE/ITMC), Valbonne Sophia-Antipolis, France, 17–19 June 2019. [Google Scholar] [CrossRef]
- Redmon, J.; Divvala, S.; Girshick, R.; Farhadi, A. You Only Look Once: Unified, Real-Time Object Detection. In Proceedings of the 2016 IEEE Conference on Computer Vision and Pattern Recognition (CVPR), Las Vegas, NV, USA, 27–30 June 2016; pp. 779–788. [Google Scholar] [CrossRef]
- Bochkovskiy, A.; Wang, C.; Liao, H. YOLOv4: Optimal Speed and Accuracy of Object Detection. arXiv 2020, arXiv:2004.10934. [Google Scholar] [CrossRef]
- Ren, S.; He, K.; Girshick, R.; Sun, J. Faster R-CNN: Towards real-time object detection with region proposal networks. IEEE Trans. Pattern Anal. Mach. Intell. 2017, 39, 1137–1149. [Google Scholar] [CrossRef]
- Wang, H.; Zhang, S.; Zhao, S.; Wang, Q.; Li, D.; Zhao, R. Real-time detection and tracking of fish abnormal behavior based on improved YOLOV5 and SiamRPN++. Comput. Electron. Agric. 2021, 192, 106512. [Google Scholar] [CrossRef]
- Li, Z.; Lu, K.; Zhang, Y.; Li, Z.; Liu, J.-B. Research on Energy Efficiency Management of Forklift Based on Improved YOLOv5 Algorithm. J. Math. 2021, 2021, 5808221. [Google Scholar] [CrossRef]
- Wang, C.-Y.; Liao, H.-Y.M.; Wu, Y.-H.; Chen, P.-Y.; Hsieh, J.-W.; Yeh, I.-H. CSPNet: A New Backbone that can Enhance Learning Capability of CNN. In Proceedings of the 2020 IEEE/CVF Conference on Computer Vision and Pattern Recognition Workshops (CVPRW), Seattle, WA, USA, 14–19 June 2020; pp. 1571–1580. [Google Scholar]
- Redmon, J.; Farhadi, A. YOLOv3: An Incremental Improvement. arXiv 2018, arXiv:1804.02767. [Google Scholar] [CrossRef]
- Li, S.; Li, Y.; Li, Y.; Li, M.; Xu, X. YOLO-FIRI: Improved YOLOv5 for Infrared Image Object Detection. IEEE Access 2021, 9, 141861–141875. [Google Scholar] [CrossRef]
- Lin, T.Y.; Dollár, P.; Girshick, R.; He, K.; Hariharan, B.; Belongie, S. Feature pyramid networks for object detection. In Proceedings of the IEEE Conference on Computer Vision and Pattern Recognition, Honolulu, HI, USA, 21–26 July 2017; pp. 2117–2125. [Google Scholar] [CrossRef]
- Liu, S.; Qi, L.; Qin, H.; Shi, J.; Jia, J. Path Aggregation Network for Instance Segmentation. In Proceedings of the 2018, IEEE/CVF Conference on Computer Vision and Pattern Recognition (CVPR), Salt Lake City, UT, USA, 18–23 June 2018; pp. 8759–8768. [Google Scholar] [CrossRef]
- Yu, J.H.; Jiang, Y.N.; Wang, Z.Y.; Cao, Z.; Huang, T. UnitBox: An Advanced Object Detection Network. arXiv 2016, arXiv:1608.01471. [Google Scholar] [CrossRef]
- Zheng, Z.; Wang, P.; Liu, W.; Li, J.; Ye, R.; Ren, D. Distance-IoU Loss: Faster and Better Learning for Bounding Box Regression. In Proceedings of the AAAI Conference on Artificial Intelligence, New York, NY, USA, 7–12 February 2020; Volume 34, pp. 12993–13000. [Google Scholar]
- Li, Y.; Li, J.; Zhang, M. Deep Transformer modeling via grouping skip connection for neural machine translation. Knowl. Based Syst. 2021, 234, 107556. [Google Scholar] [CrossRef]
- Gu, Y.; Piao, Z.; Yoo, S.J. STHarDNet: Swin Transformer with HarDNet for MRI Segmentation. Appl. Sci. 2022, 12, 468. [Google Scholar] [CrossRef]
- Mary, N.J.M.S.; Umesh, S.; Katta, S.V. S-vectors and TESA: Speaker embeddings and a speaker authenticator based on transformer encoder. IEEE/ACM Trans. Audio Speech Lang. Process. 2021, 30, 404–413. [Google Scholar] [CrossRef]
- Huang, Y.Y.; Si, Y.; Hu, B.L.; Zhang, Y.; Wu, S.; Wu, D.S.; Wang, Q. Transformer-based factorized encoder for classification of pneumoconiosis on 3D CT images. Comput. Biol. Med. 2022, 150, 106137. [Google Scholar] [CrossRef]


Disclaimer/Publisher’s Note: The statements, opinions and data contained in all publications are solely those of the individual author(s) and contributor(s) and not of MDPI and/or the editor(s). MDPI and/or the editor(s) disclaim responsibility for any injury to people or property resulting from any ideas, methods, instructions or products referred to in the content. |
© 2023 by the authors. Licensee MDPI, Basel, Switzerland. This article is an open access article distributed under the terms and conditions of the Creative Commons Attribution (CC BY) license (https://creativecommons.org/licenses/by/4.0/).