Article

Concrete Beams Reinforced with High Strength Rebar in Combination with External Steel Tape

1
Department of Building Constructions and Bridges, Lviv Polytechnic National University, 12 St. S. Bandera, 79013 Lviv, Ukraine
2
Department of Highways and Bridges, Lviv Polytechnic National University, 12 St. S. Bandera, 79013 Lviv, Ukraine
3
Faculty of Civil Engineering, Czestochowa University of Technology, 69 St. Dabrowskiego, 42-201 Czestochowa, Poland
*
Author to whom correspondence should be addressed.
Appl. Sci. 2023, 13(7), 4528; https://doi.org/10.3390/app13074528
Submission received: 28 February 2023 / Revised: 27 March 2023 / Accepted: 28 March 2023 / Published: 3 April 2023

Abstract

:

Featured Application

The results of the work can be applied for assessment of reliability parameters of concrete beams with combined reinforcement. The results will also be beneficial for more efficient design solutions.

Abstract

The use of combined reinforcement in the form of external S275 steel tape and A1000 high-strength rebar is generally interesting for research. The use of a package of reinforcement enables a better choice of a rational cross-section area of reinforcement by varying the rebar diameter or the width of the steel tape. In addition, an interesting issue for research is the limit strain values of reinforcement of different strength classes since they can differ significantly, which affects the operation of the structure as a whole. For structures with combined reinforcement, there is still the number of issues not studied yet: for example, the stages of inclusion in the work of reinforcement and the magnitude of forces perceived by particular type of the reinforcement, the process and reasons for the destruction of experimental samples, the feasibility of such reinforcement, and the effect of high-strength rebar on the strength and deformability of reinforced concrete structures. Given that the issue of combined reinforcement is not sufficiently studied, the main task of the study was to investigate the stress–strain state of reinforced concrete beams with combined reinforcement (high-strength A1000 steel bars in combination with external S275 steel tape) in more detail.

1. Introduction

Reinforced concrete (RC) structures are prevalent in almost any area of construction practice; therefore, the issue of prolonging their service life has become highly topical [1,2]. Among the most widely discussed problems are the innovative methods for the evaluation of RC structures’ stress–strain state and load-bearing capacity, as well as possibilities for their strengthening [3,4,5,6]. There is a great number of reasons that cause the necessity of strengthening RC structures, including changes in design parameters, increased level of loading, environmental impacts, damages due to construction errors, etc. [7,8,9,10,11,12]. Thus, corresponding strengthening and reconstruction measures should be ensured in order to prevent the accidental destruction of the structural elements or the whole building [9].
Among the most common approaches to strengthening, the following can be distinguished: the use of external strengthening systems, the use of prestressed external reinforcement, composite materials, metal and reinforced concrete jackets, near-surface mounted reinforcement, etc. [13,14,15]. External strengthening with the use of different steel and composite materials is the prevalent one for reinforced concrete beams, as it is highly efficient, technological, and easy to implement.
One of the innovative techniques is the use of carbon fiber reinforced polymers (CFRP), which are characterized by high strength and corrosion resistance [16,17]. The use of CFRP tapes is effective in absorbing blast energy, decreasing of deflections [17], and increasing the load-bearing capacity and yield point of reinforcement. As stated in [18,19], the strengthening of damaged structures with composite materials is effective for stopping cracking and increasing stiffness. This strengthening technique is highly efficient in emergency situations. One of the main disadvantages of such an approach is a high cost of FRP materials and their low thermal resistance.
External strengthening with the use of steel tapes requires less investments and, therefore, is widespread in the engineering practice. It is important to note that such strengthening of the system causes the transformation of a reinforced concrete structure to specifically new type of steel concrete beam [15]. Steel-concrete structures are widely used due to their specific features [20]. In addition, simple and clear design rules facilitate the use of externally applied tapes as the retrofitting material [21]. For example, Karpiuk et al. [22] have experimentally proved the possibility and appropriateness to use steel for strengthening damaged RC beams.
In some cases, the external reinforcement with steel tapes is used on the design stage in combination with rebar. Steel-concrete structures allow the efficient use of the tape reinforcement and eliminate the necessity of a multi-row location of steel bars. The manufacturing of such beams are simplified, and the steel consumption is reduced. Steel-concrete structures require 12–15% less steel in comparison with reinforced concrete structures with steel bars. For steel concrete beams, the required stiffness and strength can be ensured with a smaller height of the cross-section. Thus, the weight of the structural element and concrete consumption are also reduced at the same reinforcement ratio. In general, the concrete saving is about 9%.
The use of combined types of reinforcement causes the change in stress–strain state and failure mode. For example, authors in [23] noted that the use of steel fibers combined with steel tape in the reinforced concrete beam caused the change in the failure mode from shearing to bending and increased the shear strength of the structure. Similarly, according to the study of Sarhat S.R. and Abdul-Ahad R.B. [24], the combination of steel fibers and steel stirrups caused the change of the failure mode to a shear-flexure type, a considerable increase in shear strength and ductility, and higher crack resistance. Comparative analysis [25] has also shown that RC beams strengthened with steel tapes tend toward more flattered crack development in the shear span. Therefore, when using the external tape reinforcement it is important to take into account the specifics of the stress–strain state, durability parameters, and limitations due to corrosion impacts, which was highlighted in the number of studies [26,27,28]. The effect of steel tapes as the strengthening material on fatigue characteristics was studied by Gao et al. [29]. The work of Yin et al. [30] was devoted to the flexural capacity of steel-concrete structures. An interesting study from Zhang et al. [31] included the theoretical calculation and analysis of steel-concrete beams. Article [32] describes results of the study of pre-stressed steel-concrete beams, analyzing a different ratio of steel tape and rebar in the zone of pure bending.
Strengthening technology with the use of external steel tapes includes such operations as cutting a steel plate into strips, pasting them at a certain distance at the bottom edge of the structure, and anchoring at the end [33,34,35]. Reliable anchoring is an obligatory condition of optimal use of the strengthening system. As is stated in [36], the effective operation of the multi-layered beam structure requires reliable connection between layers. Similarly, in the study [37], it was noted, that the contact between different layers of the structural element is important from the point of view of the load-bearing capacity of the composite cross-section. Comparative study [38] has shown, that for both, externally applied CFRP tapes and steel tapes, the decisive parameter of failure was the peeling off at the steel-glue interface. For beams with an external reinforcement, adhesion between smooth tape reinforcement and concrete surface is ensured with the use of different anchoring systems, which prevent the sliding of steel tape. For example, additional adhesion between the tape and the concrete can be ensured with the use of steel bars welded to the tape. Among all types of anchors, the simplest in manufacturing are single bars, welded to tape in T-form. However, U-type anchors welded to the tape are more efficient. The load-bearing capacity of such anchors is determined by the resistance of the anchor to the bearing and strength of the concrete. Shear deformations depend on the level of stress in the concrete in the interphase zone of the anchor with tape reinforcement. The perforation anchoring system was approved by the authors [39] to be an effective way of ensuring joint work and the increase in the structures’ load-bearing capacity by 10 % in comparison with loop anchors. In addition, the increase in the steel sheet thickness from 2 to 4 mm results in an increased load-bearing capacity from 17 to 38% [39]. It is important to note that the use of external tape reinforcement in combination with steel bars of usual strength does not provide reliable stiffness. Thus, the study of [40] has shown that such structures have higher deflection values than the concrete elements with fiber-reinforcement.
In the industrial manufacturing conditions, high strength rebar is widely used in reinforced concrete structures. Among its advantages, high strength is the most important one, which enables the reduction of the amount of steel without decreasing the reliability. Another important parameter of the structural steel is its limit strain, which is higher for high strength reinforcement; it has a negative impact on the crack resistance of the structure.
An interesting finding was presented in the study [41], according to which an additional prestressing of the tape and high-strength rebar can increase the ultimate moment by up to 19% and significantly reduce deflections under service loads. High strength reinforcement is mostly used in industrially-manufactured, prestressed, reinforced concrete structures, as the prestressing of steel bars is expensive and technologically complicated on the construction site. However, the combination of high-strength reinforcement without prestressing with external steel tape provides interesting specifics of the structural performance. According to [42], improved mechanical characteristics of high-strength rebar help to ensure requirements of the durability, deformability, and crack resistance of steel-concrete beams with combined reinforcement.
In general, the literature review indicates the importance of understanding the strength and deformability parameters of concrete beams with combined reinforcement. A study of the impact of combined reinforcement on RC structures’ operation will allow us to evaluate their reliability and to establish the specifics of their operation. Such investigation will allow us to identify to what extent the difference in the limit strain values of the different classes’ reinforcement affects the performance. In addition, this study will indicate how the operation of the structure as a whole is affected by the moment, corresponding to a yield point of the reinforcement. This study will enable us to evaluate the dependence of deformability and the strength of reinforced concrete beams with combined reinforcement on the percentage of high-strength rebar. Thus, the scientists could make an assumption on the optimality and efficiency of steel-concrete structures with combined reinforcement. Therefore, the aims of this study include the thorough analysis of the deformability, stiffness, and strength of RC beams with combined reinforcement; the influence of different parameters; and the assumption about the most optimal reinforcement ratio.

2. Materials and Methods

2.1. Experimental Investigation

For the study, 8 reinforced concrete beams with 2600 mm length, 2400 mm estimated span, and 120 × 240 mm cross-section were designed, manufactured, and experimentally tested. Corresponding calculations were performed for this samples for one-span beam with two supports and loaded by two concentrated forces in thirds of the span.
At the first stage, the goal was to assemble beams with different percentages of reinforcement and with different ratios of high-strength reinforcement to tape reinforcement. It was accepted that their calculated strength according to DSTU B.V.2.6-156:2010 [43] and Eurocode 2 [44] should be the same; thus, the destructive load for them was assumed to be the same. This assumption simplified the comparison of experimental results and increased their accuracy.
Combined reinforcement, including the S275 steel tapes of 8 mm thickness and A1000 class high-strength rebar of 10 mm diameter, was used in the stretched zone of the test samples. The reinforcement in the compressed zone of the experimental beams is designed with a periodic profile of 8 mm A400S steel bars. Steel bars of the 5 mm A240 class were installed with 70 mm spacing at the supports and 100 mm spacing in the pure bending zone, which served as transverse reinforcement and as anchors for tape S275 reinforcement. The concrete that was used had the grade C35/45. The components of the concrete were the following: the concrete (C) of M600 class, rubble (R) of 5–20 mm size fraction, quartz sand (S), unadulterated water (W), and plasticizer NK-1 (VM). The ratio of components was C:R:S:P = 1:1.25:2.67:0.0055; W/C = 0.4. The beams were designed in such a way that their destruction occurred in the zone of pure bending due to the action of the bending moment.
The designed beams were divided into four series in order to increase the reliability of the test results. Each series consisted of two identical beams that were manufactured and tested under the same conditions. In beams of the B-I and B-II series, combined reinforcement of the stretched zone with A1000 reinforcement and S275 tape was used. In beams of the B-III and B-IV series, no combined reinforcement was used; they served as the test samples for further comparison and analysis of the results of their work with the results of beams B-I and B-II. Beams of B-III series were reinforced with 3 high-strength 10 mm steel bars of A1000S class. Beams of the B-IV series were reinforced with only tape reinforcement of the S275 class with a thickness of 8 mm. Characteristics of the test samples are given in the Table A1 and Table A2 (see Appendix A)
In beams of series B-I, tape reinforcement was used with total area As = 6.56 cm2, which was 89.64% of the total area of the stretched reinforcement and 1–10 mm A1000 rebar with area As = 0.758 cm2, which amounted to 10.36%. For series B-II, tape reinforcement was used with total area As = 3.68 cm2, which was 70% of the total area of the stretched reinforcement and 2–10 mm A1000 rebar with area As = 1.57 cm2, which amounted 30%. In beams of series B-III in stretched zone, high-strength steel bars of 3–10 mm A1000 with area As = 2.355 cm2 were used. In beams of series B-IV in stretched zone, tape reinforcement of S245 steel with area As = 9.12 cm2 was used.
The construction of experimental beams’ frames is given on Figure 1.
For experimental reinforced concrete beams, it was important to calculate the strength of the anchors, which should ensure reliable contact of the concrete with the external smooth tape reinforcement. In ordinary reinforced concrete structures, the joint work of reinforcement and concrete is almost always ensured by the reliable adhesion. Conversely, in elements with tape reinforcement after reaching the limit state in the anchor, the destruction of the structure is possible. This could be considered as an additional limit state, specific only for elements with tape reinforcement, along with the strength at normal and inclined sections. In other words, the strength of a reinforced concrete element depends on the strength of concrete, steel, and the anchor while the deformations depend on the deformations of concrete, steel, and anchors, respectively.
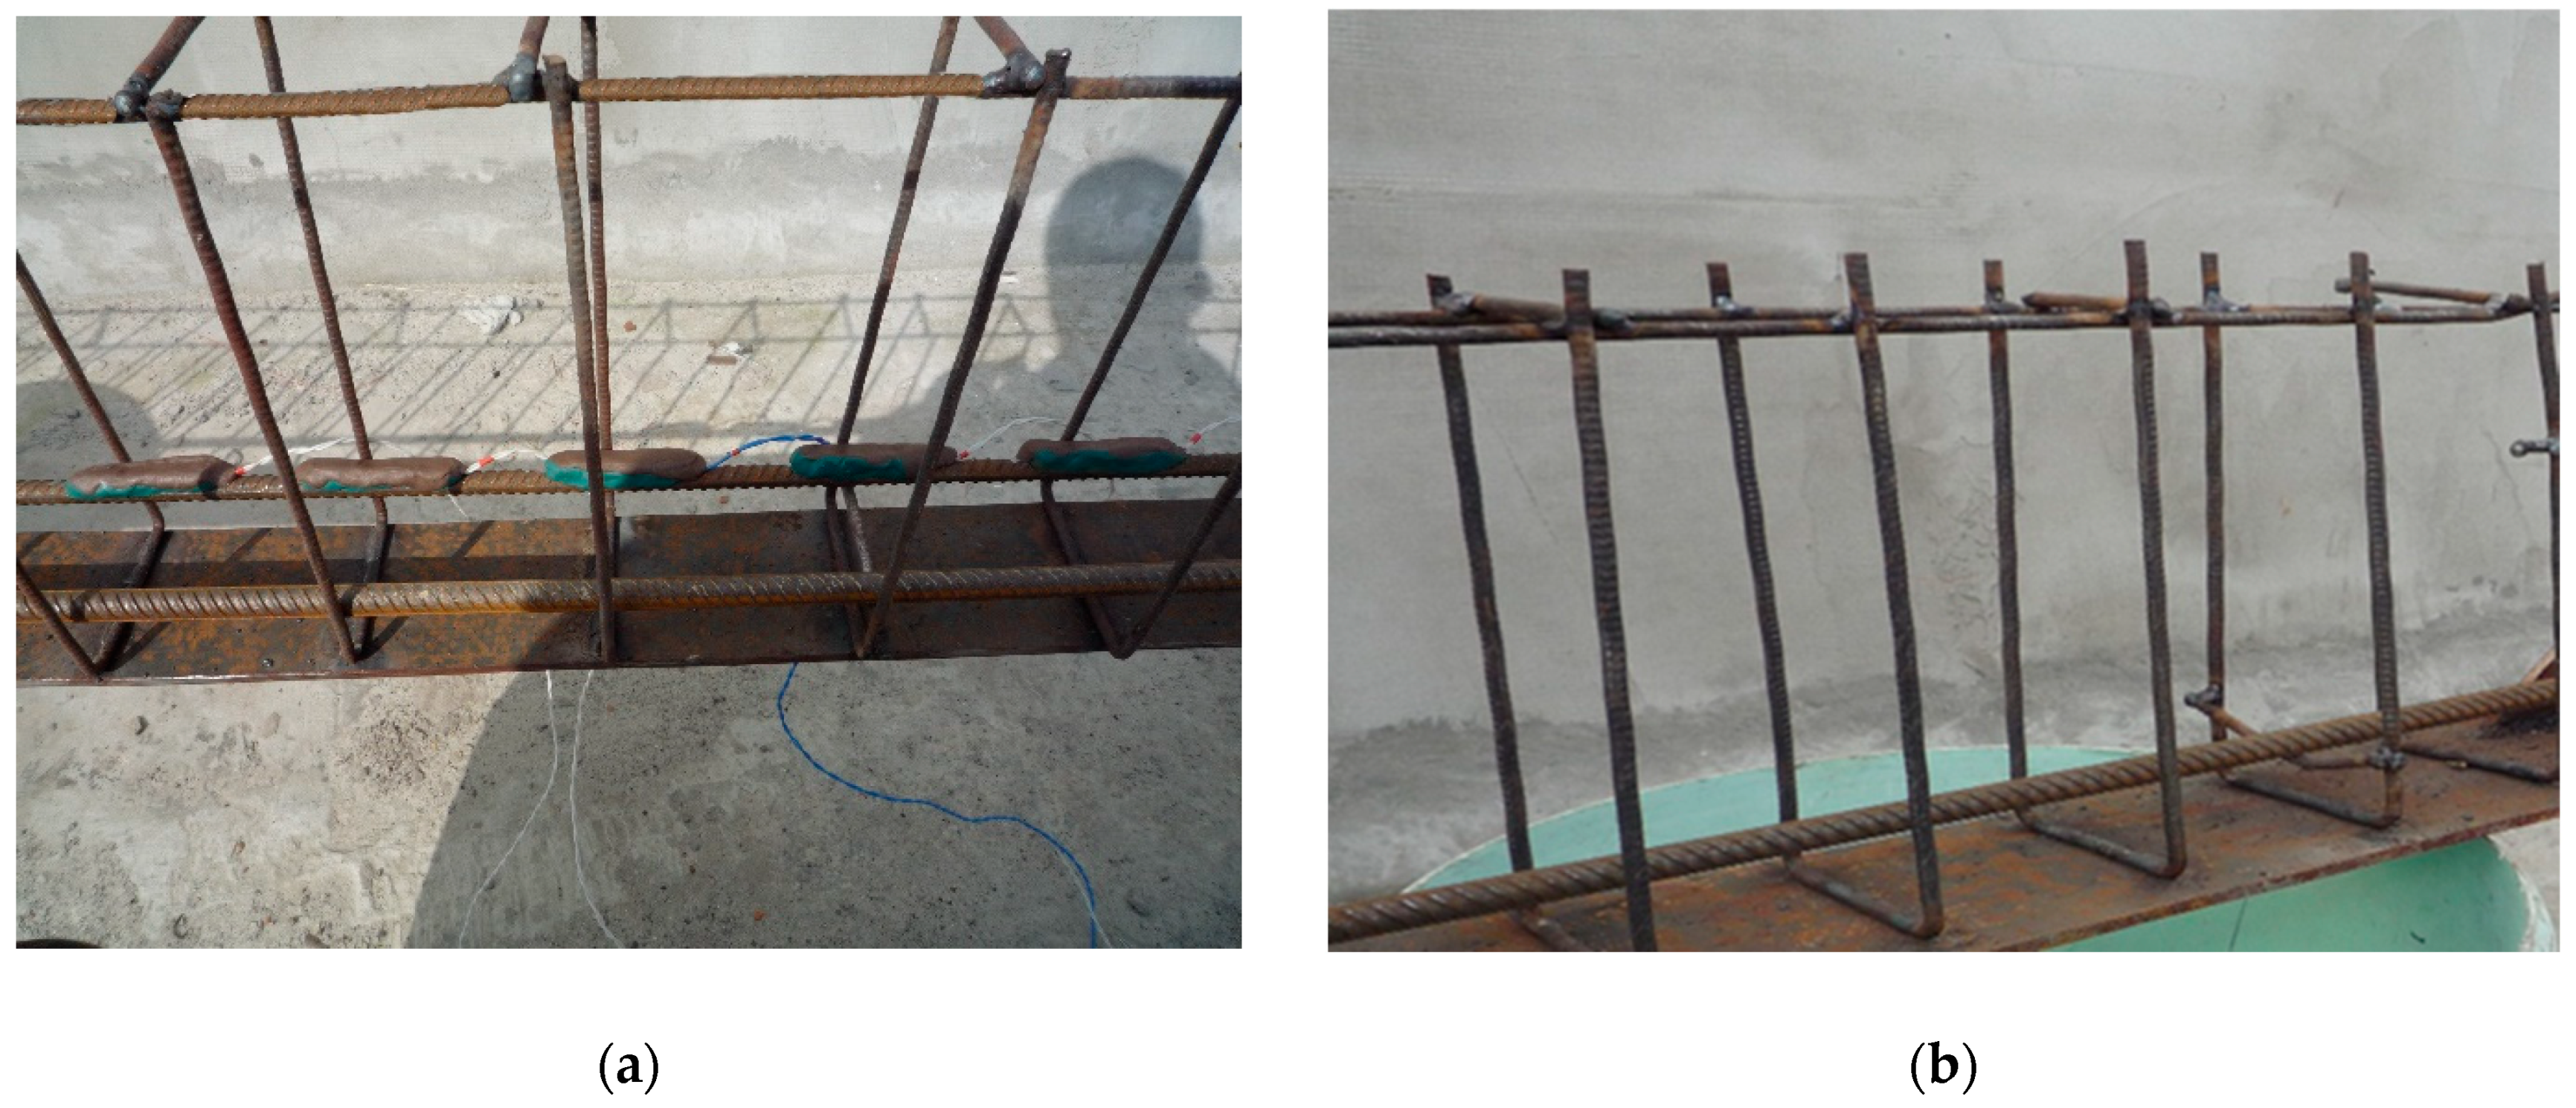
Adhesion of concrete to the smooth surface of tape reinforcement in reinforced concrete structures cannot ensure the joint work of components even at the initial stages of work. For reinforced concrete structures, the anchoring of external smooth tape reinforcement in concrete along the contact zone is of primary importance. Therefore, reliable conjunction is the only guarantee of operational suitability of the structure. The purpose of anchors is to ensure the joint operation of the steel–concrete beam with external smooth tape reinforcement. In addition, anchoring system prevents the reinforcement from shifting relative to the concrete and decreases shear forces in inclined sections. Flexible and rigid detents are widely used as anchors in complex structures, as they are the simplest structurally and are able to ensure the joint work of concrete and steel. Strains and stresses in anchors start to develop from the initial stages of loading, previously to visible violation of the concrete bonding to the tape. The main factor for choosing the design of the anchors used in this study was the reliability and maximum stiffness of the connection. Among various types of anchors, U-shaped anchors in the form of bent frames welded perpendicularly to smooth tape reinforcement were the most effective and acceptable. Such anchoring simultaneously served as the transverse reinforcement of the beam (Figure 2).
Experimental testing of RC samples was performed according to recommendations of normative structural design codes DSTU B V.2.6-7-95 [45]. Experimental tests were performed on test stand; the loading was applied using a hydraulic jack. Through the distribution traverse, the force was applied to the upper face of the beam in the form of two concentrated forces placed symmetrically relative to the middle of the beam with a step of 1/3 of the calculated span.
Concentrated forces and support reactions were transmitted to the beam through distribution plates and put on layer of cement–sand mortar. The beam and the jack were carefully placed on the stand in a vertical position and fixed with slight pressure (about 3% of the destructive load), which was endured until the mortar completely hardened under the metal distribution plates. To ensure transfer of concentrated forces to the beam, rollers were installed between the distribution plates and the traverse. The thorough and careful installation of beams enabled us to almost completely exclude any deviation from the vertical position of the beam during loading and destruction.
The loading of the beams during the test was carried out gradually. Before the formation of cracks, the load was carried out in stages of 5% of the destructive load; after the formation of cracks, the increments were equal to 10%. For each subsequent loading level, the load was hold during 30-min. After that, readings from all devices were taken, as well as the formation, opening width and development of cracks were recorded. The magnitude of the load was controlled by pressure gauge, calibrated together with the pumping station and the jack, as well as by the magnitude of the resistance reactions, which were measured by two dynamometers (Standarts-M, Ukraine). Dynamometers were arranged on ridged and fixed supports.
Deflections of the beams were measured using three clock-type indicators (Microtech, Ukraine) with a division price of 0.01 mm, two of which were installed under the forces and the third in the middle of the span.
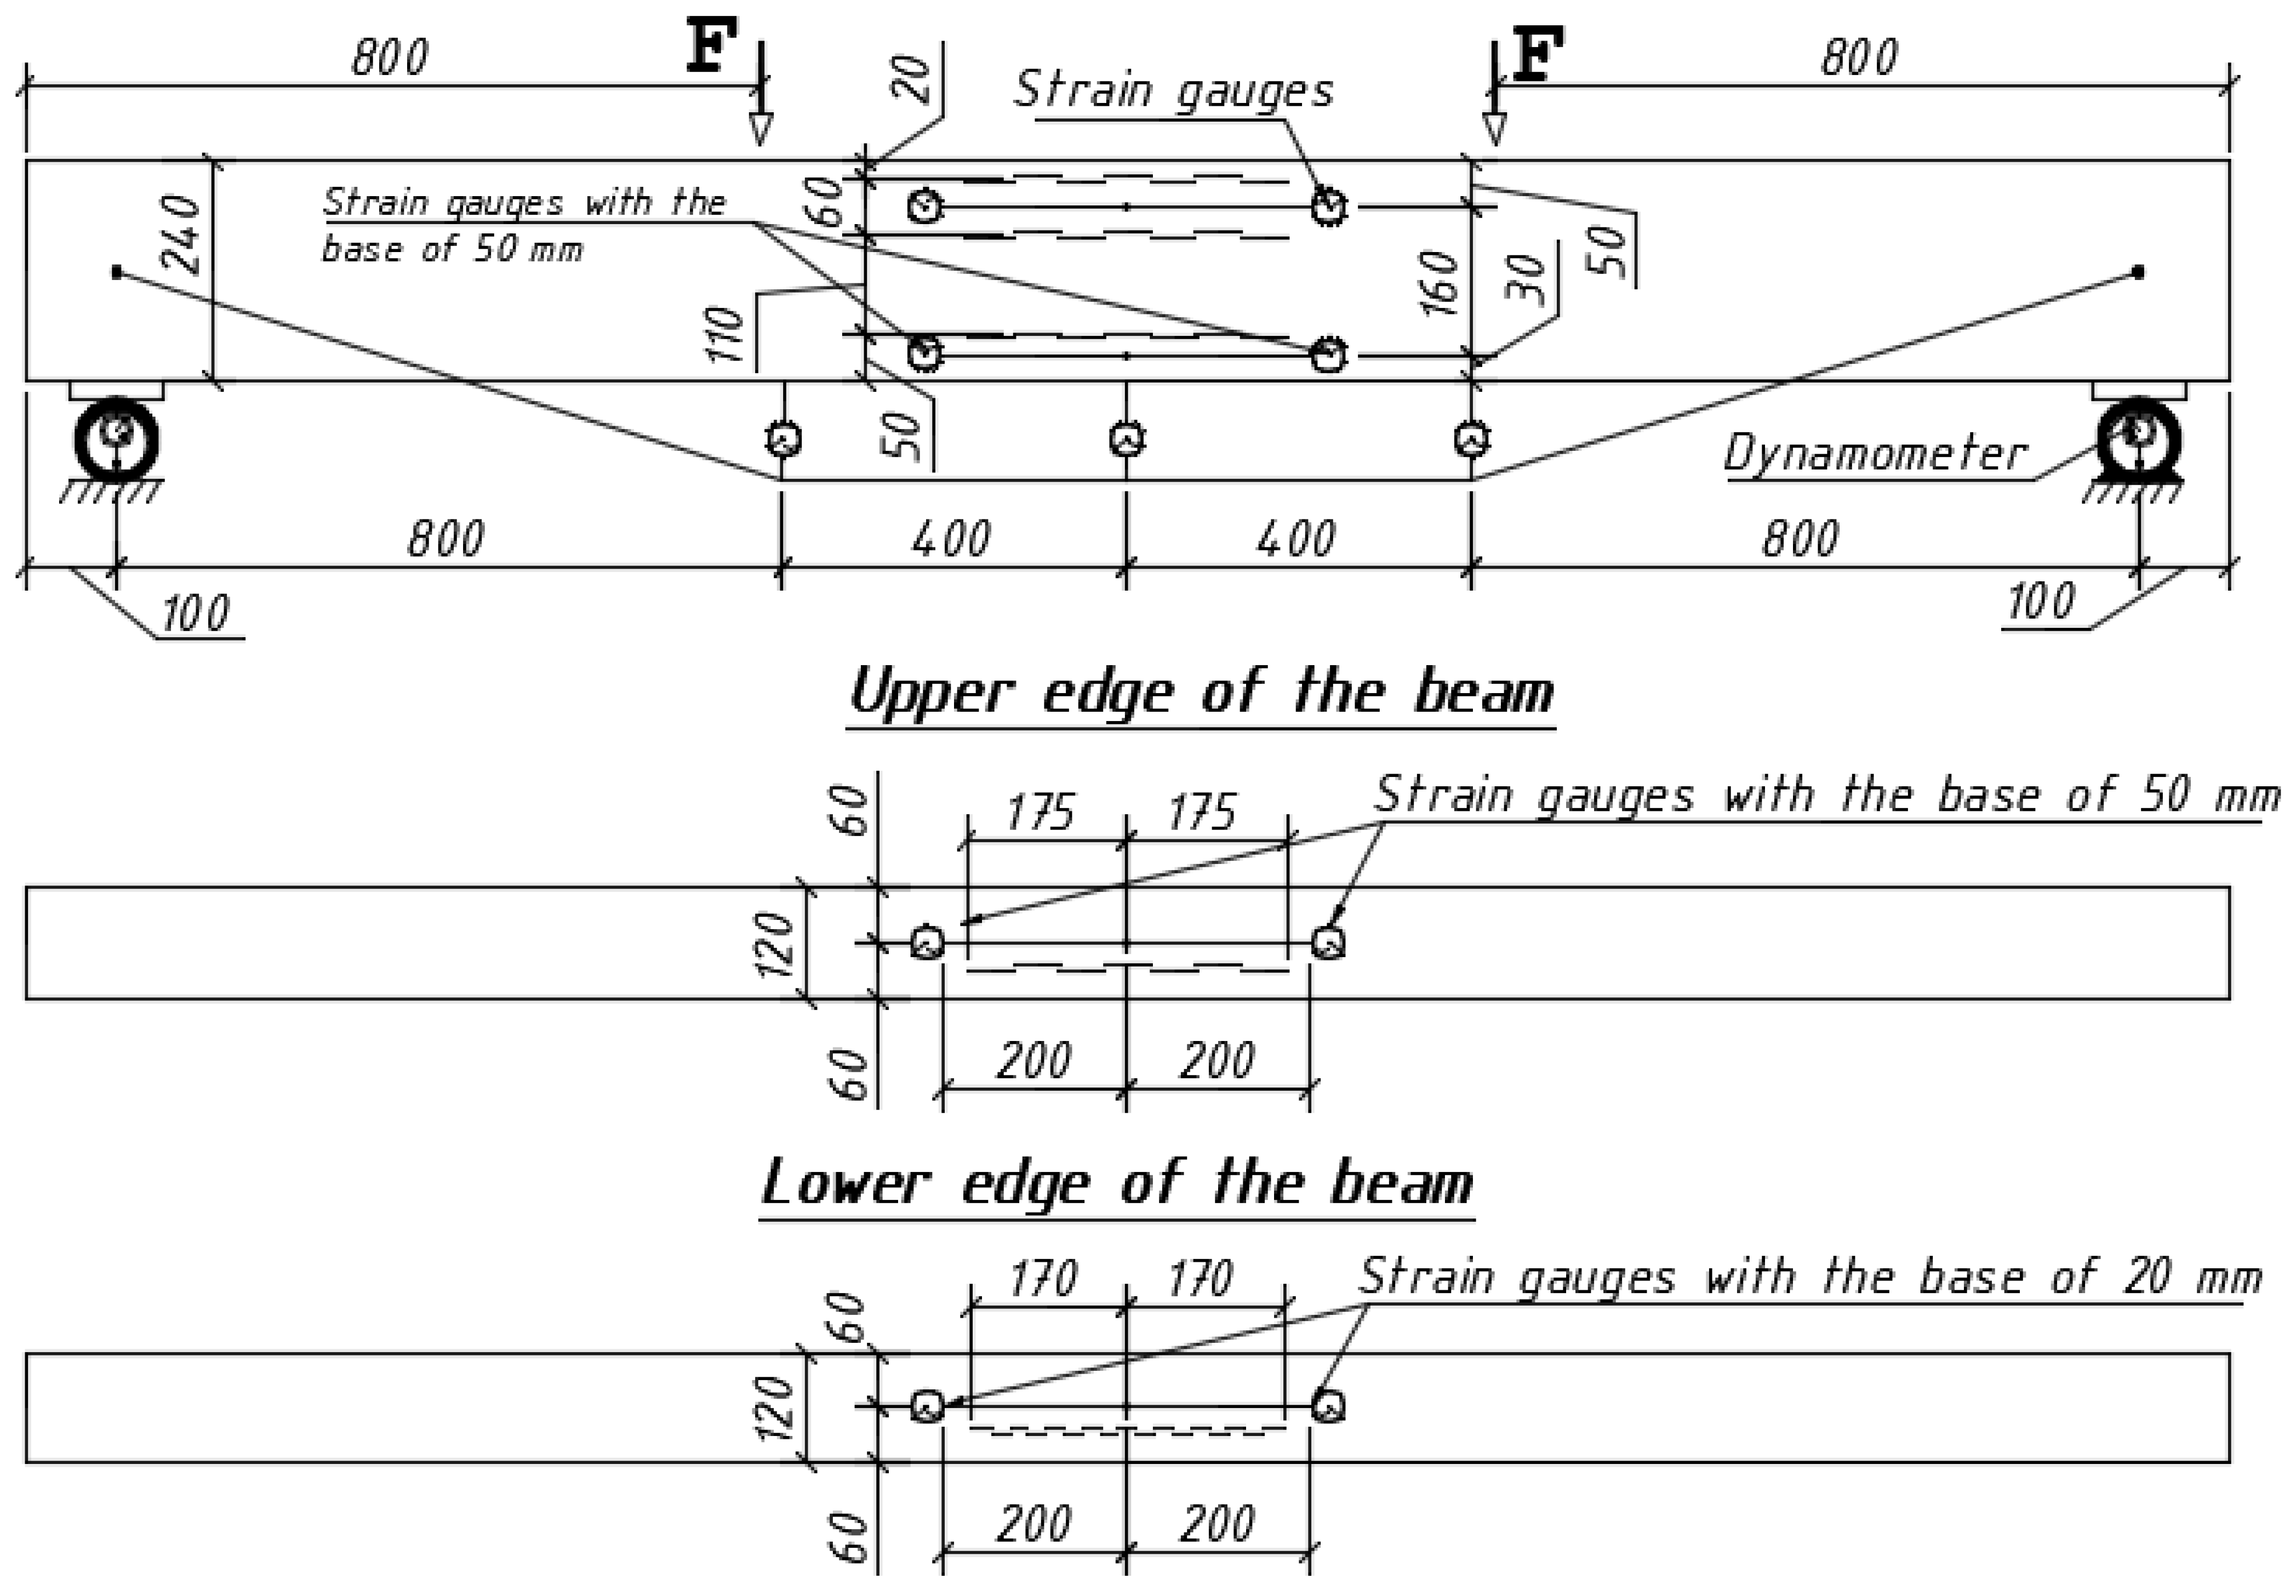
Deformations of high-strength reinforcement were measured using strain gauges (Microtech, Kharkiv, Ukraine) with base of 20 mm glued directly to the reinforcement.
The location of measuring devices on the concrete surfaces of the test samples and the loading scheme during the test are shown in Figure 3.
Strains in tape reinforcement were measured using clock-type micro-indicators fixed on special holders with a base of 200 mm and chains of electric strain gauges with a base of 20 mm. Chains of tensor resistors (Figure 4) with 50 mm base were pasted on the side surface and on the upper faces of the concrete to determine the tensile and compressive forces. All measurements were performed in the zone of pure bending. The operation of the strain gauges was monitored with the use of duplicating clock-type micro-indicators (with 200 mm base and 0.001 mm division value) installed on special holders.
The width of the cracks opening, as well as their height, was indicated at each loading stage and measured using a portable readout MOM-20 microscope with a division value of 0.01 mm (Microtech, Ukraine). In addition, formation of cracks was monitored visually and according to sharp increases in the readings of strain gauges.
The load tests were continued until the destruction of the experimental samples. This made it possible to get a complete picture of the work of the experimental beams.

2.2. Analytical Investigation

The methods of calculating the strength of sections normal to the longitudinal axis of steel-concrete beams reinforced with a package of reinforcement are similar to the calculation of ordinary reinforced concrete beams. However, the presence of different classes of reinforcement in the beams requires the clarification of calculation formulas that would take into account the combined operation of different classes’ rebar. The destruction of steel-concrete bent structures occurs in the same way as the destruction of reinforced concrete structures: due to the yielding of stretched reinforcement (the first case) or the destruction of compressed concrete (the second case).
However, in the case of steel-concrete beams with combined reinforcement, certain differences could be observed. In tape reinforcement, plastic deformations occur earlier than in high-strength steel bars. It is important to note that reaching the yield point in S275 steel tape does not cause the destruction of beams until plastic deformations in high-strength steel bars occur. Herewith, after the beginning of yielding the tape reinforcement continues to carry the part of the load corresponding to its yield strength while additional load is perceived by the high-strength steel bars. Additional factors affecting the operation of the beam include different modulus of elasticity of the tape and the rebar. In addition, important factors are different shoulders of internal force pairs, which are placed at different heights in the cross-section of the beam. The latter especially affects the joint work of steels of different strength.
The calculation of experimental beams according to DSTU B.V.2.6-156:2010 [43], DBN B.2.6-98:2009 [46], and Eurocode 2 [44] was performed using the deformation method. The compressive stress in concrete ∑c is determined by a simplified two-line deformation diagram. Depending on the relative deformation εc, the stress could be found using the formulas:
at   0 ε c f cd E cd ,   σ c   =   Ecd   ·   ε c ,  
at   f cd E cd ε c ε cu 3 , cd ,   σ c   =   fcd ,
where fcd—the design strength value; Ecd—the elasticity modulus value; ε cu 3 , cd —the limit strain value. Depending on the class of concrete, these values are taken according to Table 3.1 of DBN V.2.6-98:2009 [46]. The stress in the rebar, which has physical yield strength, for the first group of limit states depending on the relative deformations εs could be determined by the formulas:
ε s f yd E sd ,   σ s   =   Esd   ·   ε s .
For strains ε s > f yd E sd , they correspond to stresses equal to σs = fud.
For reinforcement that does not have a physical yield strength, conditional yield strength is accepted, which corresponds to the stress level at residual deformation of 0.2% depending on the relative deformation εs, which could be determined by the formulas (3). For strains ε s > f yd E sd , stresses are equal to:
σ s = f pd + ( f pk γ s f pd ) ε s ε s 0 ε ud ε s 0 ,
The general idea of the calculation according to the deformation method is taking into account the increase in deformations in the section rather than increase in forces. The general scheme of stress-strain state (stress and strain diagram) is given on Figure 5.
The main stage in the process of the strength calculation of the cross-section of reinforced concrete bent element is the formulation of state diagram of the cross-section (moment-curvature diagram). Such diagram allows us to indicate the beginning of the exhaustion of the bearing capacity of the section.
There are two forms of equilibrium equations for bent elements. The first case corresponds to x1 < h and 0 ≤ εc(1) ≤ εc3,cd, which correspond with equations:
bE cd ε c ( 1 ) 2 2 + i = 1 n A si σ si N = 0
bE cd ε c ( 1 ) 3 3 2 + i = 1 n A si σ si ε c ( 1 ) z si M = 0
For second case, they correspond with x 1 < h   and ε c 3 , cd ε c ( 1 ) ε cu 3 , cd :
b 2 f cd ( 2 ε c ( 1 ) ε c 3 , cd ) + i = 1 n A si σ si N = 0 ,
bf cd 3 2 ( 3 ε c ( 1 ) ε c 3 , cd 2 ε c 3 , cd 2 ) + i = 1 n A si σ si ε c ( 1 ) z si M = 0
where = 1 r = ε c ( 1 ) ε c ( 2 ) z 0 is the radius of curvature, and:
εc(1)—the value of strain in compressed concrete fiber;
εc(2)—the average strain of stretched concrete fiber;
εc3,cd—the value of compressive strain in concrete;
εsi,n—the value of strain in reinforcement;
fcd—design value of concrete strength on compression;
Asi—area of rebar;
σsi—limit stress in rebar;
z0—shoulder from the upper face of the section to the center of gravity of the rebar.
It is important to take into account the rule of signs, compression is described with “+” while tension is used with sign “−”.
If the solution of Equation (5) or Equation (6) is greater than zero, then the element is insufficiently reinforced (strains of the concrete are less than the maximum permissible). On the contrary, if the solution of the equation is less than zero, then the element is over-reinforced (strains of the reinforcement do not reach the limit values).
To determine the exact deformations in the reinforcement or concrete that would satisfy the Equations (5)–(8), in DSTU B. V 2.6-156:2010 [43], it is suggested to use iterative indication of strains until the solution of the equations is equal to zero. At the beginning of calculation when the equation is greater than zero, the new value of concrete strain εc1 is determined: ε c 1 ( 1 ) = ε cu 3 , cd Δ ε c 1 ( 1 ) , whereas at first iteration Δ ε c 1 ( 1 ) = 0 , 1 ε cu 3 , cd . If after substitution of new deformation values εc1(1) solution of equation is greater than zero, then it should be again reduced by Δ ε c 1 ( 1 ) until the equation reaches the negative solution: ε c 1 ( 2 ) = ε c 1 ( 1 ) Δ ε c 1 ( 1 ) . The change in the sign of the solution of the equation means that the range of solution existence of the equation Equation (6) is found. After that, the accuracy of the solution could be evaluated. The accuracy is acceptable if Δ   ε c 1 ( ni ) 0.02 ε cu 3 , cd . In second case, when the equation solution is less than zero, the new strain value for reinforcement εs1 could be obtained: ε s 1 ( 1 ) = ε s 1 , n Δ ε s 1 ( 1 ) . The accuracy is acceptable if Δ   ε s 1 ( ni ) 0.01 ε s 1 , n .
With the use of Equations (5)–(8), we could build the graphs, which were formed from zero solutions of equations. The intersection of these two graphs will be the solution of the system of two equilibrium equations. From the deformations obtained in this way, it is possible to find the stresses in the reinforcing bars and concrete, the height of the compressed zone, the radius of curvature, and the deflections of the reinforced concrete element. This approach required the use of computers, which allowed us to iteratively select the strain values of deformations that satisfy the system of equations.
The stress in the reinforcement, which has a physical yield strength, depending on the relative strains εs, could be calculated with the use of following equations:
if | ε s , i | = | ( ε cu 3 , cd z s , i ) | f yd , i E s , i , the stresses are equal to
σ s , i = E s , i ( ε cu 3 , cd z si )
If strains are equal to | ε si | = | ( ε cu 3 , cd z si ) | > f yd , i E s , i , then stresses could be calculated as:
σ s , i = f yd , i ε cu 3 , cd z s , i | ( ε cu 3 , cd z s , i ) |
For reinforcement, which does not have physical yield point, for strains ( | ε s , i | = | ( ε c u 3 , c d z s , i ) | f y d , i E s , i ) stresses are equal to:
σ s , i = E s , i ( ε cu 3 , cd z s , i )
At strains | ε si | = | ( ε cu 3 , cd z si ) | > f yd , i E s , i , stresses are equal to:
σ s = f yd + ( f p 01 γ s f yd ) ε s ε s 0 ε ud ε s 0
For rebar, located on the distance zi, equation will be the following:
σ s = f yd + ( f p 01 γ s f yd ) ( ε cu 3 , cd z si f yd , i E s , i ) ε ud f yd , i E s , i
After multiplication and simplification:
σ s = f yd ( 1 + ( ε cu 3 , cd z si f yd , i E s , i ) ( k 1 ) ε ud )
The calculation of the experimental samples was carried out according to the equations for the second form of section equilibrium, which took into account the nonlinear nature of the element’s operation, namely Equations (4.3) and (4.4) of DSTU B.V.2.6-156:2010 [43].
For test samples with three rows of reinforcement, including reinforcement of the compressed zone, the equilibrium equations have the following form:
b f c d h ε c 1 ε c ( 1 ) ε c ( 2 ) a 1 2 ε c ( 1 ) ε c 1 2 + a 2 3 ε c ( 1 ) ε c 1 3 + a 3 4 ε c ( 1 ) ε c 1 4 + a 4 5 ε c ( 1 ) ε c 1 5 + a 5 6 ε c ( 1 ) ε c 1 6 + ε c ( 1 ) z 1 ε c ( 1 ) ε c ( 2 ) h E s 1 A s 1 + + ε c ( 1 ) z 2 ε c ( 1 ) ε c ( 2 ) h E s 2 A s 2 + ε c ( 1 ) z 3 ε c ( 1 ) ε c ( 2 ) h E s 3 A s 3 N = 0 , x
b f C d h 2 ε C 1 2 ε C ( 1 ) ε C ( 2 ) 2 a 1 3 ε c ( 1 ) ε C 1 3 + a 2 4 ε C ( 1 ) ε C 1 4 + a 3 5 ε C ( 1 ) ε C l 5 + a 4 6 ε C ( 1 ) ε C 1 6 + a 5 7 ε c ( 1 ) ε C 1 7 + σ s 1 A s 1 ε C ( 1 ) h ε C ( 1 ) ε C ( 2 ) z s 1 + + σ s 2 A s 2 ε c ( 1 ) h ε c ( 1 ) ε c ( 2 ) z s 2 + σ s 3 A s 3 ε c ( 1 ) h ε c ( 1 ) ε c ( 2 ) z s 3 M = 0 ,
where   σ si = [ ε c ( 1 ) z i ( ε c ( 1 ) ε c ( 2 ) ) h ] E si
εc(1)—the values of strain of compressed concrete fiber;
εc(2)—the averaged values of strain of stretched concrete fiber;
zi—distance of i-th steel bar from the uppermost face of the section;
aк—coefficient for non-linear calculation of reinforced concrete structures;
M—ultimate bending moment that could be perceived by the section;
N—compressive force equal to zero.
The calculated deflections according to DBN B.2.6-98:2009 [46] were determined as for statically determined elements with constant cross-section, working according to the beam scheme, and were calculated according to the formula:
f = 1 r k m l 2 ,
where 1/r—the curvature in the section of the beam subjected to the highest bending moment and km—coefficient, which depends on the loading scheme according to Table 5.5 DSTU B.V 2.6-156:2010 [43].

3. Results and Discussion

When studying the operation of experimental reinforced concrete beams with combined reinforcement, the following stages were distinguished: work without cracks when the structure is a continuous elastic–plastic solid, cracks formation; work with cracks in stretched zone; beginning of yielding of tape reinforcement; reaching the conditional yield point in high-strength reinforcement; destruction of the compressed zone of concrete.
In particular, results for reinforced concrete beams with only one type of reinforcement, high-strength rebar (B-III) and steel tapes (B-IV), were considered, which served as the control basic values to compare the performance of beams with combined reinforcement. During the experimental research, specific attention was paid to the development of strains in working reinforcement and compressed concrete, as well as to the development of deformations at all loading stages. Since the test samples were designed for the same load-bearing capacity, their failure was expected at the same bending moments. This approach made it possible to evaluate the change in beam strength and deformability depending on the percentage of reinforcement and the quantitative ratio of high-strength rebar and tape reinforcement.

3.1. The Work of the Test Samples until the Moment of the Formation of Cracks

During the experimental studies of the beams at this stage, the following data were measured: the largest values of concrete strains in the stretched εbt and compressed εb zones, strains of the stretched reinforcement εs, and deflection of the beam. These values for the same bending moment are presented in the Table 1.
At this stage of work, the strains of A1000 high-strength reinforcement increase if its percentage is increased. The external tape reinforcement in the stretched zone works jointly with the concrete, and no difference in the strains was noticed. The largest deflections at this stage were recorded in reinforced concrete beams with only high-strength rebar (B–III), which is explained by the lowest percentage of reinforcement. It should be noted that the amount of external tape reinforcement significantly affects the deflections values. Samples with higher percentage of tape reinforcement had the greater stiffness. This could be explained by the difference in ultimate strains of S275 steel and A1000 rebar.

3.2. Process of Cracking

The formation of normal cracks in the experimental samples causes the violation of the homogeneity of stresses and strains of concrete. The processes of formation and opening of cracks are accompanied by a sharp increase in deformations and deflections. Therefore, the value of the bending moment corresponding to the break on the graph of the deformation and strain development was taken as the moment of crack formation. In this study, this conventional break point was determined with linear interpolation of two adjacent points from the predicted location of the graph sections. The load-bearing capacity of bended beams was carried out according to the ultimate limit state. Therefore, the basic value for comparative analysis is the value of maximum bending momentMdr2, which corresponds to the conditional yield point in high-strength rebar.
Cracks in the middle part of the beams B-I-1 and B-I-2 (with 1ø10 A1000 steel bar (0.785 cm2) and 6.56 cm2 of tape reinforcement) appeared at loading, equal to 0.14 Mdr2 (see Table 3). These cracks immediately spread to the height of 0.2–0.3 of the total height of the beam. Cracks in beams B-II-1 and B-II-2 ( with 2ø10 A1000 steel bars (1.57 cm2) and 3.68 cm2 of tape reinforcement) appeared at loading, equal to 0.15 Mdr2. The height of the cracks reached the value of 0.13–0.3 of the beam’s height. In beams B-III-1 and B-III-2 (with 3ø10 A1000 steel bars (2.355 cm2)), the cracks were indicated at loading equal to 0.2 Mdr2. The cracks’ height was 0.13–0.25 of the total height of the beam. Beams B-IV-1 and B-IV-2 with only external steel tape reinforcement of 9.12 cm2 total area. First cracks appeared at loading 0.16 Mdr2. A comparison of experimental and theoretical moments of crack formation is given in Table 2.
Higher values of high-strength rebar percentage correspond to higher moments of crack formation. This can be explained by the fact that the reduction of the tape reinforcement area reduces the stress in the places where the anchors are welded, which facilitate mor evem redistribution of stresses in the zone of maximum bending moment. However, in steel-concrete beams B-IV the moment of the formation of cracks is the highest, which is explained by the highest percentage of reinforcement.
The deviation between experimental and theoretical results according to DBN B.2.6-98:2009 [46] for beams with A1000 class rebar in combination with S275 tape ranges from 14.2% to 23.5%. Experimental results of the moments of crack formation for different samples are given in Table 3. Graphs of strains development are presented on the Figure 6. Beams B-I-1 and B-I-2; B-II-1 and B-II-2; B-III-1 and B-III-2; and B-IV-1 and B-IV-2 formed the twin pairs to confirm the validity of the data.
Beams B-I-1 and B-I-2; B-II-1 and B-II-2; B-III-1 and B-III-2; B-IV-1 and B-IV-2, which were the twin pairs, had exactly the same parameters (reinforcement ratio and amount of each type of the reinforcement). Therefore, the similarity and closeness of graphs for this samples confirms the reliability of the obtained experimental data.” The formation of cracks in the stretched zone of concrete causes increase in strains in the longitudinal working reinforcement. The graphs of strain development in tape and high-strength rebar follow the similar trend. Strain values in the rebar are lower due to the different arm of the force pair, which affects the part of force, transmitted to the reinforcement

3.3. Deformability or Research Sample with Cracks in Stretched Zone

With further loading of the test samples, the width of the cracks’ opening, and their number increases. The distance between them decreased. The new cracks were formed continually up to a load of about 0.8 Mdr2. According to DSTU B V.2.6.-156:2010 [43], the maximum allowable crack opening width in beams, operated under normal conditions at moderate air-humidity regime should not exceed 0.3 mm. Determination of the crack opening width is of high significance in order to ensure the protection of rebar from corrosion. Experimental and theoretical values of bending moments, which correspond to maximum allowable crack opening, are given in Table 4.
The maximum allowable crack opening in the middle part of the beams B-I-1 and B-I-2 (with 1ø10 A1000 steel bar and 6.56 cm2 of steel tape) was reached at loading level, equal to 0.54 Mdr2; the cracks’ height reached 0.67–0.71 of the beams’ height. When the limit loading level was reached, cracks in the middle part of the beam was equal to 0.7–0.75 of the beams’ height.
In beams B-II-1 and B-II-2 (with 2ø10 A1000 steel bars and 3.68 cm2 of steel tape), the maximum allowable crack opening was reached at the same load level. However, the maximum crack height increased up to the value of 0.75 of the beams’ height. When the maximum load was reached, the cracks in the middle part of the beam spread up to a height of 0.79–0.82 of the beams’ height. It should be noted that in comparison with the beams of the first series, the number of cracks in the zone of pure bending in these samples increased by 35%, and distances between the cracks were greater.
In beams B-III-1 and B-III-2 (with 3ø10 A1000 steel bars), the maximum allowable crack opening was reached at load level equal to 0.63 Mdr2; the maximum crack height was equal to 0.71–0.78 of the beams’ height. After reaching the ultimate load, the cracks in the zone of pure bending spread up to height of 0.75–0.83 of the beams’ height. A comparison of the cracks’ number in the beams of this series with the beams of the first series shows significant increase in cracks amount (by 93%) while the distance between the cracks has decreased by 1.5 times.
Beams B-IV-1 and B-IV-2 were reinforced only with external steel tape with total area of 9.12 cm2. The maximum allowable crack opening was reached at a load of 0.91 Mdr2; the maximum crack height was 0.74 of the beams’ height. When the ultimate load was reached, the cracks in the zone of pure bending spread up to a height of 0.79–0.82 of the beams’ height. The number of cracks formed in the beams of this series was almost the same as in the beams of the first series; the difference did not exceed 4%.
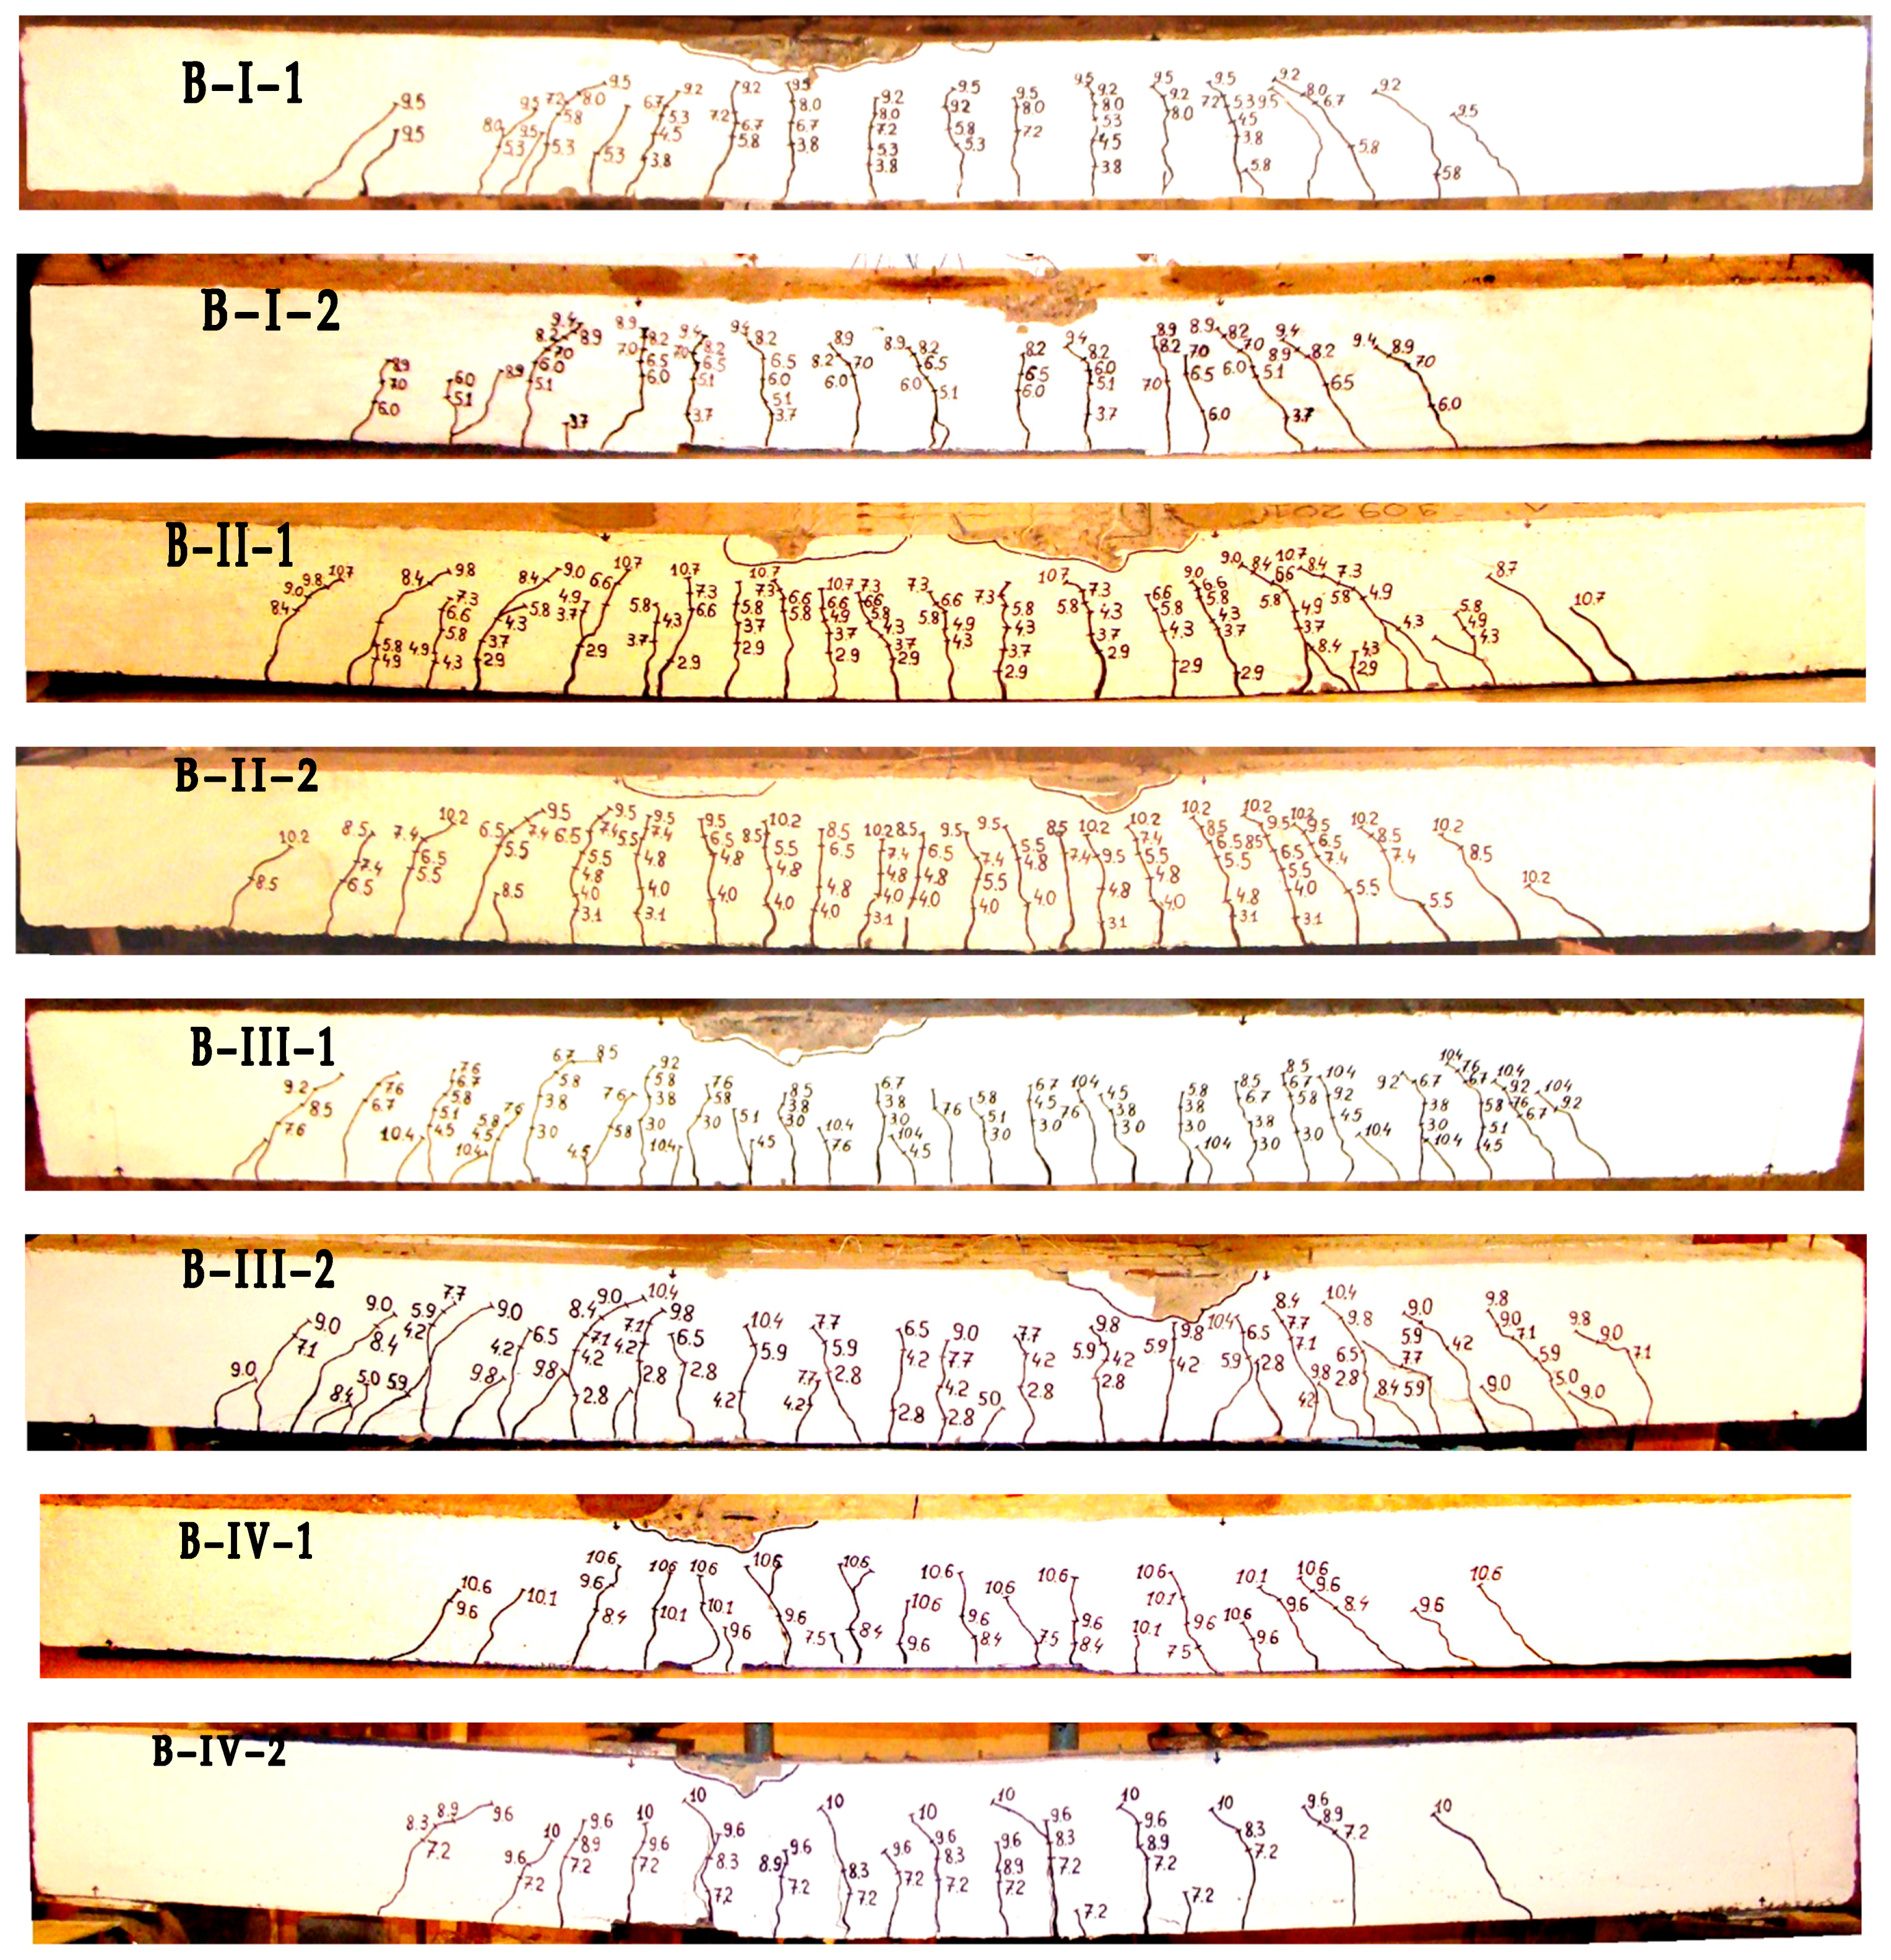
Figure 7 shows the specifics of beam destruction.

3.4. Destruction Stages of Research Beams

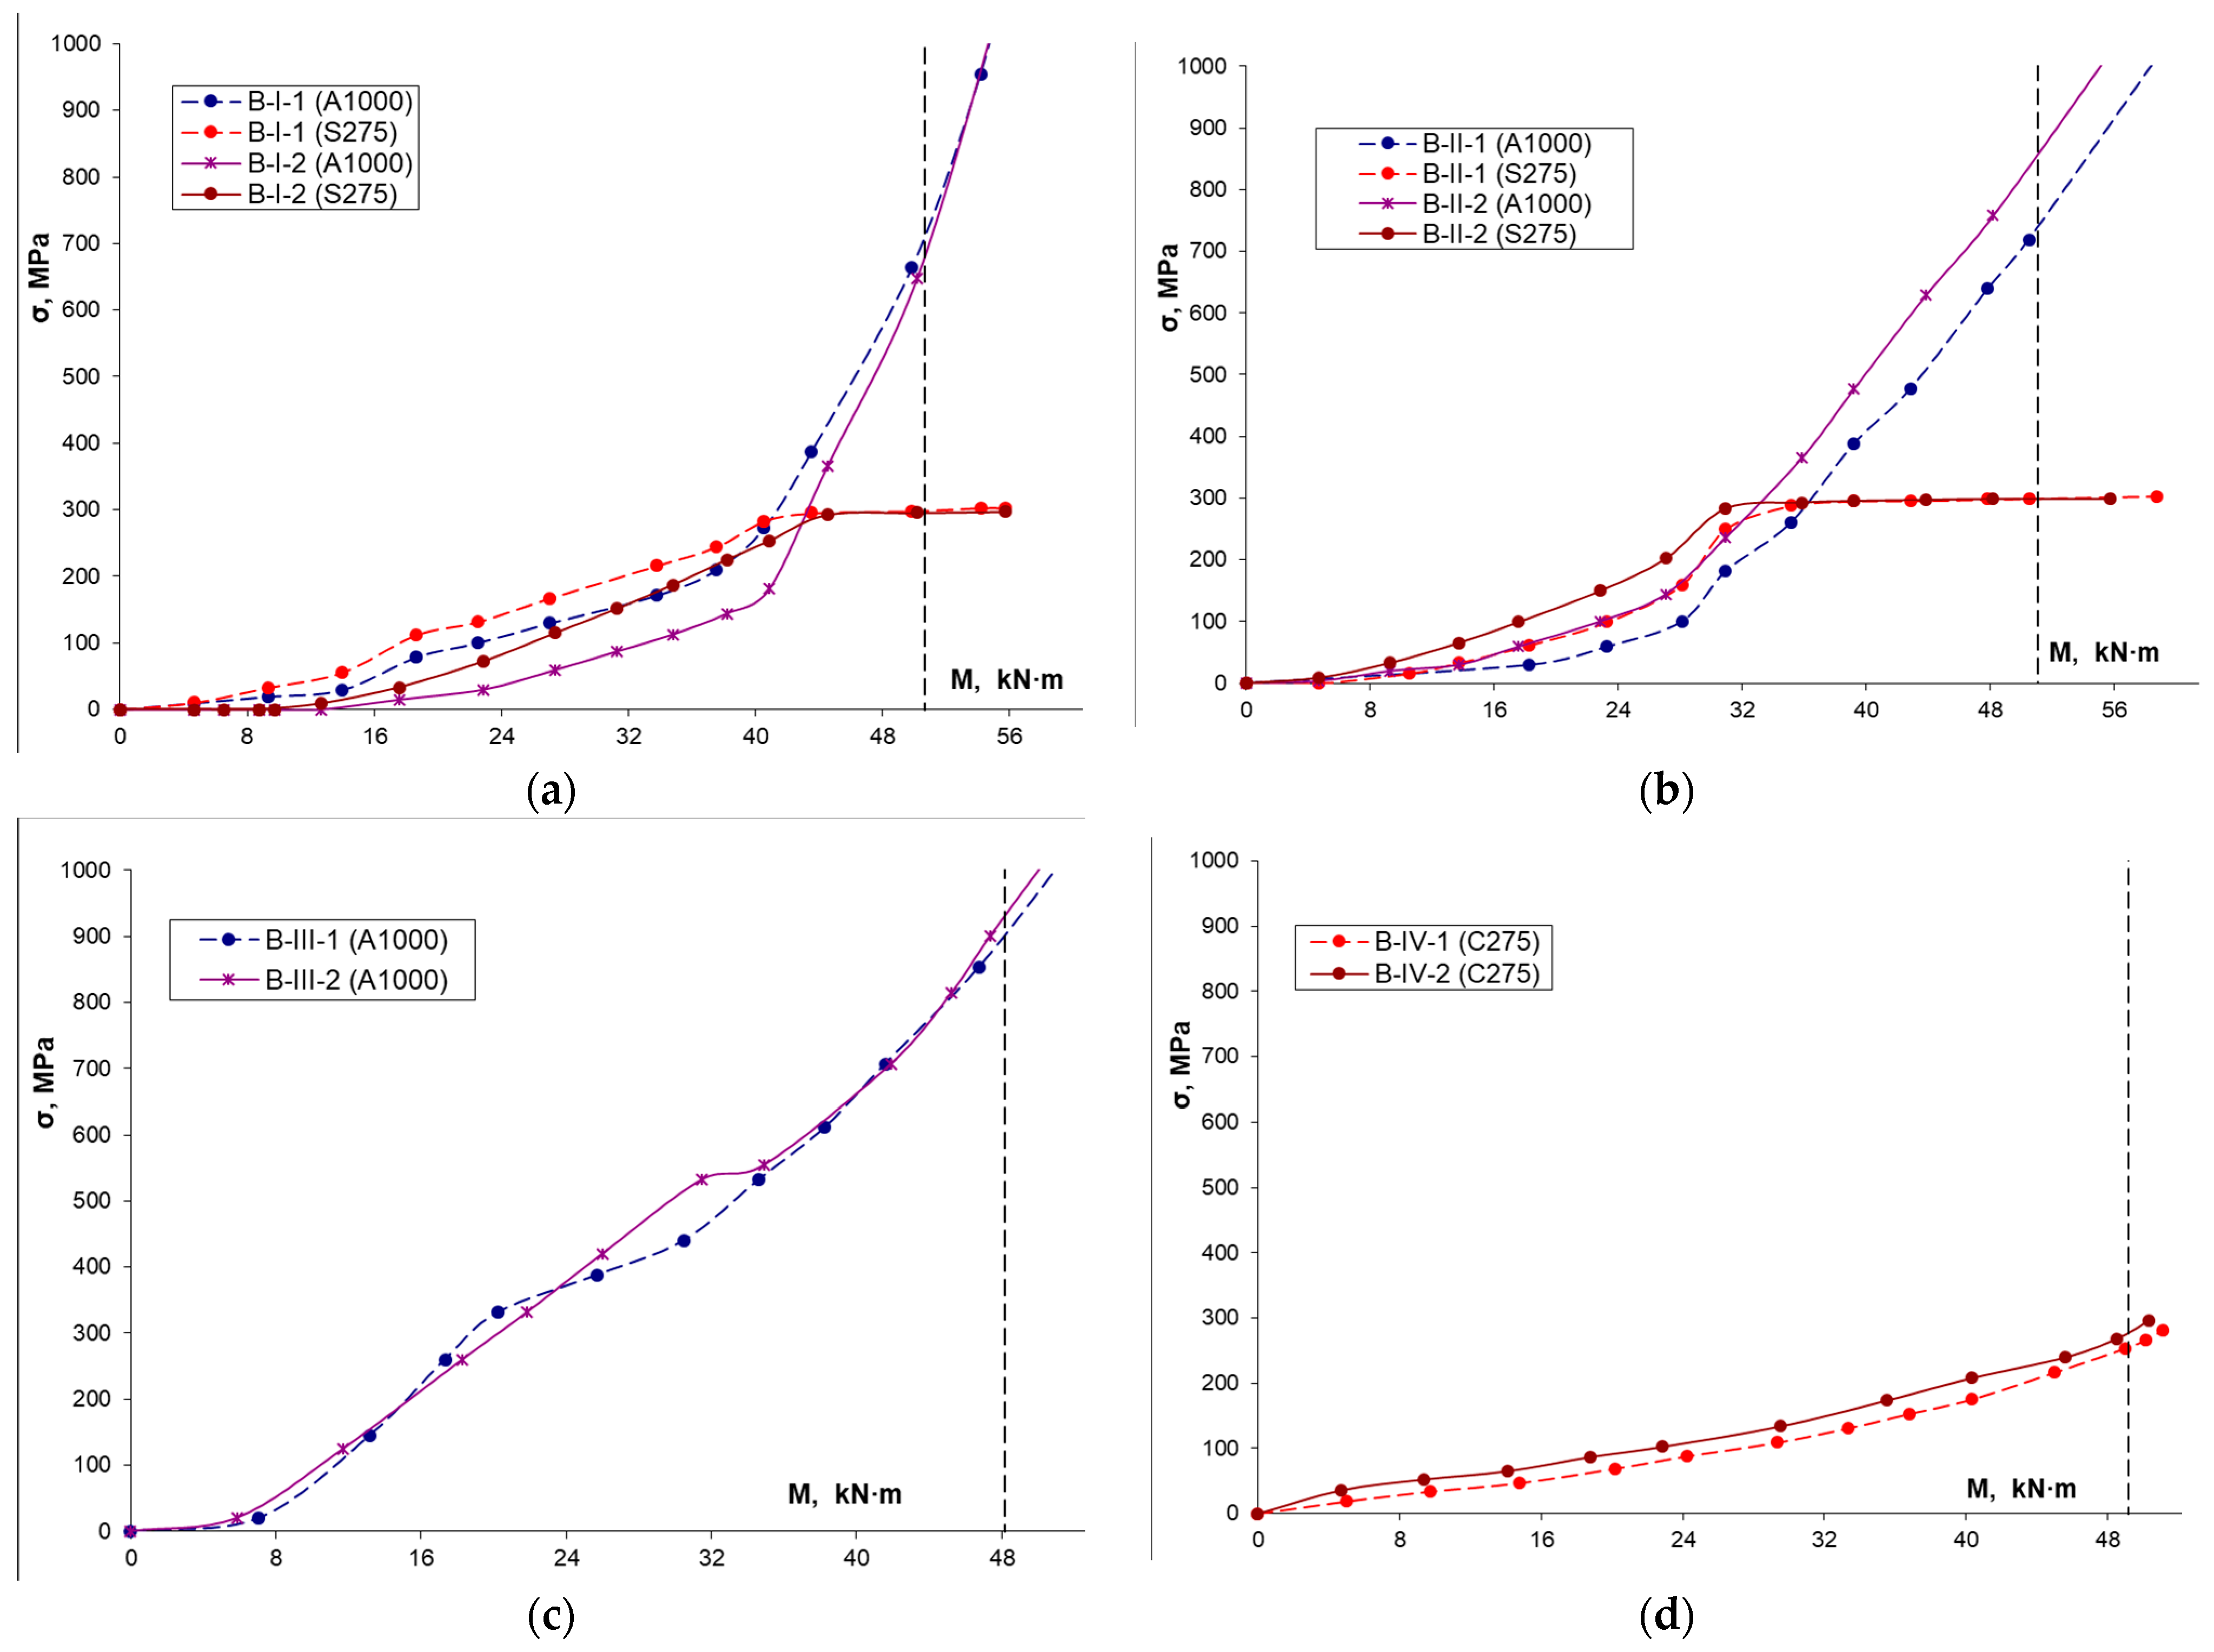
As the load increases, strain in the tape reinforcement reaches limit values that correspond to yield point. It should be noted that yielding in tape reinforcement occurred when deformations reached the value of εs,tape = 137 × 10−5. After that, during further loading, there was a significant increase in the strain of high-strength rebar and in the deflections of the beam while tensile stress in the tape reinforcement remained the same at level fykAs,tape. All subsequent load increments were perceived by the high-strength rebar until its yield strength was reached. Even after the beginning of yielding, the tape reinforcement continued to perceive the part of the load that corresponded to its yield point. Yield strength in high-strength rebar was reached at relative elongation εs,rebar1000 = 564 × 10−5 for reinforcement of A1000 class. The largest values of concrete strain in the stretched and compressed zones, strains of stretched reinforcement and deflections up to the moment of the limit cracks’ opening at load level of 0.7 Mdr2 are given in Table 5.
The yield point in tape reinforcement was reached earlier than in high strength rebar. At this stage, the sharp increase in strains and deformations were recorded. It was noted that after the yield point of steel tape, the beam continued to perceive the increasing load. However, after the yielding in the high-strength rebar, the additional load on the beam cannot be perceived. Therefore, further loading caused significant growth in the reinforcement strains, sharp opening of cracks, and increase in deflections. The ultimate load bearing capacity was reached after the physical destruction of the compressed concrete as a result of its fragmentation.
The beams were designed in such a way that the conditional yield of the high-strength rebar occurred earlier than the failure of the compressed concrete. The destruction of the compressed concrete zone of the samples had a plastic character and began after reaching yield point in the high-strength reinforcement. After further growth of concrete strain its destruction occurred. The bending moment that corresponds to the yield stress in the tape reinforcement is denoted as Mdr1, and the moment that corresponds to the yielding of high-strength rebar is called the ultimate bending moment Mdr2.
The values of the stresses in the working reinforcement depending on the bending moment values are shown in the graphs in Figure 8.
Determination of the limit state of beams in terms of strength was carried out according to strain diagrams of beam reinforcement samples received from the experimental data. During the experiment, an analysis of the stress–strain state of the reinforcement and concrete was carried out and corresponding stress graphs were built. Thus, it became possible to predict the behavior of the test samples under subsequent loads and to determine the moment, corresponding to yield point in the tape reinforcement. Graphs of the development of stresses in tape and high-strength rebar depending on the loading stage are given in Figure 8.
Theoretical values of the test samples’ load-bearing capacity were determined according to methods presented in DBN V.2.6-98:2009 [46], DSTU B. V 2.6-156:2010 [43], and Eurocode 2 [44]. Experimental and theoretical values of ultimate bending moments were compared and presented in Table 6.
From the tabular data it could be seen that in all beams where tape reinforcement had adhesion to concrete, its yielding occurred at (0.49 ÷ 0.83) Mdr2 for samples with a different amount of high-strength rebar (31.2 ÷ 61.9%), respectively. In the beams without reliable bonding between the tape and the concrete the yielding of the tape occurred at 0.83 ÷ 0.90 Mdr2 for samples with a different percentage of high-strength rebar (40.3 ÷ 59.9%), respectively.
Comparison of the experimental results for different samples is given below.
Beams B-I-1, B-I-2 (concrete compressive strength was fck,cube = 48.7 MPa, ratio (fyk,A1000As,A1000)/(fyktape As,tape) = 31.2%/68.8%; reinforcement percentage of the beam was 2.77%). Yielding of tape reinforcement was reached at Mdr1 = 42.7 kNm and 43.6 kNm, respectively, which accounted about 0.83 Mdr2. Yield point of high-strength rebar was reached at bending moment Mdr2 = 51.52 kNm for beam B-I-1 and 52.64 kNm for B-I-2. The value of the destructive moment, predicted by the theoretical calculation, was equal to MDBN = 51.38 kNm.
For beams B-II-1, B-II-2, the following was observed: fck,cube = 46.3 MPa, ratio (fyk,A1000As,A1000)/(fyk,tape As,tape) = 61.9%/38.1%; reinforcement percentage was 1.97%. The yielding of the tape reinforcement was reached at Mdr1 = 31.1 kNm, which is equal to 0.57 Mdr2. The yield point of high-strength rebar was reached at bending moment Mdr2 = 55.2 kNm for beam B-II-1 and 52.4 kNm for B-II-2. The value of the destructive moment, according to the theoretical calculation, was equal to MDBN = 52.10 kNm.
For beams B-III-1 and B-III-2, the following was observed: fck,cube = 46.3 MPa, high-strength A1000 rebar without tape reinforcement; reinforcement percentage 0.89%. The yielding of teh high-strength rebar was reached at Mdr2 = 55.36 kNm for beam B-III-1 and 57.04 kNm for B-III-2. The value of the destructive moment, predicted by the theoretical calculation, was equal to MDBN = 52.85 kNm.
For beams B-IV-1, B-IV-2, the following was observed: fck,cube = 49.2 MPa, reinforced with A240S steel tape of, without high-strength rebar; reinforcement percentage was 3.45%. The yielding of the steel tape was reached at Mdr1 = 51.49 kNm and 50.57 kNm, respectively. The value of the destructive moment, according to the theoretical calculation, was equal to MDBN = 50.25 kNm.

3.5. Curvature and Deflections of Test Beams

Theoretical calculations were carried out according to normative regulations for load levels of 0.4 Mdr2 and 0.7 Mdr2 in order to further conduct the comparative analysis of experimental data.
Deflections development of studied beams are presented on graphs in Figure 9. From the graphs it could be seen that at loading levels, which are less than the moment of crack formation, deflections increase proportionally to the loading level. Parts of the graphs that correspond to this stage of loading are practically rectilinear. The values of deflections of twin beams until the moment of crack formation are practically the same and maintain linear relationship. After the formation of cracks in the concrete of the stretched zone, the growth in deflections increases, which is expressed by the distortion of the graphs (see Figure 9).
As could be seen from the Figure 9, the beginning of yielding of tape reinforcement is accompanied with a further increase in the growth of strains and deflections. The greater the percentage of tape reinforcement, the sharper the increase in deflections can be observed after its yielding. It depends on the difference in forces perceived by tape and rebar. The maximum permissible deflection was accepted equal to the value of 1/250 of the beam span according to DSTU B V.2.6-156:2010 [43], namely 9.6 mm. Numerical experimental and theoretical values of deflections are presented in Table 7.
The results of the study prove that when the percentage of high-strength rebar increases, the values of deflections increase. For example, the beams B-I-1, B-I-2 with ratio (fykA1000AsA1000)/(fyktape Astape) = 31.2%/68.8%, and the reinforcement percentage of 2.77% can be considered. Deflections at loading level 0.7 Mdr2 were equal to the following values: 4.55 mm for beam B-I-1 and 5.08 mm for beam B-I-2, which accounted for 47.4% and 52.9% of the limit permissible value (9.6 mm), respectively.
For beams B-II-1, B-II-2, the following was observed: ratio (fykA1000AsA1000)/(fyktape Astape) = 61.9% / 38.1%; reinforcement ratio—1.97%. Comparison with the beams of previous series shows that the deflections at loading level 0.7 Mdr2 increased by 2.1 times and reached value of 9.44 mm—for beam B-II-1 and 9.56 mm—for beam B-I-2. Thais values amounted about 98.3% and 99.6% from the limit permissible deflection value, respectively.
For beams B-III-1, B-III-2, the following was observed: concrete beams reinforced with high strength rebar of A1000 class, with reinforcement ratio of 0.89%. Comparing with the beams of first series, defection at loading level of 0.7 Mdr2, increased in 4.5 to 4.2 times, respectively and reached values of 20.32 mm—for beam B–III–1 and 21.57 mm—for beam B–III–2. These values exceed the maximum allowable deflection by 211.7% and 224.7%, respectively
For beams B-IV-1, B-IV-2, the following was observed: steel-concrete beams with tape reinforcement, which has adhesion to concrete (reinforcement ratio 3.45%). Compared with the beams of the first series, deflections at loading level 0.7 Mdr2 decreased by 10% and amounted to 4.15 mm for beam B-IV-1 and 4.55 mm for beam B-IV-2. This was equal to 43.2% and 47.4% from the maximum allowable deflection.
The valid normative code DBN B.2.6-98:2009 provides full concrete strain-diagrams and the corresponding equations, which allow us to assess with sufficient accuracy the deformability of both steel-concrete elements with combined reinforcement and reinforced concrete elements. The deviation from experimental data does not exceed 20.9%.
Thus, when comparing the values of moments of ultimate crack opening, maximum moments, deflections, and the percentage of high-strength rebar, it can be concluded that the combined reinforcement of steel–concrete beams using A1000 steel bars and S275 tape is sufficiently effective under the condition of transferring 25–55% of tensile forces to high-strength rebar. The use of such combined reinforcement allows us to reduce the percentage of reinforcement by 15–30% due to the higher design strength of high-strength reinforcement. In addition, such an approach enables us to ensure the requirements for strength, deformability, and crack resistance of the structure.

4. Conclusions

The study describes a thorough theoretical and experimental investigation of the load-bearing capacity, deformability, and stress–strain state of steel–concrete structures with combined reinforcement. The article also includes detailed literature review of the scientific papers related to this issue. The most valuable information studied in referred sources is briefly described in Appendix B.
During the experimental investigation the specifics of stress–strain state of the beam were monitored and compared at different loading stages. Before the formation of the cracks, the strains of A1000 rebar were higher in the samples with its higher percentage. The largest deflections before the moment of cracking were recorded in RC beams without steel tapes due to the lowest percentage of reinforcement. In addition, the positive influence of the amount of steel tapes on the stiffness of samples was noted. The formation of normal cracks in the experimental samples caused the violation of the homogeneity of stresses in concrete. The formation and opening of cracks are accompanied by a sharp increase in deformations and deflections. For samples with a higher percentage of high-strength rebar, higher moments of crack formation due to absence of stress concentrators and more even stress distribution were noted. In general, after the formation of cracks, the strains in stretched rebar increase sharply. The development of cracks was monitored during the experiment. It was noted that in the beams of the second series, the number of cracks in the zone of pure bending increased by 35% in comparison with the first series. For beams without tape reinforcement, a significant increase in cracks that amounted to 93% was observed while the distance between the cracks decreased by 1.5 times. The number of cracks in samples reinforced only with external steel tape was almost the same as in the beams of the first series.
After the cracking, the destruction stage was reached, during which the specific features were noted. After the stresses in the tape reinforcement reached the yield point there was the sharp increase in strains and deflections, but the beam continued to perceive the increasing load. However, when the yielding in the high-strength rebar began, the additional load of on the beam could not be perceived. Further loading caused significant growth in the reinforcement strains, sharp opening of cracks and increase in deflections.; The ultimate load bearing capacity was reached after the physical destruction of the compressed zone of concrete.
The calculation of experimental beams according to DSTU B.V.2.6-156:2010 [43], DBN B.2.6-98:2009 [46], and Eurocode 2 [44] was performed using the deformation method, which enabled the comparison with experimental data. The valid normative regulations DBN B.2.6-98:2009 [46] with the use of concrete strain diagrams and the corresponding equations allow us to assess the deformability of both steel-concrete elements with combined reinforcement and reinforced concrete elements with sufficient accuracy. The deviation from experimental data does not exceed 20.9%.
The analysis of theoretical and experimental results enables us to make the following conclusions. In the presence of high-strength rebar without prestressing, the exhaustion of load-bearing capacity of the beams does not occur after the yielding of the tape reinforcement. The limit values of load-bearing capacity are determined by significant plastic deformations of the high-strength A1000 steel bars. This specific detail allows us to calculate the load-bearing capacity of the beams at the conditional yield point of the high-strength reinforcement and to fully use the strength characteristics of both S275 steel tape and high-strength rebar.
If the percentage of high-strength rebar is increased, the load-bearing capacity of the beams also increases. However, for such samples, a greater number of cracks and higher deflection values were recorded.. The growth in deflections under load in steel-concrete beams with a higher percentage of high-strength rebar is a consequence of uniform and cumulatively larger deformations of high-strength rebar. This is caused by a slightly lower modulus of elasticity and larger ultimate deformations of high-strength rebar in comparison with S275 steel.
The experimental and theoretical studies made it possible to establish that the optimal percentage of high-strength rebar without prestressing is achieved if 25–55% of the tensile force is transferred to it. The use of high-strength rebar in combined reinforcement reduces the total percentage of reinforcement by 15–30% while the requirements for deformability, crack resistance, and strength are fulfilled.
The conducted complex investigation enables us to identify prospective issues and recommendations for future research. For instance, for a more complex understanding of such combined reinforcement, further experimental research with the use of high-strength rebar of different strength classes is needed. Another important issue for thorough investigation could be dedicated to RC structures, strengthened with external steel tape under the initial loading. A steel–concrete structure is the prospective and promising approach to strengthening RC structures, as well as for designing structures with combined reinforcement at the initial stage.

Author Contributions

Conceptualization, Y.B., J.S.; methodology, T.B.; validation, Y.B., J.S. and Z.B.; formal analysis, T.B. and Z.B.; investigation, Y.B., T.B. and N.K.; writing—original draft preparation, T.B., N.K. and Z.B.; writing—review and editing: Y.B., N.K. and J.S.; supervision, Z.B. and J.S.; visualization, N.K. All authors have read and agreed to the published version of the manuscript.

Funding

This research received no external funding.

Institutional Review Board Statement

Not applicable.

Informed Consent Statement

Not applicable.

Data Availability Statement

The authors confirm that the data supporting the findings of this study are available within the article.

Conflicts of Interest

The authors declare no conflict of interest.

Appendix A

Table A1. Characteristics of the test samples.
Notation of the BeamsB-I-1,
B-I-2
B-II-1,
B-II-2
B-III-1,
B-III-2
B-IV-1,
B-IV-2
Parameters of beam’s cross-sectionWidth b, mm120120120120
Height h, mm240240240240
Area A, cm2288288288288
Tape reinforcement of S275 class (stretched zone)Width bs, mm8246-114
Thickness ts, mm88-8
Area As, cm26.563.68-9.12
Longitudinal steel bars of (stretched zone)Number and diameter of steel bars øs, mm. Strength class1ø10
A1000
2ø10
A1000
3ø10
A1000
-
Area As, cm20.7851.5702.355-
Rs(fyk) × As, steel bar
Rs(fyk) × As, tape
31.2%
68.8%
61.9%
38.1%
100%
0%
0%
100%
The total reinforcement ratio2.77%1.97%0.89%3.45%
Longitudinal steel bars (compressed zone)Number and diameter of steel bars øs, mm2ø8
A400S
2ø8
A400S
2ø8
A400S
2ø8
A400S
Area As′, cm21.0051.0051.0051.005
Transverse steel barsNumber and diameter of steel bars øsw, mm2ø5
A240S
2ø5
A240S
2ø5
A240S
2ø5
A240S
Area Asw, cm20.3920.3920.3920.392
spacing S, mm70707070
Table A2. Physical characteristics of materials of the experimental beams.
Notation of the BeamsB-I-1,
B-I-2
B-II-1,
B-II-2
B-III-1,
B-III-2
B-IV-1,
B-IV-2
ConcreteCharacteristic value of strength, fck,cube/fck,prism, MPa48.7/29.646.3/28.146.3/28.149.2/29.9
Design value of strength, fcd, MPa22.821.621.623.0
Modulus of elasticity, Ecm × 103, MPa38.0037.7638.0438.50
Tape reinforcement (stretched zone)Width×thickness, Bs × ts, mm82 × 846 × 8-114 × 8
Characteristic value of strength, fyk, MPa287287-287
Design value of strength, fyd, MPa273273-273
Modulus of elasticity, Ep × 105, MPa2.052.05-2.05
Strength classS275S275-S275
Longitudinal steel bars of (stretched zone)Diameter, ∅, mm1ø102ø103ø10-
Characteristic value of strength, fyk, MPa108010801080-
Design value of strength, fyd, MPa900900900-
Modulus of elasticity, Ep × 105, MPa1.851.851.85-
Strength classA1000 A1000A1000-
Longitudinal steel bars (compressed zone)Diameter, ∅′, mm8888
Characteristic value of strength, fyk′, MPa594.5594.5594.5594.5
Design value of strength, fyd′, MPa495495495495
Modulus of elasticity, Ep′ × 105, MPa2.052.052.052.05
Strength classA400SA400S A400SA400S
Transverse steel barsDiameter, ∅, mm5555
Design value of strength, fywd, MPa296296296296
Modulus of elasticity, Ep × 105, MPa2.052.052.052.05
Strength classA240S A240S A240SA240S

Appendix B

In this annex, the most valuable information studied in referred sources is addressed.
Fundamental Parameters Related to Concrete Durability [2].
Articles [1,2] include the detailed analysis of the destruction mechanism in concrete and reinforced concrete structures. Articles highlight the high prevalence of RC structures and critical consequences due to their damages and destruction. Findings of authors confirm the necessity of development of reliable strengthening methods of RC structures
Articles [3,6] include important information about the innovative and effective techniques for monitoring of RC structures stress-strain state and evaluation of their residual bearing capacity, thus highlighting the importance of thorough understanding of their performance. Articles [4,5] highlight the critical danger, caused by damages in RC structures and necessity of sustainable design of strengthening systems.
In studies [7,8,9,10,11,12], information about the possible reasons of reduced strength and load-bearing capacity of RC structures and necessity of their strengthening was found. In addition, [10] describes different factors, which cause specific features of destruction mechanisms, which are also important for sustainable strengthening design.
In works [13,14,15,16,17,18,19], important information and analysis of different strengthening approaches was found, in particular: with CFRP-materials, [14,16,18,19], polymer fibers,-[13], external steel tapes, [15], prestressed external reinforcement, metal and reinforced concrete jackets, near-surface mounted reinforcement, [13,14,15].
From articles [20,21,22,23,24,25,26], essential information about specifics of strengthening with external steel tapes was found and analyzed, in particular the load-bearing capacity [20,22], specifics of flexural and structural behavior [21,25,26,33,34], shear strength [23,24,25], stiffness and deformability [40], and serviceability [42].
One of the important factors, influencing the work of structures with external reinforcement is the corrosion of steel. Therefore, this parameter was analyzed in more detail according to information in [27,28].
The effectiveness of such strengthening system was thoroughly investigated in studies [29,32]; this information was used for prediction of optimal strengthening parameters and planning of the experiment.
As our study included the theoretical assessment and calculation of load-bearing capacity of such structures, the existing calculation techniques of steel concrete structures were analyzed according to [30,35,36]. Theoretical investigation was done according to valid normative regulations given in [43,44,45,46].
One of the important advantages of strengthening with external steel tapes is that it has easy application; the main operations were described in [31,32,33,34,35].
The decisive parameter of a service resource of steel-concrete structures is the joint work of the steel–concrete surface—in particular, the results of works [38,39]. However, for a better understanding of interfacial processes, their specifics were studied from [37].

References

  1. Dorofeyev, V.; Pushkar, N.; Zinchenko, H. The Influence of Concrete Structure on the Destruction of Reinforced Concrete Bended Elements. Lect. Notes Civ. Eng. 2021, 100, 243839. [Google Scholar] [CrossRef]
  2. Jin, M.; Ma, Y.; Zeng, H.; Liu, J.; Jiang, L.; Yang, G.; Gu, Y. Developing a Multi-Element Sensor to Non-Destructively Monitor Several Fundamental Parameters Related to Concrete Durability. Sensors 2020, 20, 5607. [Google Scholar] [CrossRef]
  3. Adamczak-Bugno, A.; Lipiec, S.; Vavruš, M.; Koteš, P. Non-Destructive Methods and Numerical Analysis Used for Monitoring and Analysis of Fibre Concrete Deformations. Materials 2022, 15, 7268. [Google Scholar] [CrossRef]
  4. Koteš, P.; Kotula, P.; Odrobiňák, J.; Prokop, J. Diagnostics and Evaluation of Two Atypical Girder Bridges on Railway Line. Key Eng. Mater. 2022, 930, 211–216. [Google Scholar] [CrossRef]
  5. Kos, Z.; Klymenko, Y.; Karpiuk, I.; Grynyova, I. Bearing Capacity near Support Areas of Continuous Reinforced Concrete Beams and High Grillages. Appl. Sci. 2022, 12, 685. [Google Scholar] [CrossRef]
  6. Pawłowicz, J.A. Computer-aided design in the construction industry—BIM technology as a modern design tool. Constr. Optim. Energy Potential CoOEP 2020, 9, 89–96. [Google Scholar] [CrossRef]
  7. Kramarchuk, A.; Ilnytskyy, B.; Kopiika, N. Ensuring the Load-Bearing Capacity of Monolithic Reinforced Concrete Slab Damaged by Cracks in the Compressed Zone. In Proceedings of EcoComfort 2022, Lviv, Ukraine, 14–16 September 2022; Lecture Notes in Civil Engineering; Blikharskyy, Z., Ed.; Springer: Cham, Switzerland, 2023; Volume 290, pp. 217–229. [Google Scholar] [CrossRef]
  8. Zeng, H.; Lu, C.; Zhang, L.; Yang, T.; Jin, M.; Ma, Y.; Liu, J. Prediction of Temperature Distribution in Concrete under Variable Environmental Factors through a Three-Dimensional Heat Transfer Model. Materials 2022, 15, 1510. [Google Scholar] [CrossRef] [PubMed]
  9. Kos, Z.; Klymenko, Y.; Polianskyi, K.; Crnoja, A. Research of the Residual Bearing Capacity and the Work of Damaged Reinforced Concrete Beams’ Inclined Sections. Tech. J. 2020, 14, 466–472. [Google Scholar] [CrossRef]
  10. Blikharskyy, Y.; Selejdak, J. Influence of the percentage of reinforcement damage on the bearing capacity of RC beams. Constr. Optim. Energy Potential CoOEP 2021, 10, 145–150. [Google Scholar] [CrossRef]
  11. Kopiika, N.; Vegera, P.; Vashkevych, R.; Blikharskyy, Z. Stress-strain state of damaged reinforced concrete bended elements at operational load level. Prod. Eng. Arch. 2021, 27, 242–247. [Google Scholar] [CrossRef]
  12. Blikharskyy, Y.; Vashkevych, R.; Kopiika, N.; Bobalo, T.; Blikharskyy, Z. Calculation residual strength of reinforced concrete beams with damages, which occured during loading. In IOP Conference Series: Materials Science and Engineering, Proceedings of the International Scientific Conference Energy Efficiency in Transport (EET 2020), 1021, Kharkiv, Ukraine, 18–20 November 2021; IOP Publishing: Bristol, UK, 2021. [Google Scholar] [CrossRef]
  13. Helbrych, P. Effect of dosing with propylene fibers on the mechanical properties of concretes. Constr. Optim. Energy Potential CoOEP 2021, 10, 39–44. [Google Scholar] [CrossRef]
  14. Tian, S.; Zhang, X.; Hu, W. Fatigue Analysis of CFRP-Reinforced Concrete Ribbed Girder Bridge Deck Slabs. Polymers 2022, 14, 3814. [Google Scholar] [CrossRef] [PubMed]
  15. Blikharskyy, Y.; Kopiika, N.; Volynets, M.; Bobalo, T. Theoretical analysis of RC beams reinforced with high strength rebar’s and steel plate. In Proceedings of CEE 2019: Advances in Resource-Saving Technologies and Materials in Civil and Environmental Engineering, Proceedings of the 8th International Scientific Conference «Reliability and Durability of Railway Transport Engineering Structures and Buildings» (TransBud 2019), 708(1), Kharkiv, Ukraine, 20–22 November 2019; IOP Conference Series: Materials Science and Engineering; IOP Publishing: Bristol, UK, 2019. [Google Scholar] [CrossRef]
  16. Jing, Z.N.; Liu, R.G.; Xie, G.H.; Liu, D. Shear strengthening of deep T-section RC beams with CFRP bars. Materials 2021, 14, 6103. [Google Scholar] [CrossRef] [PubMed]
  17. Jahami, A.; Temsah, Y.; Khatib, J.; Baalbaki, O.; Kenai, S. The behavior of CFRP strengthened RC beams subjected to blast loading. Mag. Civ. Engi. 2021, 103, 10309. [Google Scholar] [CrossRef]
  18. Dalyan, I.; Doran, B. An investigation on the flexural behaviour of RC beams wrapped with CFRP. Int. Adv. Res. Eng. J. 2021, 5, 97–105. [Google Scholar] [CrossRef]
  19. Rahul Raja, S.; Victor Sagaya Raj, U.; Sriram, K.; Rahul, P.S.; Vedhanayaghi, V.J. Retrofitting of RC beams using CFRP. Int. J. Emerg. Technol. Adv. Eng. 2018, 8, 112–114. [Google Scholar]
  20. Vatulia, G.; Rezunenko, M.; Petrenko, D.; Rezunenko, S. Evaluation of the carrying capacity of rectangular steel-concrete columns. Civ. Environ. Eng. 2018, 14, 76–83. [Google Scholar] [CrossRef] [Green Version]
  21. Szewczak, I.; Rzeszut, K.; Rozylo, P. Structural behaviour of steel cold-formed sigma beams strengthened with bonded steel tapes. Thin-Walled Struct. 2021, 159, 107295. [Google Scholar] [CrossRef]
  22. Karpiuk, I.; Danilenko, D.; Karpiuk, V.; Danilenko, A.; Lyashenko, T. Bearing capacity of damaged reinforced concrete beams strengthened with metal casing. Acta Polytech. 2021, 61, 703–721. [Google Scholar] [CrossRef]
  23. Araújo, D.d.L.; Nunes, F.G.T.; Filho, R.D.T.; Araújo, M.A.S. Shear strength of steel fiber-reinforced concrete beams. Acta Scientiarum. Technol. Mar. 2014, 36, 389–397. [Google Scholar] [CrossRef]
  24. Sarhat, S.R.; Abdul-Ahad, R.B. The combined use of steel fibers and stirrups as shear reinforcement in reinforced concrete beams. Spec. Publ. 2006, 235, 269–282. [Google Scholar]
  25. Eklou, R.J.; Yani, M.B.; Saifullah, H.A.; Sangadji, S.; Kristiawan, S.A. Experimental study: Shear behaviour of reinforced concrete beams using steel plate strips as shear reinforcement. IOP Conf. Ser. Mater. Sci. Eng. 2021, 1144, 012040. [Google Scholar] [CrossRef]
  26. Zedong, L. Experimental Research on Flexural Behavior of Steel Reinforced Concrete Slabs Combination Strengthened with Enlarging Section and Gluing Steel Plates. Master’s Thesis, Hebei Institute of Civil Engineering and Architecture, Beijing, China, 2017. [Google Scholar]
  27. Blikharskyy, Y.; Selejdak, J.; Kopiika, N. Corrosion fatigue damages of rebars under loading in time. Materials 2021, 14, 3416. [Google Scholar] [CrossRef] [PubMed]
  28. Lipiński, T. Investigation of corrosion rate of X55CrMo14 stainless steel at 65% nitrate acid at 348 K. Prod. Eng. Arch. 2021, 27, 108–111. [Google Scholar] [CrossRef]
  29. Gao, L.; Zhang, J.; Yu, L. Evaluation on Reinforcement Effect of Steel-UHPC Composite Deck with Steel Strip. J. Highw. Transp. Res. Dev. 2022, 39, 74–84. [Google Scholar] [CrossRef]
  30. Yin, X.; Lin, Q.; Li, K. Calculation of flexural capacity of reinforced concrete slab strengthened with profiled steel sheeting and concrete. Sichuan Build. Sci. 2020, 46, 1–7. [Google Scholar]
  31. Zhang, Q.; Cao, W. Application of structure strengthening with steel plate and concrete in construction engineering. Sichuan Build. Sci. 2022, 48, 30–35. [Google Scholar]
  32. Bobalo, T.; Blikharskyy, Y.; Kopiika, N.; Volynets, M. Influence of the percentage of reinforcement on the compressive forces loss in pre-stressed RC beams strengthened with a package of steel bars. Lecture Notes in Civil Engineering. In Proceedings of the 2nd International Scientific Conference on EcoComfort and Current Issues of Civil Engineering EcoComfort 100, Lviv, Ukraine, 16–18 September 2020. [Google Scholar] [CrossRef]
  33. Wang, W. Research on Flexural Capacity of Reinforced Concrete Beam Strengthened with Bolted Bottom Steel Plate. Master’s Thesis, Chengdu University of Technology, Chengdu, China, 2018. [Google Scholar]
  34. Liu, L.; Wang, L.F.; Xiao, Z.W. Flexural bearing capacity of RC hollow slab beam strengthened by steel plates of different thicknesses. Int. J. Struct. Integr. 2021, 12, 613–628. [Google Scholar] [CrossRef]
  35. Lu, Y.Y.; Zhu, T.; Li, S.; Zhang, H.J. Numerical analysis of load bearing capacity for RC two-way slab strengthened with well-shaped CFRP—Steel strips. J. Basic Sci. Eng. 2018, 26, 337–345. [Google Scholar]
  36. Dung, D.T.M.; Khai, L.T.Q. Nonlinear analysis of multi-layer steel fiber reinforced concrete beams. J. Constr. 2021, 4, 58–63. [Google Scholar]
  37. Vavruš, M.; Koteš, P. Methods of Modeling Contact between Concrete and Fiber Concrete. Solid State Phenom. 2022, 329, 87–92. [Google Scholar] [CrossRef]
  38. Szewczak, I.; Rozylo, P.; Rzeszut, K. Influence of Mechanical Properties of Steel and CFRP Tapes on the Effectiveness of Strengthening Thin-Walled Beams. Materials 2021, 14, 2388. [Google Scholar] [CrossRef] [PubMed]
  39. Vatulia, G.L.; Smolyanyuk, N.V.; Shevchenko, A.A.; Orel, Y.F.; Kovalov, O.M. Evaluation of the load-bearing capacity of variously shaped steel-concrete slabs under short term loading. IOP Conf. Ser. Mater. Sci. Eng. 2020, 1002, 012007. [Google Scholar] [CrossRef]
  40. Kinasz, R.; Bilozir, V.; Shmyh, R.; Bidenko, I. Deformability of Steel-Fiber Beams with External Tape Reinforcement. IOP Conf. Ser. Mater. Sci. Eng. 2020, 960, 022046. [Google Scholar] [CrossRef]
  41. da Rocha Almeida, M.M.; de Souza, A.S.C.; de Albuquerque, A.T. Experimental study of prestressed steel-concrete composite beams with profiled steel decking. J. Constr. Steel Res. 2022, 194, 107331. [Google Scholar] [CrossRef]
  42. Bobalo, T.; Blikharskyy, Y.; Kopiika, N.; Volynets, M. Serviceability of RC beams reinforced with high strength rebar’s and steel plate. Lect. Notes Civ. Eng. 2020, 47, 25–33. [Google Scholar] [CrossRef]
  43. DSTU B V.2.6-156:2010; Constructions of Buildings and Structures. Concrete and Reinforced Concrete Structures Made of Heavy Concrete. Design Rules. Ministry of Regional Construction of Ukraine: Kyiv, Ukraine, 2011.
  44. EN 1992-1-1; Eurocode 2: Design of concrete structures—Part 1-1: General Rules and Rules for Buildings. Management Centre: Brussels, Belgium, 2004.
  45. DSTU B V.2.6-7-95; Construction of Buildings and Structures. Precast Concrete and Reinforced Concrete Construction Products. Load Test Methods. Rules for Assessing Strength, Stiffness and Crack Resistance. SE “State Research Institute of Building Structures” (NDIBK), Ministry of Regional Construction of Ukraine: Kyiv, Ukraine, 1995.
  46. DBN B.2.6-98:2009; Constructions of Buildings and Structures. Concrete and Reinforced Concrete Structures. Main Principles. SE “State Research Institute of Building Structures” (NDIBK), Ministry of Regional Construction of Ukraine: Kyiv, Ukraine, 2009.
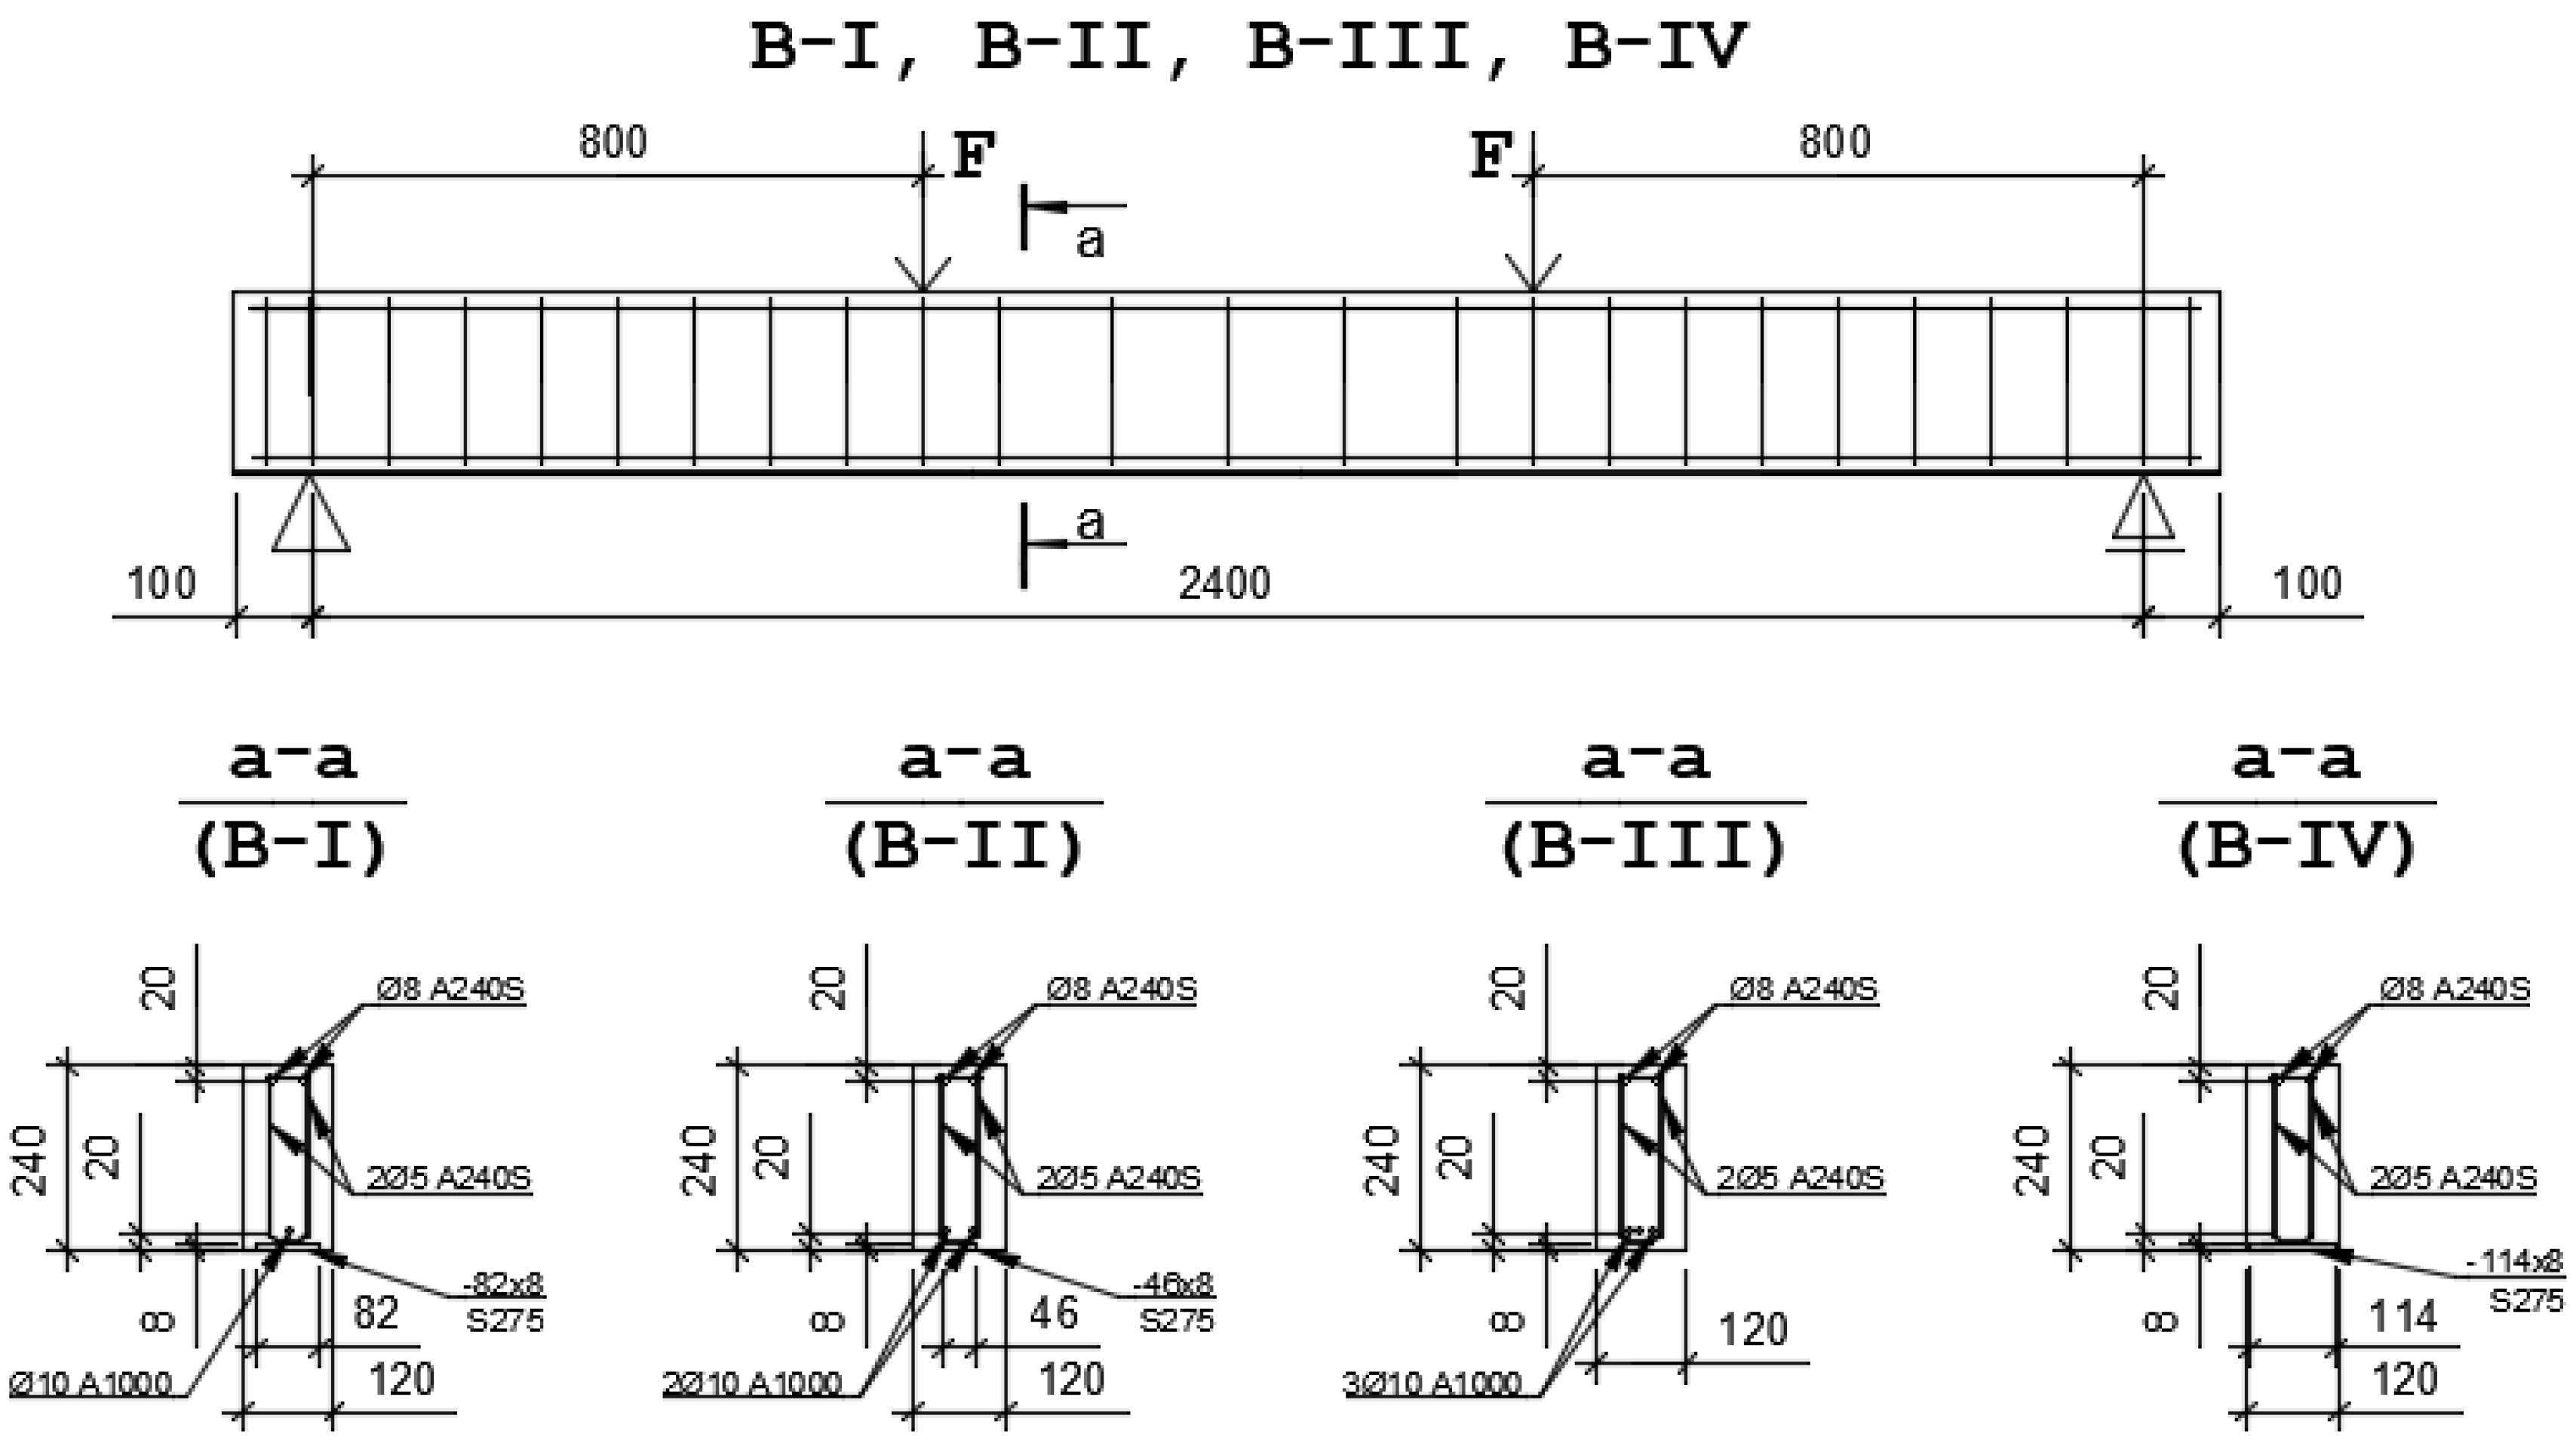
Figure 1. Construction of experimental beams’ frames.
Applsci 13 04528 g001
Figure 2. Frames of steel-concrete experimental beams. (a) Frame in the zone of pure bending; (b) frame in the supporting area.
Applsci 13 04528 g002
Figure 3. The location of measuring devices of the test samples and the loading scheme.
Applsci 13 04528 g003
Figure 4. Placement of strain gauges and microindicators on the beam.
Applsci 13 04528 g004
Figure 5. (a) Stress diagram for a bent reinforced concrete element with combined reinforcement; (b) strain diagram for a bent reinforced concrete element with combined reinforcement.
Applsci 13 04528 g005
Figure 6. Graphs of strain development: (a) the development of strains in stretched rebars for series B-I; (b) the same for series B-II; (c) the same for series B-III; (d) the same for series B-IV; Y-axis indicates experimental values of bending moment M (kNm); X-axis indicates the corresponding strain values ε × 105.
Applsci 13 04528 g006
Figure 7. Specifics of beam destruction.
Applsci 13 04528 g007
Figure 8. Graphs of stress development in the working reinforcement: (a) the development of stresses in stretched rebars for series B-I; (b) the same for series B-II; (c) the same for series B-III; (d) the same for series B-IV; X-axis indicates experimental values of bending moment M (kNm); Y-axis indicates the corresponding stress values σ (MPa). Before the beginning of the experimental investigation, the beams’ strength was calculated with the use of real σ-ε strain diagrams of reinforcement and concrete, which were used for the manufacturing of test samples. This made it possible to predict the operation of reinforced concrete beams under load with high accuracy.
Applsci 13 04528 g008
Figure 9. Graphs of the deflections in beams: (a) the development of deflections for series B−I; (b) the same for series B−II; (c) the same for series B−III; (d) the same for series B−IV; X-axis indicates experimental values of bending moment M (kNm); Y-axis indicates the corresponding deflections f (mm).
Applsci 13 04528 g009
Table 1. The experimental results of beams at the initial stages of loading in the maximum bending moment zone.
Notation of the BeamsM, kN × mεs × 105εs tape × 105εbt × 105εb × 105Deflection fmax, mm
B-I-1781110140.58
B-I-277109150.65
B-II-17101211150.72
B-II-27111415170.78
B-III-1721-24201.15
B-III-2724-28241.36
B-IV-17-98.5120.61
B-IV-27-1011140.65
Table 2. Comparison of moments corresponding to crack formation.
Notation of the BeamsBeginning of Crack Formation
Experimental Mexpcrc, kN × mAccording to DBN V.2.6-98:2009
MDBN, mm
(Mexpcrc − MDBN)/Mexpcrc, %
B-I-16.95.9214.2
B-I-27.1517.2
B-II-18.006.1223.5
B-II-27.4618.0
B-III-16.425.2618.1
B-III-25.66.1
B-IV-18.087.1211.9
B-IV-27.9210.1
Table 3. Experimental results of the moments of crack formation in the zone of maximum bending moment.
Notation of the BeamsM, kN×mεs × 105εs tape × 105εB t × 105εB × 105Deflection f, mm
B-I-16.97101690.60
B-I-27.1591217100.68
B-II-18.00161819251.08
B-II-27.46121618311.11
B-III-16.4218-20161.09
B-III-25.615-17110.83
B-IV-18.08-1615220.93
B-IV-27.92-1413190.82
Table 4. Comparison of values of bending moments at maximum allowable crack opening.
Notation of the BeamsMaximum Crack Opening
Normative Width wMax, mmExperimental Mexp, kN × mDBN B.2.6-98:2009 MDBN0.3(Mexp − MDBN0.3)/Mexp, %
B-I-10.328.3524.3714.0
B-I-20.328.0613.2
B-II-10.327.3026.871.6
B-II-20.330.7012.5
B-III-10.333.4532.901.6
B-III-20.336.7910.6
B-IV-10.343.2641.753.5
B-IV-20.342.972.8
Table 5. The strain values in the cross-sections of the beams under loading of 0.7 Mdr2 in zone of maximum bending moment.
Notation of the Beams0.7 Mdr2,
кH
εs ×105εs tape ×105εB t ×105εB ×105Deflection fdr2, mm
B-I-144.93105127124944.55
B-I-246.061171441391025.08
B-II-148.102593042981479.44
B-II-247.902512922871359.56
B-III-149.38439-49822120.32
B-III-249.25445-51722721.57
B-IV-142.18-9290904.15
B-IV-242.18-9894934.55
Table 6. Experimental results for steel–concrete beams with combined reinforcement.
Notation of the BeamsExperimental Value of Mdr1 at Yielding of Steel TapeDeflection of Beam before the Yielding of Tape, fdr1, mmLoad Bearing Capacity (Yield Point of High-Strength Rebar, Crashing of the Compressed Concrete)Deflection
fdr2, mm at M = 0.7 MDBN,
Experimental Value Mdr2, kNmAccording to DBN V.2.6-98:2009 MDBN, kNm(Mdr2 – MDBN)/Mdr2, %Experimental Value fdr2, mmAccording to DBN V.2.6-98:2009 fDBN, mm(fdr2 – fDBN)/fdr2, %
B-I-142.706.8751.5251.380.34.555.520.9
B-I-243.6011.9852.642.45.088.3
B-II-131.108.0155.2052.105.69.4410.410.2
B-II-231.107.3652.400.69.568.8
B-III-1--55.3652.854.520.3221.87.3
B-III-2--57.047.321.571.1
B-IV-151.497.9151.4950.252.44.154.46.0
B-IV-250.5710.7250.570.64.55−3.3
Table 7. Experimental and theoretical values of deflections of test beams.
Notation of the Beams0.4 Mdr20.7 Mdr2
Experimental fexp1, mmDBN B.2.6:2009
fDBN 1 mm
(fDBN 1 – fexp1)/fexp1, %Experimental fexp2 mmDBN B.2.6:2009
fDBN 2 mm
(fDBN 2 – fexp2)/fexp2 %
B-I-12.212.15−2.74.555.520.9
B-I-22.35−8.55.088.3
B-II-14.814.5−6.49.4410.410.2
B-II-23.9813.19.568.8
B-III-18.258.97.920.3221.87.3
B-III-29.64−7.721.571.1
B-IV-11.942.129.34.154.46.0
B-IV-22.081.94.55−3.3
Disclaimer/Publisher’s Note: The statements, opinions and data contained in all publications are solely those of the individual author(s) and contributor(s) and not of MDPI and/or the editor(s). MDPI and/or the editor(s) disclaim responsibility for any injury to people or property resulting from any ideas, methods, instructions or products referred to in the content.