Article

Experimental Investigation on Innovative Stress Sensors for Existing Masonry Structures Monitoring

by
Lidia La Mendola
1,*,†,
Maria Concetta Oddo
1,†,
Calogero Cucchiara
1,†,
Michele Fabio Granata
1,†,
Simone Barile
2,†,
Francesco Pappalardo
3,† and
Agatino Pennisi
3,†
1
Engineering Department, University of Palermo, 90128 Palermo, Italy
2
Mapei S.p.A., 20158 Milan, Italy
3
STMicroelectronics S.r.l., System Research and Application, 95121 Catania, Italy
*
Author to whom correspondence should be addressed.
These authors contributed equally to this work.
Appl. Sci. 2023, 13(6), 3712; https://doi.org/10.3390/app13063712
Submission received: 16 February 2023 / Revised: 10 March 2023 / Accepted: 11 March 2023 / Published: 14 March 2023

Abstract

:
Historical masonry structures often suffer gradual deterioration that in many cases can compromise the safety levels and the operating conditions of the buildings. In this context, Structural Health Monitoring (SHM) is an effective tool for the prediction of the structural behaviour and the state of conservation of buildings. Although many monitoring systems have recently been proposed, there is a lack of practical application of low-cost systems. This paper presents an experimental study based on the use of two innovative stress sensors—capacitive stress sensor and ceramic stress sensor—for the monitoring of existing masonry elements. In order to reproduce the actual conditions of onsite masonry, sensors are post-installed in the mortar joints of two series of pre-stressed specimens made of calcarenite stone masonry and clay brick masonry. The best practice of post-installation of the two sensors is investigated. The reliability of the proposed sensors is evaluated through comparison with data recorded from classical measurement devices.

1. Introduction

Safety monitoring of historical buildings is a topic of considerable importance for the scientific community. Recently, several studies available in the literature focus on the effectiveness of different technological systems proposed for Structural Health Monitoring (SHM) of existing masonry structures with particular reference to those belonging to the cultural heritage [1,2,3,4].
The new generation of SHM is based on the installation of inexpensive sensors that allow the acquisition, elaboration and transmission of the measurement signals at low cost and in many points of the monitored structure. Generally, sensor devices operate through two methods, the active one [5] and the passive one [6], recording information useful to detect the health of existing buildings.
The SHM systems allow the non-contact survey and continuous monitoring of existing structure, identifying the performance level, the local damages and the possible degradation of material components. This information refers to specific points of the building where the devices are installed by facilitating the maintenance plan and the localization of damage after earthquakes [7]. Sophisticated algorithms provide an accurate time-correlation of the state of the building [8]. In some cases, the storage of this information is essential for post-processing through statistical methods in order to investigate the link between different phenomena that can happen at the same time within the monitored structure and to provide protection from future earthquakes [3].
The architectural heritage often suffers material deterioration, deformations and critical crack patterns that require urgent strengthening interventions ensuring minimal invasiveness. In this background, Italian guidelines promote the use of SHM systems as aids in the maintenance of new buildings as well as in the preservation and conservation of historic constructions. However, the application of SHM systems in existing structures has several issues related to the minimal invasiveness in the sensor installation and the presence of heterogeneous materials and proper strategic installations [9]. With the aim of applying SHM to historical masonry, this study examines the post-installation of two innovative stress sensors, i.e., ceramic and capacitive, on pre-stressed calcarenite and clay brick masonry walls, simulating a realistic situation in which the sensor is installed on an existing wall under load. Good performances of pre-installed ceramic and capacitive sensors was already observed for monitoring new masonry elements [10,11]. However, the use of sensors for monitoring new masonry structures is not yet a common practice. Conversely, the post-installation of sensors in existing masonry is increasing, and new commercial solutions are arising in order to overcame some of the drawbacks that may affect the accuracy of the sensor measurements. In this paper, critical issues related to the post-installation operating phases are discussed, and the results of the experimental campaign are presented. Traditional monitoring devices are employed to assess the comparison with data recorded by sensors and to detect drawbacks related to the test setup.

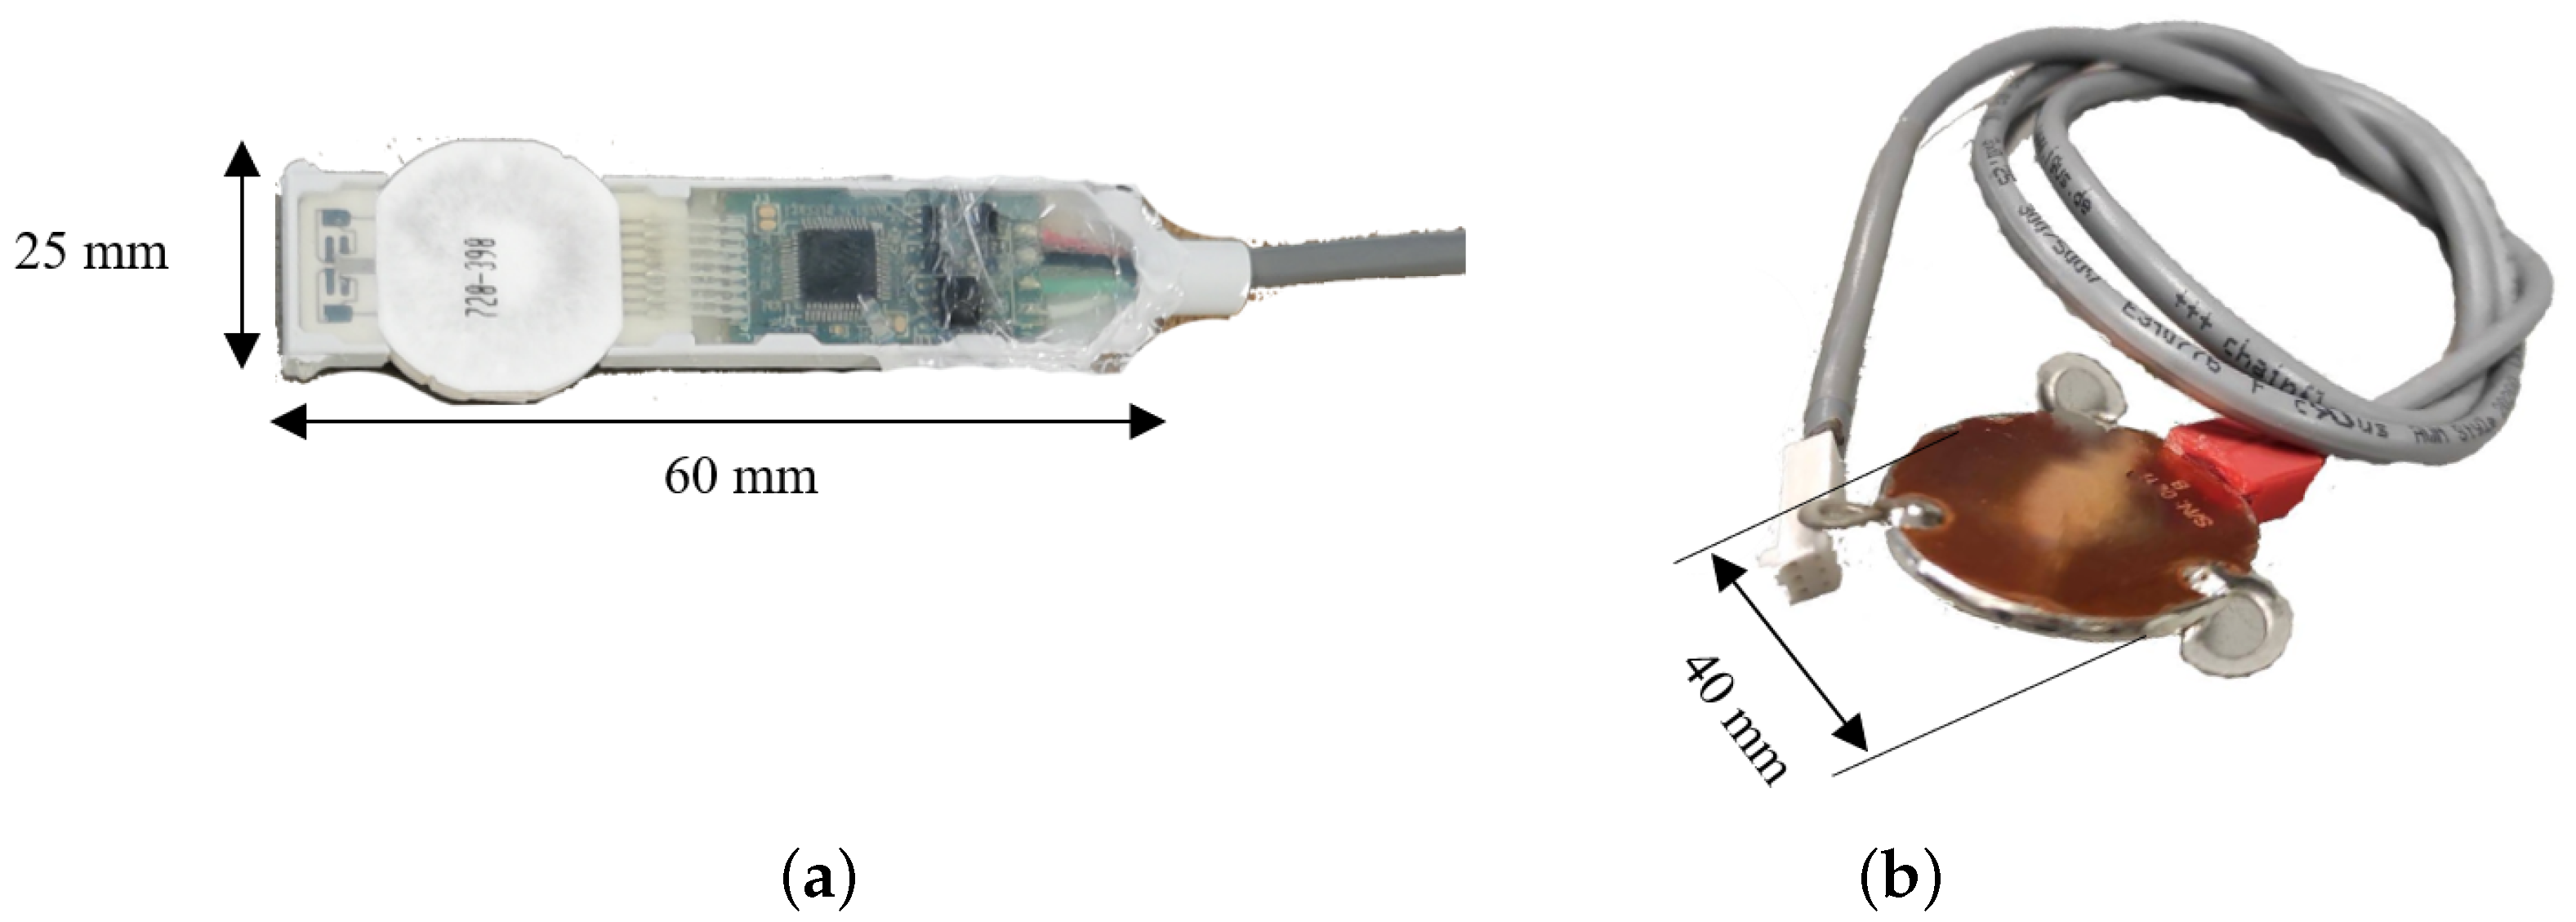
2. Overview on Capacitive and Ceramic Stress Sensors

The proposed experimental study investigates the efficacy of two sensor types for structural monitoring: piezo-resistive (ceramic) sensors (Figure 1a) and capacitive sensors (Figure 1b). The first one (Figure 1a) is an electronic circuit consisting of a microcontroller with embedded flash memory able to record and convert the low electrical signal of piezo-resistive bridges into a digital value. A ceramic stress sensor is made of an elastic-brittle material where a measure of stress is possible through the elastic strain of the internal material. The electric signal is directly converted into stress values due to the use of conversion parameters provided by the manufacturer for each sensor. In this paper, this type of sensor will be referred as “stress sensors”. Initially, ceramic stress sensors were designed for concrete structures as reported in the literature [12,13,14], and they were embedded inside concrete when casting. Then, their use was extended to the case of new masonry elements [11]. The second sensor used (Figure 1b) is a new capacitive one [15]. It consists of a sensing area located on the plate surface of a parallel-plate capacitor with a Dupont Kapton™ dielectric layer. It is worth pointing out that several sizes of the sensor surface are possible, suitable for the dimensions of the brick units or, in general, to the area where the average stress needs to be monitored. Equation (1) presents the capacitance values C of a parallel plate capacitor:
C = ε A d ,
where ε is the permittivity of the gap, A the area of electrodes, and d the gap between the electrodes. In detail, the dielectric constant value ε r of the Dupont Kapton™ layer is 3.4 C 2 /(N m 2 ). In this case, the capacitance variation depends on the variation in the distance between the electrode plates that is strictly related to the constitutive non-linear law of the internal dielectric layer. The capacitance signal is converted to voltage, current, or frequency through a microcontroller that is positioned outside of the sensing element. Among the advantages, the capacitive sensors include high sensitivity and stability, low susceptibility to temperature, inexpensive production costs and good durability.

3. Experimental Investigation

The effectiveness of the two sensors, i.e., ceramic and capacitive, in the field of SHM has been validated through their post-installation on pre-stressed masonry panels tested in compression.

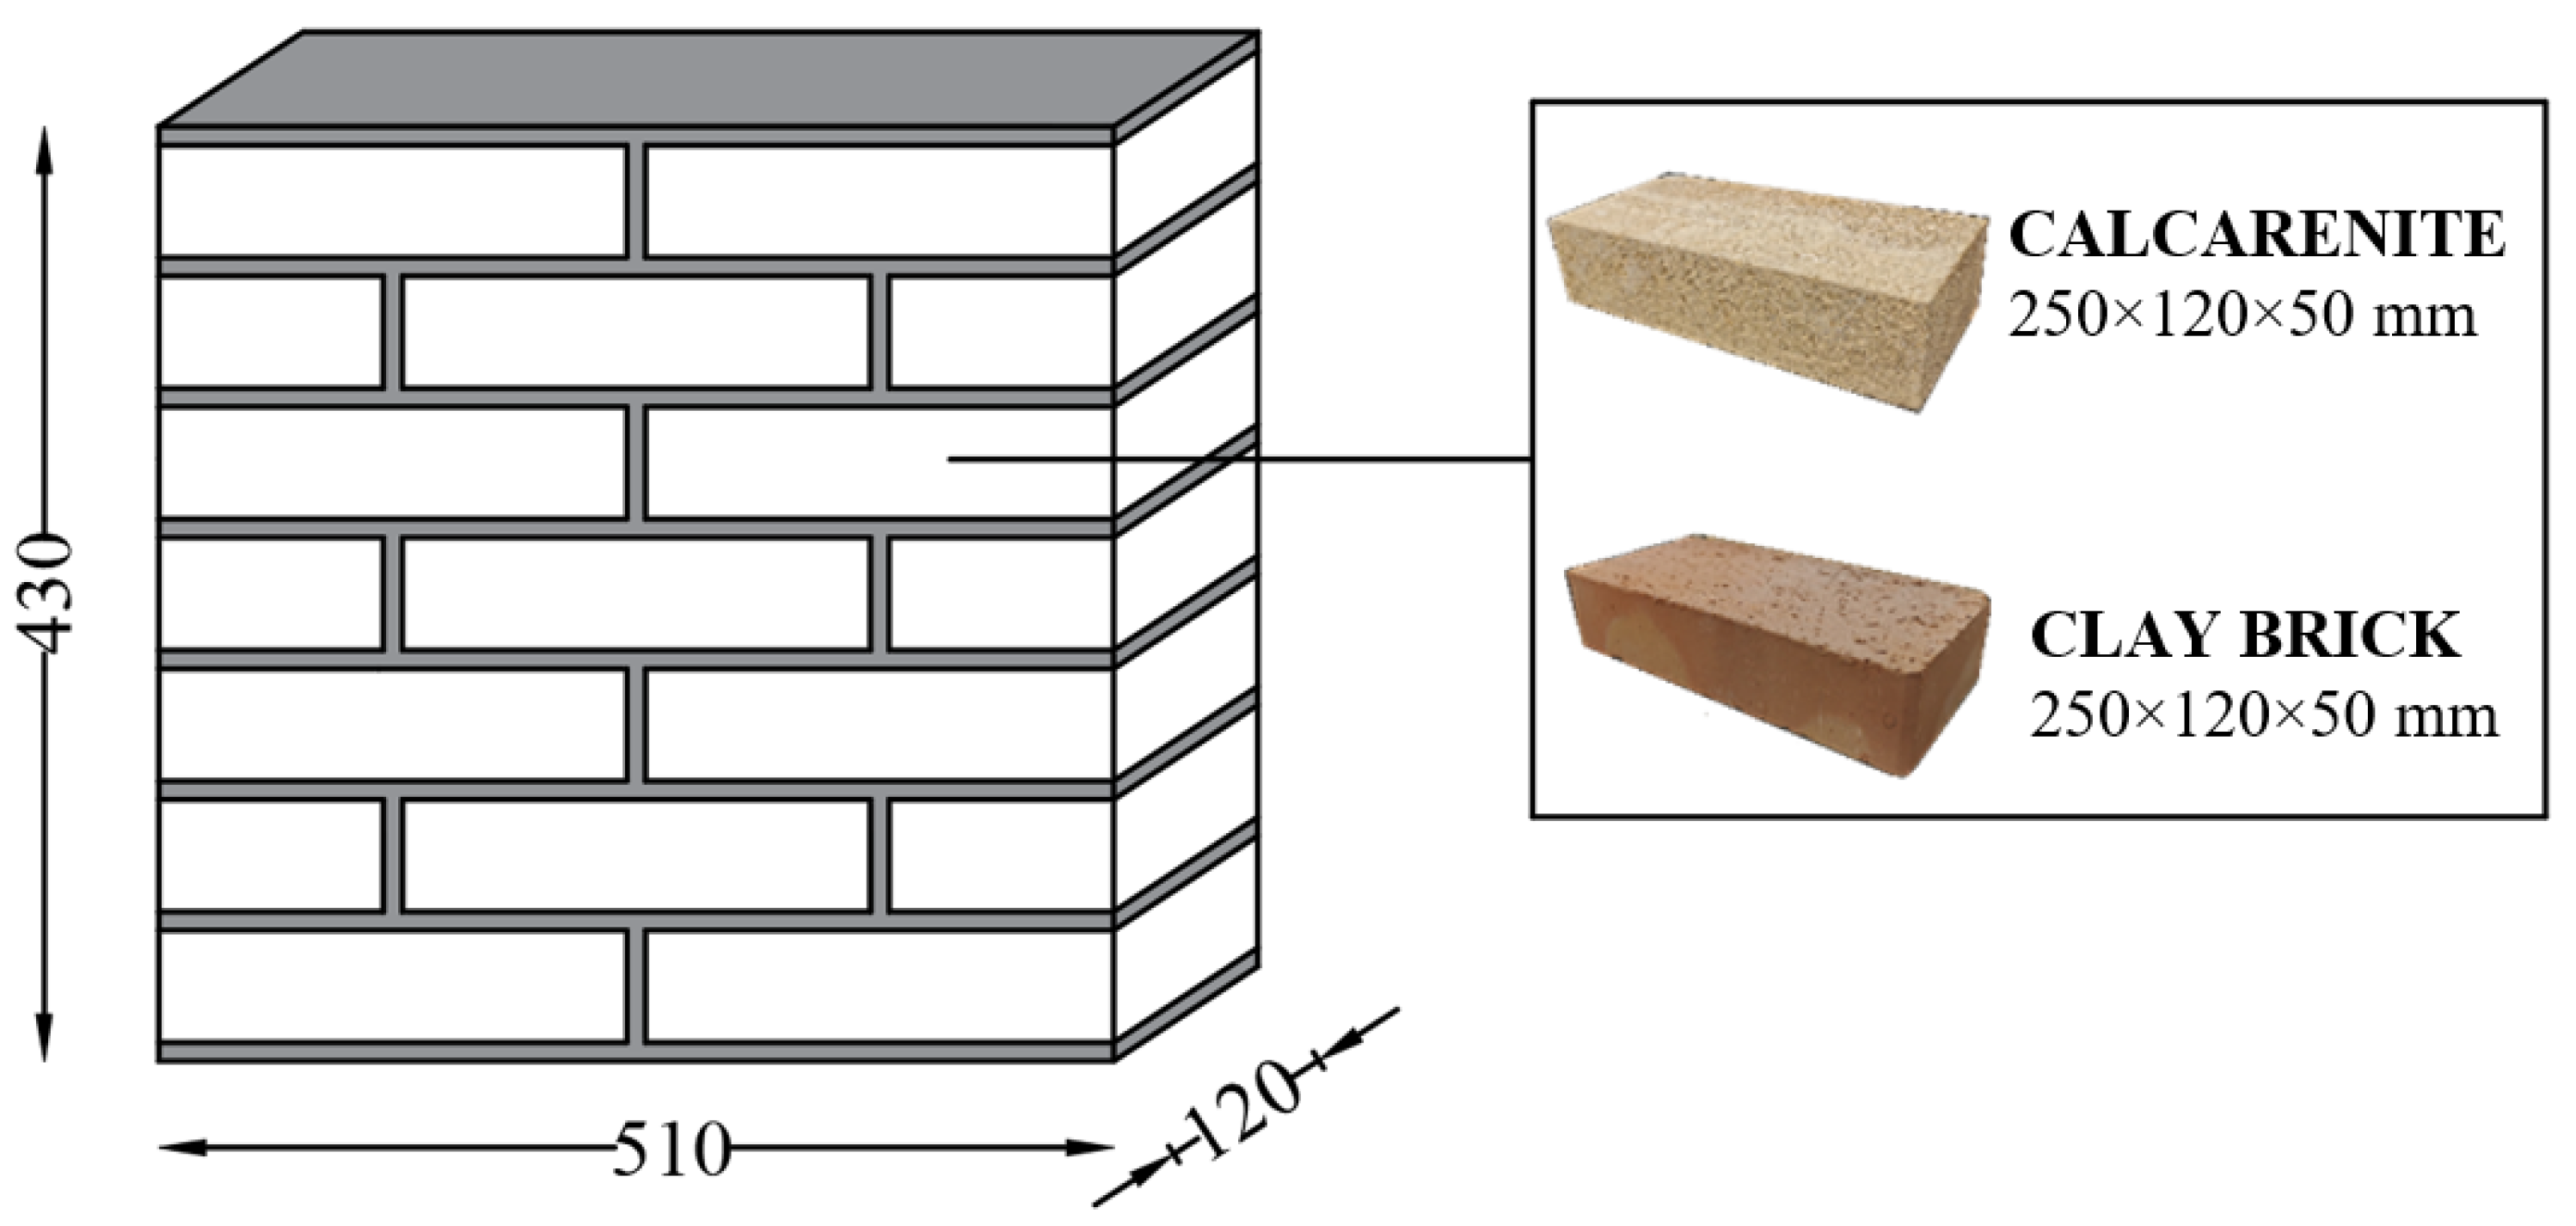
3.1. Materials and Specimens

Each test specimen consists of seven rows of calcarenite stone and clay brick units with a dimension of 250 × 120 × 50 mm and eight bed joints of 10 mm thickness. Specimens have a height of 430 mm, a width of 510 mm and a thickness of 120 mm (Figure 2).

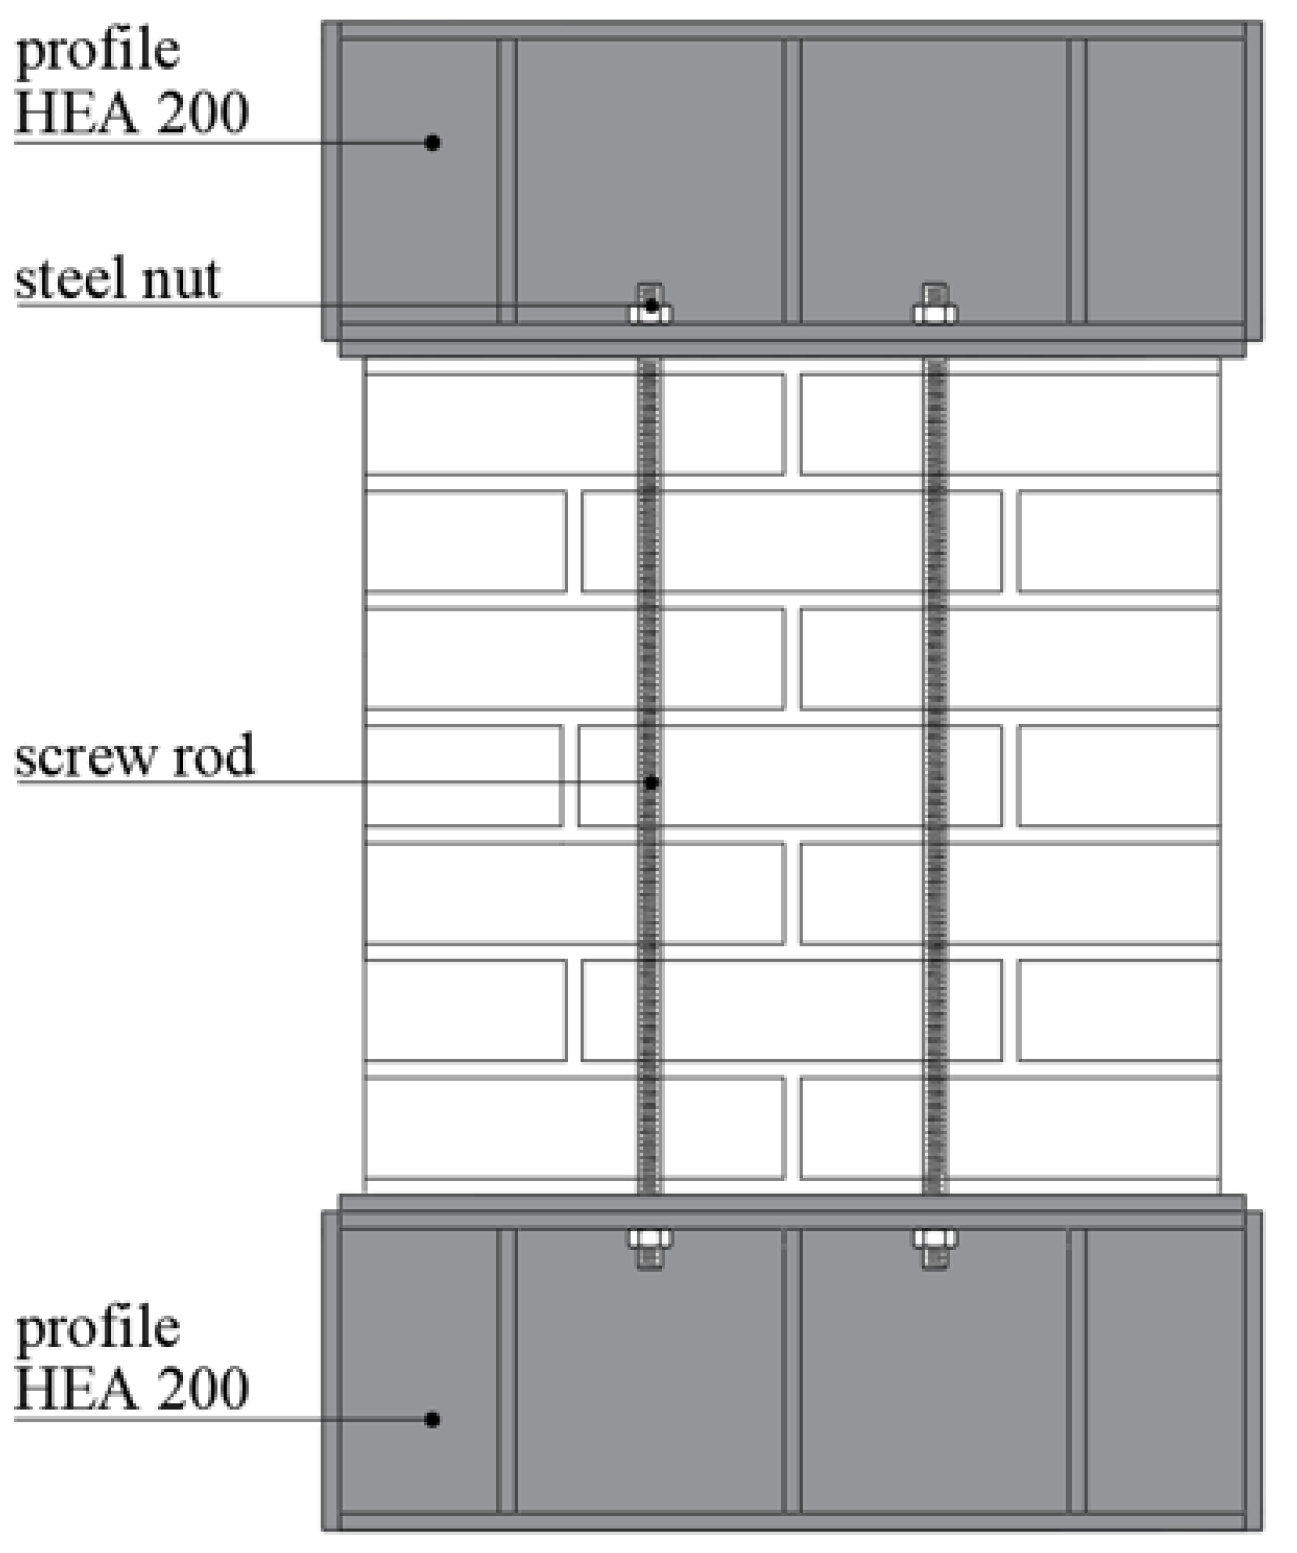
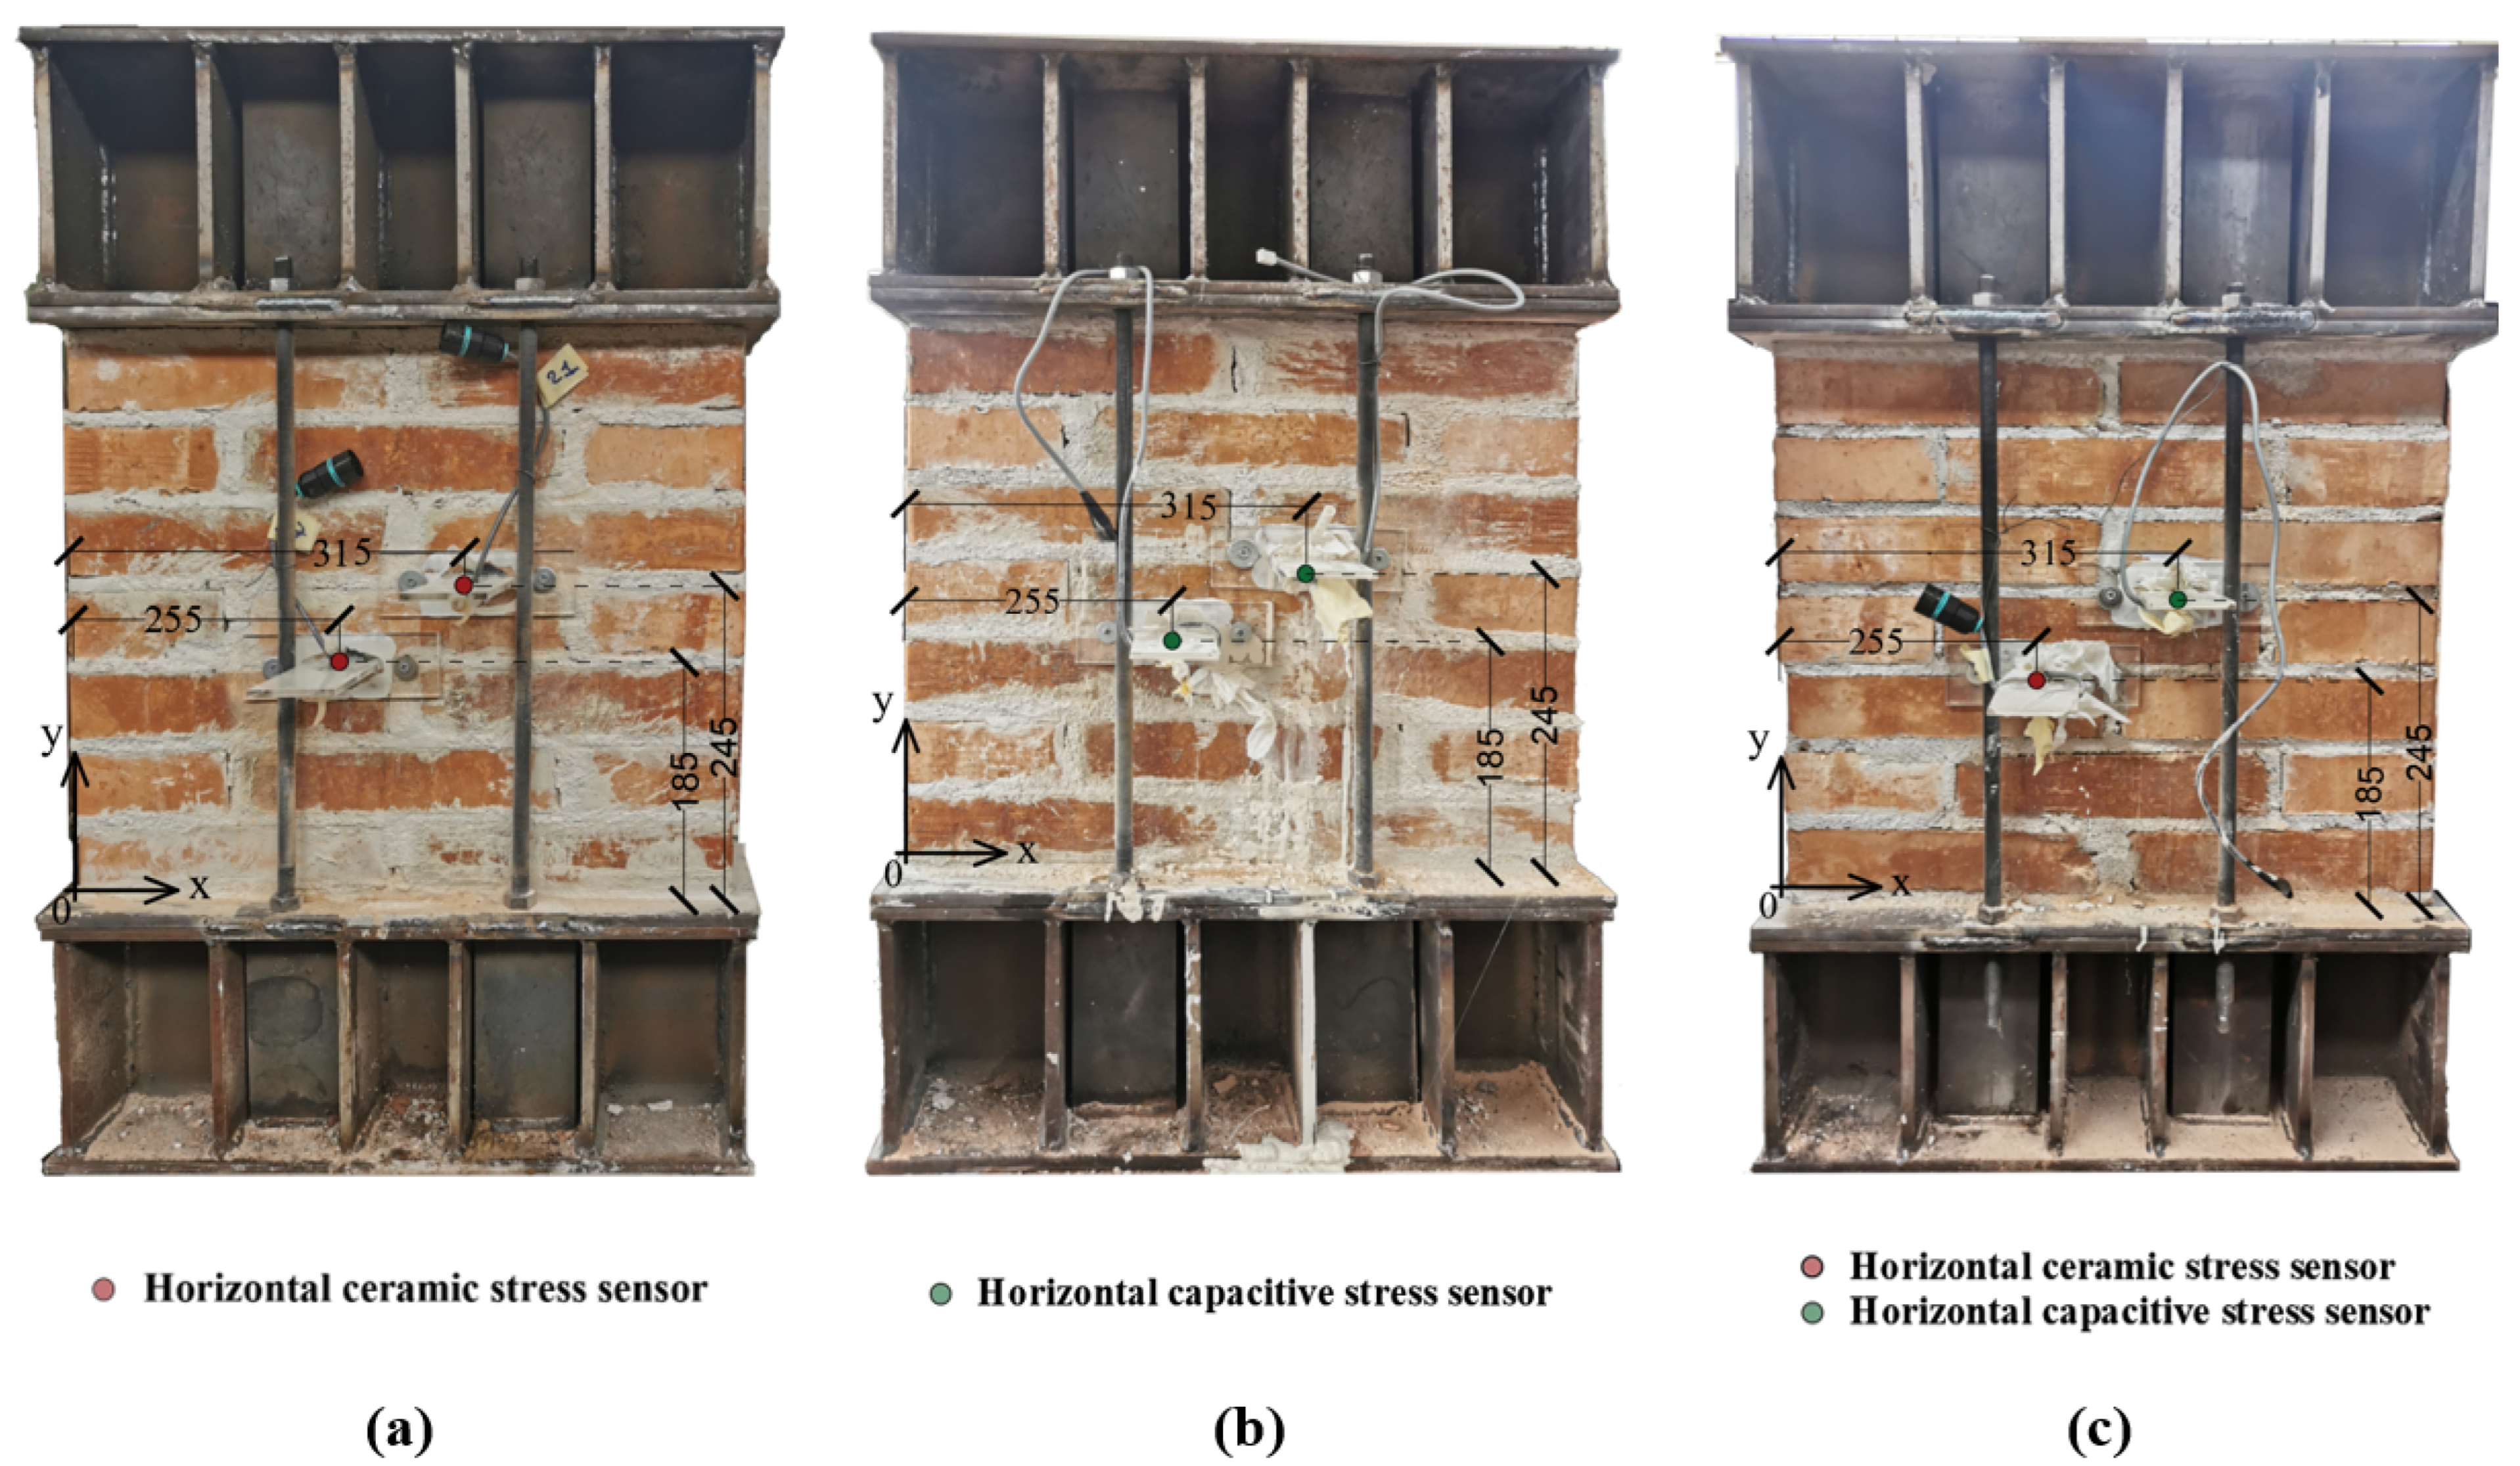
3.2. Prestressing and Post-Installation of Sensors

After a curing period of 28 days, specimens were pre-stressed by applying a load value equal to 20% of the average compressive strength, respectively, for clay bricks and calcarenite masonry.
The load was applied through a steel contrast system consisting of two HEA200 profiles, one at the top and the other one at the bottom of the panels, connected to each other with four screw rods (two for each side) as shown in (Figure 3).
The aim is to evaluate the response of the post-installed sensors to the variation of load and therefore to local pressure inside the masonry, starting from an initial stress state, corresponding to what the masonry has applied for permanent loads, for example through the floor slabs.
The experimental campaign investigates two operating methods for the post-installation of the stress sensors in masonry using the specimens previously pre-stressed.
The first post-installation system (named P1) was performed through the following procedure. The first step is to drill two symmetrical holes with respect to the vertical axis of the specimen (Figure 4a), placed at one third of the length of the masonry. The holes were made by using a drill and a grinder with a diamond disk, diameter of 50 mm. Holes were then cleaned with compressed air and wetted with water. Afterwards, they were filled using a hydrated lime-based mortar having mechanical properties similar to the mortar used for the construction of the wall (Figure 4b). After partially filling holes, sensors were located inside the cavity (Figure 4c), making sure to arrange them in a perfectly horizontal position, reducing as much as possible any rotations and translations. After the positioning of the sensors, mortar was injected into the cavity with the aim of saturating it and trying to completely cover the surface of sensors (Figure 4d).
The second post-installation system (named P2) is more complex and articulated. The execution and the cleaning of the holes is identical to the previous case (Figure 5a). Subsequently, a plexiglass closure mask was fixed directly to the masonry using two metallic screws. This mask is equipped with two side holes necessary for fixing it to the support, while other two holes are used for the placement of injection tubes, and another central hole is used for positioning sensors inside the cavity. The end of the sensor and its power cable have been fixed to a plexiglass plate using a chemical adhesive (Figure 5b). This plate, as indicated in the following images, fits perfectly into the previously fixed mask. This system allows a perfect orthogonal placement of the sensor inside the masonry, avoiding any movements and rotations during the mortar injection (Figure 5c). The mortar used is a superfluid slurry with hydraulic, fillerized lime and eco-pozzolan-based binder. The slurry was injected using the lowest placed injector and proceeded to continuously inject the mortar until it began to leak from the highest placed injector. After these phases, the top injector was closed, and the slurry continued to be injected from the bottom injector to put it under pressure inside the hole (Figure 5d).
For each post-installation system (i.e., P1 and P2), a total number of ten specimens, five in clay brick masonry and five in calcarenite masonry, were prepared. The specimens were labelled as “SPn_Ps_m”, where ‘n’ is the progressive number assigned to each sample, ‘s’ refers to the post-installation system (i.e., 1 = first post-installation system, 2 = second post-installation system) and ‘m’ indicates the masonry type (i.e., C = calcarenite, L = clay bricks).

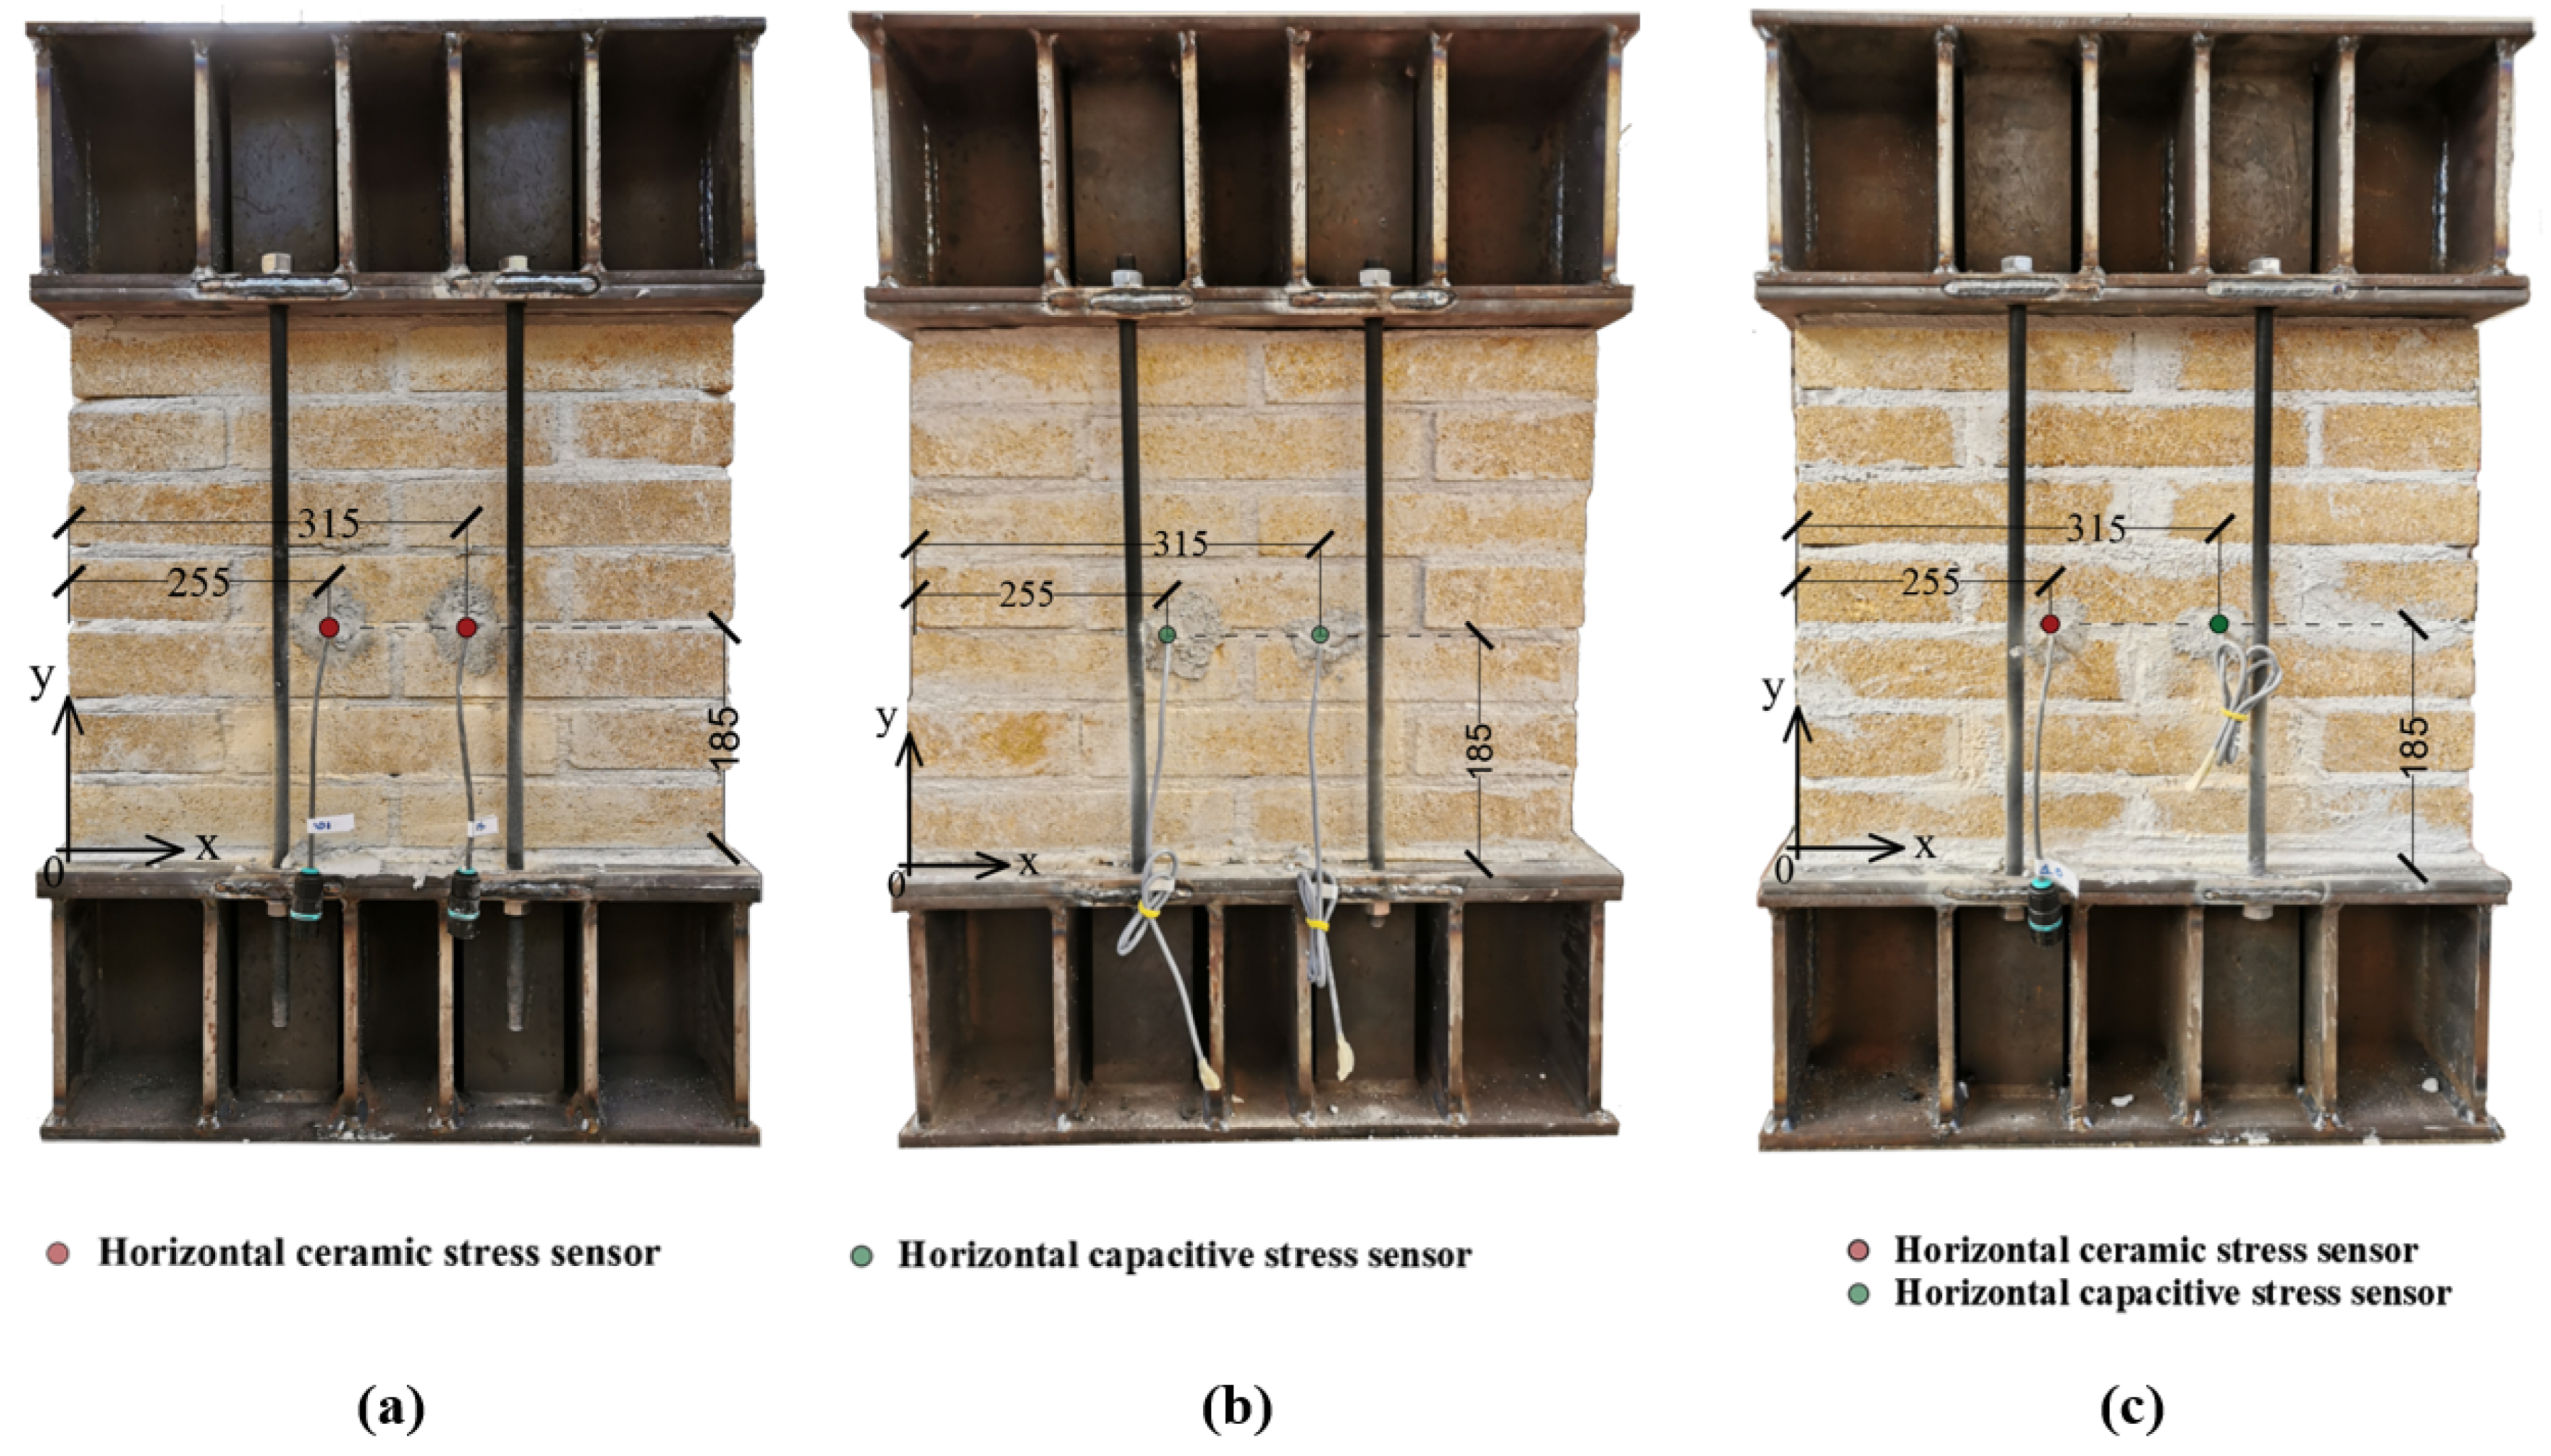
3.3. Measurement System
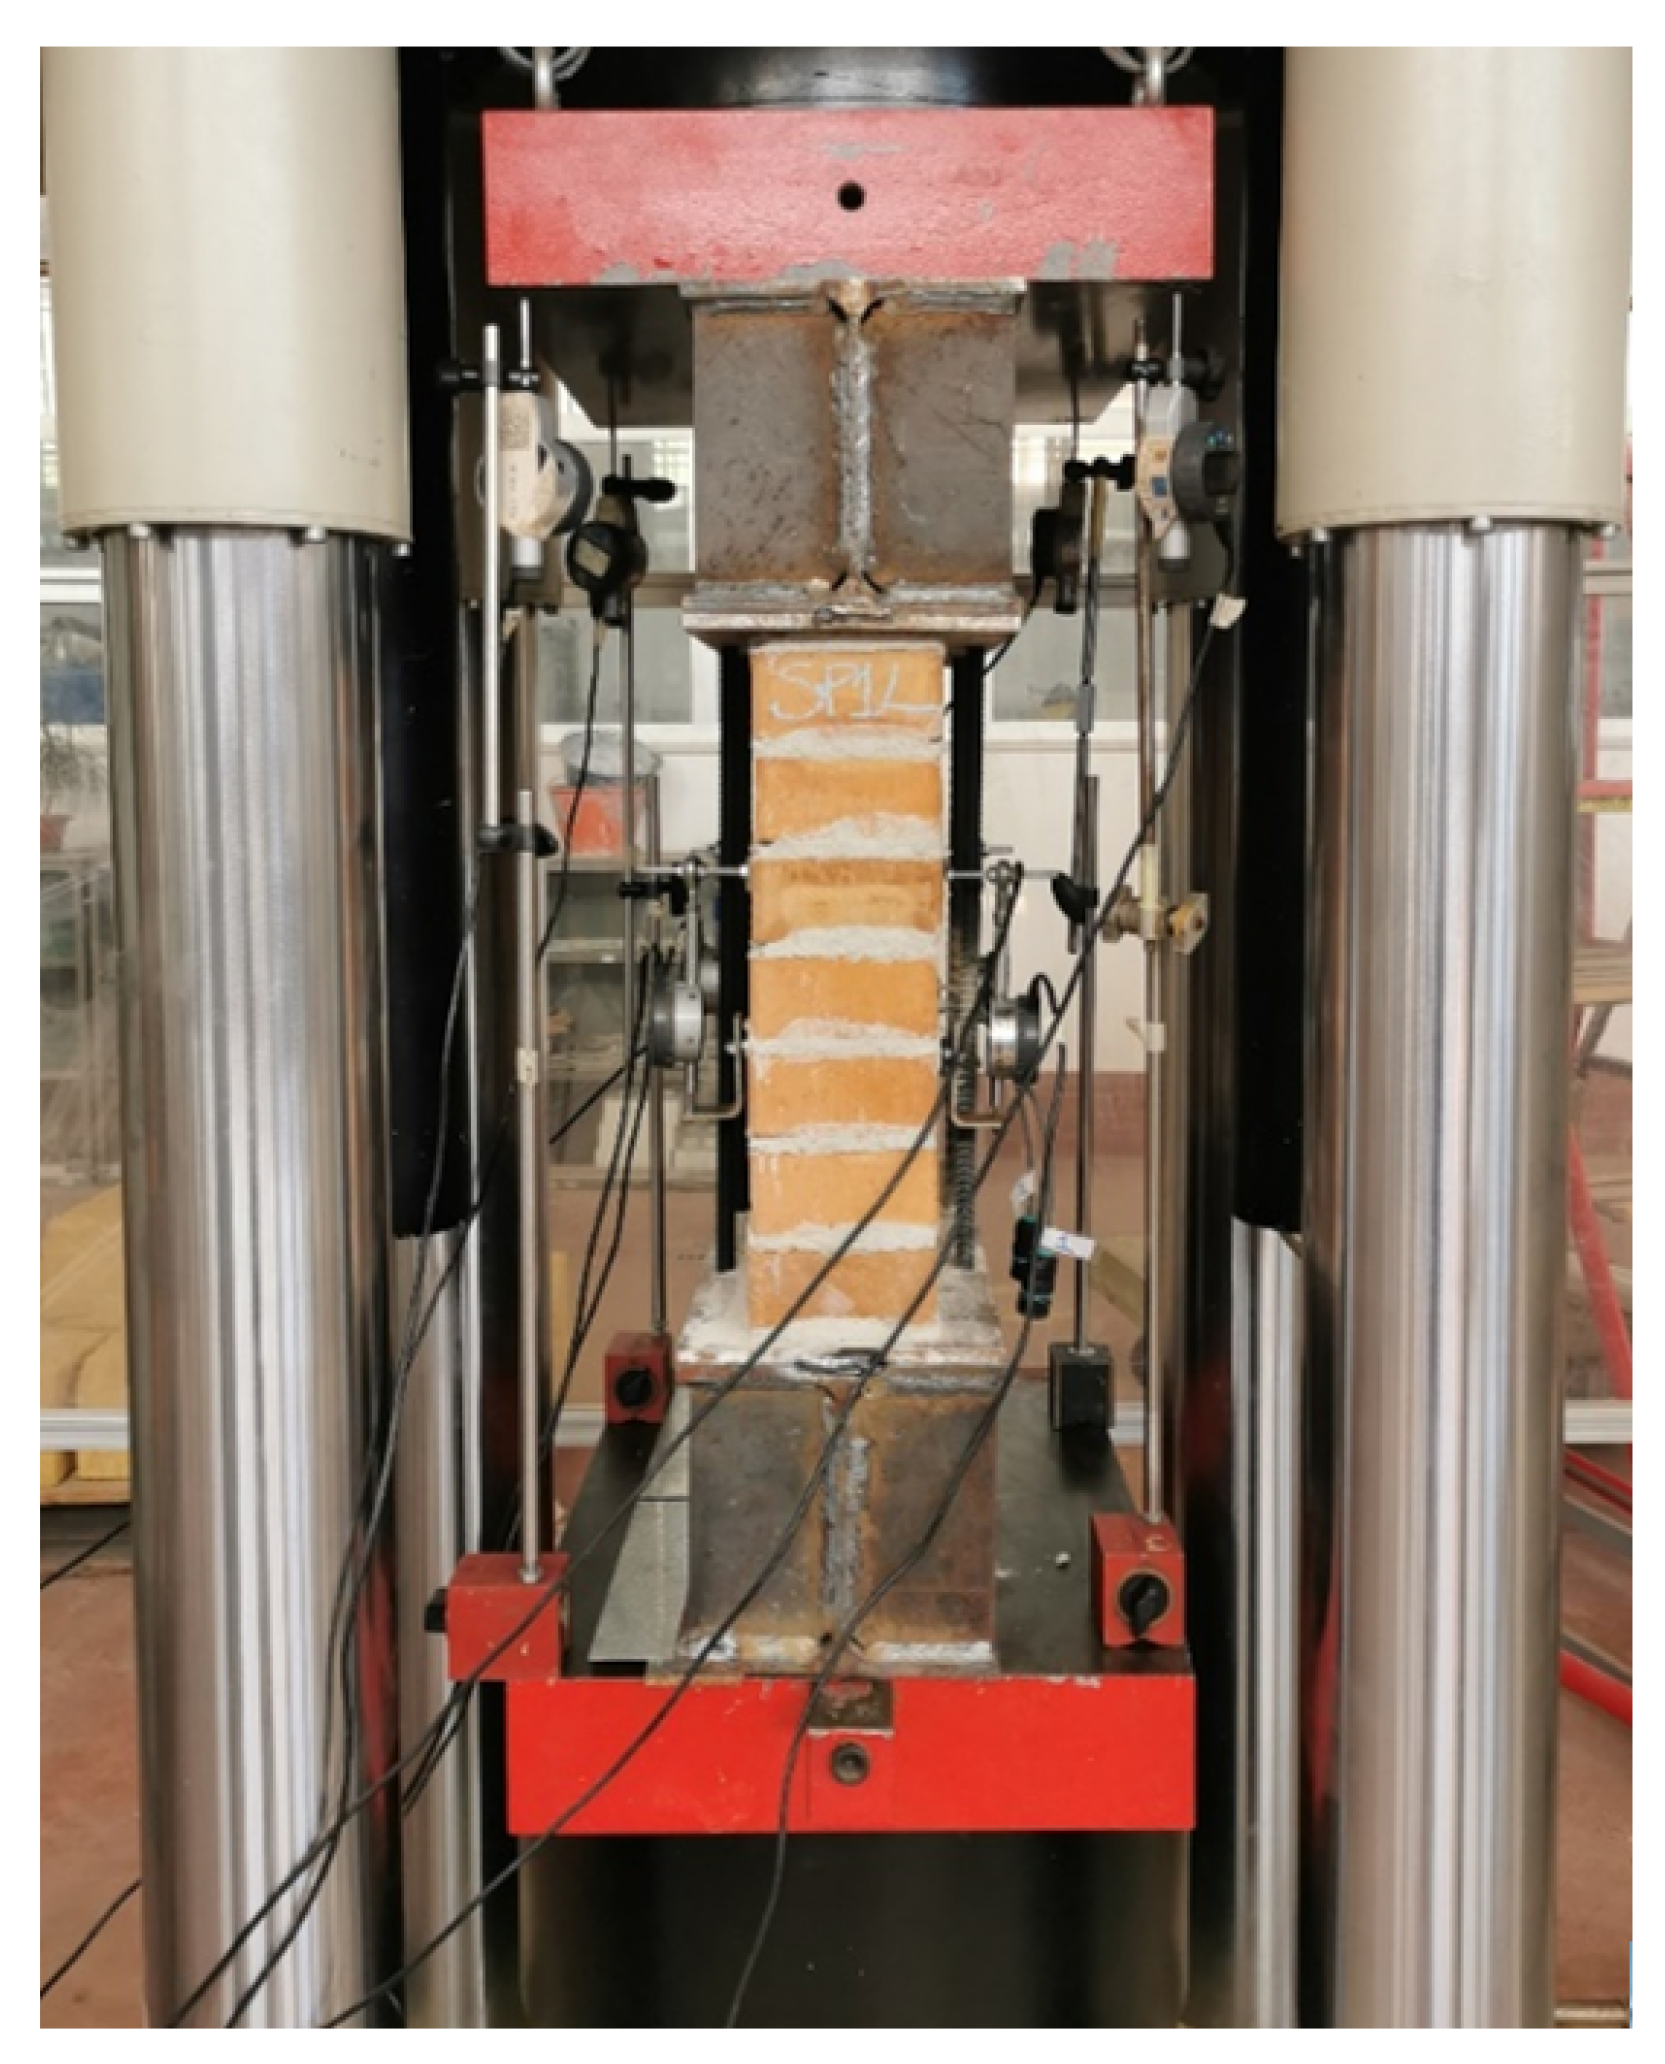
For both types of masonry, the two sensor types (capacitive and ceramic) were post-installed in the panels according to three patterns of monitoring, as shown in Figure 6 and Figure 7, respectively, for post-installation system P1 and P2.
Sensors were post-installed almost at the mid-height of each specimen in correspondence to the mortar bed joint; in details: two ceramic sensors were placed in the specimen labelled “SP1” and “SP2”, two capacitive sensors were placed in the specimen labelled “SP3” and “SP4” and a ceramic and a capacitive stress sensor were placed in the specimen labelled “SP5”.
The type and position of the sensors, according to the x-y reference system, are listed in Table 1 and Table 2, respectively, for the two post-installation systems, P1 and P2.

3.4. Test Setup

The specimens were tested in compression by using a Zwick–Roell testing machine with capacitance of 4000 kN, Figure 8. Tests were performed in a displacement controlled mode, assuming a rate equal to 0.2 mm/min. Preliminary, two pre-load cycles were carried out ranging between 20 and 100 kN for assessing a suitable contact between the testing machine and the specimen.
Four digital absolute displacement indicators were arranged on two faces of the specimen, two digital indicators for each side, as shown in Figure 9. Measuring bases of the digital indicators were glued on the surface, avoiding any damage to the masonry, in the middle part of the test zone near the sensors in order to keep a gauge length of about 120 mm.

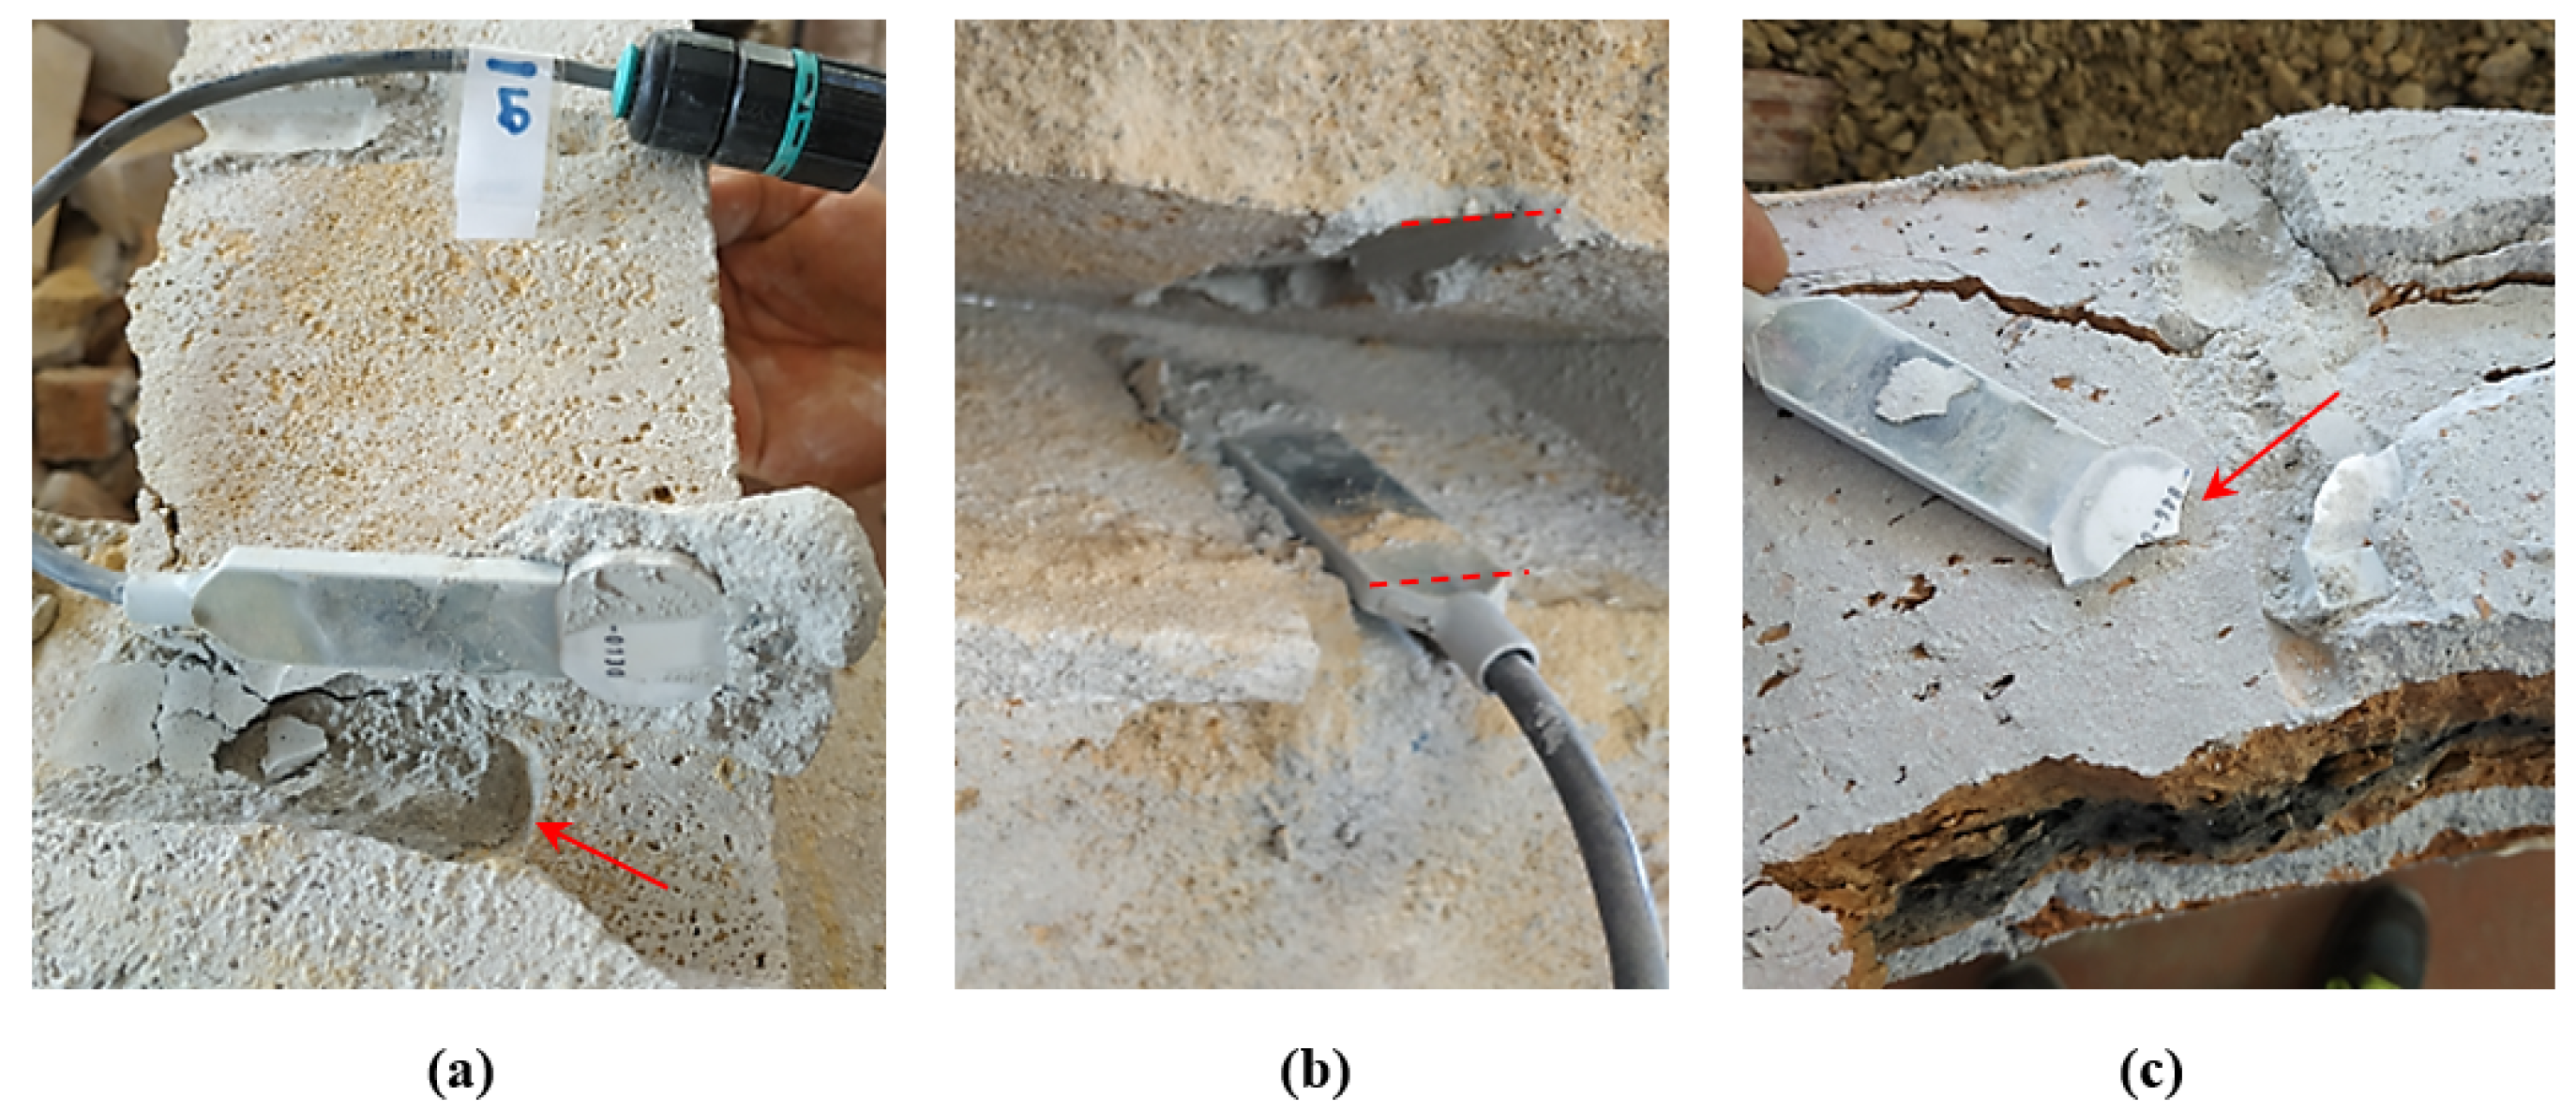
4. Experimental Outcomes

The post-processing of the experimental outcomes is in terms of stress–time curves for ceramic sensors and capacitance–time for capacitive sensors. Recorded data from sensors are contrasted with the load values acquired by the load cell of the test machine.

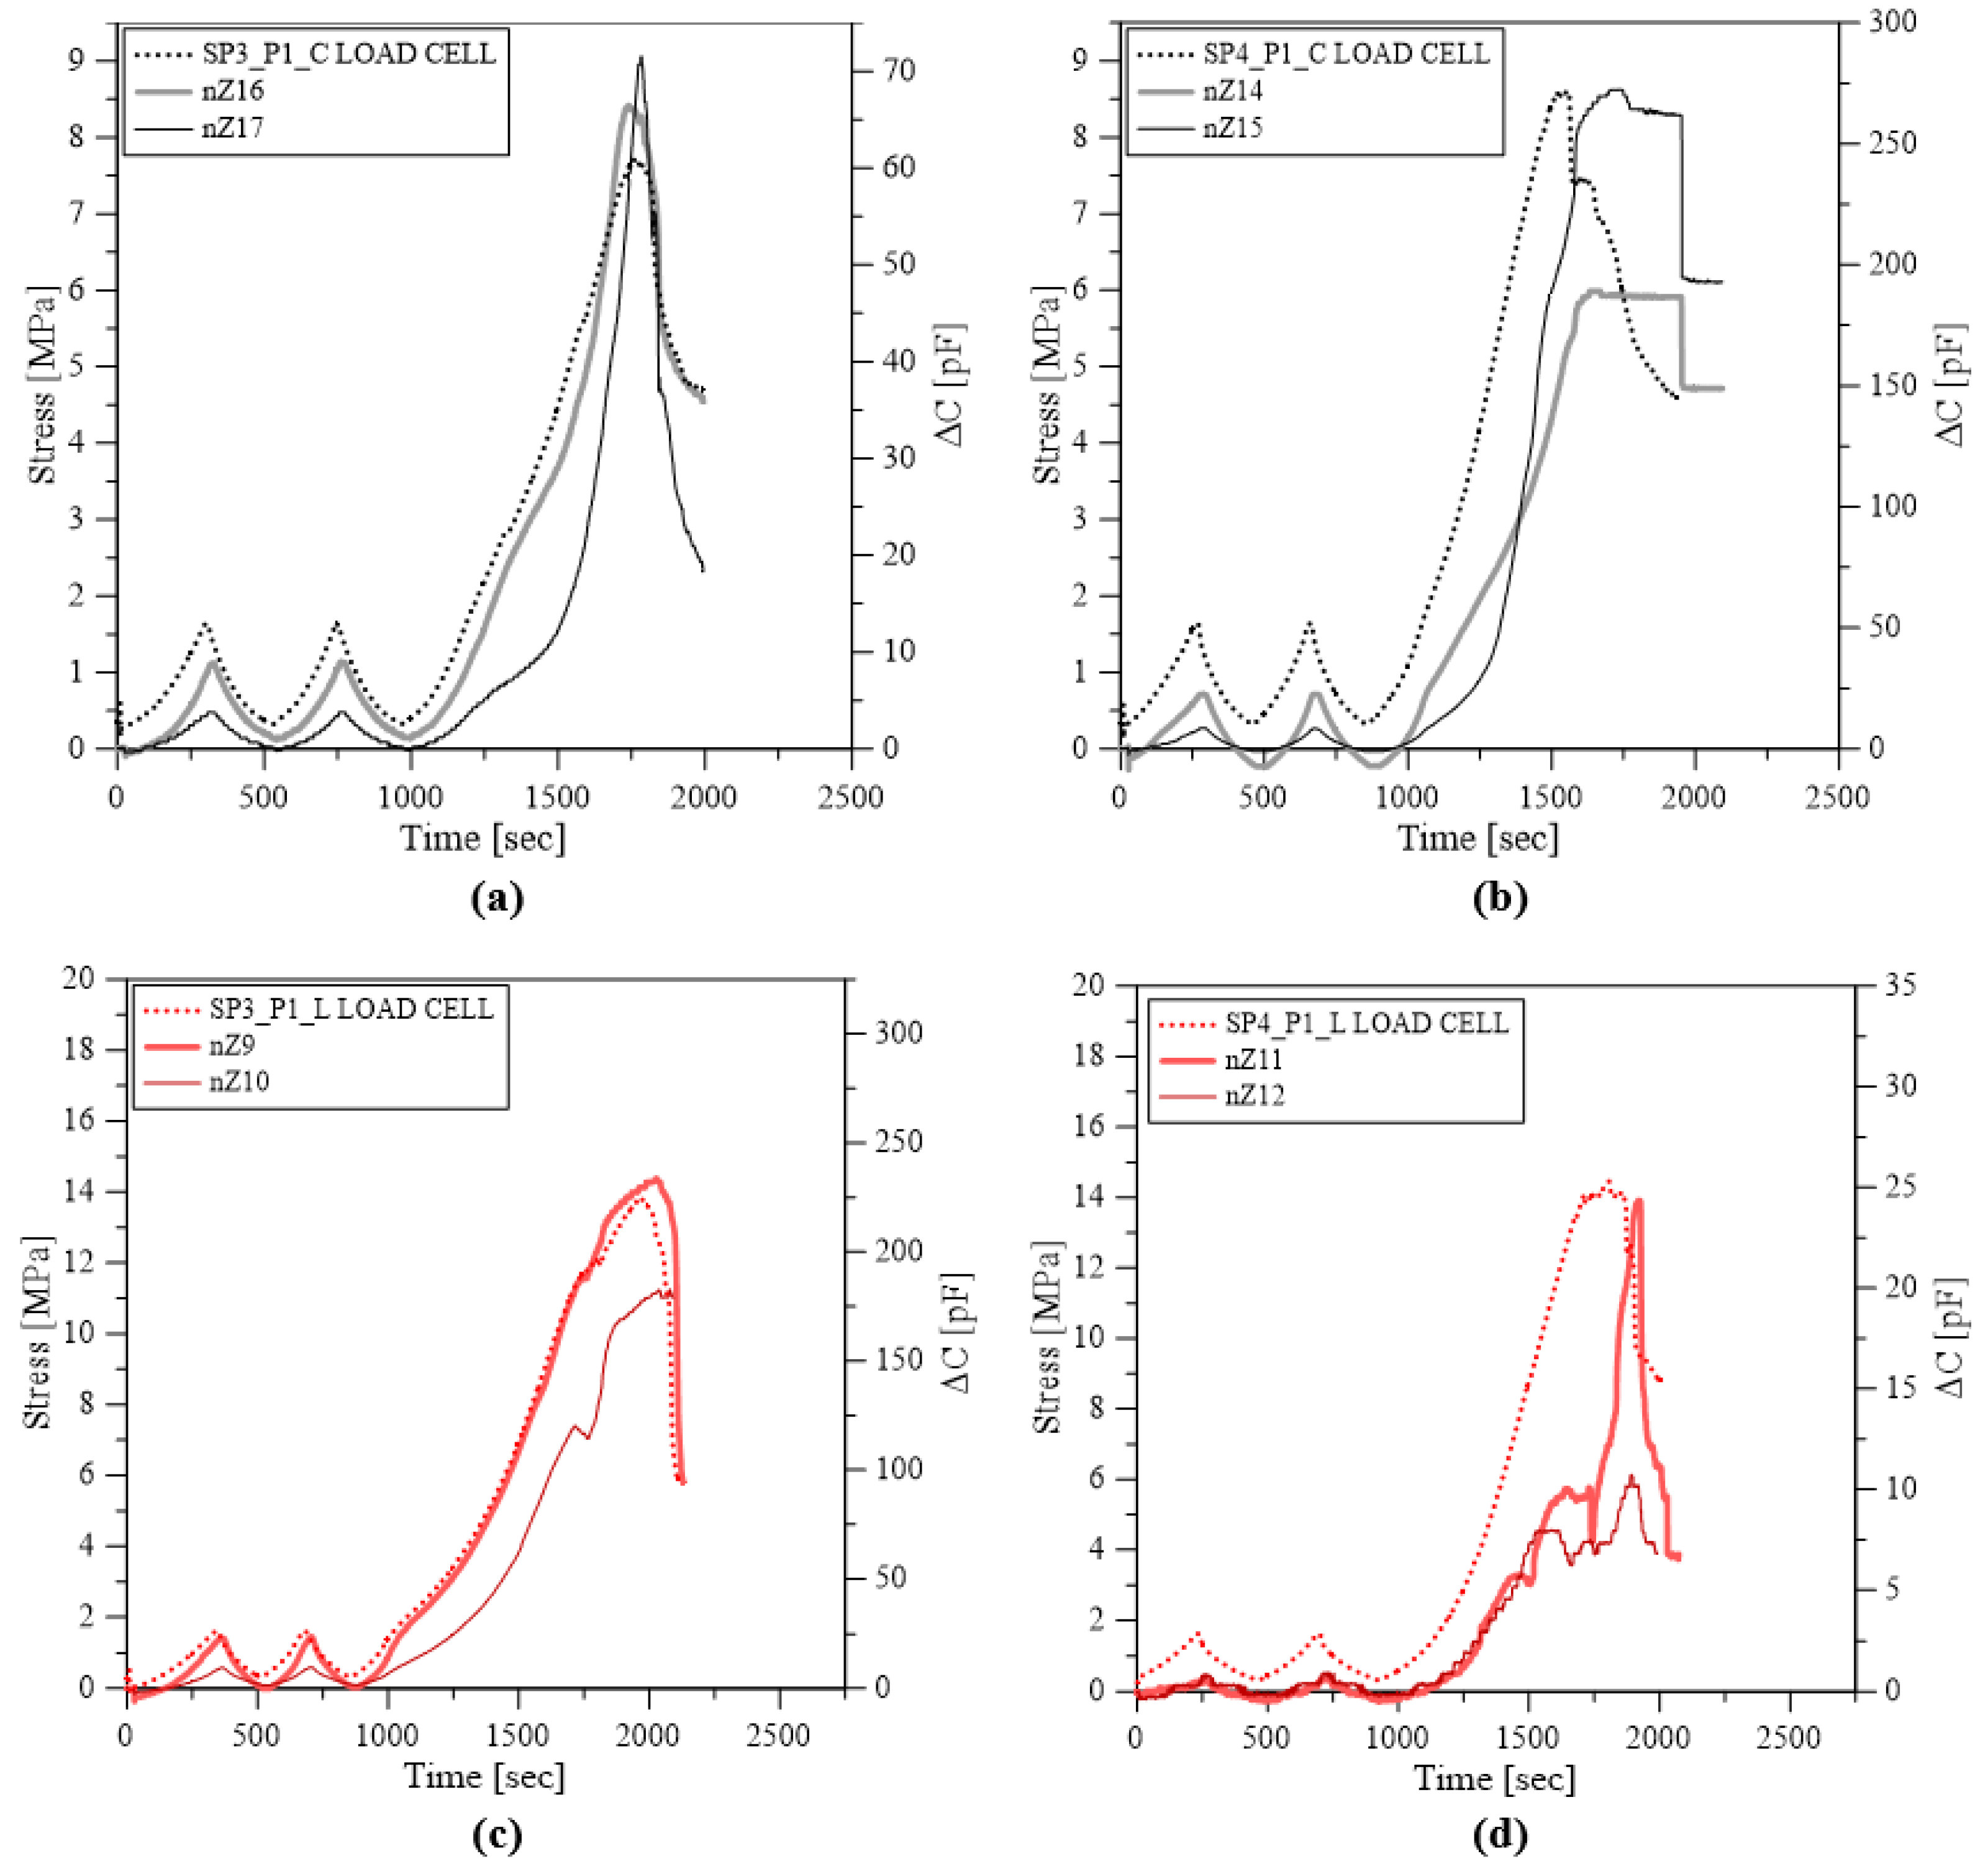
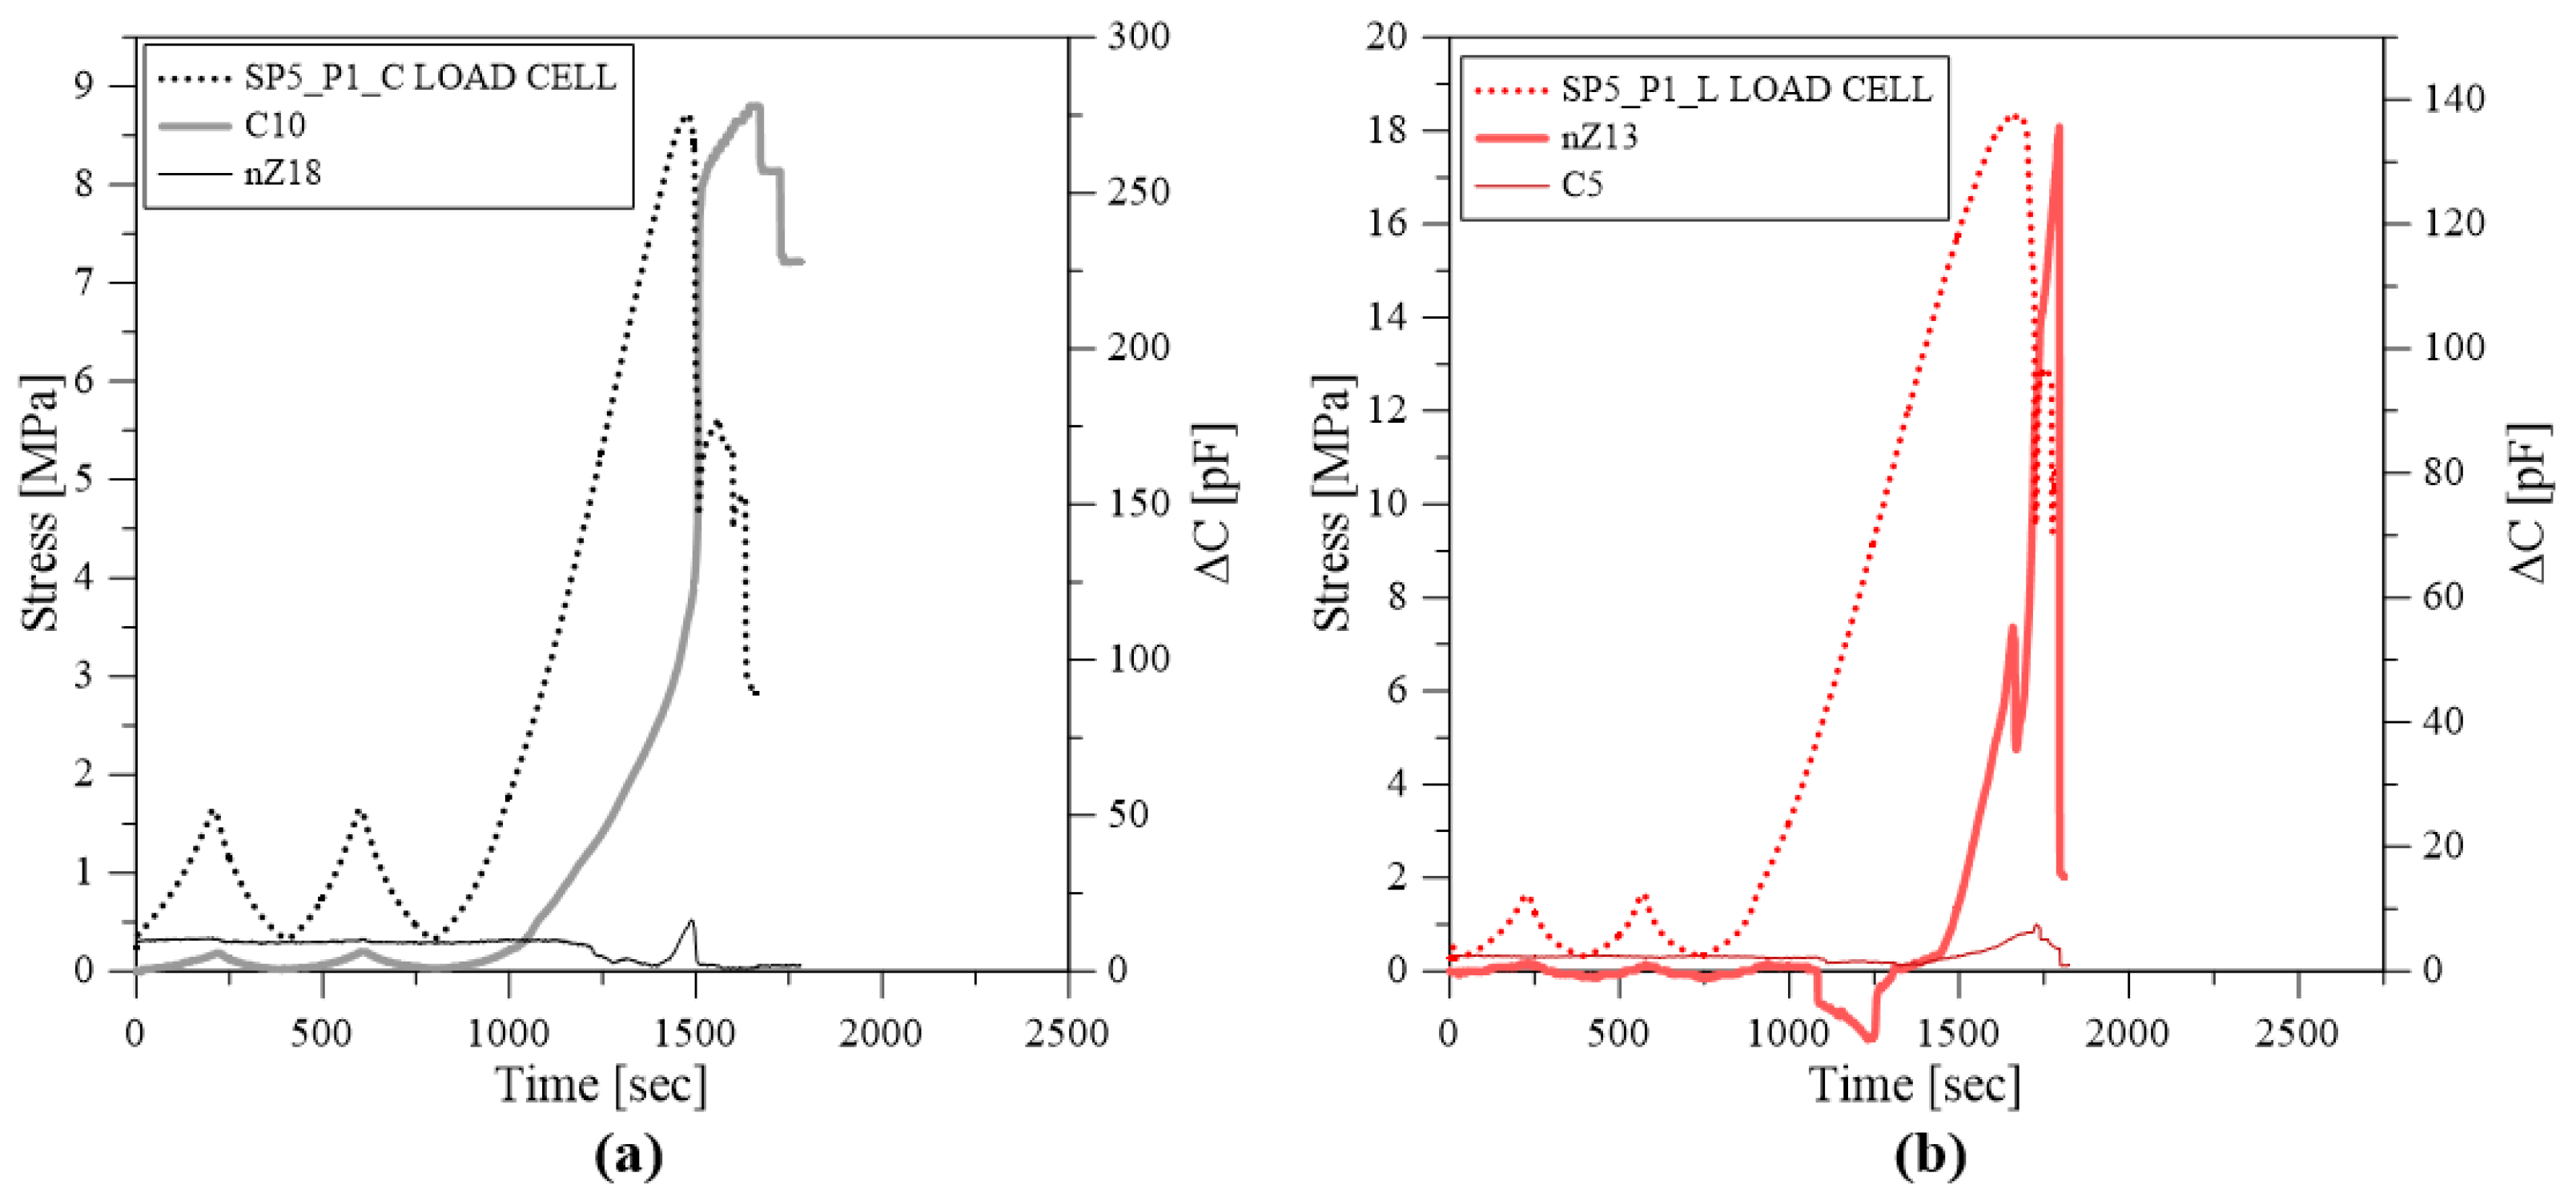
4.1. Results: Post-Installation System P1

The first post-installation method P1 highlighted some critical issues for the correct positioning of the sensors. Results from tests on the specimens (calcarenite and clay brick masonry) equipped with two ceramic sensors are shown in Figure 10. Sensors were unable to capture the trend and the peak load of the load cell reference curve. Ceramic sensors suffered from some installation defects. In detail, the mortar did not fully cover the sensing area, hence an inadequate load transfer occurred due to the discontinuities (Figure 11a). The incompatibility between the ceramic material and the mortar caused detachment, sliding and rotation of the sensor (Figure 11b). Moreover, in one case (sample SP1_P1_L), the sensors were broken (Figure 11c) because stress concentration occurred.
Results from the tests on specimens (calcarenite and clay brick masonry) equipped with two capacitive sensors are shown in Figure 12. In this case, the capacitance variation ( Δ C) recorded by sensors was able to reproduce the trend of the load cell reference curve. The copper faces of capacitive sensors established a better adhesion with the mortar layer.
Installation defects occurred in the capacitive stress sensors in samples SP4_P1_C and SP4_P1_L: voids in the coverage mortar layer (Figure 13a) and sensor rotations (Figure 13b). When the contact mortar surface is not homogeneous, it involves a lower variation of the capacitance Δ C, (Figure 12b). Initially, sensors nZ11 and nZ12 (in sample SP4_P1_L, Figure 12d) showed a low sensitivity to load variation due to voids in the mortar layer and rotation, and when the adherence was achieved near the maximum load, the sensor capacitance variations grew significantly.
Finally, Figure 14 shows the results of tests on calcarenite and clay brick masonry equipped with one ceramic stress sensor and one capacitive stress sensor.
Comparing the capacitive and ceramic stress sensor curve, it is evident that the former one has a better sensitivity compared to the latter because the copper surfaces of the capacitive sensor established good interaction with the mortar filler layer.
It is worth observing that in some cases, i.e., capacitive sensor nZ13 (Figure 14b), the interaction at the interface between the sensor surface and the mortar filler layer was lost, and a negative variation of the capacitance was observed.
Table 3 summarizes the peak stress values recorded by the ceramic stress sensors ( σ m a x , c e r a m i c ) and the variations of capacitance at the peak ( Δ C m a x ) measured by the capacitive stress sensors. Additionally, the average values and the coefficient of variation (COV) are reported. The values of σ m a x , c e r a m i c are compared with the compressive strength provided by the load cell of the testing machine ( σ m a x , l o a d c e l l ).
Considering the average values of stress, it is worth noting that the ceramic stress sensors underestimate the peak load by about 83% and 68% with reference to calcarenite and clay brick masonry, respectively.
The average peak stress measures by the sensors and by the load cell and the maximum variation of the capacitance recorded by the capacitive stress sensors are also shown in Figure 15, in addition to the standard deviation bars. The latter confirm that the average measurements of the sensors were really scattered, especially in the case of ceramic stress sensors post-installed in the calcarenite masonry specimens (COV is 88.7%) and the capacitive stress sensors post-installed in the clay brick masonry specimens (COV is 65.2%).

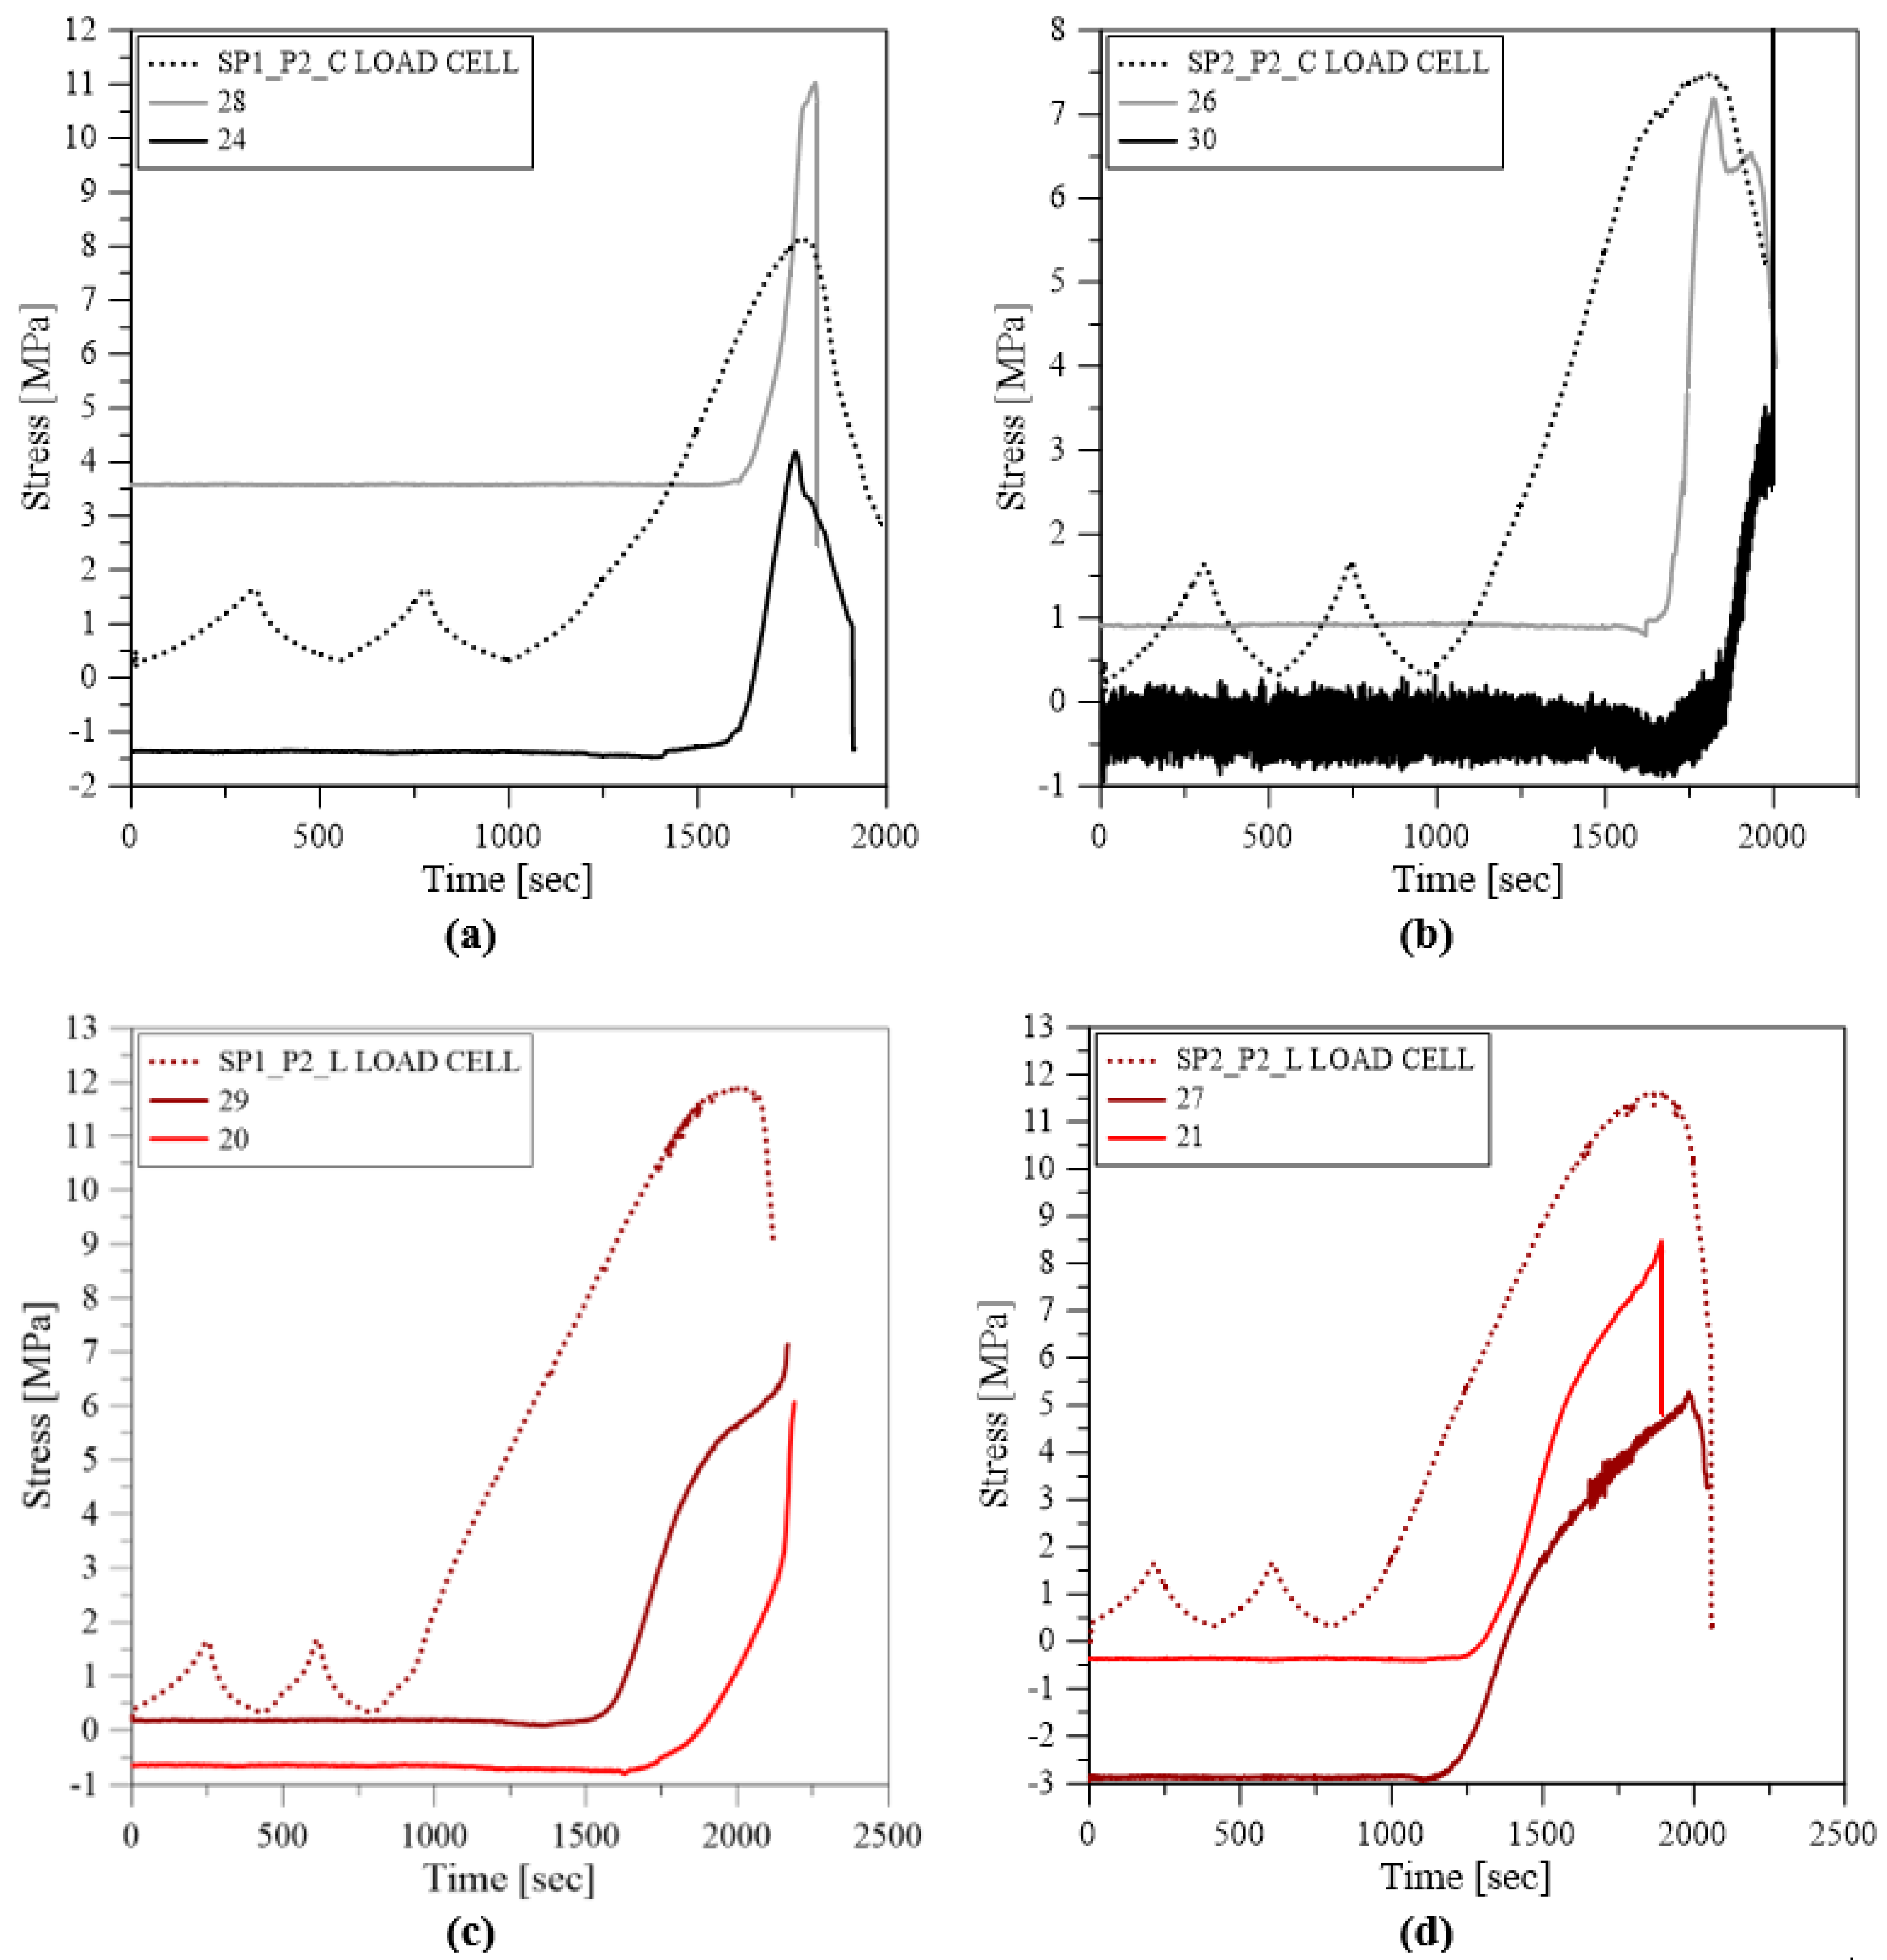
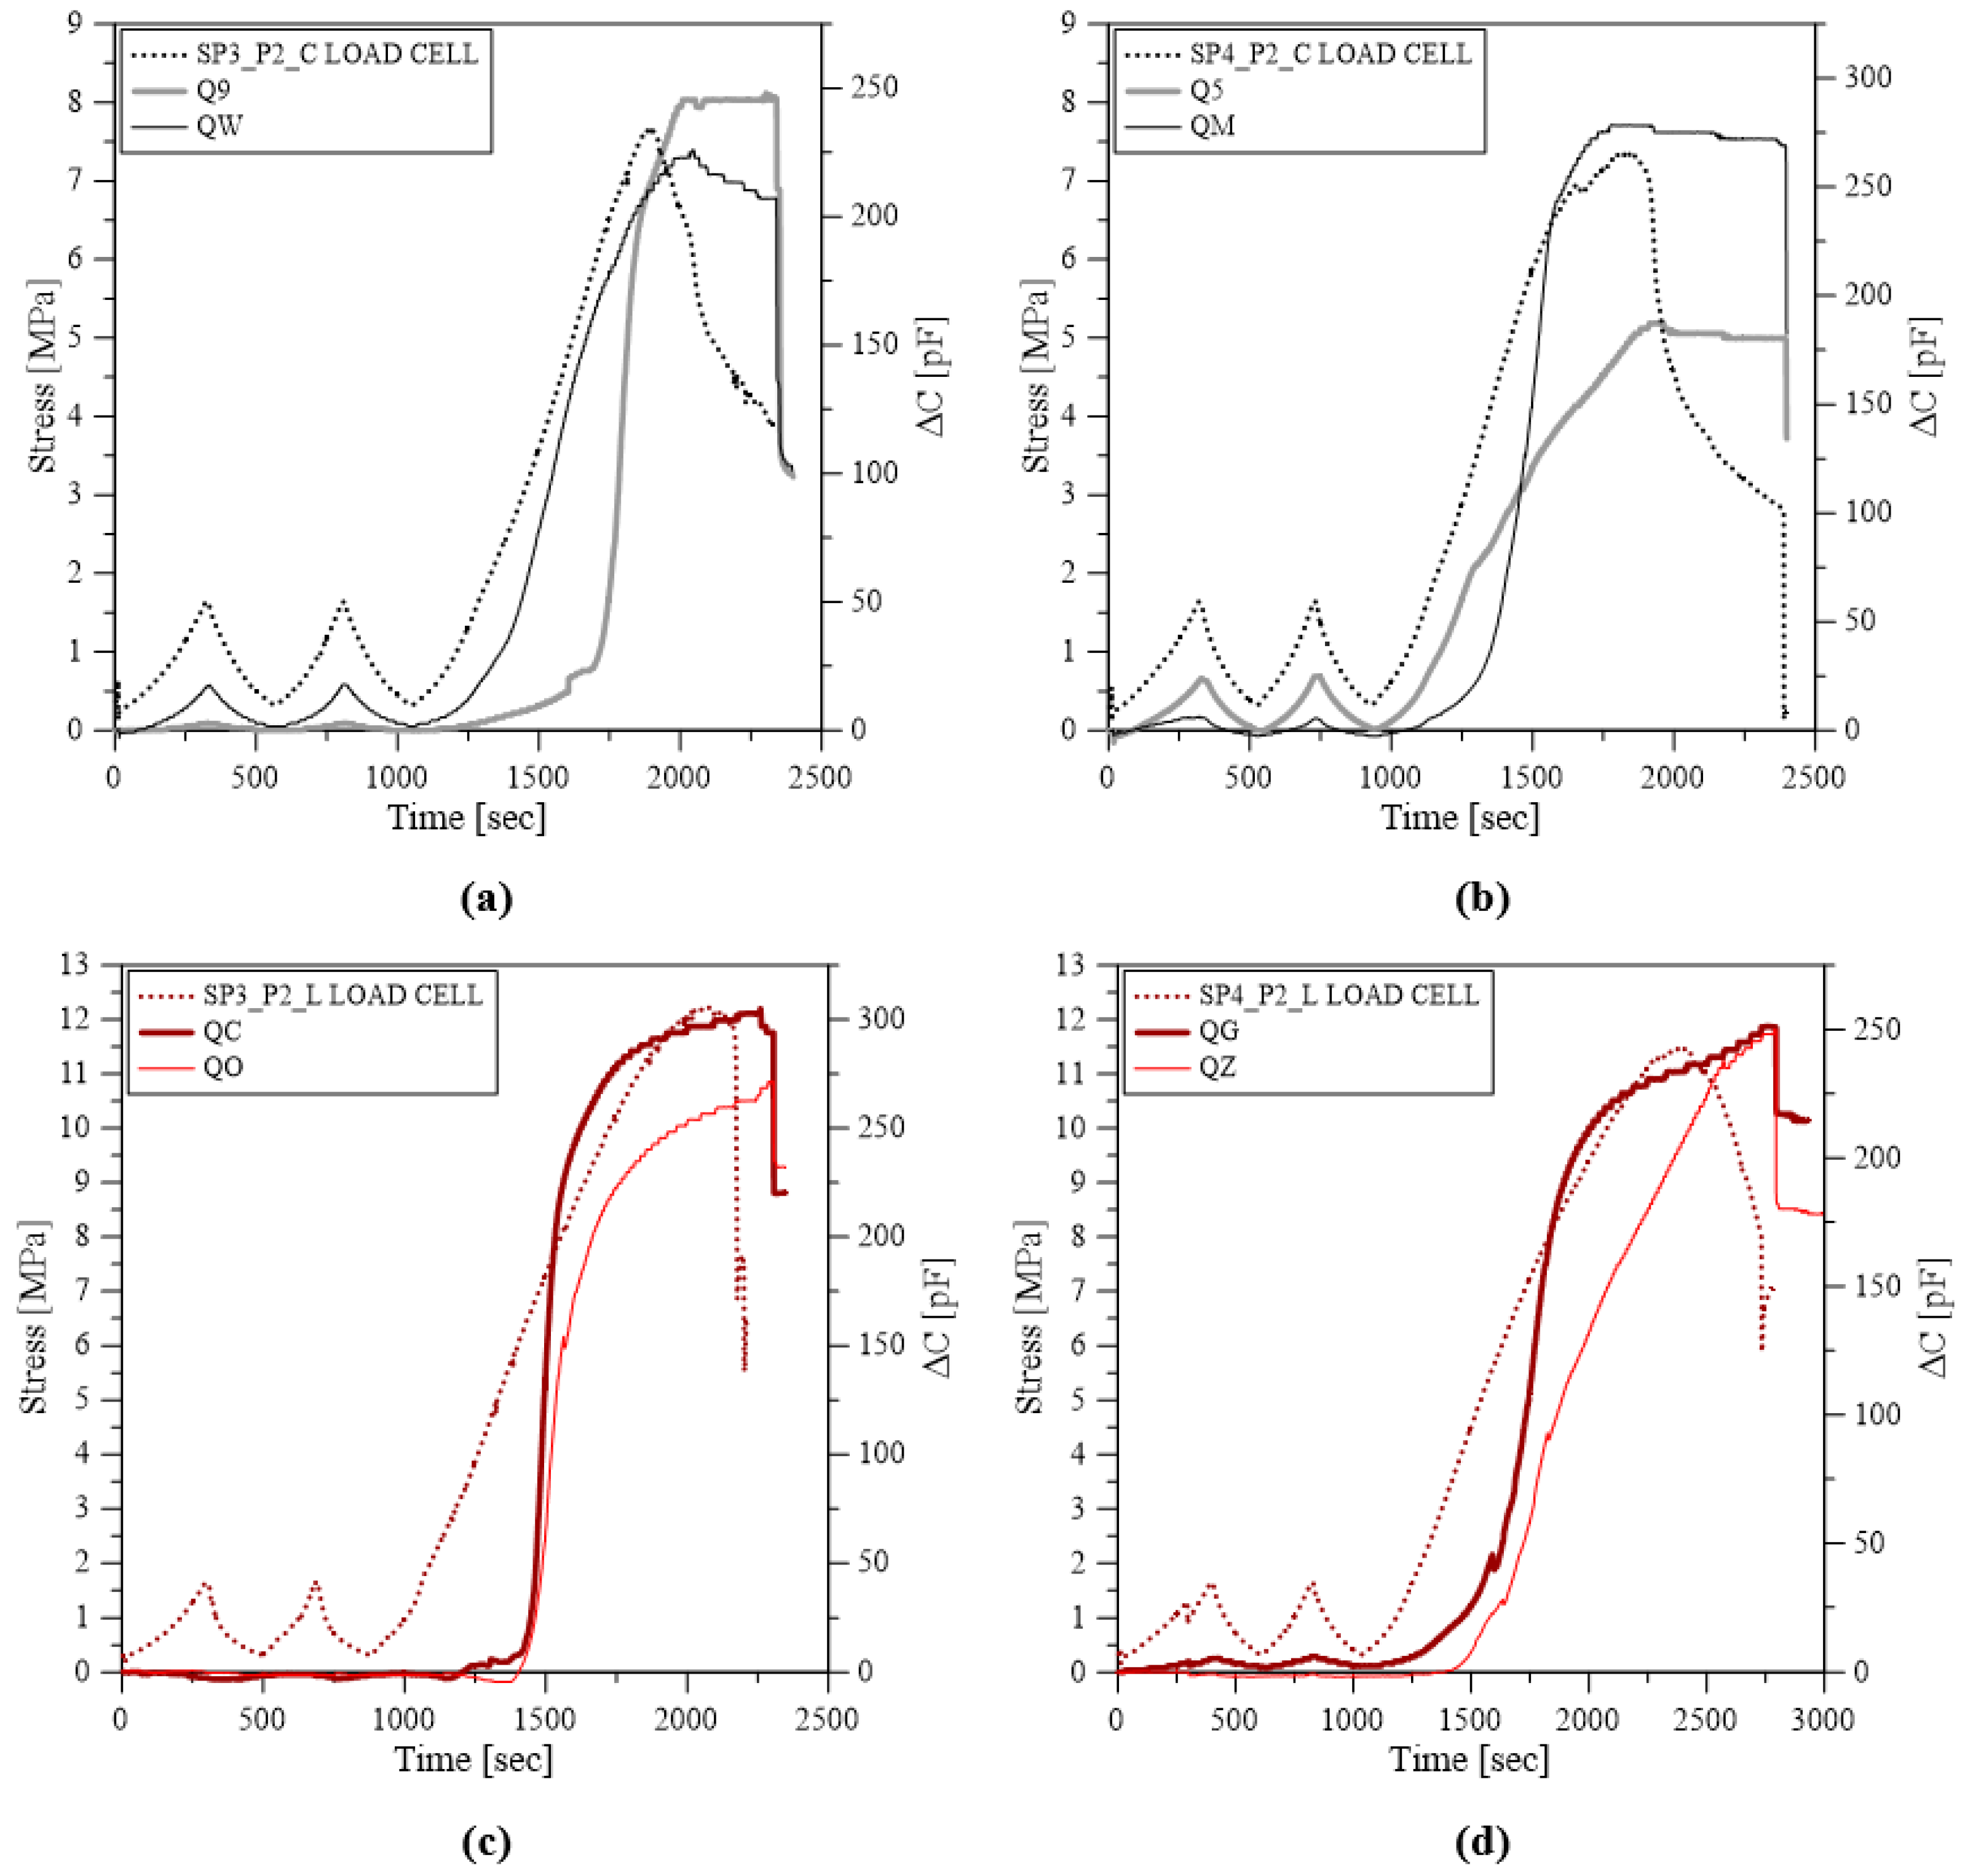
4.2. Results: Post-Installation System P2

The experimental results seen above for the P1 installation system led us to improve the method for post-installation of sensors in existing masonry elements. Figure 16 shows the results of tests on calcarenite and clay brick masonry equipped with two ceramic sensors. In this case, sensors were fully embedded (Figure 17), but the mortar stiffness reduced the sensor sensitivity to the load variations. Ceramic sensors were unable to capture the load cycles; the sensing area records a load variation only in proximity to the peak load. The curves of ceramic sensors tagged 24, 28 and 26 assumed a sub-vertical behaviour almost to the peak load (Figure 16a,b). Moreover, ceramic sensors tagged 24 and 28 (Figure 16a), 26 (Figure 16b), 20 (Figure 16c) and 27 (Figure 16d), recorded an initial non-zero load value due to sensor calibration issues. While ceramic sensor tagged 30, (Figure 16b), assumed a trend of a noisy fluctuation because potential electromagnetic interference occurred in proximity of the peak load, it failed diverging to high values.
Figure 18 shows the results of tests on calcarenite and clay brick masonry equipped with two capacitive stress sensors. A general reduction in sensor sensitivity was observed in the capacitive stress sensors for lower load values due to the use of a rigid mortar for the sensor post-installation. This effect was less evident in the capacitive sensors tagged QW (Figure 18a) and Q5 (Figure 18b).
Figure 19 shows the results of tests on calcarenite and clay brick masonry equipped with one ceramic stress sensor and one capacitive stress sensor. The trends of the ceramic sensor curves are different from the load cell reference curves, but peak load recorded are in good agreement with the reference peak load.
The main results are summarized in Table 4, as in the previous Section 4.1. It is possible to observe that the scatter significantly decreases for measurements provided by both ceramic and capacitive stress sensors. Moreover, the peak stress values recorded by ceramic sensors are closer to the values provided by the load cell, with an underestimation of about the 6% for calcarenite specimens, and about the 32% for clay brick specimens. The average results and the values of standard variation are reported in Figure 20. In the case of the post-installation system P2, the measurements provided by the capacitive stress sensors in terms of capacitance variation resulted in the highest scattering (COV is 35.6%), while the average measurements by ceramic sensors are closer to the average peak stress values recorded by the load cell and reported in the same order of magnitude.

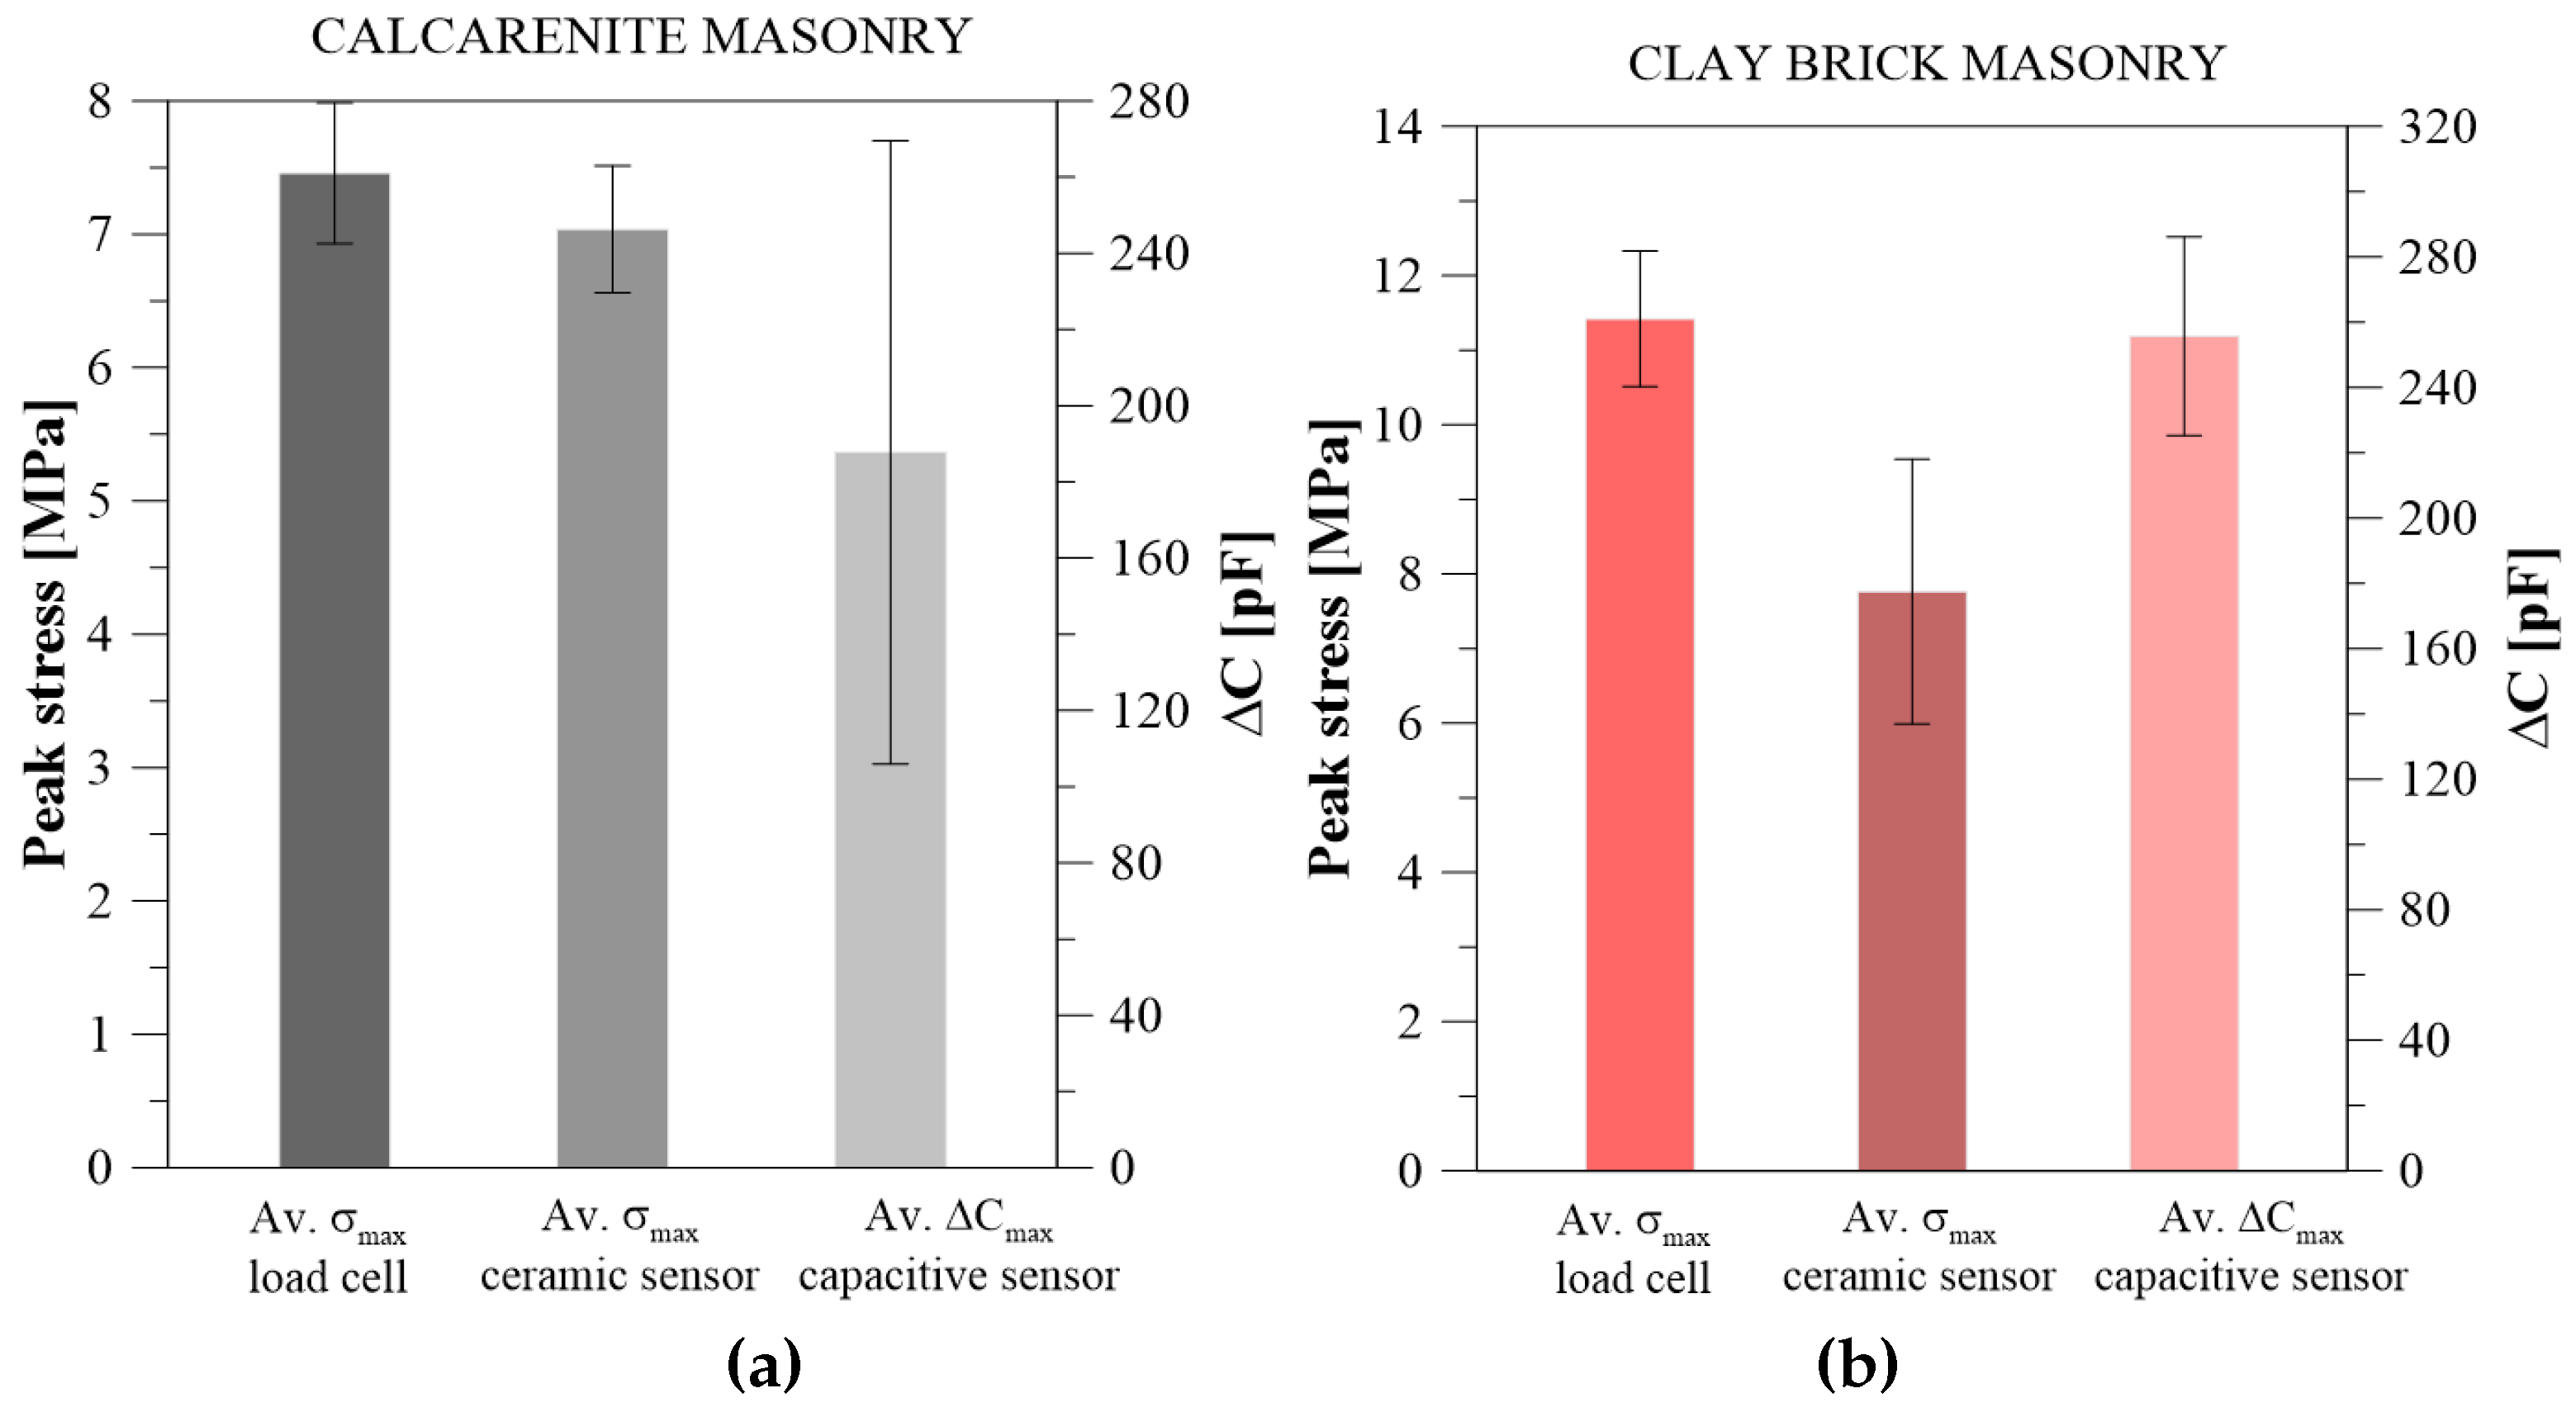
5. Comparisons and Discussion

The results of the the experiments showed a significant influence of the post-installation methodology (system P1 and system P2) and the stiffness of the post-injected mortar and of the sensor with respect to the masonry materials, in particular for the joint between the stone units. The post-installation method P1 has the advantage of being simple but showed many drawbacks because it was unable to ensure adequate filling of the hole and therefore a homogeneous distribution of the pressures on the sensor which could therefore be partially ineffective. This is particularly true for ceramic sensors, while the performance of capacitive sensors that are able to capture the stress state variations seems to be good for measurements. The post-installation method P2, on the other hand, has the disadvantage of being more complex, but it guarantees a more precise positioning and effective filling of the hole. In this case, however, the variations in stiffness due to the injected mortar and the post-installation system showed a better response of the ceramic sensors but a worse performance of the capacitive sensors, which lose sensitivity and are unable to perceive pressure variations in small ranges. The conditions at the peak stress during the test were generally well recorded by both types of sensors even if a precision calibration of the sensors to estimate an alert range for the recorded pressure variations is not yet possible. It is in fact necessary to investigate materials to use as the injection medium of the post-installed sensor to improve compatibility with the existing mortar and optimize redistribution of the pressures on the joint with the sensor installed. This is the fundamental point that guarantees the best performance of the sensors. The greater sensitivity of the capacitive sensors to the pressure variations recorded with the first post-installation system indicates that the capacitive sensor is quite sensitive as long as there is no sudden variation in stiffness between the grout of the joint and that of the injection.
Subsequent studies and a new experimental campaign are planned, with the aim of finding the optimal post-injection system and calibrating the capacitive sensors to pressure variations, since the pressure-capacity link is non-linear.

6. Conclusions

An experimental campaign was presented on the use of ceramic and capacitive sensors for the Structural Health Monitoring of masonry structures. The experiments involved compression load tests on some pre-stressed calcarenite and clay bricks walls to simulate the post-installation of sensors in existing masonry and the subsequent variation of the stress state in monitoring during service life. Two different post-installation methodologies, two types of sensors and two types of masonry were investigated. The results show that both sensors used allow recording the variation of the stress state, with no significant differences for the two types of masonry. The first post-installation system was simpler but did not guarantee the correct injection of the hole in some cases, with a less reliable response of ceramic sensors and a good performance for the capacitive sensors. The second system, on the other hand, presented a better injection and installation of the sensors but had some drawbacks regarding the variations in stiffness between the existing mortar and the injection mortar in the joint, with a consequent reduction in sensitivity for the capacitive sensors. It is therefore necessary to optimize the stiffness ratios in post-installation based on the study of the existing materials onsite and aimed at optimizing the techniques and materials used for injection. It is also necessary to carefully calibrate the capacitive sensors to the changes of stress state at the measuring points.

Author Contributions

L.L.M.: supervision, writing—review and editing, conceptualization, methodology; M.C.O.: writing—review and editing, investigation, data curation; C.C.: writing—review and editing; M.F.G.: writing—review and editing; F.P.: writing—review and editing, investigation; A.P.: writing—review and editing, investigation; S.B.: writing—review and editing, investigation. All authors have read and agreed to the published version of the manuscript.

Funding

This research was developed in the framework of PON INSIST grant number ARS01_00913. PON INSIST research project was funded by the Italian Ministry for Education, University and Research (Programma Operativo Nazionale “Ricerca e Innovazione 2014–2020”).

Institutional Review Board Statement

Not applicable.

Informed Consent Statement

Not applicable.

Data Availability Statement

Data available on request due to restrictions of the scientific data. The data presented in this study are available on request from the corresponding author.

Acknowledgments

This study was developed in the framework of PON INSIST (sistema di monitoraggio INtelligente per la SIcurezza delle infraSTrutture urbane) research project, which was funded by the Italian Ministry for Education, University and Research (Programma Operativo Nazionale “Ricerca e Innovazione 2014–2020”, Grant No. ARS01_00913). The experimental tests were carried out in the Structures Laboratory of the University of Palermo and the support of the lab staff is gratefully acknowledged.

Conflicts of Interest

The authors declare that they have no known competing financial interest or personal relationships that could have appeared to influence the work reported in this paper.

Sample Availability

Samples are not available anymore.

References

  1. Verstrynge, E.; De Wilder, K.; Drougkas, A.; Voet, E.; Van Balen, K.; Wevers, M. Crack monitoring in historical masonry with distributed strain and acoustic emission sensing techniques. Constr. Build. Mater. 2018, 162, 898–907. [Google Scholar] [CrossRef]
  2. Barsocchi, P.; Bartoli, G.; Betti, M.; Girardi, M.; Mammolito, S.; Pellegrini, D.; Zini, G. Wireless sensor networks for continuous structural health monitoring of historic masonry towers. Int. J. Archit. Herit. 2021, 15, 22–44. [Google Scholar] [CrossRef]
  3. Scuro, C.; Lamonaca, F.; Porzio, S.; Milani, G.; Olivito, R. Internet of Things (IoT) for masonry structural health monitoring (SHM): Overview and examples of innovative systems. Constr. Build. Mater. 2021, 290, 123092. [Google Scholar] [CrossRef]
  4. Pallarés, F.J.; Betti, M.; Bartoli, G.; Pallarés, L. Structural health monitoring (SHM) and Nondestructive testing (NDT) of slender masonry structures: A practical review. Constr. Build. Mater. 2021, 297, 123768. [Google Scholar] [CrossRef]
  5. Janapati, V.; Kopsaftopoulos, F.; Li, F.; Lee, S.J.; Chang, F.K. Damage detection sensitivity characterization of acousto-ultrasound-based structural health monitoring techniques. Struct. Health Monit. 2016, 15, 143–161. [Google Scholar] [CrossRef]
  6. Jo, H.; Rice, J.A.; Spencer, B.F., Jr.; Nagayama, T. Development of high-sensitivity accelerometer board for structural health monitoring. In Proceedings of the Sensors and Smart Structures Technologies for Civil, Mechanical, and Aerospace Systems 2010, San Diego, CA, USA, 7–11 March 2010; Volume 7647, pp. 39–50. [Google Scholar]
  7. Kita, A.; Cavalagli, N.; Masciotta, M.G.; Lourenço, P.B.; Ubertini, F. Rapid post-earthquake damage localization and quantification in masonry structures through multidimensional non-linear seismic IDA. Eng. Struct. 2020, 219, 110841. [Google Scholar] [CrossRef]
  8. Bezas, K.; Komianos, V.; Koufoudakis, G.; Tsoumanis, G.; Kabassi, K.; Oikonomou, K. Structural Health Monitoring in Historical Buildings: A Network Approach. Heritage 2020, 3, 796–818. [Google Scholar] [CrossRef]
  9. Clementi, F.; Formisano, A.; Milani, G.; Ubertini, F. Structural health monitoring of architectural heritage: From the past to the future advances. Int. J. Archit. Herit. 2021, 15, 1–4. [Google Scholar] [CrossRef]
  10. La Mendola, L.; Oddo, M.C.; Papia, M.; Pappalardo, F.; Pennisi, A.; Bertagnoli, G.; Di Trapani, F.; Monaco, A.; Parisi, F.; Barile, S. Experimental Testing of Two Novel Stress Sensors for shm of Masonry Structures. 2021. Available online: https://iris.polito.it/handle/11583/2950080?mode=complete (accessed on 8 March 2023).
  11. La Mendola, L.; Oddo, M.C.; Papia, M.; Pappalardo, F.; Pennisi, A.; Bertagnoli, G.; Di Trapani, F.; Monaco, A.; Parisi, F.; Barile, S. Performance of two innovative stress sensors imbedded in mortar joints of new masonry elements. Constr. Build. Mater. 2021, 297, 123764. [Google Scholar] [CrossRef]
  12. Bertagnoli, G. Method and Investigation Device for Measuring Stresses in an Agglomerate Structure. U.S. Patent 11,118,999, 14 September 2021. [Google Scholar]
  13. Guidetti, E.; Gavarti, M.A.; Caltabiano, D.; Bertagnoli, G. Stress Sensor for Monitoring the Health State of Fabricated Structures Such as Constructions, Buildings, Infrastructures and the Like. U.S. Patent 10,935,444, 2 March 2021. [Google Scholar]
  14. Anerdi, C.; Gino, D.; Malavisi, M.; Bertagnoli, G. A sensor for embedded stress measure of concrete: Testing and material heterogeneity issues. In Proceedings of the Italian Concrete Days 2018, Lecco, Italy, 14–15 June 2018; Springer: Berlin/Heidelberg, Germany, 2021; pp. 385–399. [Google Scholar]
  15. Pappalardo, F.; Pennisi, A.; Guidetti, E.; Doriani, A. Capacitive Pressure Sensor for Monitoring Construction Structures, Particularly Made of Concrete. U.S. Patent 10,914,647, 9 February 2021. [Google Scholar]
Figure 1. Innovative stress sensors: (a) Ceramic. (b) Capacitive.
Applsci 13 03712 g001
Figure 2. Specimen geometry (dimensions in mm).
Applsci 13 03712 g002
Figure 3. Steel contrast system.
Applsci 13 03712 g003
Figure 4. Operating phases for the first post-installation system (P1) of the sensors: (a) hole drilling; (b) hole filling by using mortar; (c) sensor placement; (d) hole sealing.
Applsci 13 03712 g004
Figure 5. Operating phases for the second post-installation system (P2) of the sensors: (a) hole drilling; (b) fixing the sensor on a plexiglass plate; (c) sensors placement by using a plexiglass support; (d) hole filling.
Applsci 13 03712 g005
Figure 6. Sensor placement (dimensions in mm) for post-installation system P1: (a) pattern with two horizontal ceramic sensors; (b) pattern with two horizontal capacitive stress sensors; (c) pattern with two horizontal stress sensors, i.e., one ceramic and the other capacitive.
Applsci 13 03712 g006
Figure 7. Sensor placement (dimensions in mm) for post-installation system P2: (a) pattern with two horizontal ceramic sensors; (b) pattern with two horizontal capacitive stress sensors; (c) pattern with two horizontal stress sensors, i.e., one ceramic and the other capacitive.
Applsci 13 03712 g007
Figure 8. Test setup.
Applsci 13 03712 g008
Figure 9. Placement of digital absolute displacement indicators.
Applsci 13 03712 g009
Figure 10. Comparison of outcomes from ceramic sensor and load cell for post-installation system P1: (a,b) calcarenite masonry; (c,d) clay bricks masonry.
Applsci 13 03712 g010
Figure 11. Installation defects: (a) discontinuity in the section; (b) sensor rotation; (c) sensor rupture.
Applsci 13 03712 g011
Figure 12. Comparison of outcomes from capacitive sensor and load cell, for post-installation system P1: (a,b) calcarenite masonry; (c,d) clay bricks masonry.
Applsci 13 03712 g012
Figure 13. Installation defects: (a) discontinuity in the section; (b) sensor rotation.
Applsci 13 03712 g013
Figure 14. Comparison between measurements provided by ceramic and capacitive sensors and the load cell data for post-installation system P1: (a) calcarenite masonry; (b) clay brick masonry.
Applsci 13 03712 g014
Figure 15. Average and standard deviation values according to post-installation system P1: (a) calcarenite masonry; (b) clay bricks masonry.
Applsci 13 03712 g015
Figure 16. Comparison of outcomes from ceramic sensor and load cell, for post-installation system P2: (a,b) calcarenite masonry; (c,d) clay brick masonry.
Applsci 13 03712 g016
Figure 17. Sensor fully embedded after the test.
Applsci 13 03712 g017
Figure 18. Comparison of outcomes from capacitive sensor and load cell, for post-installation system P2: (a,b) calcarenite masonry; (c,d) clay brick masonry.
Applsci 13 03712 g018
Figure 19. Comparison between measurements provided by ceramic and capacitive sensors and the load cell data, for post-installation system P2: (a) calcarenite masonry; (b) clay brick masonry.
Applsci 13 03712 g019
Figure 20. Average and standard deviation values, according to post-installation system P2: (a) calcarenite masonry; (b) clay bricks masonry.
Applsci 13 03712 g020
Table 1. Specimens and sensors post-installed with method P1 (dimensions in mm).
Type
of Masonry
ID
Specimen
Type
of Sensor
ID
Stress Sensor
x = 195.0
y = 185.0
x = 315.0
y = 185.0
CalacareniteSP1_P1_CceramicC9C8
SP2_P1_CceramicC6C7
SP3_P1_Ccapacitivenz17nz16
SP4_P1_Ccapacitivenz14nz15
SP5_P1_Cceramic + capacitive10nz18
Clay brickSP1_P1_LceramicC1C2
SP2_P1_LceramicC4C3
SP3_P1_Lcapacitivenz10nz9
SP4_P1_Lcapacitivenz11nz12
SP5_P1_Lceramic + capacitive5nz13
Table 2. Specimens and sensors post-installed with method P2 (dimensions in mm).
Type
of Masonry
ID
Specimen
Type
of Sensor
ID
Stress Sensor
x = 195.0
y = 185.0
x = 315.0
y = 245.0
CalacareniteSP1_P2_Cceramic2824
SP2_P2_Cceramic2630
SP3_P2_CcapacitiveQ9QW
SP4_P2_CcapacitiveQ5QM
SP5_P2_Cceramic + capacitive25Q8
Clay brickSP1_P2_Lceramic2920
SP2_P2_Lceramic2721
SP3_P2_LcapacitiveQCQO
SP4_P2_LcapacitiveQGQZ
SP5_P2_Lceramic + capacitive23QS
Table 3. Peak stress values recorded by the load cell of the testing machine and ceramic stress sensors and capacitance variation values at the peak recorded by the capacitive stress sensors post-installed adopting method P1.
ID Specimen σ max , load cell
[MPa]
σ max , ceramic [MPa] σ max , ceramic σ max , load cell Δ C max [pF]
SP1_P1_C7.36(C9) 0.18(C8) 1.020.020.14--
SP2_P1_C9.40(C6) 3.10(C7) 3.670.330.396--
SP3_P1_C7.72----(nz17) 66.44(nz16) 71.51
SP4_P1_C8.59----(nz14) 272.32(nz15) 189.17
SP5_P1_C8.71(10) 0.520.06(nz18) 278.0
Average8.631.50--192.57
COV8.7%88.7%--46.5%
SP1_P1_L17.72(C1) 4.93(C2) 8.010.280.45--
SP2_P1_L14.97(C4) 4.93(C3) 11.000.330.73--
SP3_P1_L13.80----(nz10) 182.77(nz9) 233.79
SP4_P1_L14.46----(nz11) 10.75(nz12) 24.36
SP5_P1_L18.31(5) 1.000.05(nz13) 135.6
Average15.855.15--120.49
COV11.4%58.2%--65.2%
Table 4. Peak stress values recorded by the load cell of the testing machine and ceramic stress sensors and capacitance variation values at the peak recorded by capacitive stress sensors post-installed adopting the method P2.
ID Specimen σ max , load cell
[MPa]
σ max , ceramic [MPa] σ max , ceramic σ max , load cell Δ C max [pF]
SP1_P2_C8.12(28) 7.46(24) 5.550.920.68--
SP2_P2_C7.48(26) 7.19(30) *0.96*--
SP3_P2_C7.67----(Q9) 248.12(QW) 226.01
SP4_P2_C7.35----(Q5) 187.32(QM) 278.49
SP5_P2_C6.67(25) 7.421.11(Q8) 93.36
Average7.467.04--187.78
COV6.3%5.5%--35.6%
SP1_P2_L11.91(29) 7.14(20) 6.070.600.85--
SP2_P2_L11.63(27) 5.29(21) 8.480.450.73--
SP3_P2_L12.22----(QC) 305.05(QO) 271.63
SP4_P2_L11.47----(QG) 251.26(QZ) 250.07
SP5_P2_L9.88(23) 9.810.99(QS) 228.18
Average11.427.77--255.73
COV7.11%18.7%--9.71%
* unreliable value.
Disclaimer/Publisher’s Note: The statements, opinions and data contained in all publications are solely those of the individual author(s) and contributor(s) and not of MDPI and/or the editor(s). MDPI and/or the editor(s) disclaim responsibility for any injury to people or property resulting from any ideas, methods, instructions or products referred to in the content.

