
Comparative Impact Analysis of Cyclone Ana in the Mozambique Channel Using Satellite Data


Abstract
1. Introduction
1.1. An Introduction to Flooding
1.2. Relationship between Mangrove Ecosystems & Cyclones
1.3. Knowledge Gap
1.4. Study Objectives
- Are there differences in the climatic and anthropogenic impacts after TCs in coastal Mozambique and Madagascar?
- Specifically, were mangrove forests degraded after the TC? Were there regional differences in the degradation extent and pattern? For example, do areas in the vicinity of the mangrove hit by the TC fare better than non-mangrove areas?
2. Materials and Methods
2.1. Study Area
2.2. An Overview of Tropical Cyclone Ana
2.3. Impact Assessment
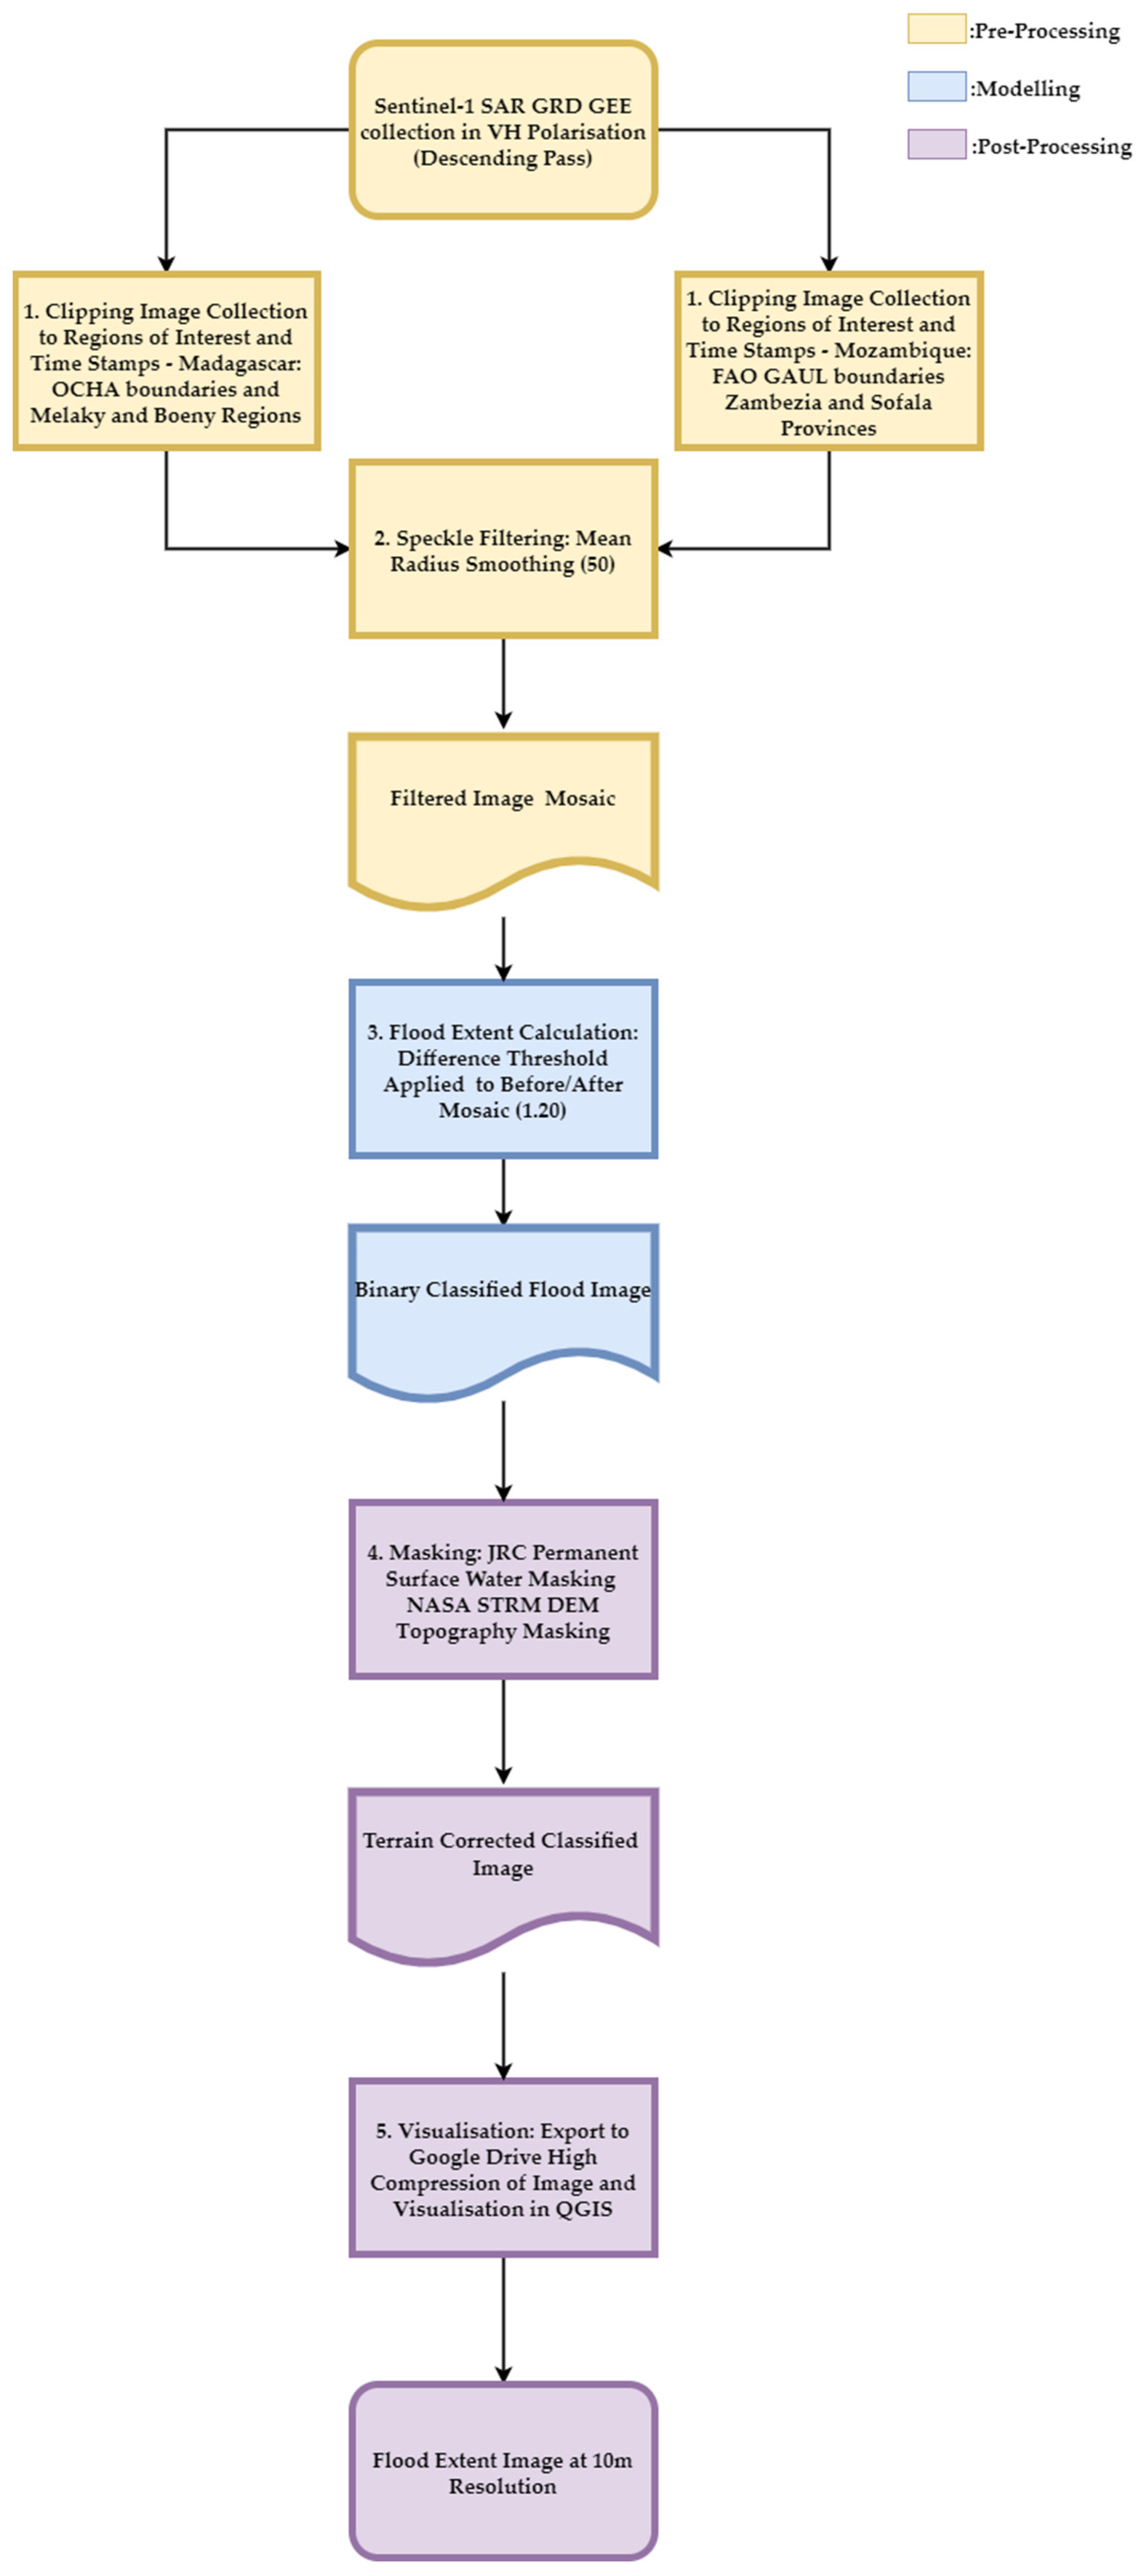
2.3.1. Flood Model
2.3.2. Socio-Ecological Flood Impacts Model
3. Results
4. Discussion
4.1. Impact Numbers in the Mozambique Channel
4.2. Spatial and Regional Trends
4.3. Beneficial Impact of Mangrove Forests in Flood Mitigation
4.4. Sociological Impact of Flooding
4.5. Limitations
5. Conclusions
Supplementary Materials
Author Contributions
Funding
Institutional Review Board Statement
Informed Consent Statement
Data Availability Statement
Conflicts of Interest
References
- Charrua, A.; Padmanaban, R.; Cabral, P.; Bandeira, S.; Romeiras, M. Impacts of the Tropical Cyclone Idai in Mozambique: A Multi-Temporal Landsat Satellite Imagery Analysis. Remote Sens. 2021, 13, 201. [Google Scholar] [CrossRef]
- Ouyang, Y.; Grace, J.; Parajuli, P.; Caldwell, P. Impacts of Multiple Hurricanes and Tropical Storms on Watershed Hydrological Processes in the Florida Panhandle. Climate 2022, 10, 42. [Google Scholar] [CrossRef]
- National Oceanic and Atmospheric Administration 2015. Available online: https://www.ncei.noaa.gov/access/monitoring/monthly-report/global/201513 (accessed on 1 March 2023).
- McBride, J.; Zehr, R. Observational Analysis of Tropical Cyclone Formation. Part II: Comparison of Non-Developing versus Developing Systems. J. Atmos. Sci. 1981, 38, 1132–1151. [Google Scholar] [CrossRef]
- Matyas, C. Tropical cyclone formation and motion in the Mozambique Channel. Int. J. Climatol. 2014, 35, 375–390. [Google Scholar] [CrossRef]
- ACAPS. Madagascar Tropical Cyclones Season in 2022. 2022. Available online: https://www.acaps.org/country/madagascar/crisis/tropical-cyclones-season-in-2022 (accessed on 11 November 2022).
- UNOCHA. Madagascar. Available online: https://www.unocha.org/southern-and-eastern-africa-rosea/madagascar (accessed on 11 November 2022).
- Cabral, P.; Augusto, G.; Akande, A.; Costa, A.; Amade, N.; Niquisse, S.; Atumane, A.; Cuna, A.; Kazemi, K.; Mlucasse, R.; et al. Assessing Mozambique’s exposure to coastal climate hazards and erosion. IJDRR 2017, 23, 45–52. [Google Scholar] [CrossRef]
- Giri, C.; Muhlhausen, J. Mangrove Forest Distributions and Dynamics in Madagascar (1975–2005). Sensors 2008, 8, 2104–2117. [Google Scholar] [CrossRef]
- Mathew, A.; Kumar, S.; Vivek, G.; Iyyappan, M.; Karthikaa, R.; Kumar, P.; Dash, S.; Gopinath, G.; Usha, T. Flood impact assessment using field investigations and post-flood survey. J. Earth Syst. Sci. 2021, 130, 147. [Google Scholar] [CrossRef]
- Arnell, N.; Gosling, S. The impacts of climate change on river flood risk at the global scale. Clim. Ch. 2014, 134, 387–401. [Google Scholar] [CrossRef]
- Lequechane, J.; Mahumane, A.; Chale, F.; Nhabomba, C.; Salomão, C.; Lameira, C.; Chicumbe, S.; Semá, B.C. Mozambique’s response to cyclone Idai: How Collaboration and Surveillance with Water, Sanitation and Hygiene (WASH) Interventions were used to Control a Cholera Epidemic. Infect. Dis. Poverty 2020, 9, 121–124. [Google Scholar] [CrossRef]
- Talbot, C.; Bennett, E.; Cassell, K.; Hanes, D.; Minor, E.; Paerl, H.; Raymond, P.; Vargas, R.; Vidon, P.; Wollheim, W.; et al. The Impact of Flooding on Aquatic Ecosystem Services. Biogeochemistry 2018, 141, 439–461. [Google Scholar] [CrossRef]
- Gotkowitz, M.; Attig, J.; McDermott, T. Groundwater Flood of a River Terrace in Southwest Wisconsin, USA. Hydrogeol. J. 2014, 22, 1421–1432. [Google Scholar]
- Charrua, A.; Bandeira, S.; Catarino, S.; Cabral, P.; Romeiras, M. Assessment of the vulnerability of coastal mangrove ecosystems in Mozambique. Ocean Coast. Manag. 2020, 189, 105145. [Google Scholar] [CrossRef]
- Alongi, D. Present State and Future of the World’s MANGROVE Forests. Environ. Conserv. 2002, 29, 331–349. [Google Scholar] [CrossRef]
- Blankespoor, B.; Dasgupta, S.; Lange, G. Mangroves as a Protection from Storm Surges in a Changing Climate. Ambio 2016, 46, 478–491. [Google Scholar] [CrossRef]
- Krauss, K.; McKee, K.; Lovelock, C.; Cahoon, D.; Saintilan, N.; Reef, R.; Chen, L. How Mangrove Forests Adjust to Rising Sea Level. New Phytol. 2013, 202, 19–34. [Google Scholar] [CrossRef]
- Barbosa, F.; Cuambe, C.; Bandeira, S. Status and distribution of mangroves in Mozambique. S. Afr. J. Bot. 2001, 67, 393–398. [Google Scholar]
- Fatoyinbo, T.; Simard, M. Height and biomass of mangroves in Africa from ICESat/GLAS and SRTM. Int. J. Remote Sens. 2013, 34, 668–681. [Google Scholar] [CrossRef]
- Sitoe, A.; Mandlate, L.; Guedes, B. Biomass and Carbon Stocks of Sofala Bay Mangrove Forests. Forests 2015, 5, 1967–1981. [Google Scholar] [CrossRef]
- Skakun, S. A Neural Network Approach to Flood Mapping Using Satellite Imagery. Comput. Inform. 2010, 29, 1013–1024. [Google Scholar]
- Jones, T.; Glass, L.; Gandhi, S.; Ravaoarinorotsihoarana, L.; Carro, A.; Benson, L.; Ratsimba, H.; Giri, C.; Randriamanatena, D.; Cripps, G. Madagascar’s Mangroves: Quantifying Nation-Wide and Ecosystem Specific Dynamics, and Detailed Contemporary Mapping of Distinct Ecosystems. Remote Sens. 2016, 8, 106. [Google Scholar]
- Tropical Storm Ana 2022. Available online: https://zoom.earth/storms/ana-2022/#map=daily (accessed on 30 August 2022).
- FAO Crop Calendar. Available online: https://cropcalendar.apps.fao.org/#/home (accessed on 11 November 2022).
- Kussul, N.; Shelestov, A.; Skakun, S. Flood Monitoring on the Basis of SAR Data. In Use of Satellite and In-Situ Data to Improve Sustainability; Kogan, F., Powell, A., Fedorov, O., Eds.; NATO Science for Peace and Security Series C: Environmental Security; Springer: Berlin/Heidelberg, Germany, 2011; pp. 19–29. [Google Scholar]
- Kussul, N.; Shelestov, A.; Skakun, S. Grid System for Flood Extent Extraction from Satellite Images. Earth Sci. Inform. 2008, 1, 105–117. [Google Scholar] [CrossRef]
- Kussul, N.; Shelestov, A.; Skakun, S.; Li, G.; Kussul, O.; Xie, J. Service-oriented infrastructure for flood mapping using optical and SAR satellite data. Int. J. Digit. Earth 2014, 7, 829–845. [Google Scholar] [CrossRef]
- Kussul, N.; Shelestov, A.; Skakun, S.; Li, G.; Kussul, O. The Wide Area Grid Testbed for Flood Monitoring Using Earth Observation Data. IEEE J. Sel. Top. Appl. Earth Obs. Remote Sens. 2012, 5, 1746–1751. [Google Scholar] [CrossRef]
- Kussul, N.; Shelestov, A.; Skakun, S. Grid and Sensor Web Technologies for Environmental Monitoring. Earth Sci. Inform. 2009, 2, 37–51. [Google Scholar] [CrossRef]
- Fischell, L.; Lüdtke, D.; Duguru, M. Capabilities of SAR and Optical Data for Rapid Mapping of Flooding Events. 2018. Available online: http://geomundus.org/2018/docs/papers/Lisa.pdf (accessed on 11 November 2022).
- Hoque, M.; Phinn, S.; Roelfsema, C.; Childs, I. Assessing tropical cyclone impacts using object-based moderate spatial resolution image analysis: A case study in Bangladesh. Int. J. Remote Sens. 2016, 37, 5320–5343. [Google Scholar] [CrossRef]
- Bhowmik, A.; Cabral, P. Cyclone Sidr Impacts on the Sundarbans Floristic Diversity. Earth Sci. Res. 2013, 2, 62. [Google Scholar] [CrossRef]
- Web of Science Group. Available online: https://mjl.clarivate.com/search-results (accessed on 1 March 2023).
- Zanaga, D.; Van De Kerchove, R.; De Keersmaecker, W.; Souverijns, N.; Brockmann, C.; Quast, R.; Wevers, J.; Grosu, A.; Paccini, A.; Vergnaud, S.; et al. ESA WorldCover 10 m 2020 (Version v100). Available online: https://zenodo.org/record/5571936#.Y3zMW0nMK70 (accessed on 11 November 2022).
- Mozambique: Tropical Storm Ana Flash Report Update 1: Damages Recorded in the Communities Assessed-Zambezia Province. Available online: https://dtm.iom.int/reports/mozambique-%E2%80%94-tropical-storm-ana-flash-report-update-1-%E2%80%94-damages-recorded-communities-0 (accessed on 11 November 2022).
- Tropical Storm Ana: Jan 2022. Available online: https://reliefweb.int/disaster/st-2022-000088-moz (accessed on 30 August 2022).
- Kolstad, E. Prediction and precursors of Idai and 38 other tropical cyclones and storms in the Mozambique Channel. Q. J. R. Meteorol. Soc. 2020, 147, 45–57. [Google Scholar] [CrossRef]
- Cyclone et Activite Cyclonique par Météo-France La Réunion. Available online: https://meteofrance.re/fr/cyclone (accessed on 11 November 2022).
- Ballesteros, C.; Esteves, L. Integrated Assessment of Coastal Exposure and Social Vulnerability to Coastal Hazards in East Africa. Estuaries Coasts 2021, 44, 2056–2072. [Google Scholar] [CrossRef]
- Rubinato, M.; Nichols, A.; Peng, Y.; Zhang, J.; Lashford, C.; Cai, Y.; Lin, P.; Tait, S. Urban and river flooding: Comparison of flood risk management approaches in the UK and China and an assessment of future knowledge needs. Water Sci. Eng. 2019, 12, 274–283. [Google Scholar] [CrossRef]
- Ramiaramanana, F.; Teller, J. Urbanization and Floods in Sub-Saharan Africa: Spatiotemporal Study and Analysis of Vulnerability Factors: Case of Antananarivo Agglomeration (Madagascar). Water 2021, 13, 149. [Google Scholar] [CrossRef]
- Farr, T.G.; Rosen, P.A.; Caro, E.; Crippen, R.; Duren, R.; Hensley, S.; Kobrick, M.; Paller, M.; Rodriguez, E.; Roth, L.; et al. The Shuttle Radar Topography Mission. Rev. Geophys. 2007, 45, 1–43. [Google Scholar] [CrossRef]


| Data (Index Type) | Data Name | Source | Spatial Resolution | Temporal Coverage |
|---|---|---|---|---|
| Land Cover Classification | CGLOPS Land Cover Classification | Copernicus: ESA- VITO | 10 m | Static: 2020 |
| Population Density | World Population Density: Madagascar | World Pop Hub | 1 km | Static: 2018 & 2019 |
| World Population Density: Mozambique | ||||
| Mangrove Degradation (NDVI) | Sentinel 2 | ESA | 15 m | 2013–2022 |
| Sentinel 1 SAR—GRD | 5 × 20 m | 2017–2022 | ||
| Flooding Model | JRC—Global Surface Water Mapping Layers v1.3 | EC JRC | 30 m | 1981–2021 |
| SRTM DEM—void filled | ESA | 15 m | Static: 2015 | |
| CGLOPS Land Cover Classification | Copernicus ESA—VITO | 10 m | Static: 2020 |
| Region | Area Affected by Flood (ha) | Relative Area Flooded (%) | Number of Exposed Population | Relative Exposed Population (%) | Affected Urban Areas (ha) | Relative Affected Urban Areas (%) | |
|---|---|---|---|---|---|---|---|
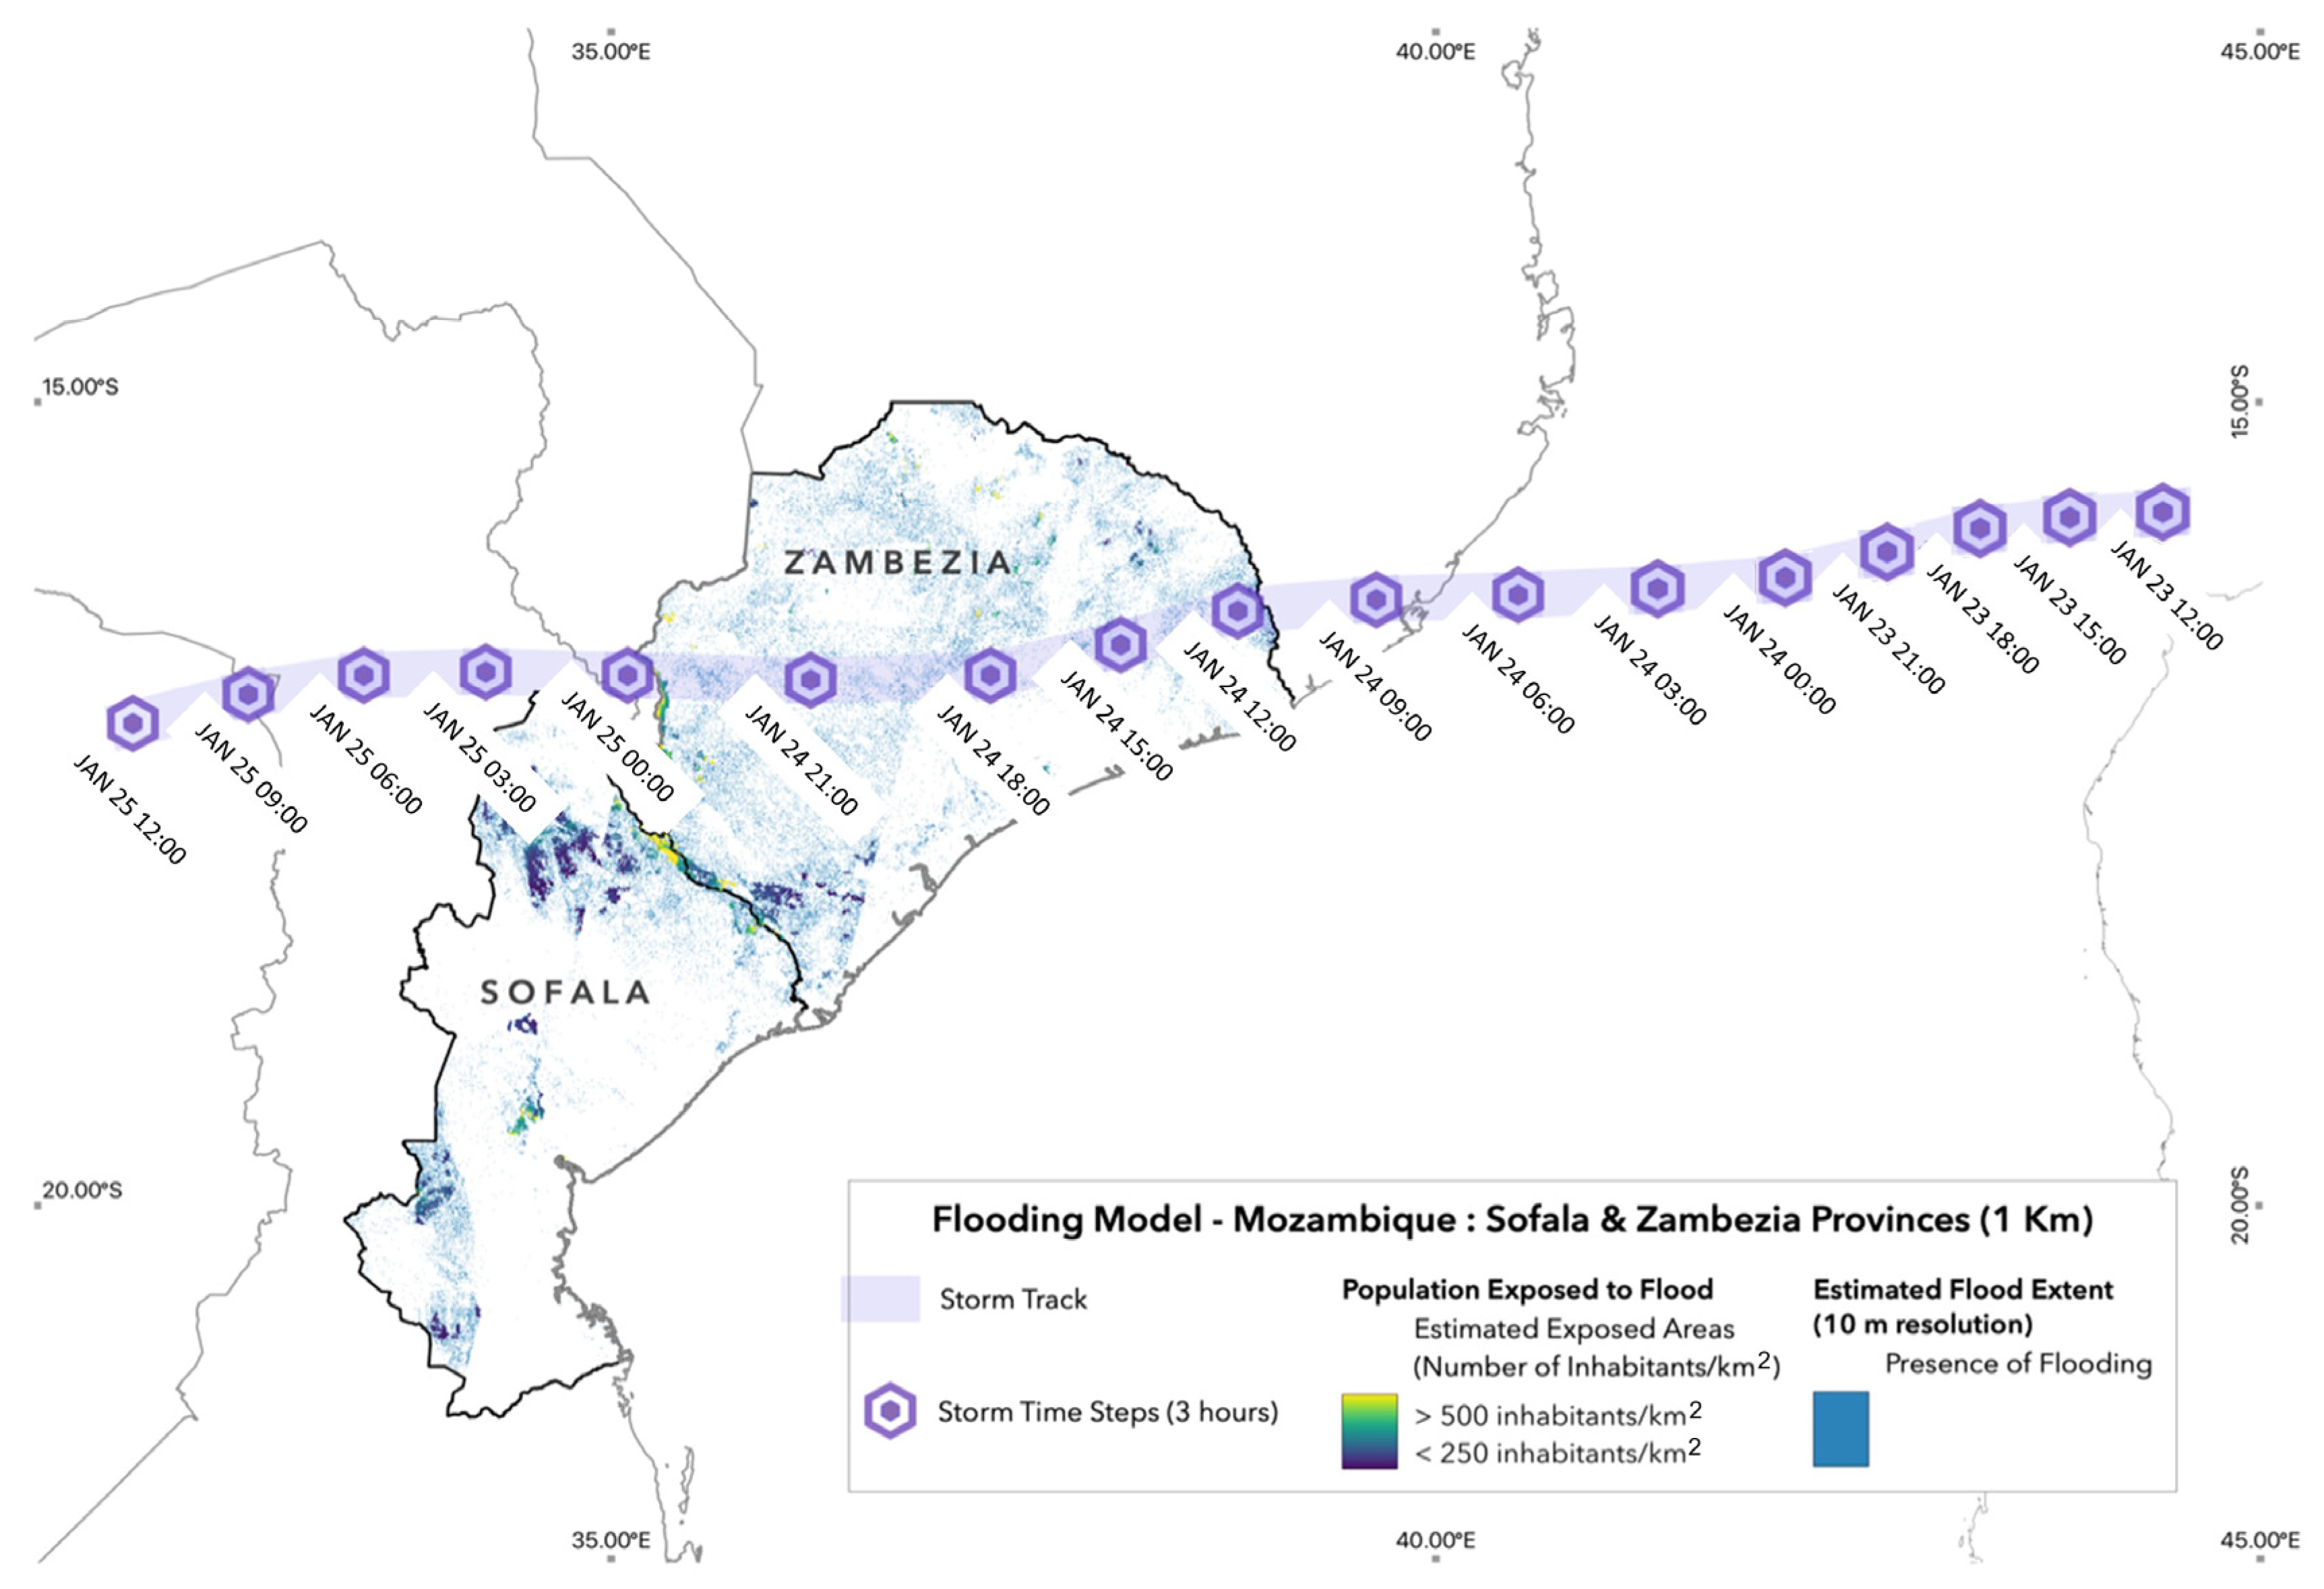
| Mozambique | Zambezia | 595,872 | 5.78% | 87,577 | 1.71% | 6741 | 1.13% |
| Sofala | 456,120 | 6.71% | 108,400 | 4.80% | 7860 | 1.72% | |
| Madagascar | Boeny | 451,731 | 14.55% | 66,591 | 7.15% | 4042 | 0.89% |
| Melaky | 254,984 | 6.56% | 12,412 | 4.01% | 767 | 0.30% |
Disclaimer/Publisher’s Note: The statements, opinions and data contained in all publications are solely those of the individual author(s) and contributor(s) and not of MDPI and/or the editor(s). MDPI and/or the editor(s) disclaim responsibility for any injury to people or property resulting from any ideas, methods, instructions or products referred to in the content. |
© 2023 by the authors. Licensee MDPI, Basel, Switzerland. This article is an open access article distributed under the terms and conditions of the Creative Commons Attribution (CC BY) license (https://creativecommons.org/licenses/by/4.0/).
Share and Cite
Singh, M.; Schoenmakers, E. Comparative Impact Analysis of Cyclone Ana in the Mozambique Channel Using Satellite Data. Appl. Sci. 2023, 13, 4519. https://doi.org/10.3390/app13074519
Singh M, Schoenmakers E. Comparative Impact Analysis of Cyclone Ana in the Mozambique Channel Using Satellite Data. Applied Sciences. 2023; 13(7):4519. https://doi.org/10.3390/app13074519
Chicago/Turabian StyleSingh, Minerva, and Emma Schoenmakers. 2023. "Comparative Impact Analysis of Cyclone Ana in the Mozambique Channel Using Satellite Data" Applied Sciences 13, no. 7: 4519. https://doi.org/10.3390/app13074519
APA StyleSingh, M., & Schoenmakers, E. (2023). Comparative Impact Analysis of Cyclone Ana in the Mozambique Channel Using Satellite Data. Applied Sciences, 13(7), 4519. https://doi.org/10.3390/app13074519