


Elevation Angle Characterization for LEO Satellites: First and Second Order Statistics
 ,
,  , and
, and
Abstract
1. Introduction
1.1. Contributions
1.1.1. Contribution 1
1.1.2. Contribution 2
1.1.3. Contribution 3
1.2. Outline
2. Materials and Methods
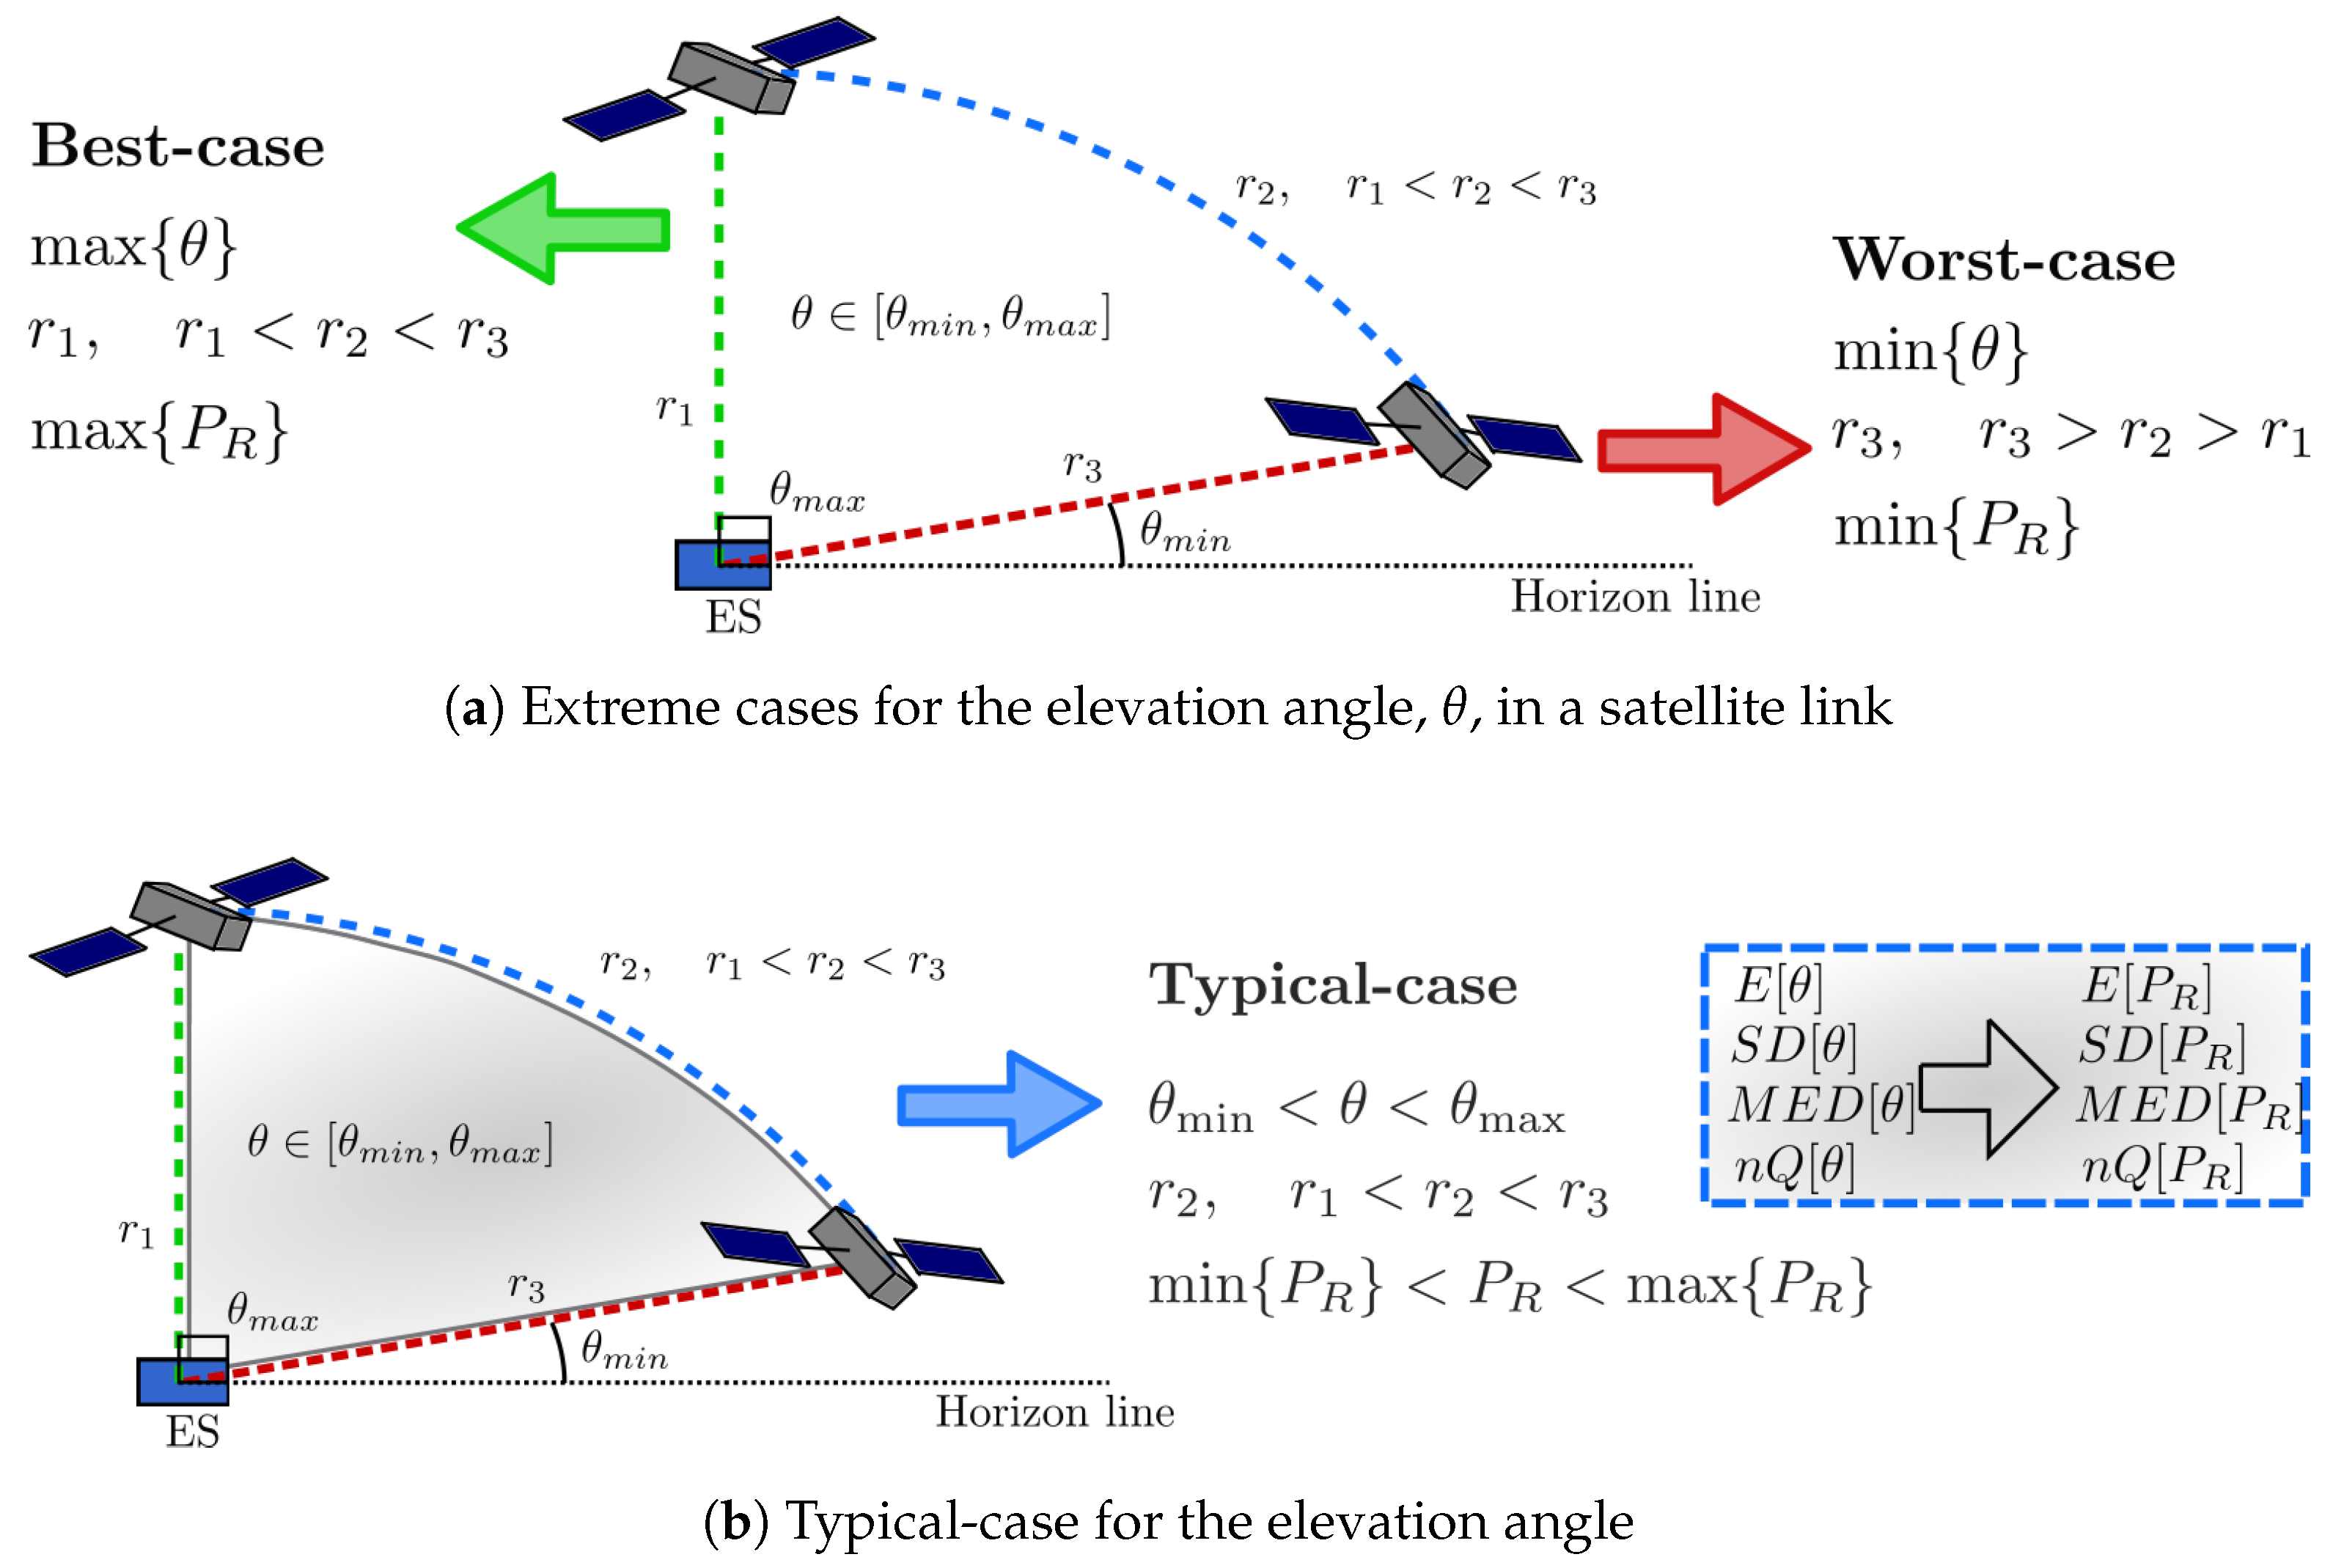
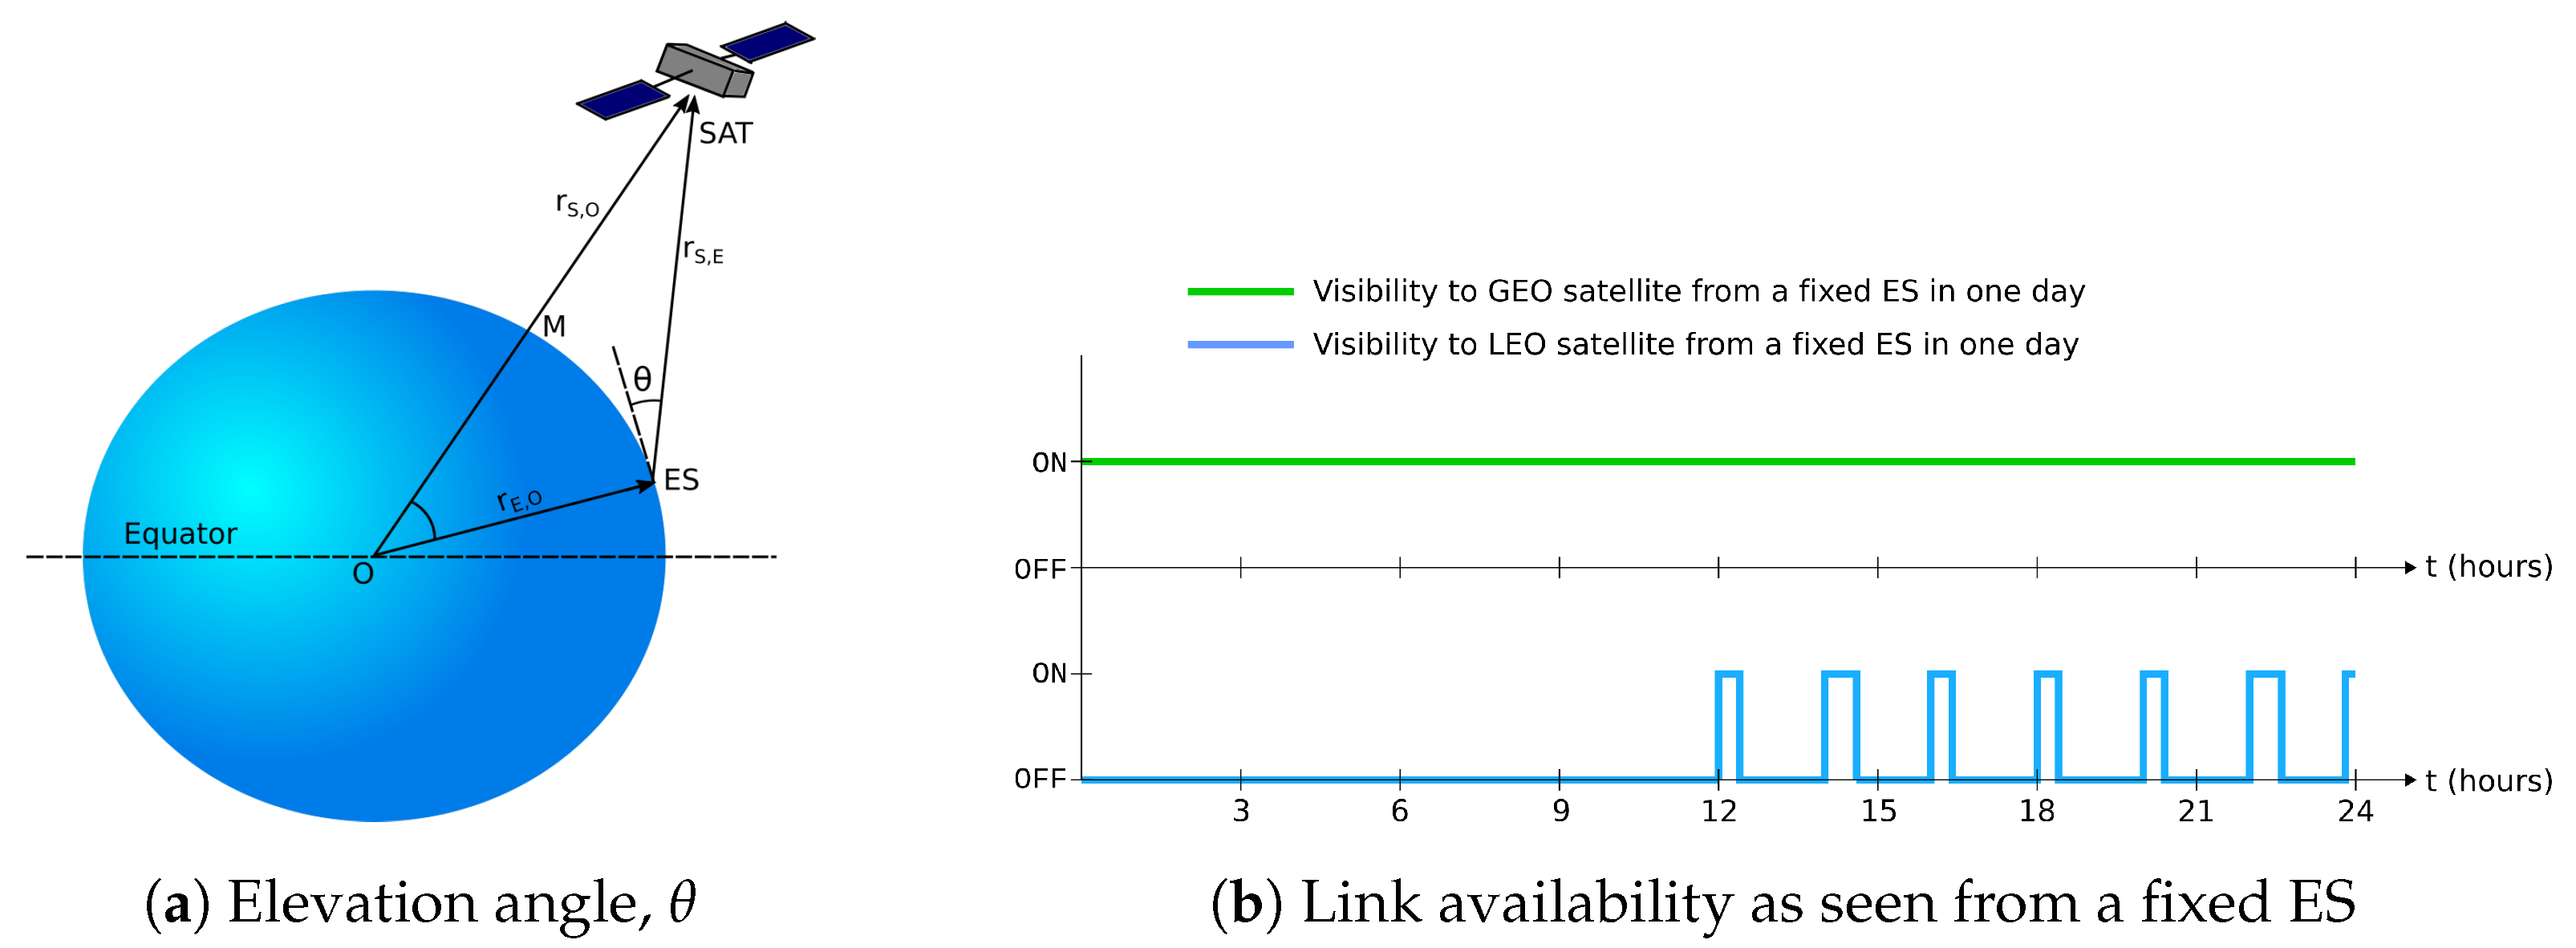
2.1. Elevation Angle Definition
2.2. Relevance of the Elevation Angle for the Satellite Channel
2.3. Analytical Characterization of the Elevation Angle
3. Methodology for the Elevation Angle Characterization
3.1. Simulations Configuration
3.2. Elevation Angle Time Series Analysis
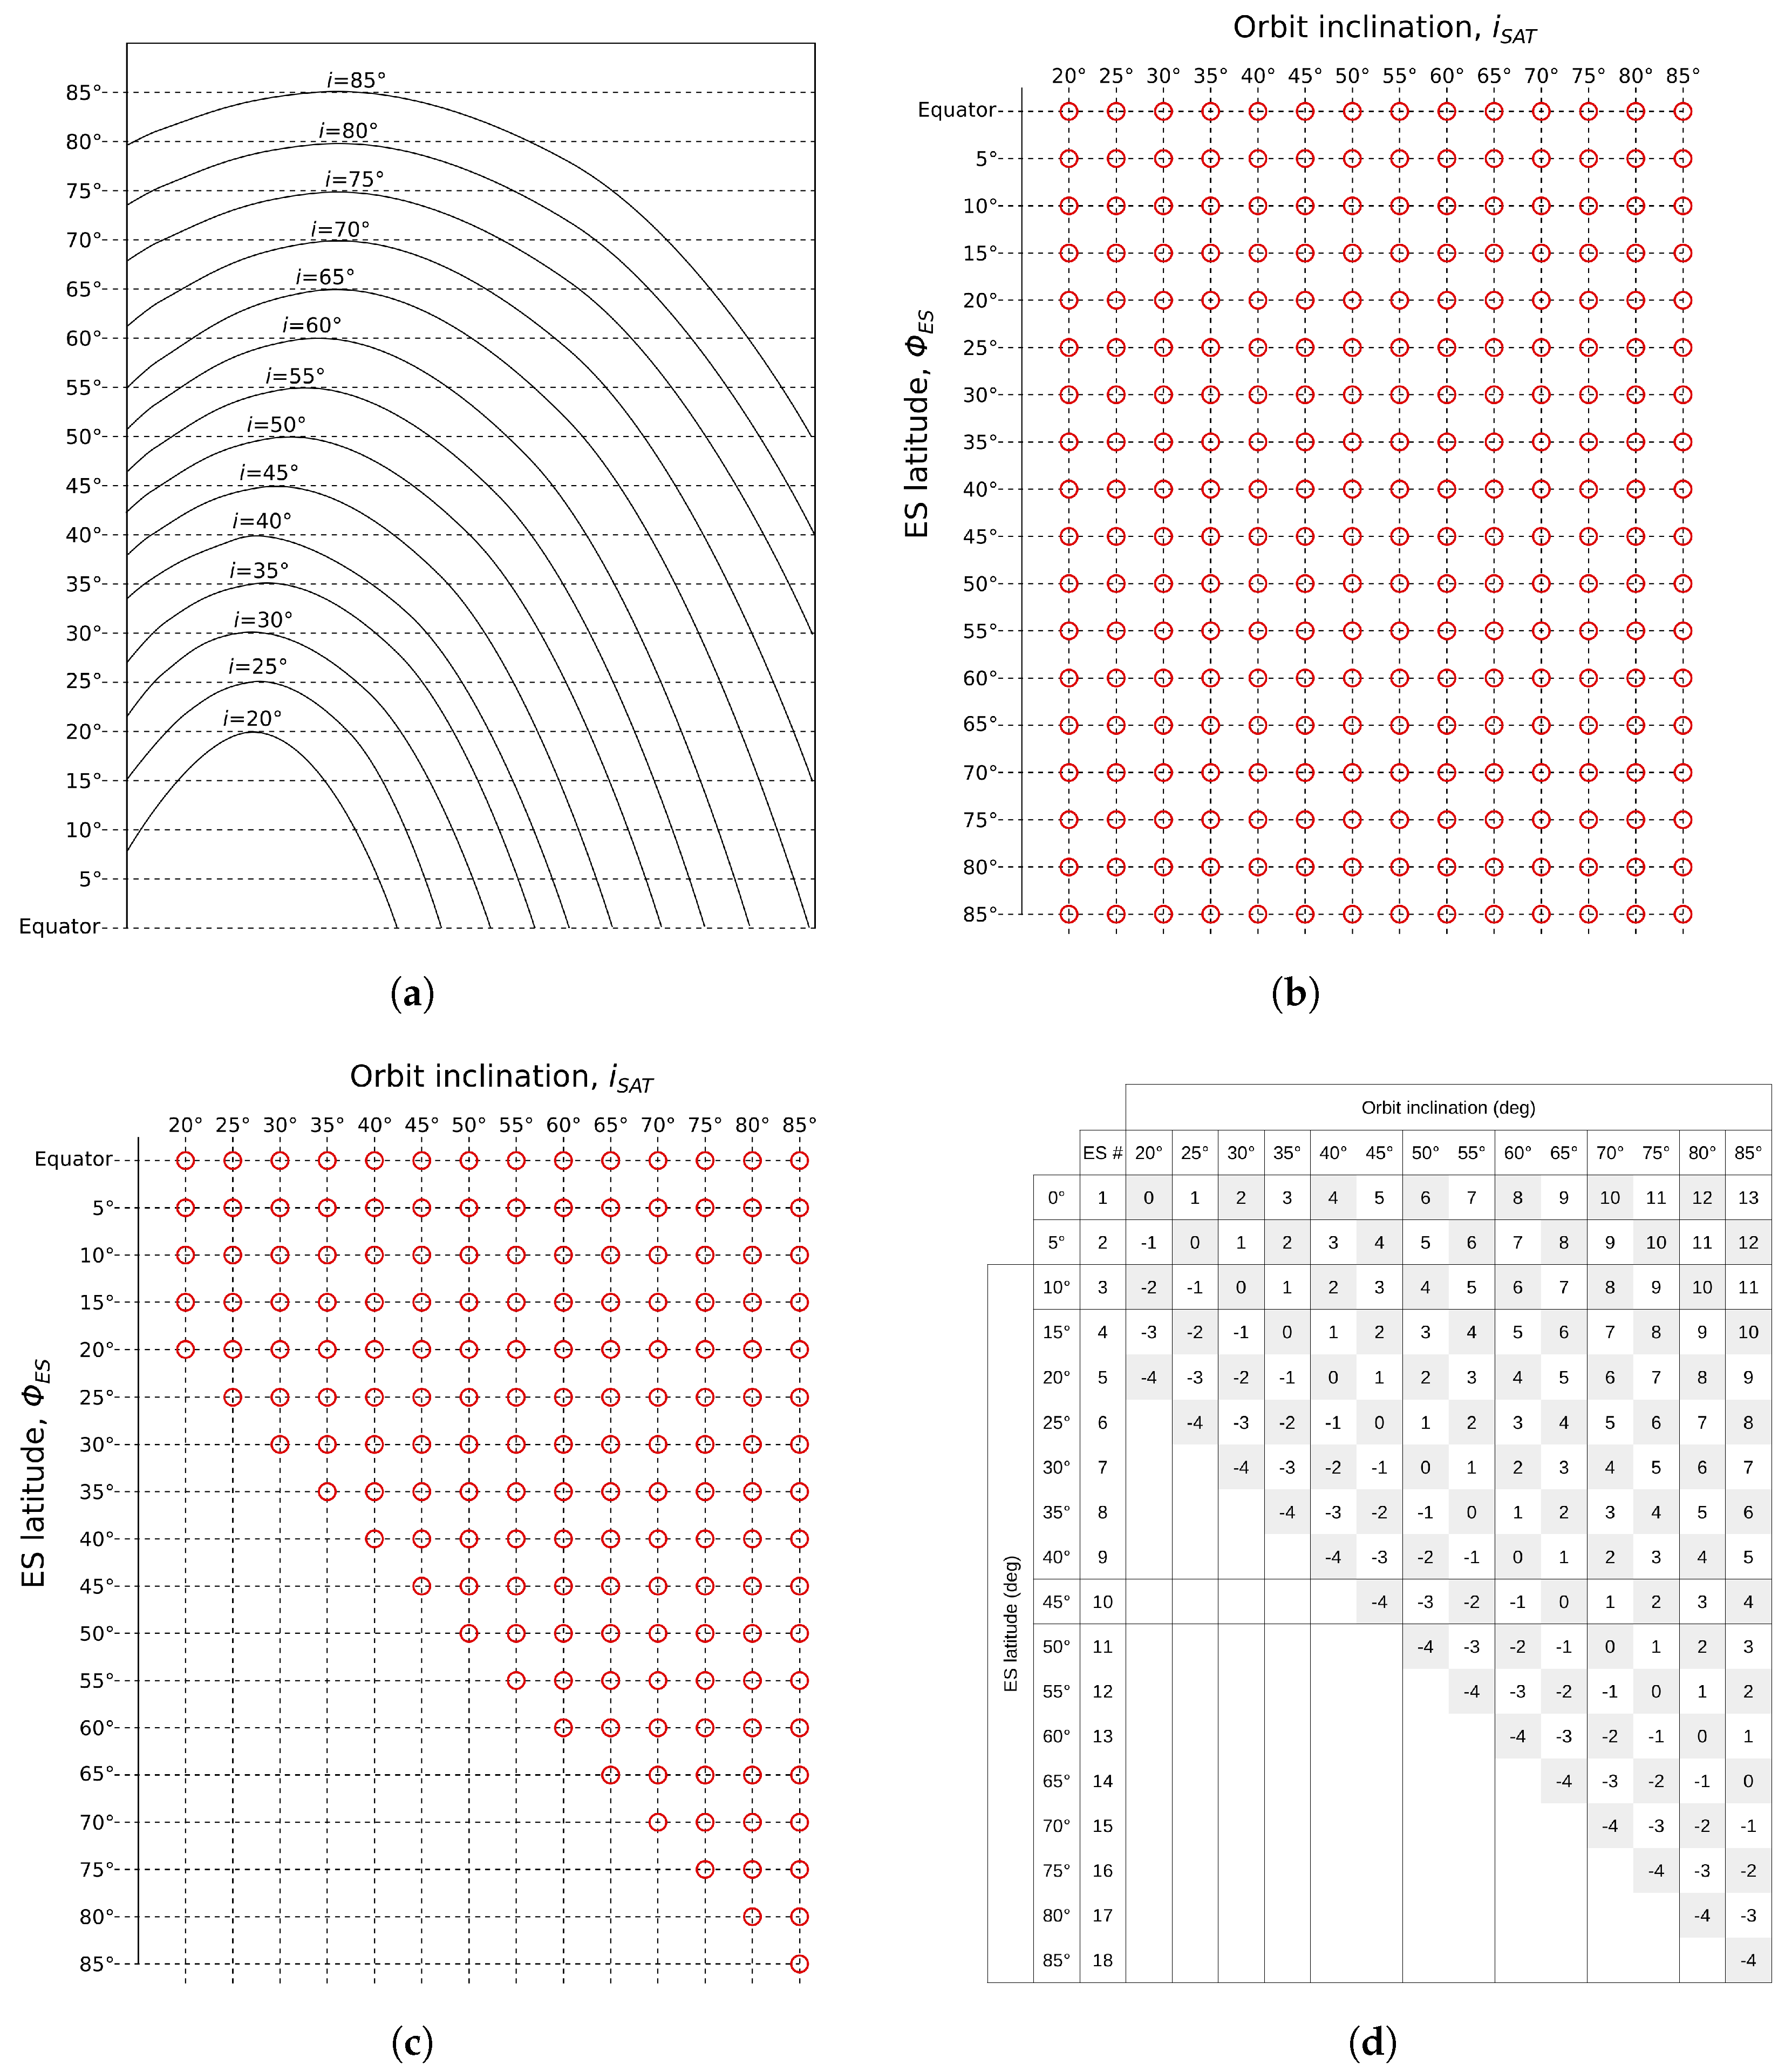
3.3. Orbit Coverage
3.4. Reducing the Shape and Rate Matrices
3.5. PDF and CDF of the Elevation Angle
- Case 1.
- Case 2.
- Case 3.
- Case 4.
- Case 5.
- Case 6.
- Case 7.
- Case 8.
3.6. First and Second Order Statistics of
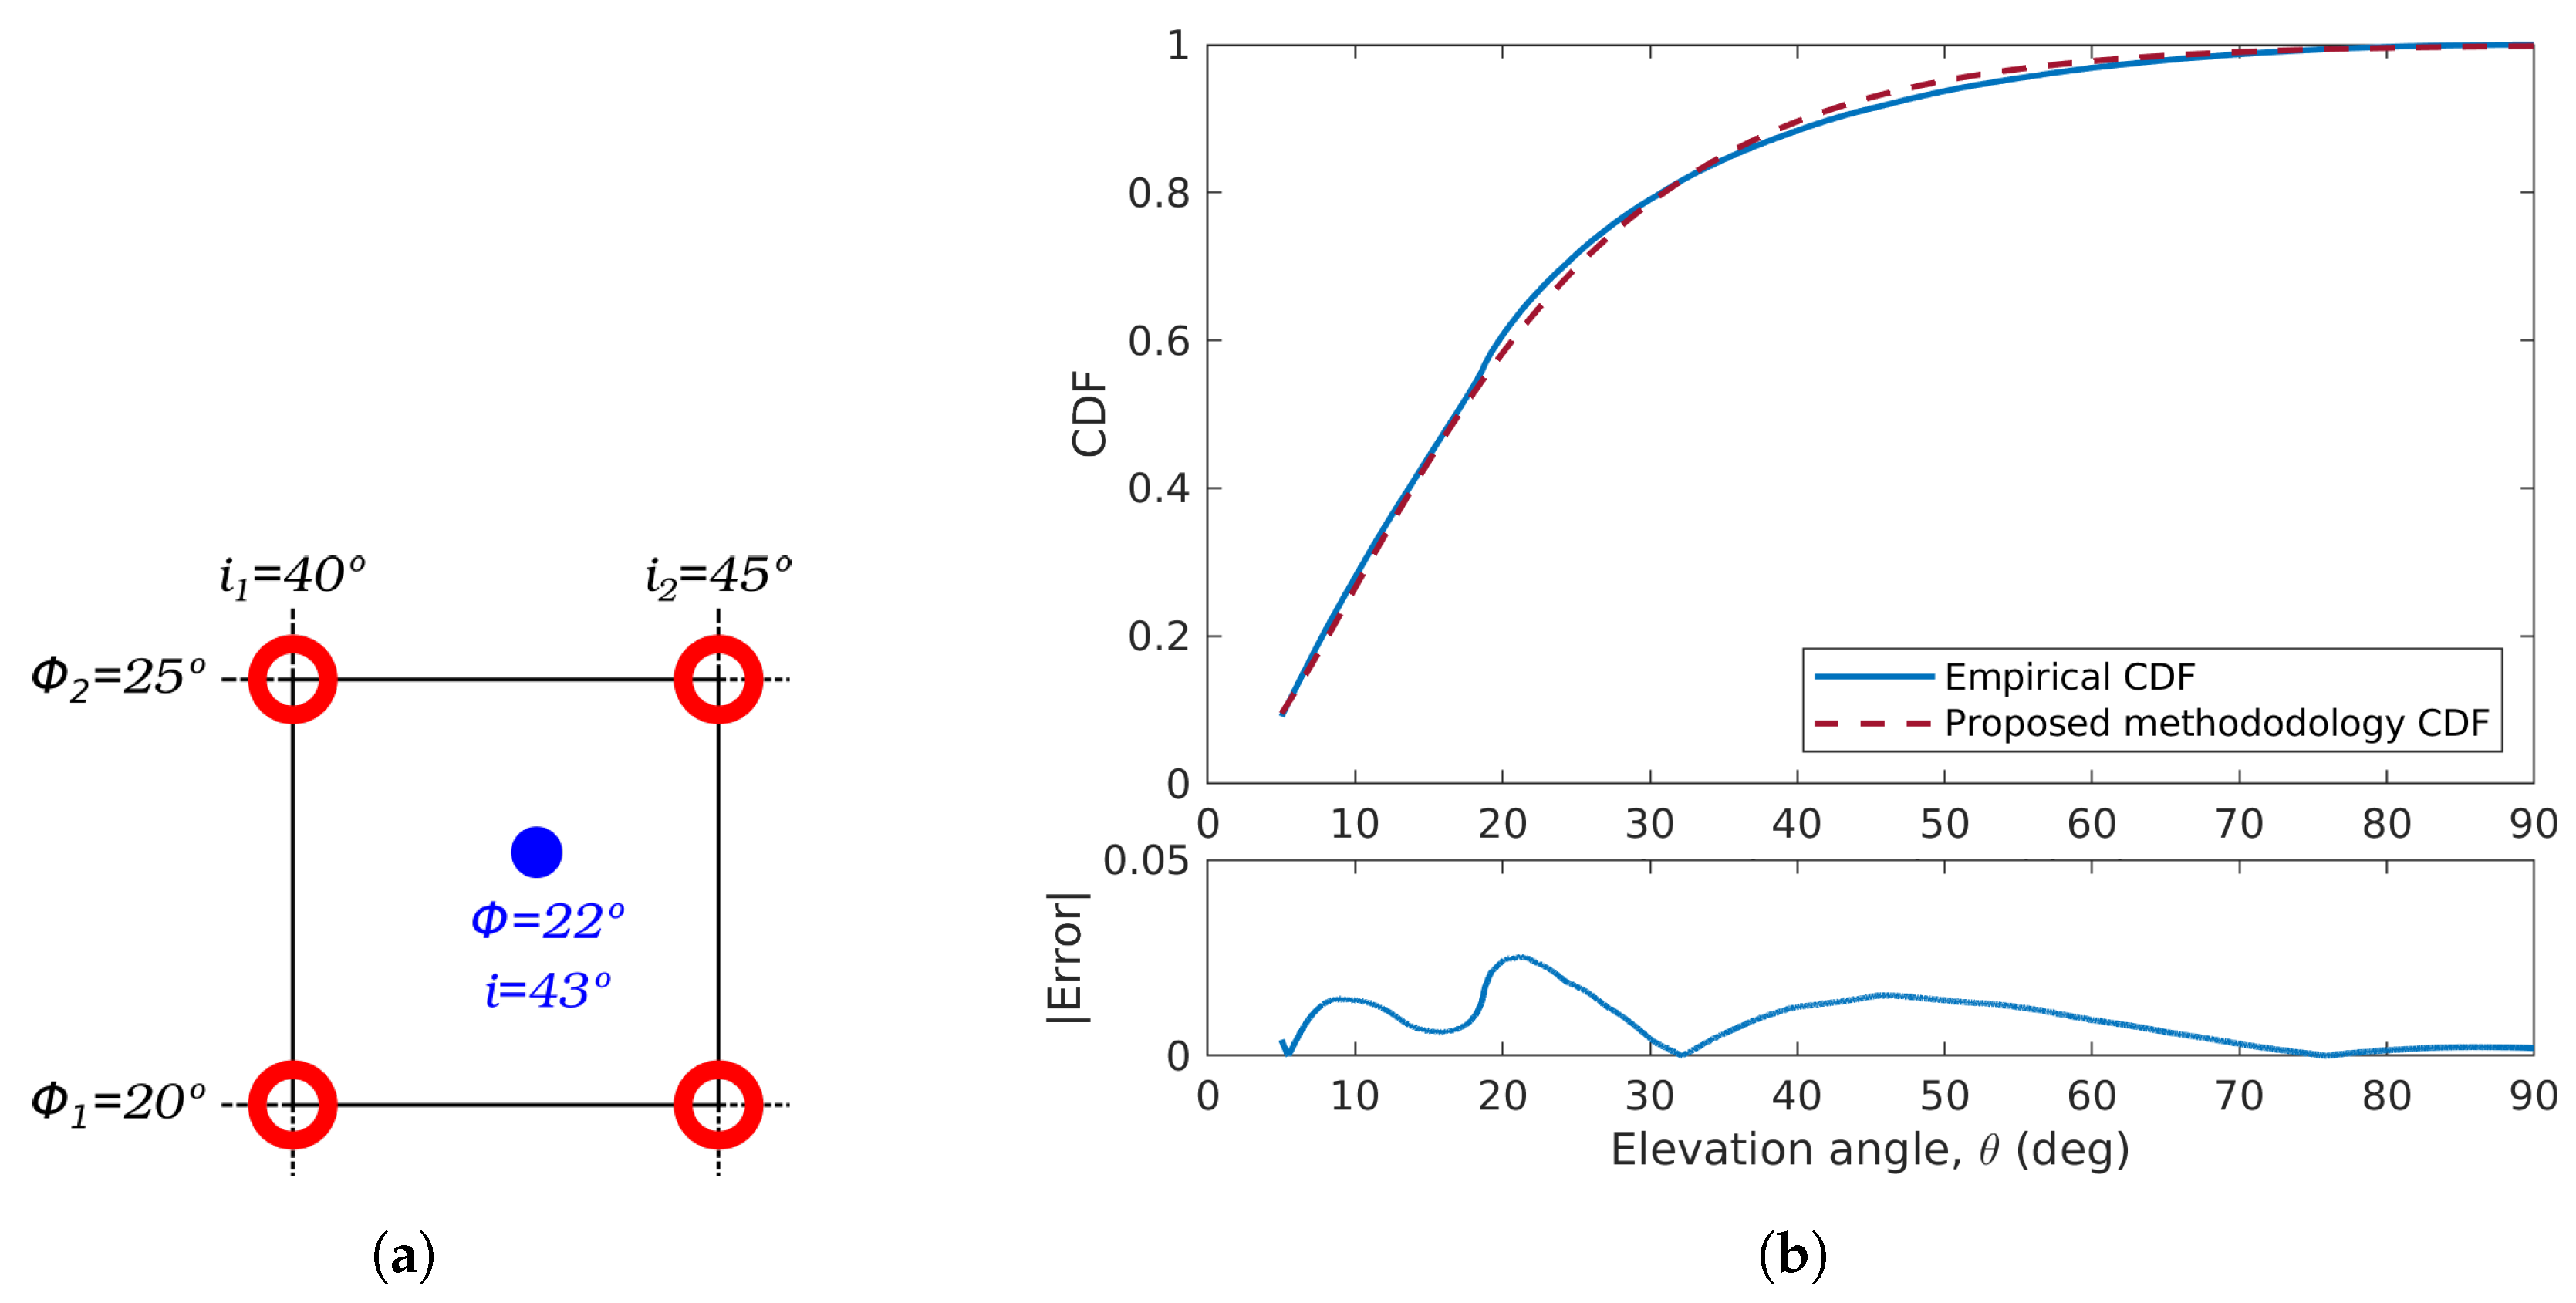
3.7. Choosing Orbits to Maximize Mean Value of
Reduction of the Elements in the Diagonals
4. Results
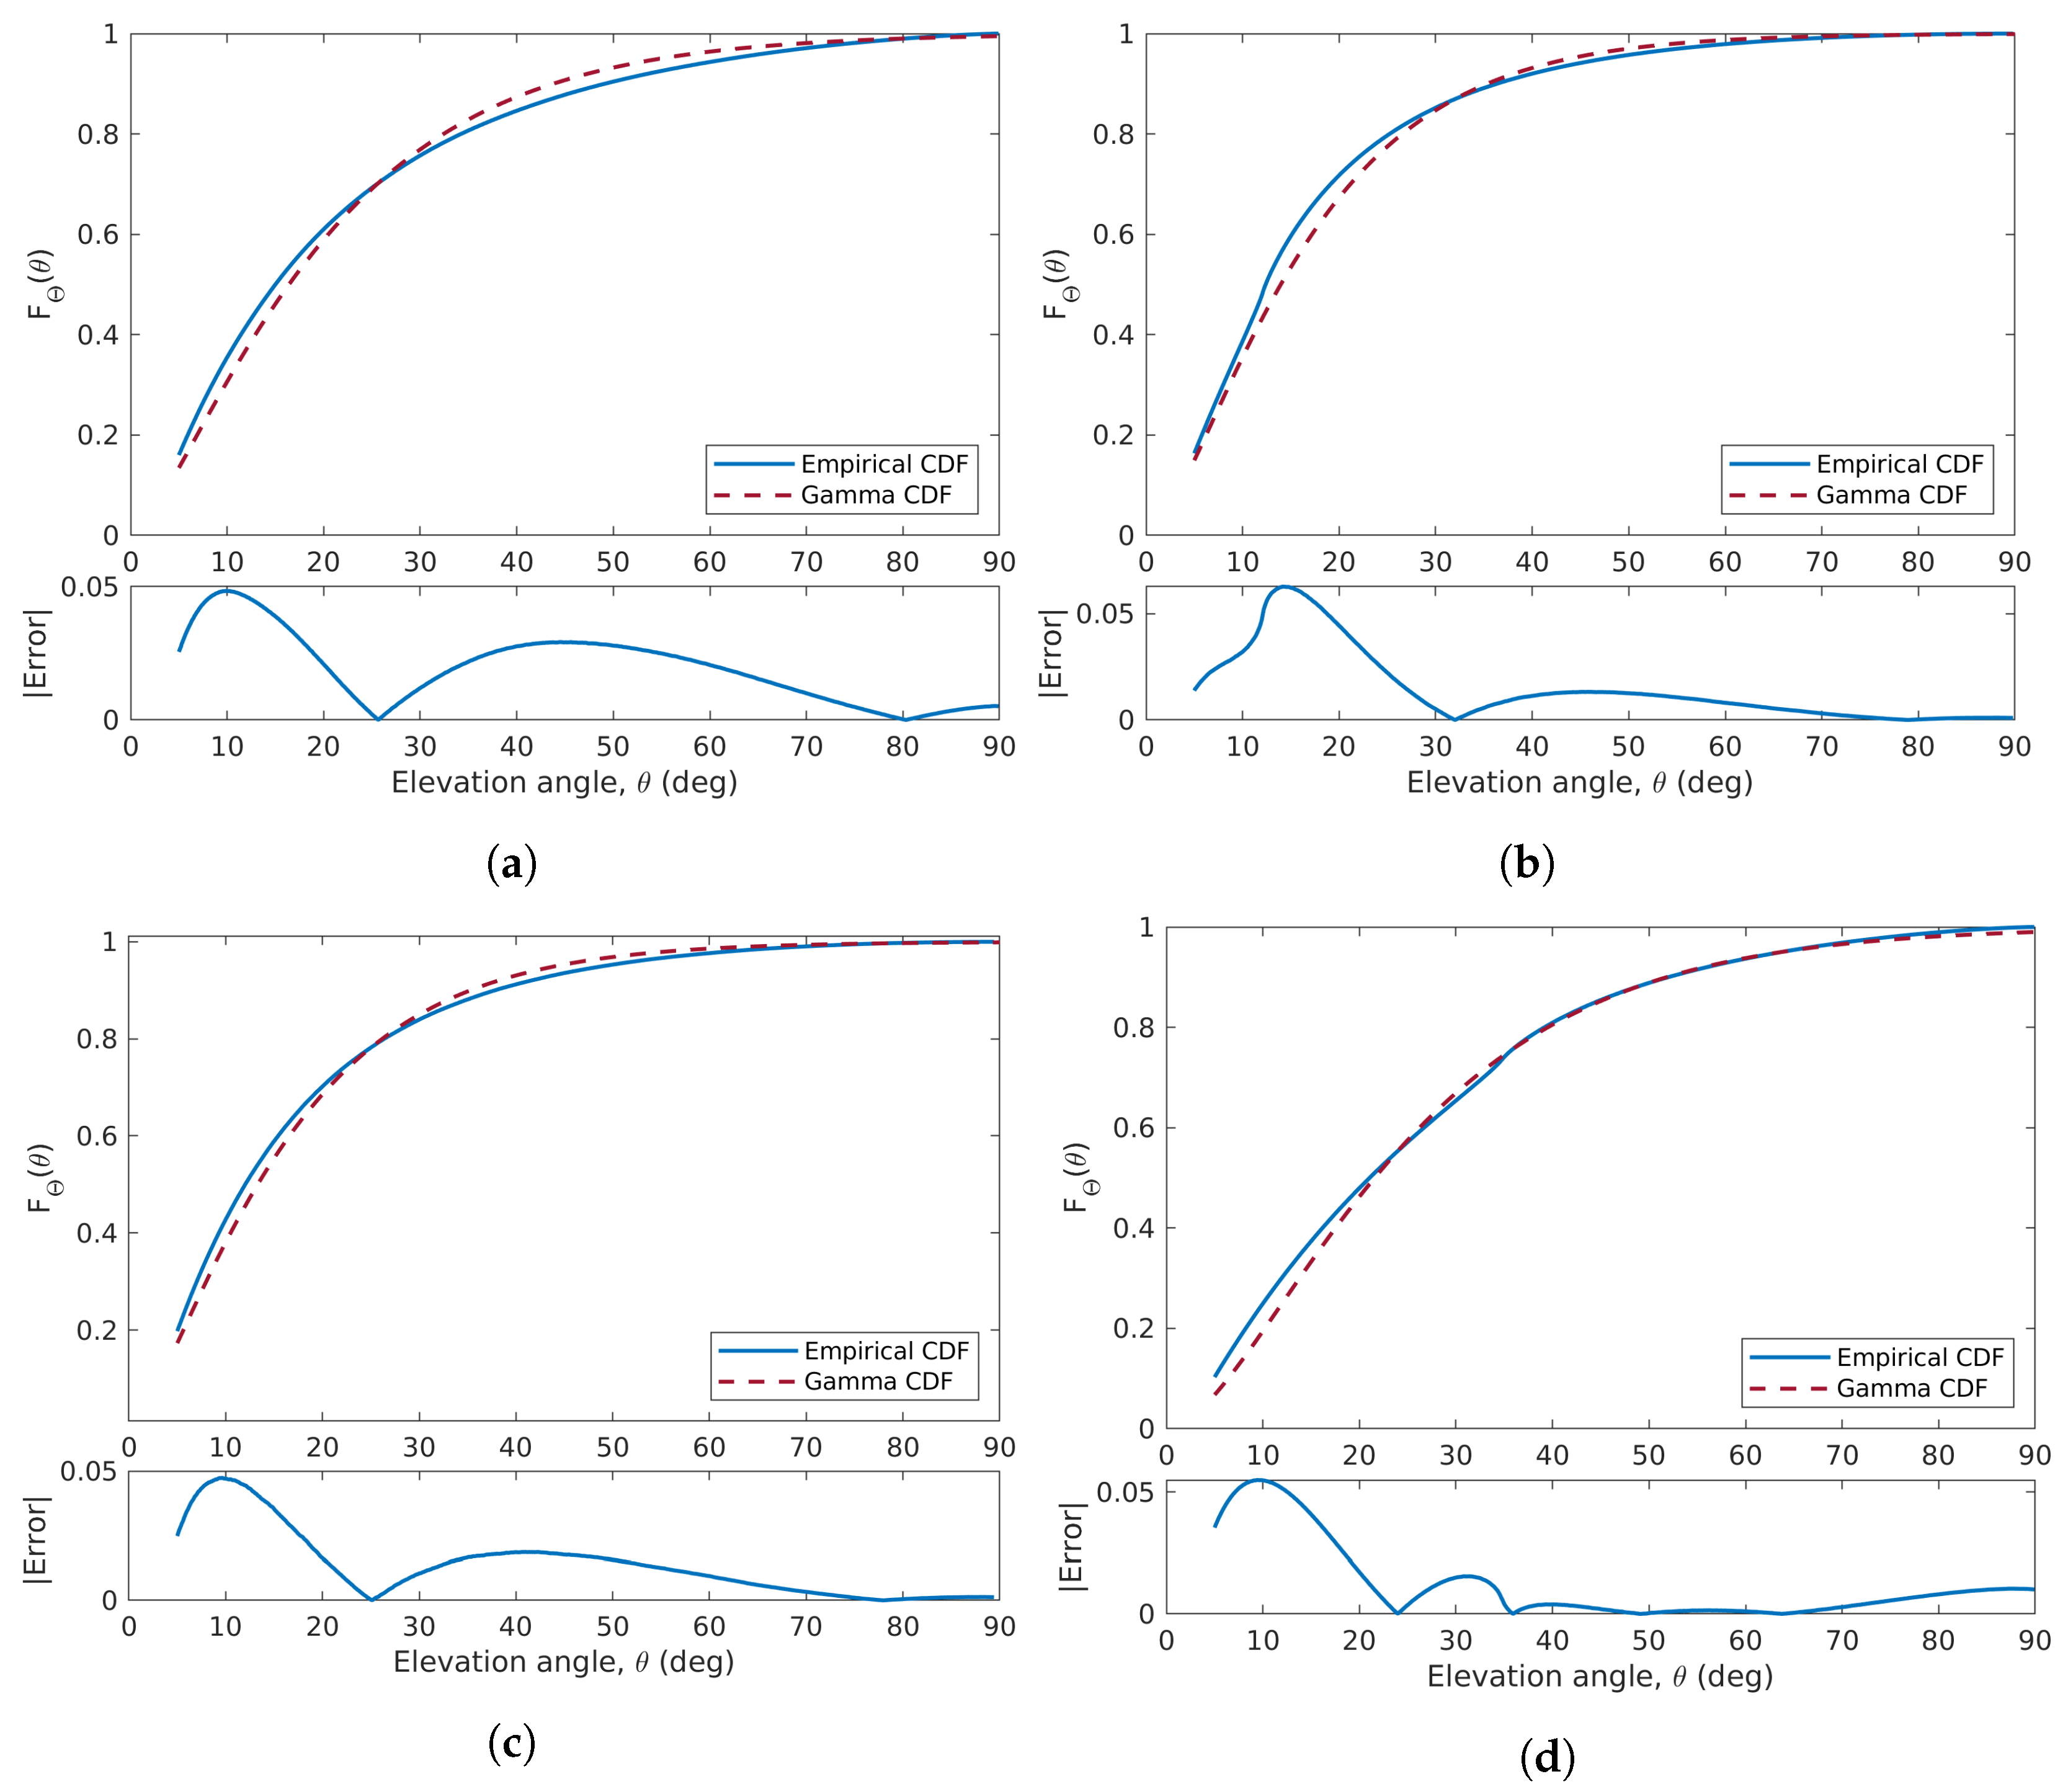
4.1. Results Validity
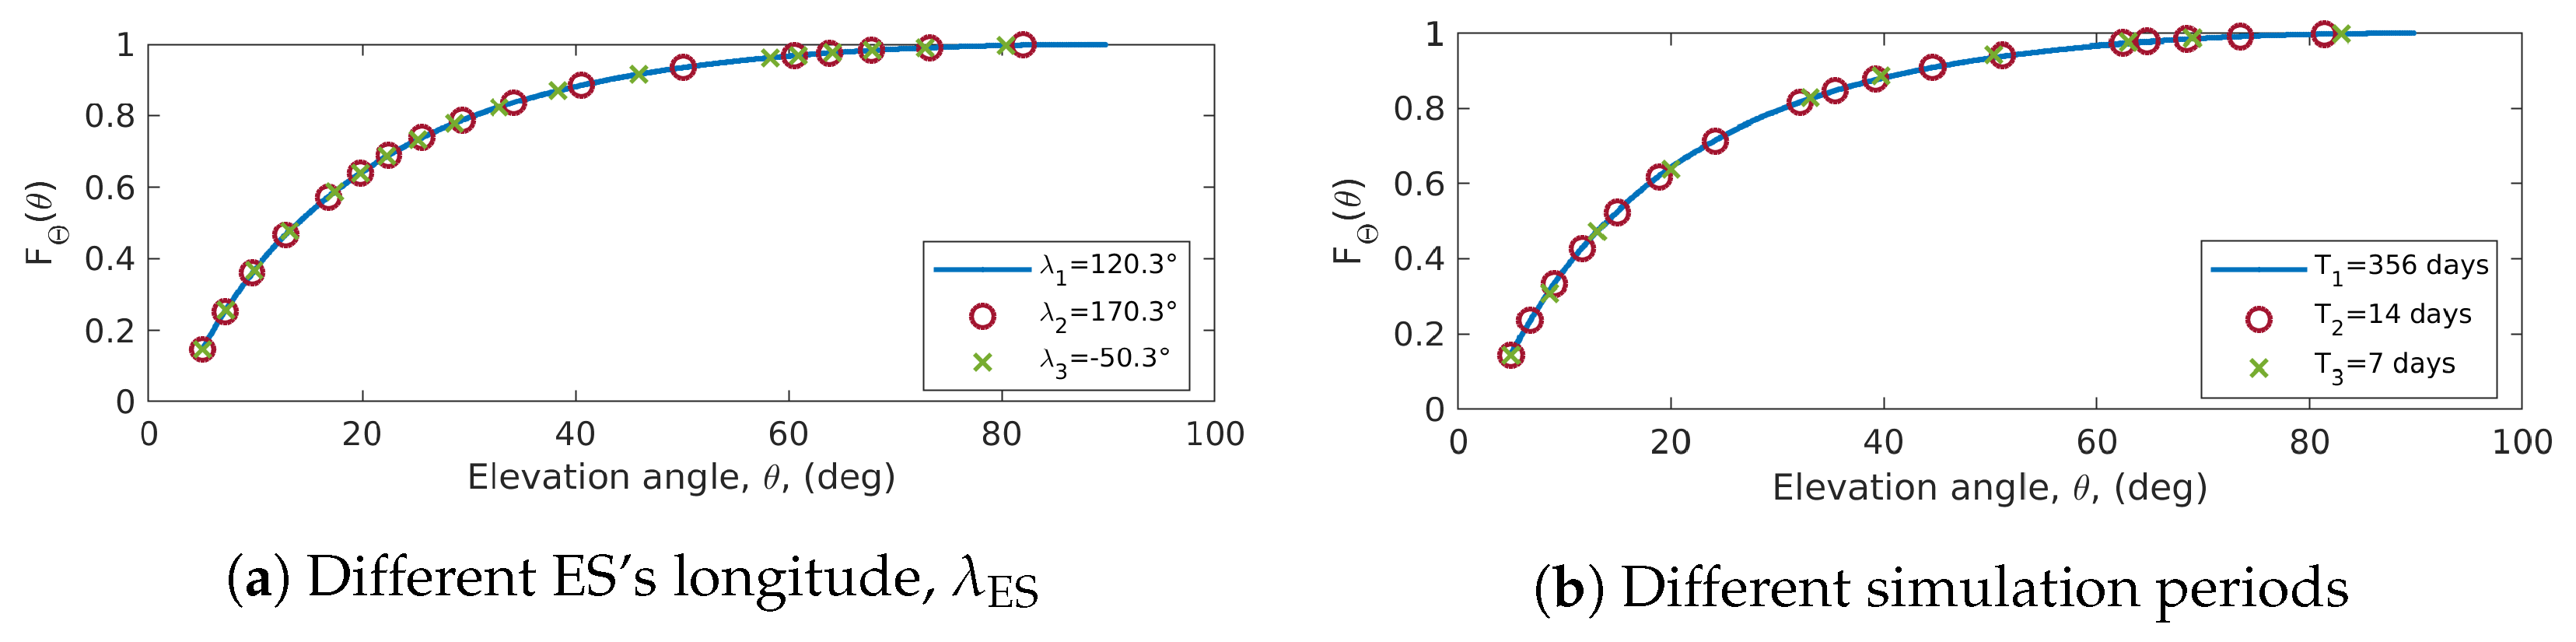
4.1.1. Effects of the Orbit Configuration in the Elevation Angle Distribution
4.1.2. Elevation Angle CDF for Different Longitudes
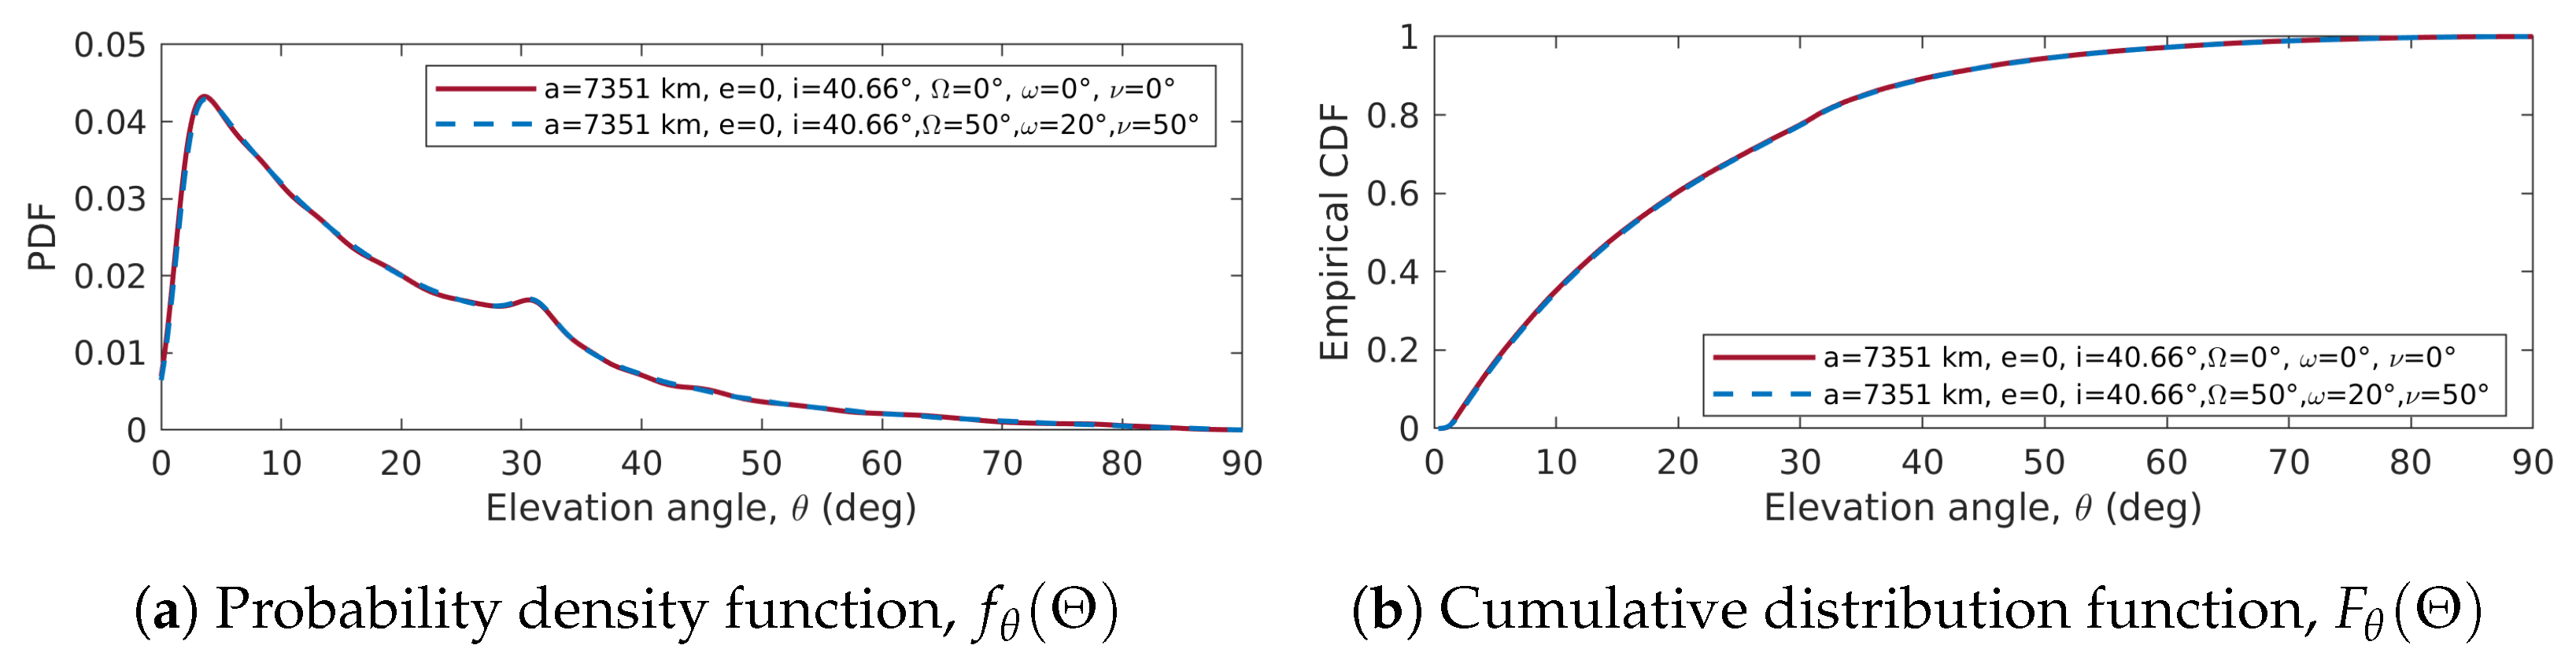
4.1.3. Long Term Validity of and
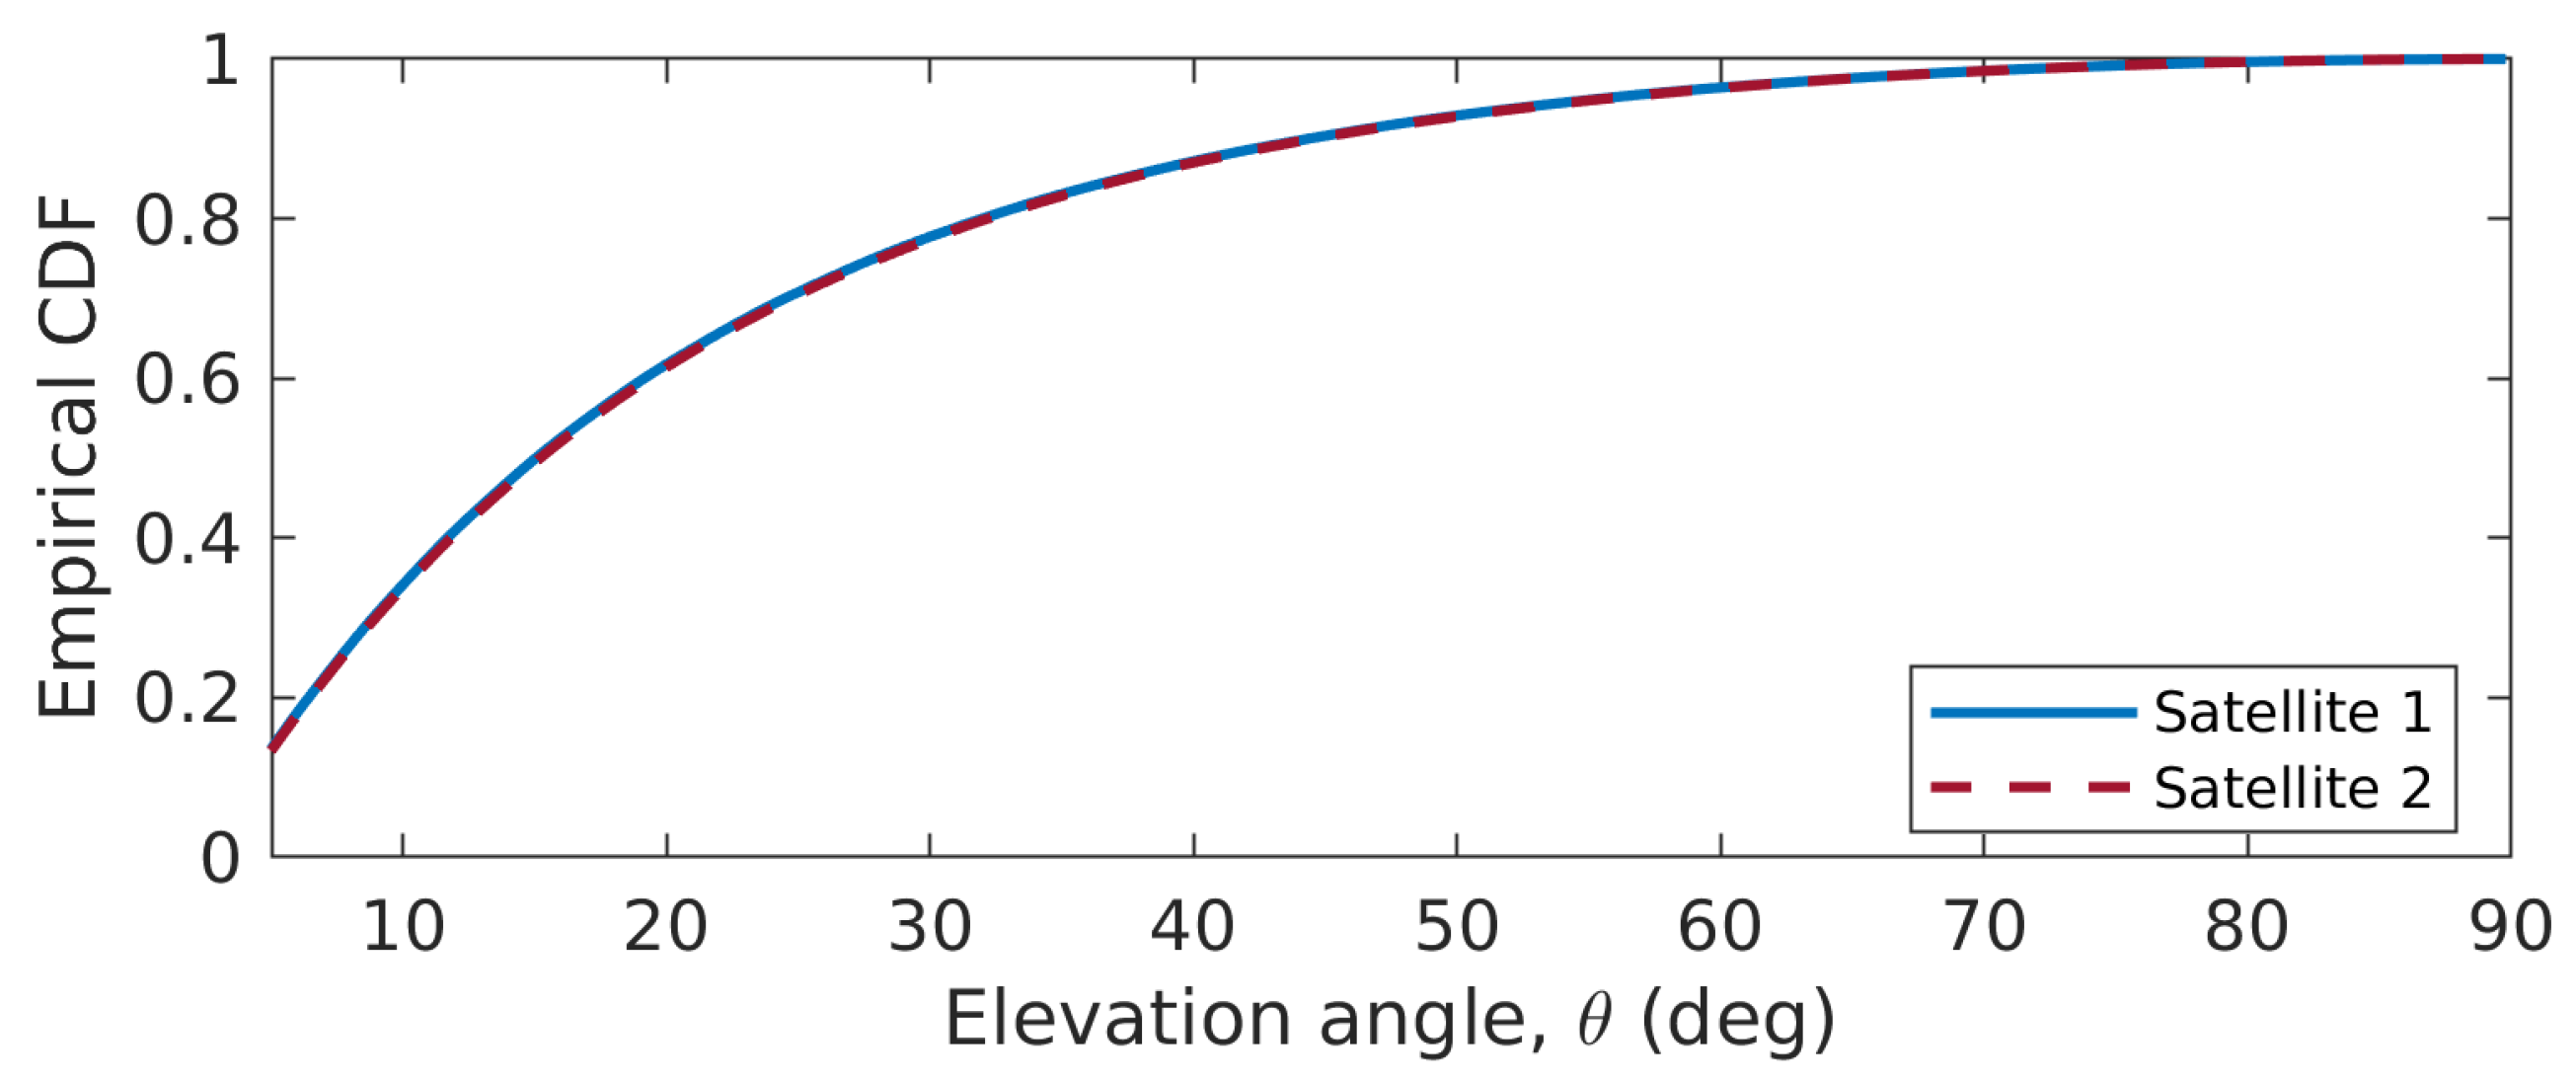
4.1.4. Elevation Angle CDF for Different Satellite Characteristics
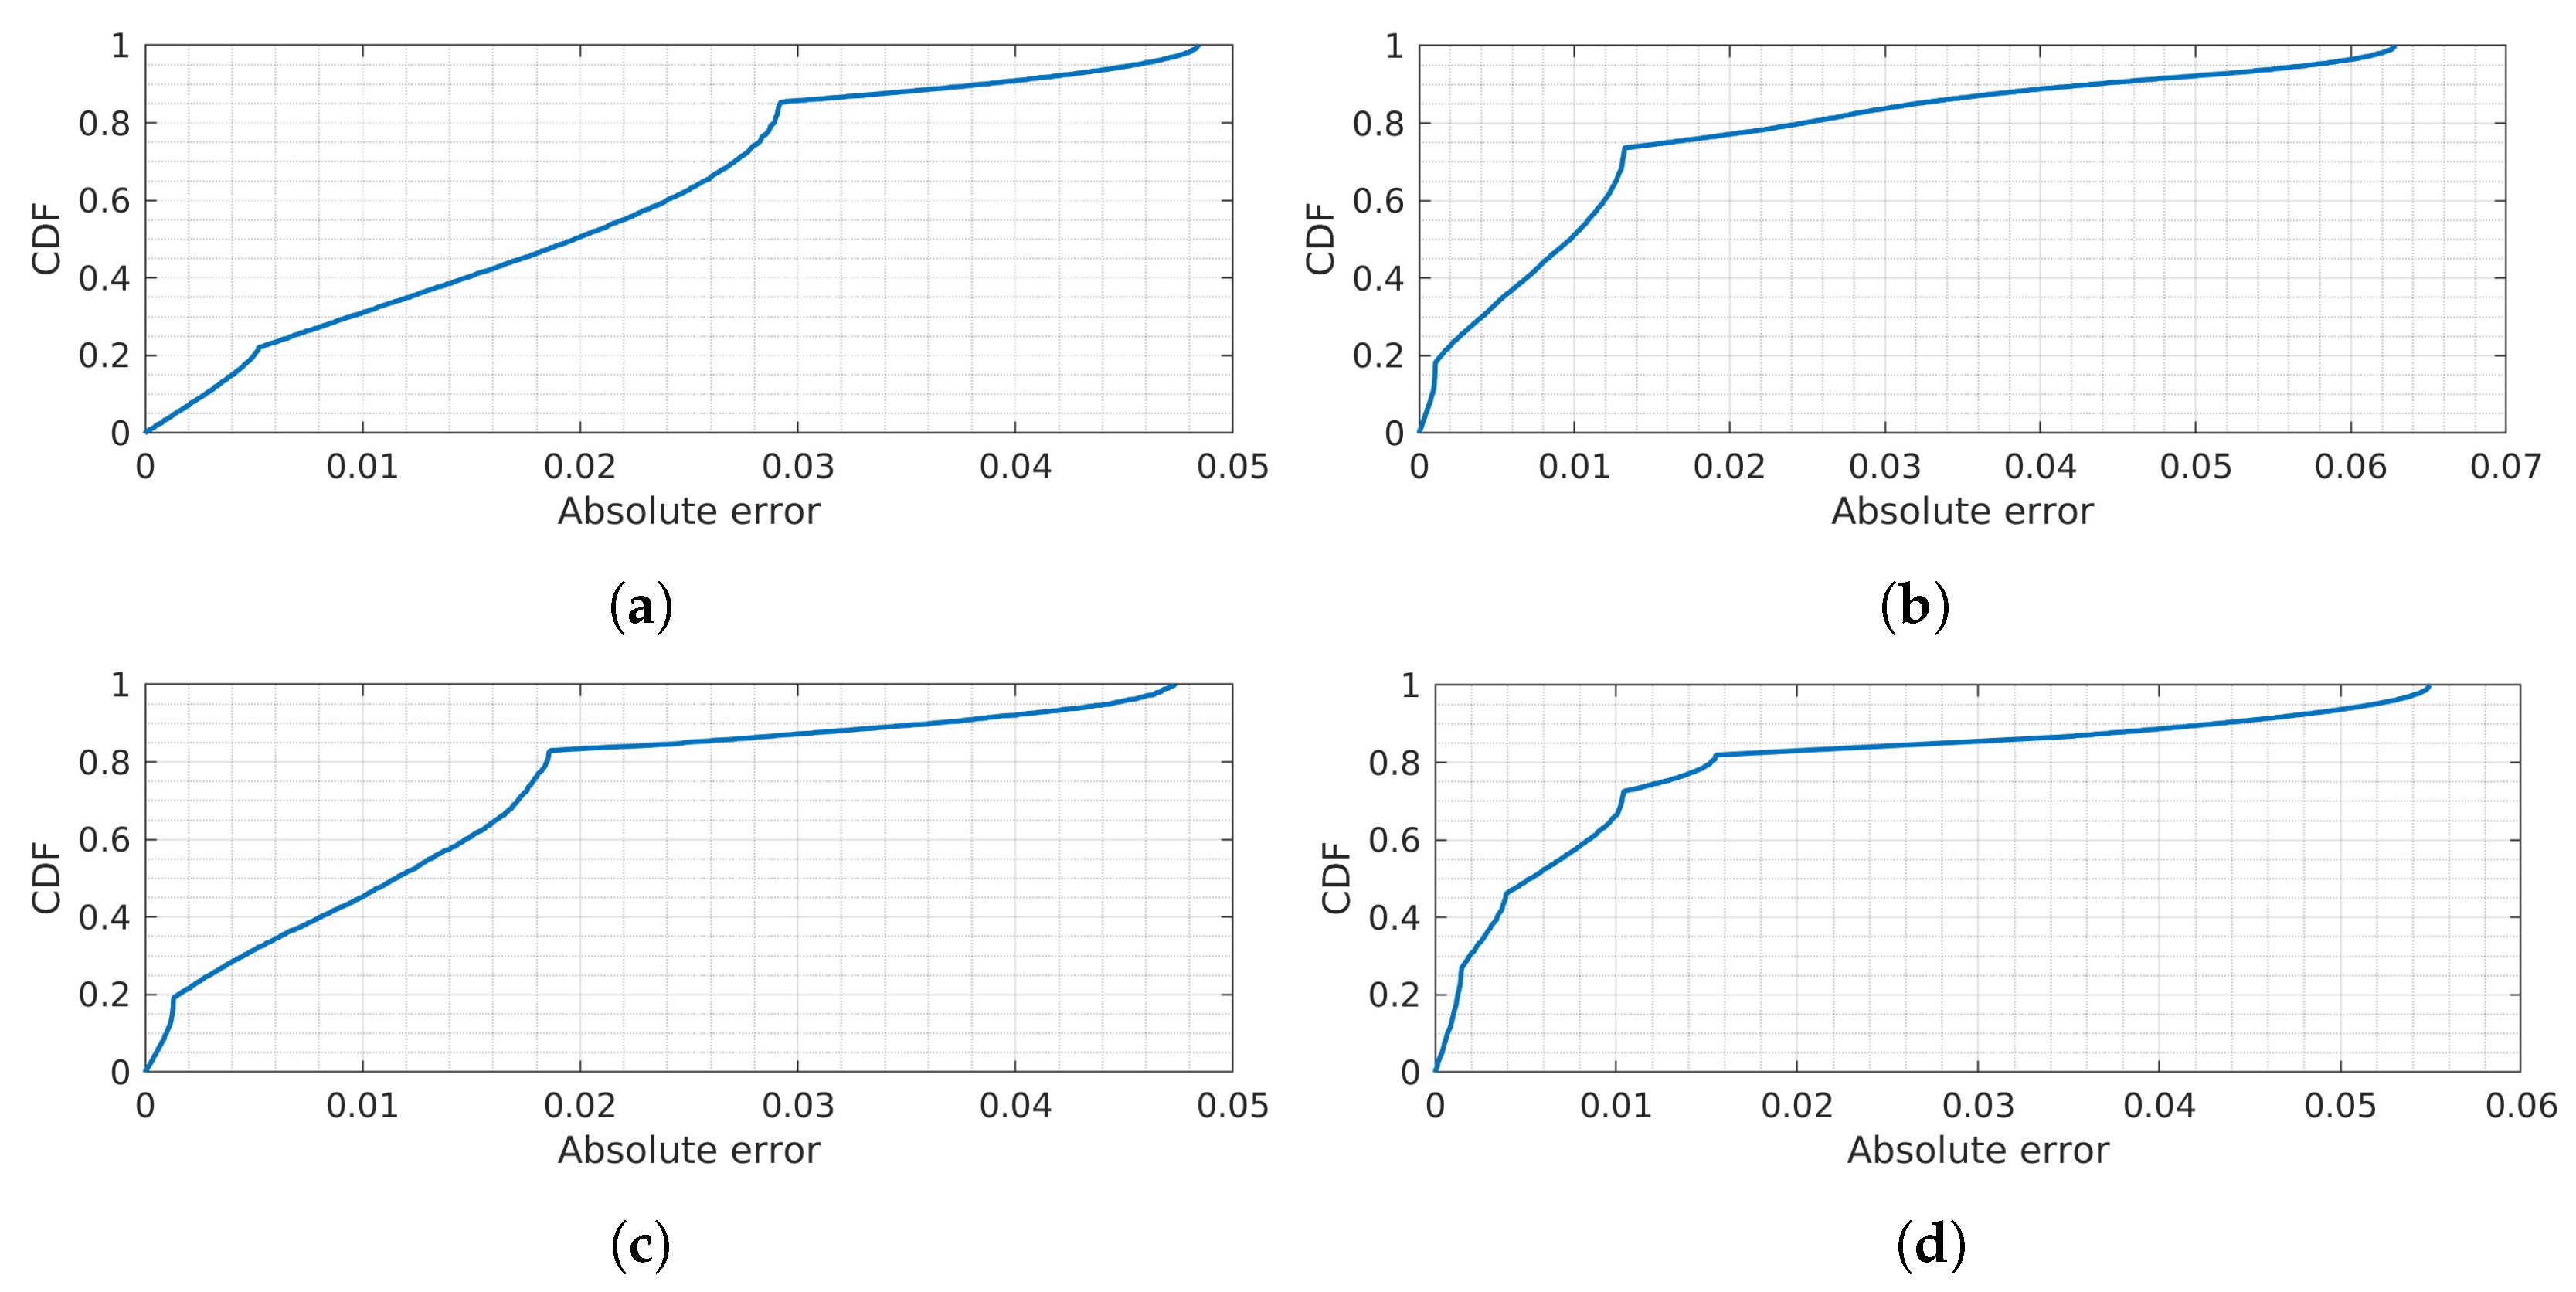
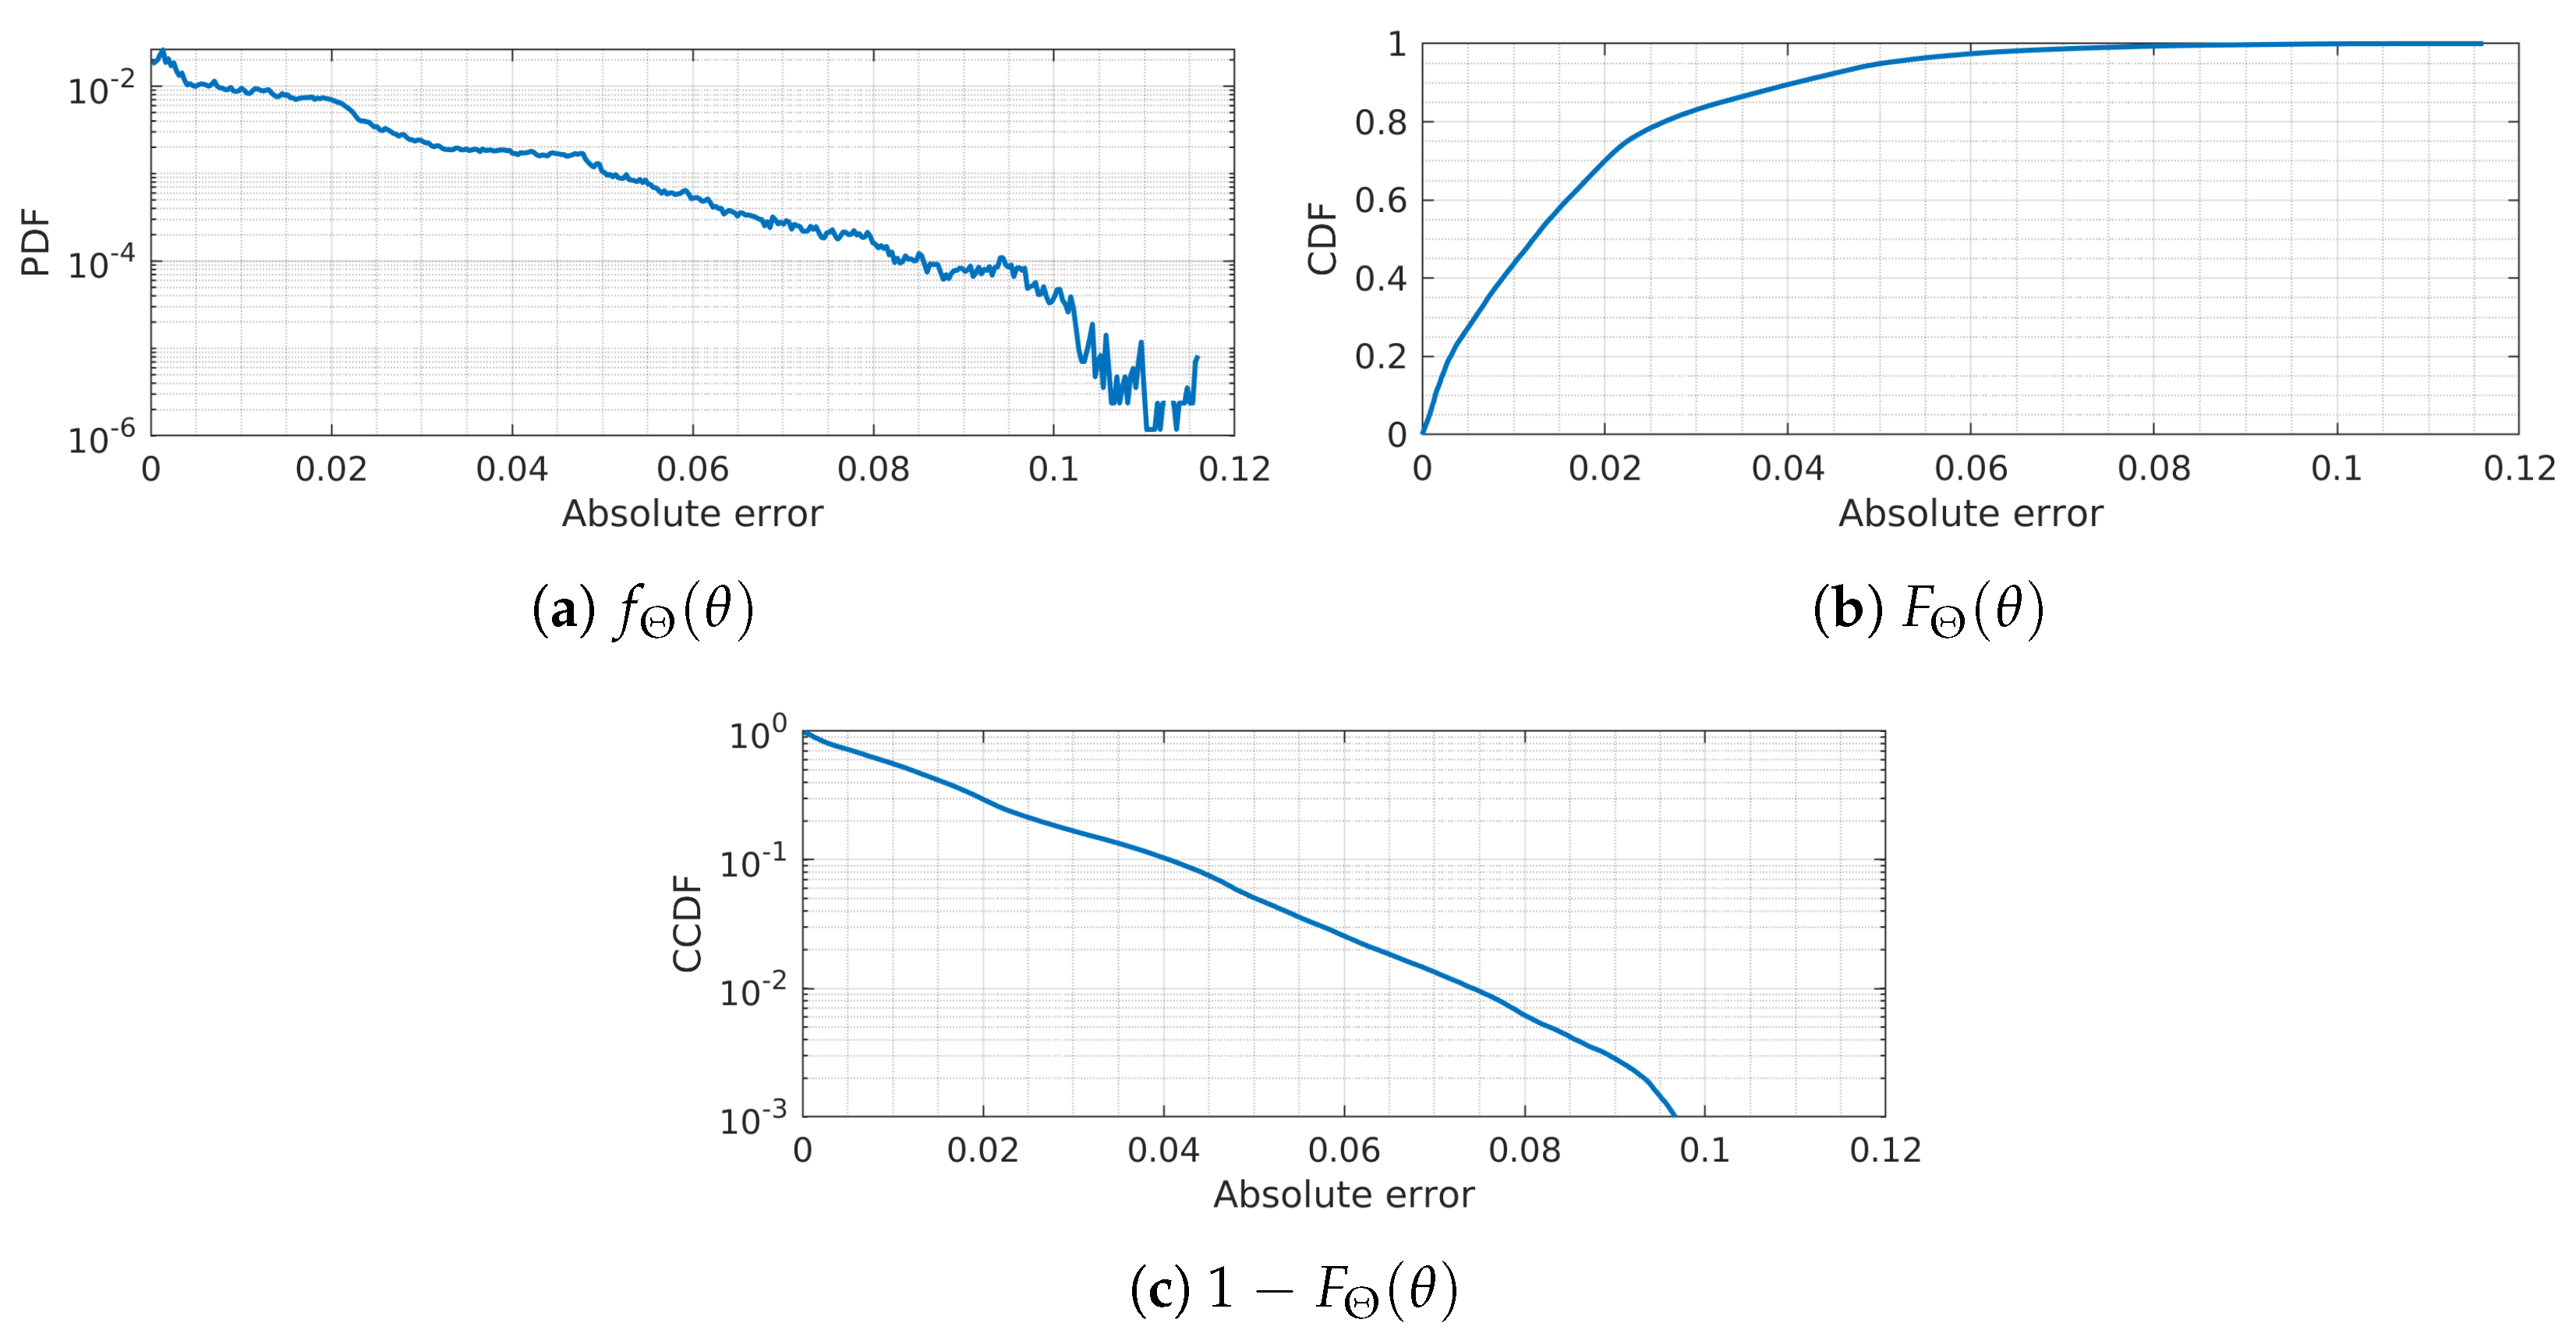
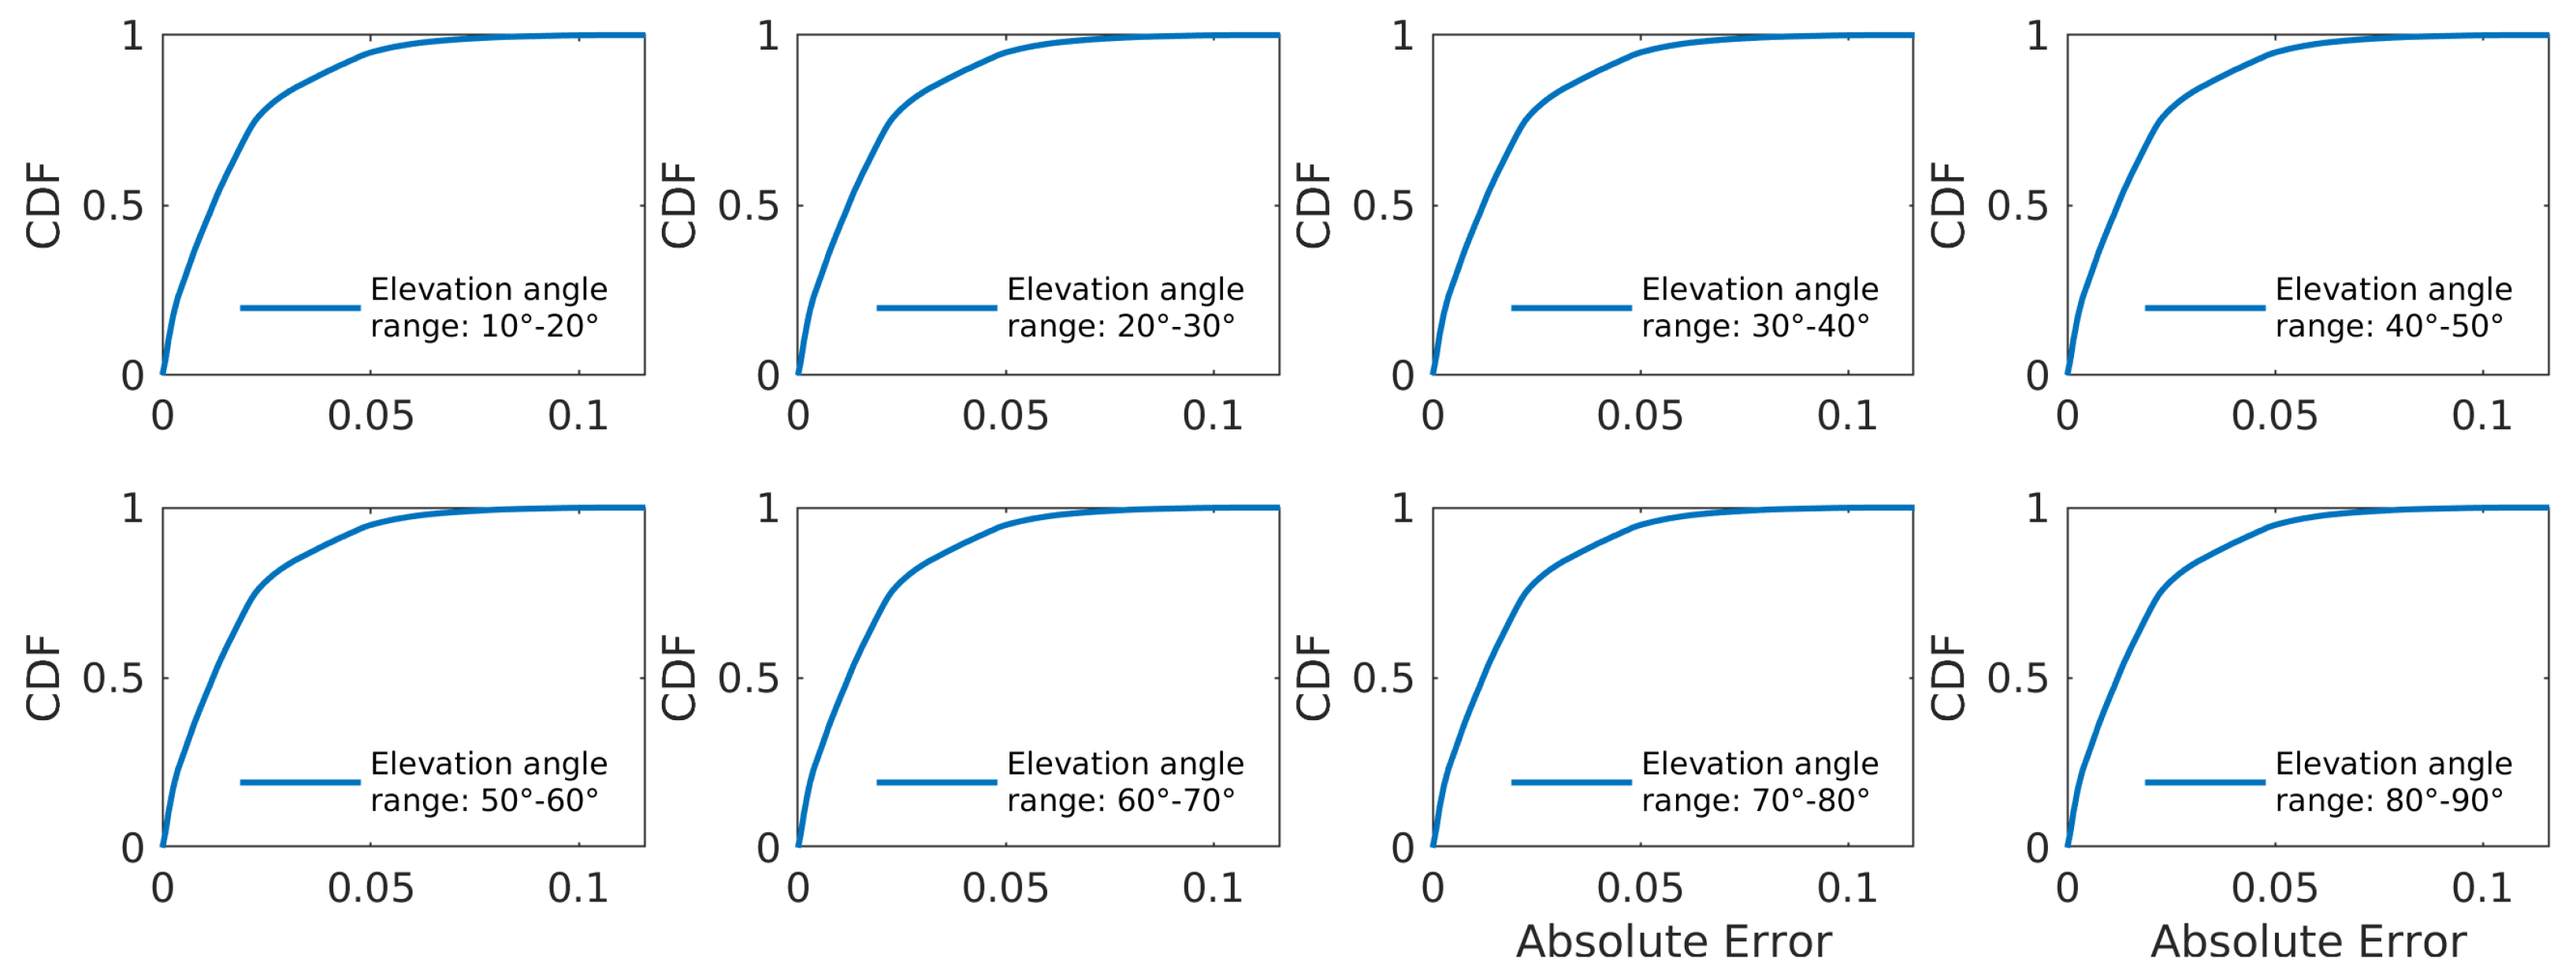
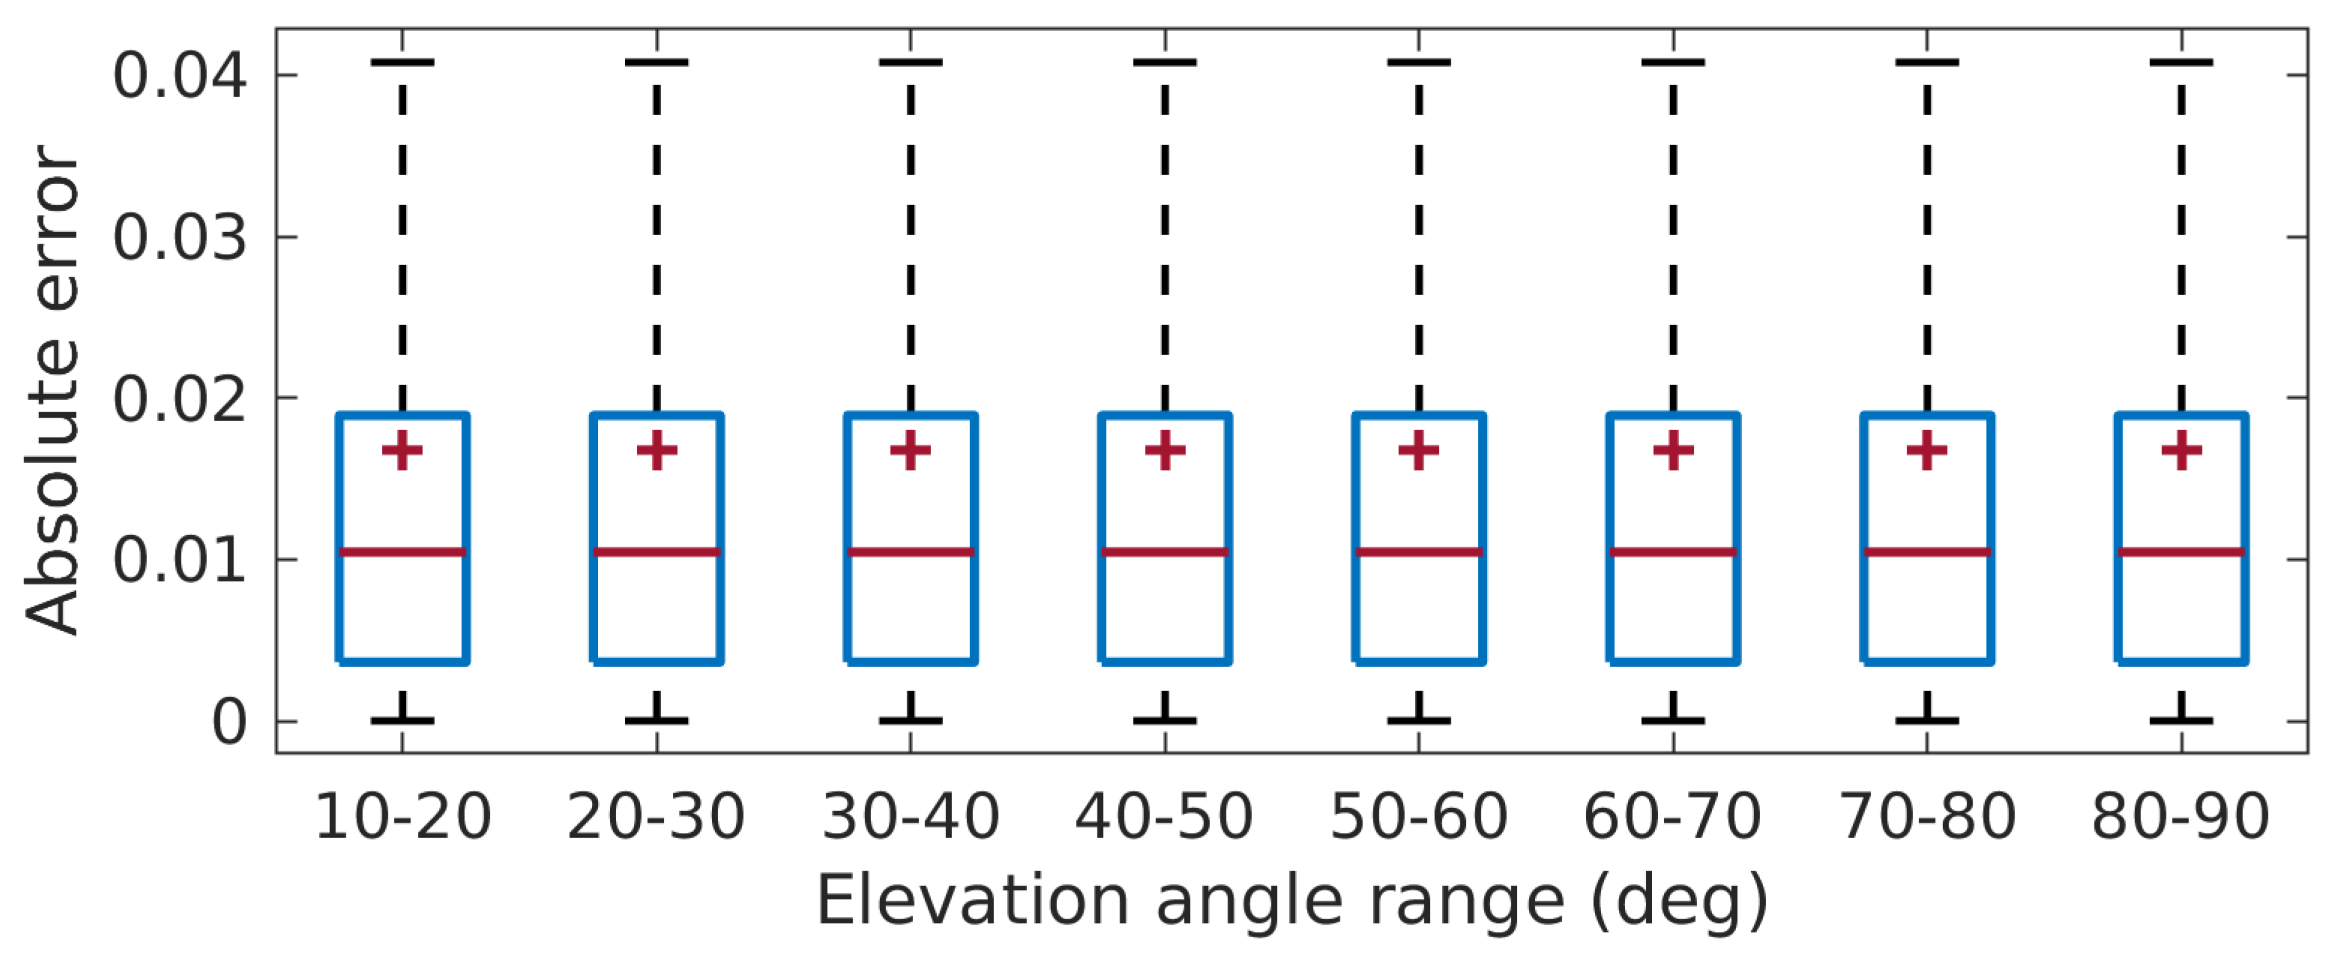
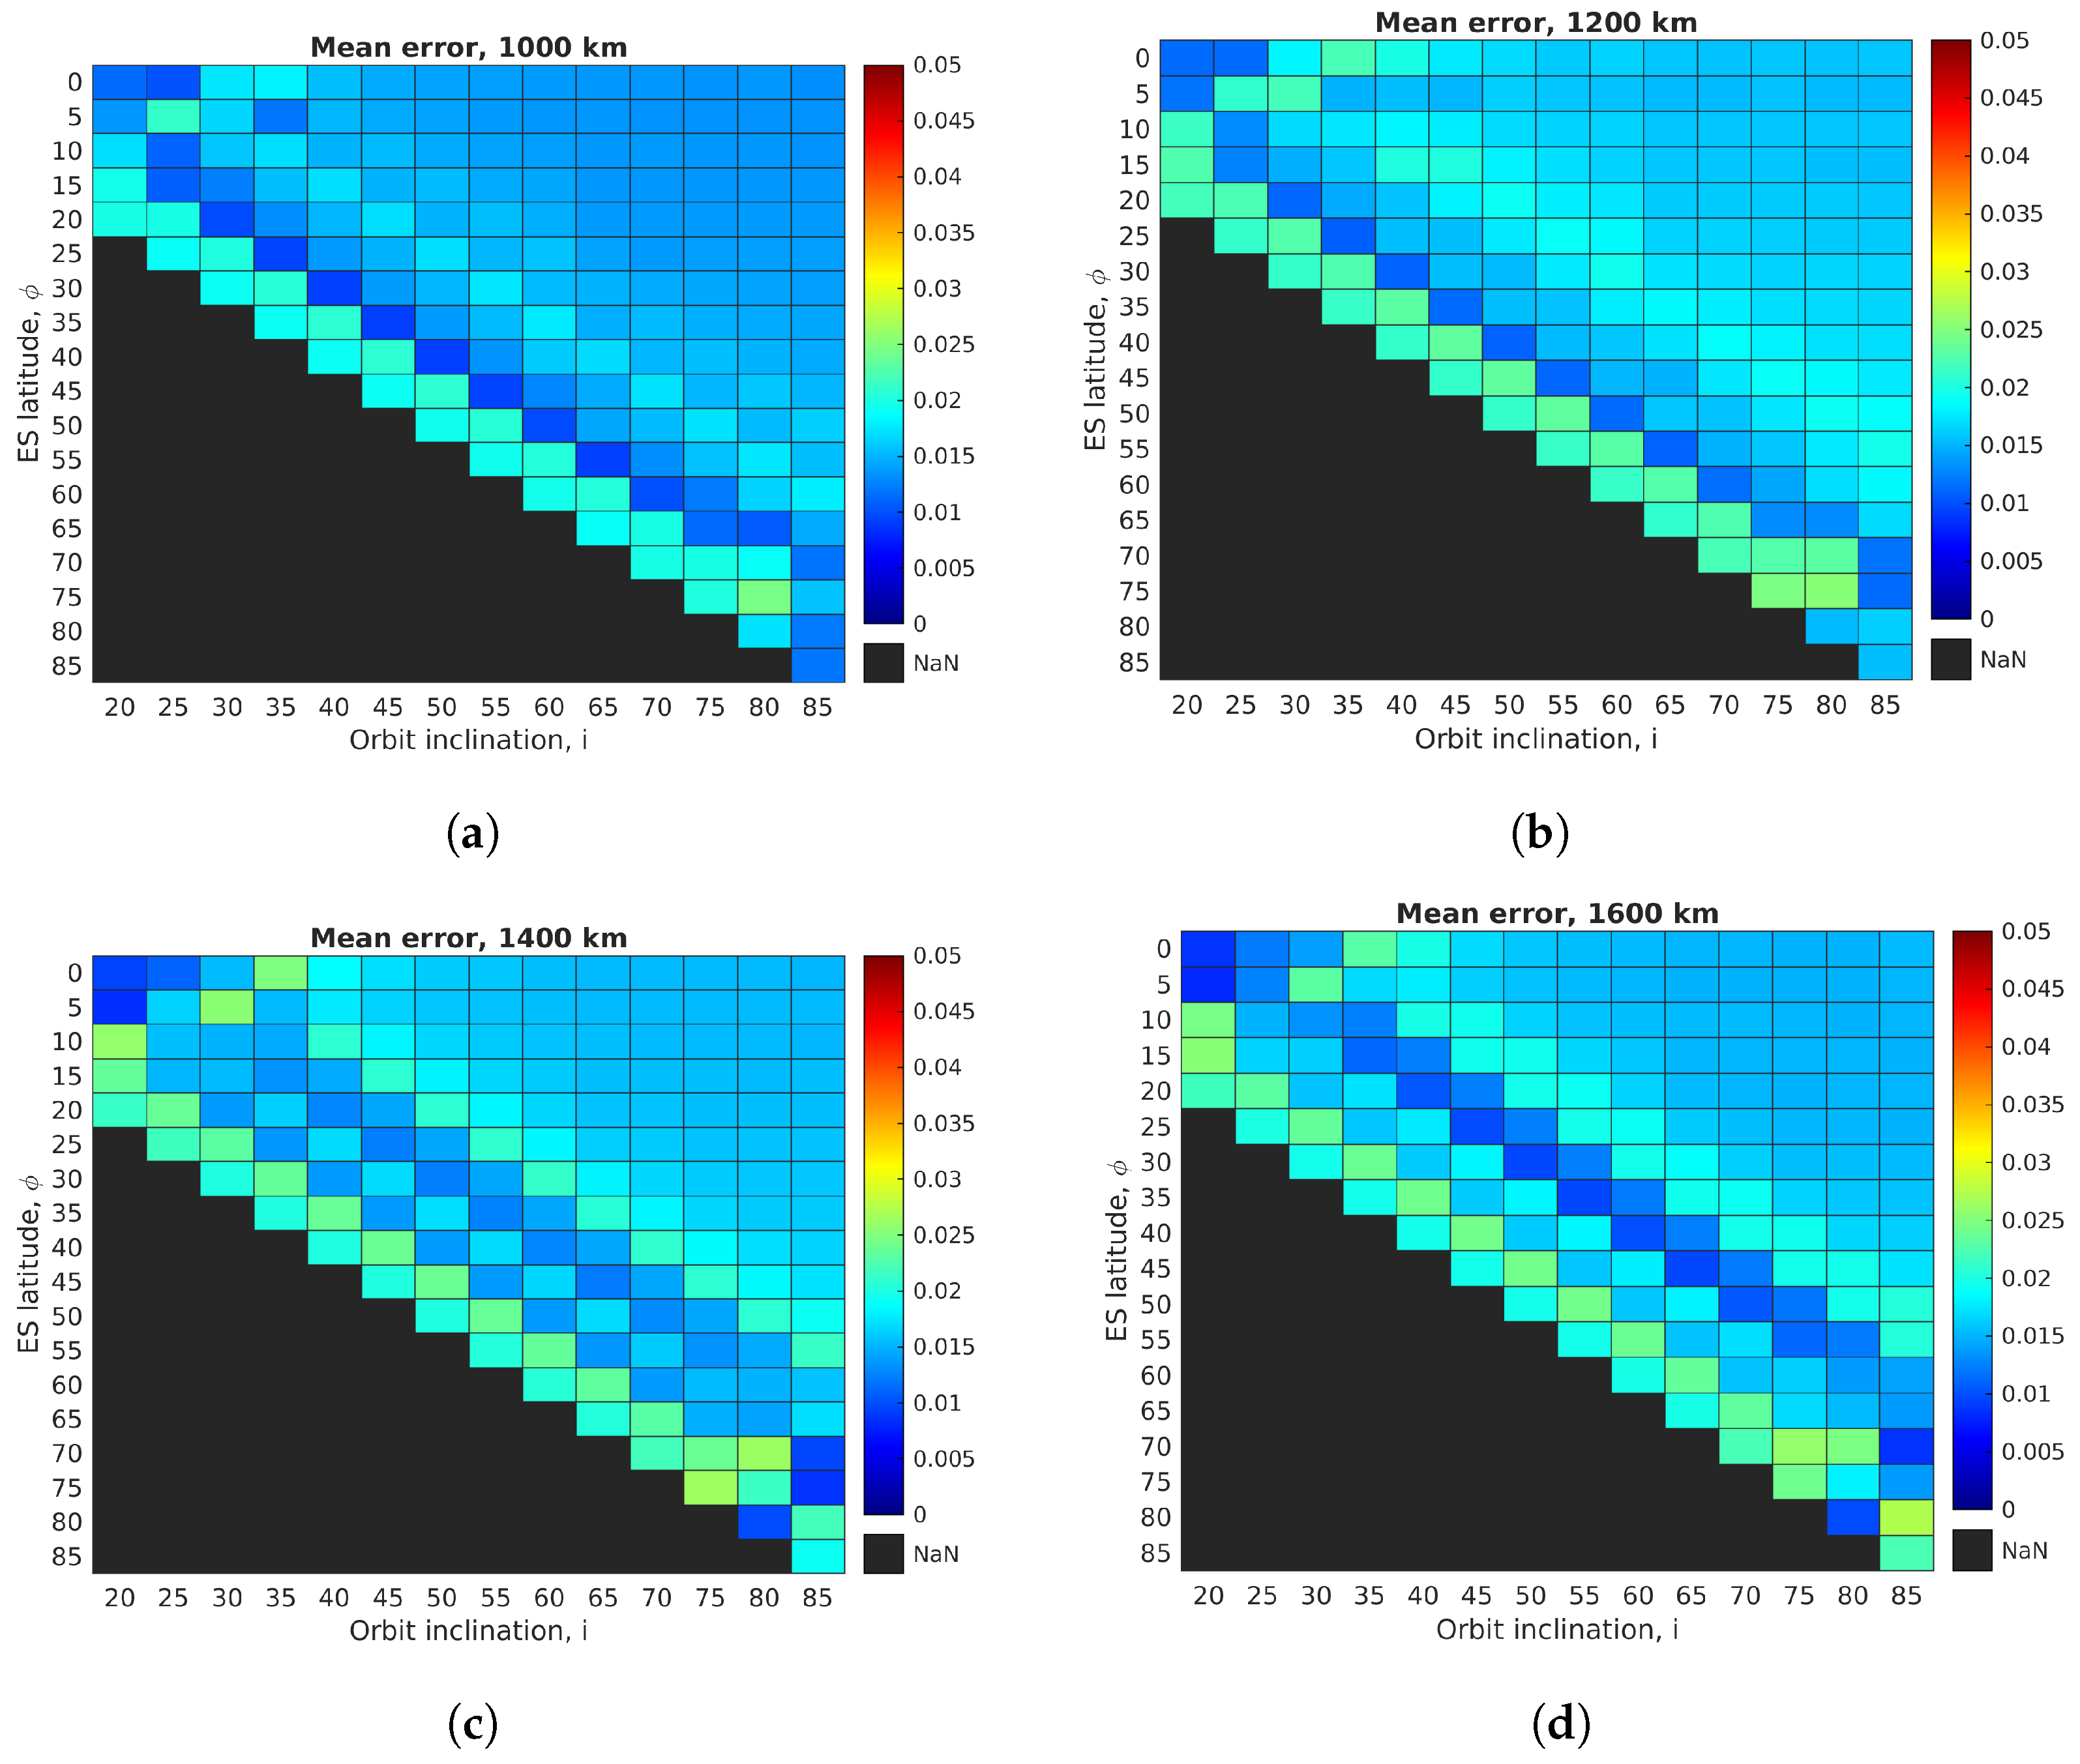
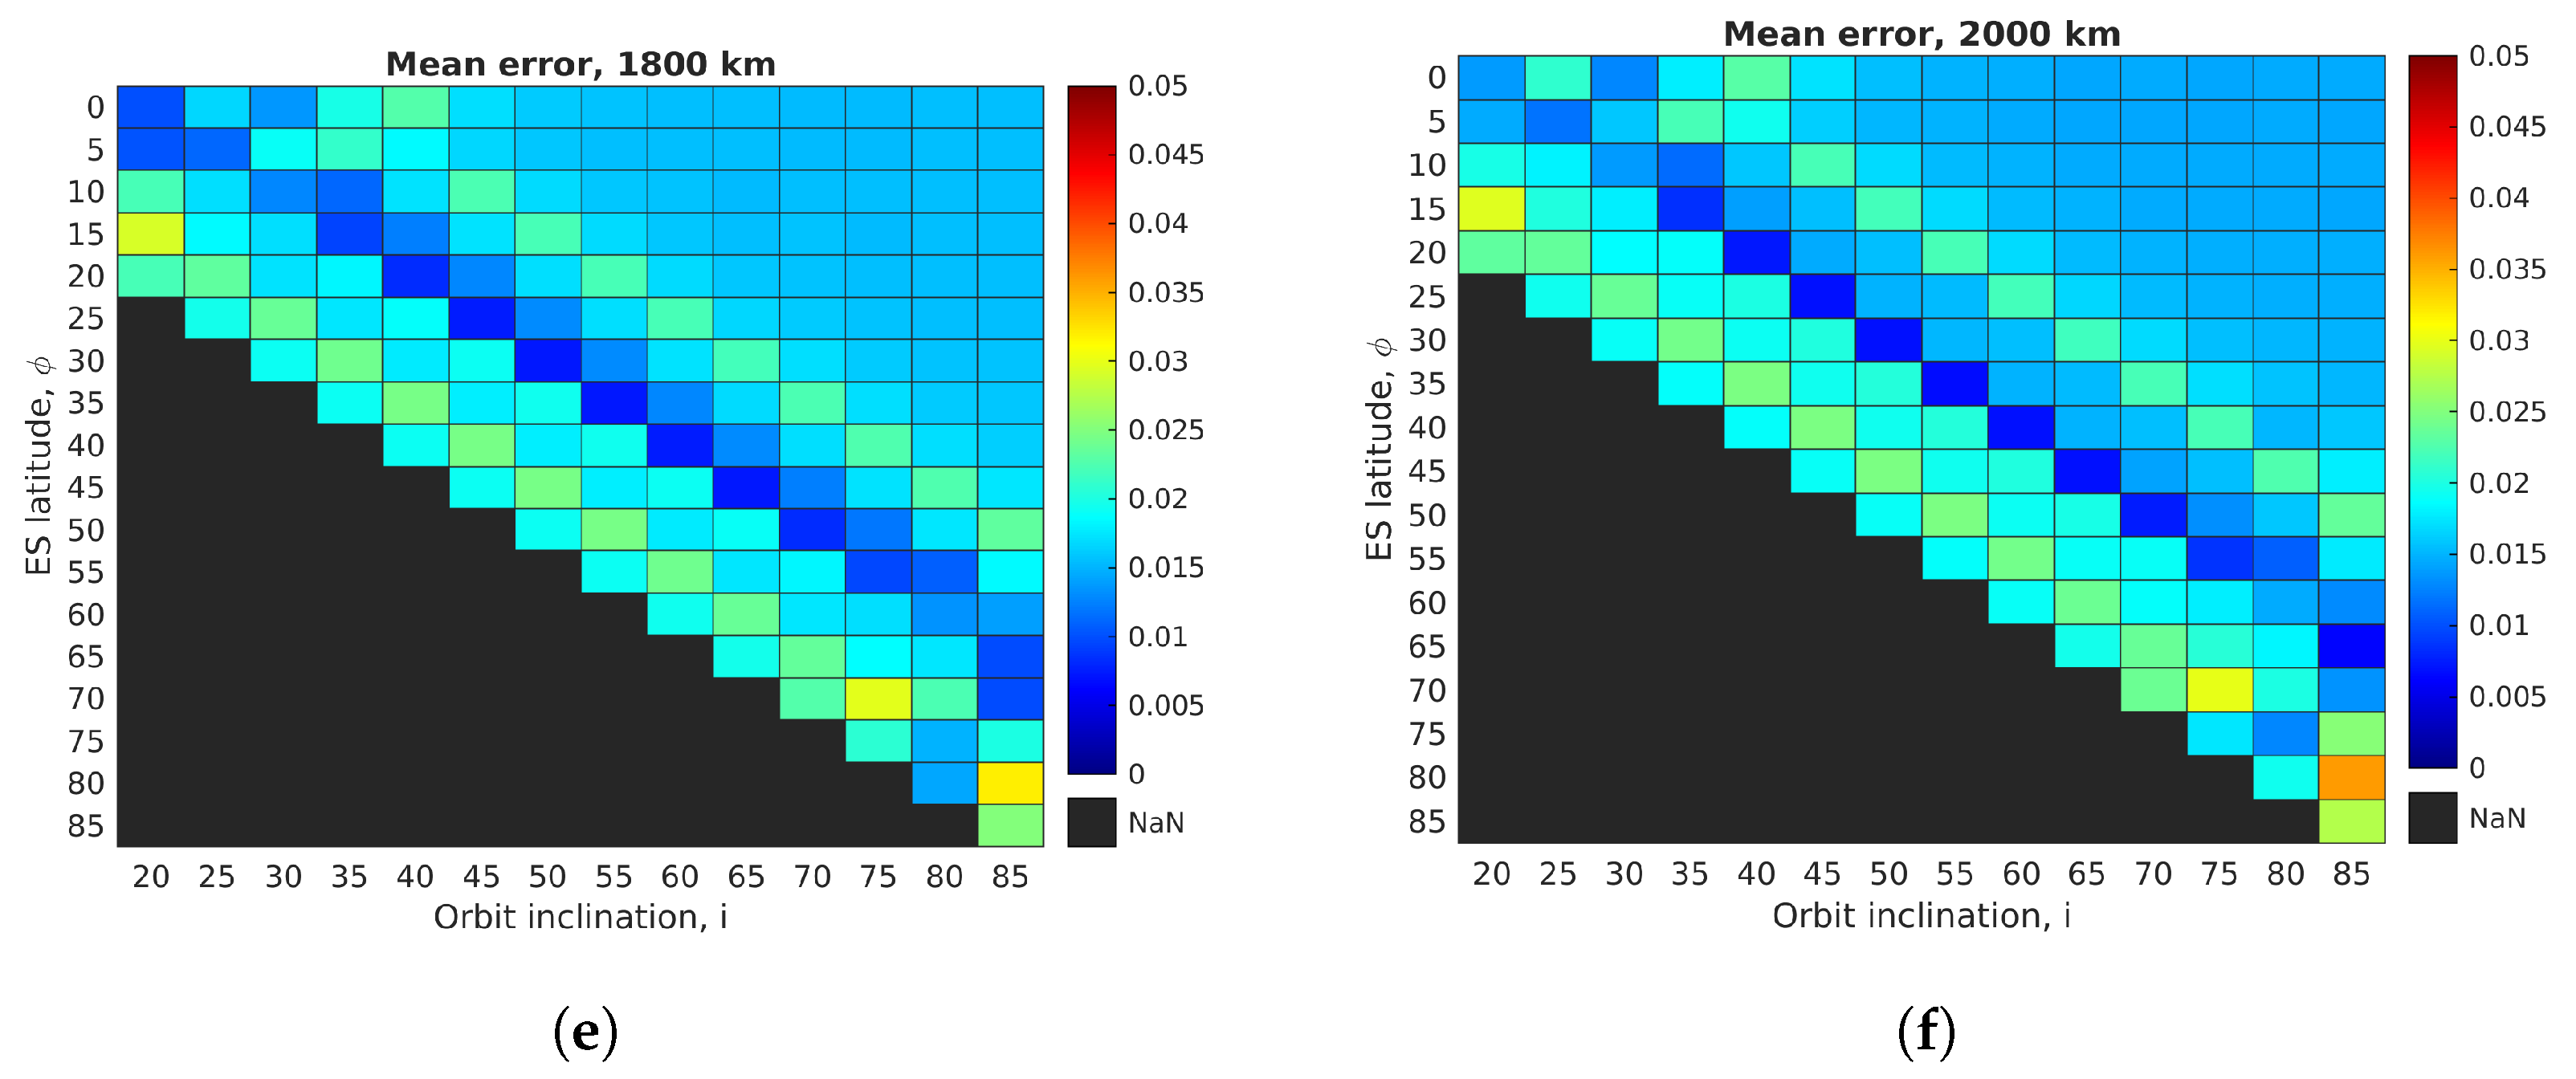
4.2. Error Analysis
5. Conclusions
Author Contributions
Funding
Institutional Review Board Statement
Informed Consent Statement
Data Availability Statement
Acknowledgments
Conflicts of Interest
Abbreviations
| CDF | Cumulative distribution function |
| CCDF | Complementary cumulative distribution function |
| ES | Earth station |
| GEO | Geostationary Earth orbit |
| LEO | Low Earth orbit |
| LMS | Land mobile satellite |
| LOS | Line-of-sight |
| NGEO | Non-Geostationary Earth orbit |
| NGSO | Non-Geosynchronous orbit |
| NLOS | Non-line-of-sight |
| Probability density function |
Appendix A


Appendix B

| Shape parameter, a | |||||||||||||||
| Orbit inclination, i | |||||||||||||||
| ES latitude, | 1.6063 | 1.5846 | 1.4659 | 1.4345 | 1.4584 | 1.4742 | 1.4817 | 1.4854 | 1.4864 | 1.4976 | 1.4981 | 1.4990 | 1.4954 | 1.5031 | |
| 1.7662 | 1.4853 | 1.4151 | 1.4548 | 1.4667 | 1.4770 | 1.4859 | 1.4898 | 1.4966 | 1.4968 | 1.4978 | 1.5015 | 1.5017 | 1.5040 | ||
| 1.5036 | 1.6270 | 1.6291 | 1.4689 | 1.4303 | 1.4646 | 1.4756 | 1.4785 | 1.4779 | 1.4956 | 1.4867 | 1.4936 | 1.4935 | 1.4983 | ||
| 1.3946 | 1.5570 | 1.6595 | 1.6390 | 1.4649 | 1.4340 | 1.4618 | 1.4690 | 1.4724 | 1.4938 | 1.4921 | 1.4914 | 1.4881 | 1.4920 | ||
| 1.3749 | 1.4220 | 1.5688 | 1.6689 | 1.6382 | 1.4680 | 1.4307 | 1.4545 | 1.4573 | 1.4891 | 1.4848 | 1.4851 | 1.4828 | 1.4832 | ||
| NaN | 1.3944 | 1.4332 | 1.5776 | 1.6720 | 1.6477 | 1.4676 | 1.4252 | 1.4474 | 1.4854 | 1.4892 | 1.4803 | 1.4776 | 1.4816 | ||
| NaN | NaN | 1.3925 | 1.4369 | 1.5763 | 1.6771 | 1.6428 | 1.4573 | 1.4084 | 1.4733 | 1.4677 | 1.4715 | 1.4702 | 1.4730 | ||
| NaN | NaN | NaN | 1.3925 | 1.4347 | 1.5815 | 1.6756 | 1.6354 | 1.4426 | 1.4446 | 1.4608 | 1.4641 | 1.4622 | 1.4682 | ||
| NaN | NaN | NaN | NaN | 1.3905 | 1.4380 | 1.5786 | 1.6669 | 1.6189 | 1.4831 | 1.4273 | 1.4526 | 1.4554 | 1.4612 | ||
| NaN | NaN | NaN | NaN | NaN | 1.3940 | 1.4356 | 1.5708 | 1.6451 | 1.6605 | 1.4663 | 1.4221 | 1.4444 | 1.4527 | ||
| NaN | NaN | NaN | NaN | NaN | NaN | 1.3910 | 1.4271 | 1.5550 | 1.6894 | 1.6367 | 1.4608 | 1.4121 | 1.4398 | ||
| NaN | NaN | NaN | NaN | NaN | NaN | NaN | 1.3824 | 1.4100 | 1.5894 | 1.6625 | 1.6276 | 1.4507 | 1.4099 | ||
| NaN | NaN | NaN | NaN | NaN | NaN | NaN | NaN | 1.3660 | 1.4435 | 1.5637 | 1.6466 | 1.6055 | 1.4458 | ||
| NaN | NaN | NaN | NaN | NaN | NaN | NaN | NaN | NaN | 1.4001 | 1.4173 | 1.5411 | 1.6072 | 1.5573 | ||
| NaN | NaN | NaN | NaN | NaN | NaN | NaN | NaN | NaN | NaN | 1.3734 | 1.3893 | 1.4656 | 1.5816 | ||
| NaN | NaN | NaN | NaN | NaN | NaN | NaN | NaN | NaN | NaN | NaN | 1.3180 | 1.3604 | 1.6773 | ||
| NaN | NaN | NaN | NaN | NaN | NaN | NaN | NaN | NaN | NaN | NaN | NaN | 1.5359 | 1.6471 | ||
| NaN | NaN | NaN | NaN | NaN | NaN | NaN | NaN | NaN | NaN | NaN | NaN | NaN | 1.6787 | ||
| Rate parameter, | |||||||||||||||
| Orbit inclination, i | |||||||||||||||
| ES latitude, | 9.3564 | 9.7586 | 9.5066 | 8.9569 | 8.8711 | 8.8567 | 8.8380 | 8.8193 | 8.8029 | 8.8260 | 8.8154 | 8.8086 | 8.7865 | 8.8199 | |
| 10.5403 | 10.0061 | 9.0549 | 8.9535 | 8.8763 | 8.8544 | 8.8469 | 8.8317 | 8.8354 | 8.8231 | 8.8158 | 8.8208 | 8.8155 | 8.8212 | ||
| 7.7606 | 8.9977 | 9.8007 | 9.4661 | 8.8894 | 8.8741 | 8.8451 | 8.8116 | 8.7805 | 8.8244 | 8.7752 | 8.7949 | 8.7836 | 8.8062 | ||
| 6.6219 | 7.7633 | 9.0428 | 9.8124 | 9.4342 | 8.8982 | 8.8559 | 8.8128 | 8.7869 | 8.8387 | 8.8202 | 8.8029 | 8.7816 | 8.7902 | ||
| 6.6564 | 6.6032 | 7.7437 | 9.0479 | 9.7937 | 9.4531 | 8.8882 | 8.8237 | 8.7689 | 8.8436 | 8.8078 | 8.7884 | 8.7699 | 8.7666 | ||
| NaN | 6.6326 | 6.5841 | 7.7402 | 9.0362 | 9.8353 | 9.4583 | 8.8648 | 8.8023 | 8.8671 | 8.8434 | 8.7874 | 8.7628 | 8.7717 | ||
| NaN | NaN | 6.5839 | 6.5680 | 7.7144 | 9.0589 | 9.8236 | 9.4244 | 8.8083 | 8.8931 | 8.8074 | 8.7832 | 8.7553 | 8.7587 | ||
| NaN | NaN | NaN | 6.5567 | 6.5410 | 7.7312 | 9.0548 | 9.7985 | 9.3706 | 8.9406 | 8.8534 | 8.7989 | 8.7558 | 8.7643 | ||
| NaN | NaN | NaN | NaN | 6.5304 | 6.5513 | 7.7229 | 9.0267 | 9.7458 | 9.5196 | 8.8811 | 8.8282 | 8.7753 | 8.7717 | ||
| NaN | NaN | NaN | NaN | NaN | 6.5434 | 6.5459 | 7.7016 | 8.9585 | 9.8790 | 9.4584 | 8.8695 | 8.8088 | 8.7893 | ||
| NaN | NaN | NaN | NaN | NaN | NaN | 6.5410 | 6.5295 | 7.6665 | 9.0970 | 9.7983 | 9.4411 | 8.8441 | 8.8240 | ||
| NaN | NaN | NaN | NaN | NaN | NaN | NaN | 6.5306 | 6.4975 | 7.7688 | 9.0234 | 9.7734 | 9.4087 | 8.8794 | ||
| NaN | NaN | NaN | NaN | NaN | NaN | NaN | NaN | 6.5095 | 6.6064 | 7.7225 | 8.9947 | 9.7121 | 9.4440 | ||
| NaN | NaN | NaN | NaN | NaN | NaN | NaN | NaN | NaN | 6.6420 | 6.5845 | 7.7079 | 8.9262 | 9.6598 | ||
| NaN | NaN | NaN | NaN | NaN | NaN | NaN | NaN | NaN | NaN | 6.6549 | 6.6089 | 7.6339 | 9.2649 | ||
| NaN | NaN | NaN | NaN | NaN | NaN | NaN | NaN | NaN | NaN | NaN | 6.7200 | 6.9875 | 8.5786 | ||
| NaN | NaN | NaN | NaN | NaN | NaN | NaN | NaN | NaN | NaN | NaN | NaN | 7.7001 | 7.3090 | ||
| NaN | NaN | NaN | NaN | NaN | NaN | NaN | NaN | NaN | NaN | NaN | NaN | NaN | 6.6598 | ||
| Shape parameter, a | |||||||||||||||
| Orbit inclination, i | |||||||||||||||
| ES latitude, | 1.9367 | 1.8476 | 1.7839 | 1.6868 | 1.6955 | 1.7417 | 1.7409 | 1.7492 | 1.7447 | 1.7597 | 1.7591 | 1.7601 | 1.7634 | 1.7602 | |
| 2.1177 | 1.8521 | 1.6327 | 1.7080 | 1.7098 | 1.7486 | 1.7488 | 1.7558 | 1.7608 | 1.7694 | 1.7714 | 1.7650 | 1.7716 | 1.7719 | ||
| 1.6926 | 1.8959 | 1.9305 | 1.8002 | 1.6702 | 1.7141 | 1.7376 | 1.7431 | 1.7430 | 1.7589 | 1.7569 | 1.7578 | 1.7570 | 1.7563 | ||
| 1.6207 | 1.7863 | 1.9154 | 1.9534 | 1.7777 | 1.6495 | 1.7212 | 1.7317 | 1.7364 | 1.7557 | 1.7562 | 1.7539 | 1.7587 | 1.7589 | ||
| 1.6095 | 1.6490 | 1.8163 | 1.9346 | 1.9398 | 1.7980 | 1.6558 | 1.7163 | 1.7235 | 1.7514 | 1.7477 | 1.7507 | 1.7465 | 1.7494 | ||
| NaN | 1.6232 | 1.6627 | 1.7997 | 1.9360 | 1.9544 | 1.7983 | 1.6558 | 1.7068 | 1.7490 | 1.7432 | 1.7479 | 1.7488 | 1.7452 | ||
| NaN | NaN | 1.6252 | 1.6872 | 1.8215 | 1.9492 | 1.9548 | 1.7931 | 1.6375 | 1.7321 | 1.7337 | 1.7392 | 1.7343 | 1.7354 | ||
| NaN | NaN | NaN | 1.6447 | 1.6618 | 1.8221 | 1.9537 | 1.9512 | 1.7807 | 1.6748 | 1.7177 | 1.7272 | 1.7325 | 1.7302 | ||
| NaN | NaN | NaN | NaN | 1.6225 | 1.6601 | 1.8240 | 1.9460 | 1.9366 | 1.8135 | 1.6560 | 1.7160 | 1.7235 | 1.7234 | ||
| NaN | NaN | NaN | NaN | NaN | 1.6254 | 1.6633 | 1.8164 | 1.9322 | 1.9702 | 1.7978 | 1.6528 | 1.7079 | 1.7157 | ||
| NaN | NaN | NaN | NaN | NaN | NaN | 1.6238 | 1.6543 | 1.8021 | 1.9626 | 1.9488 | 1.7952 | 1.6478 | 1.6998 | ||
| NaN | NaN | NaN | NaN | NaN | NaN | NaN | 1.6163 | 1.6431 | 1.8301 | 1.9366 | 1.9394 | 1.7864 | 1.6401 | ||
| NaN | NaN | NaN | NaN | NaN | NaN | NaN | NaN | 1.6051 | 1.6666 | 1.8028 | 1.9230 | 1.9178 | 1.7669 | ||
| NaN | NaN | NaN | NaN | NaN | NaN | NaN | NaN | NaN | 1.6296 | 1.6402 | 1.7810 | 1.8767 | 1.8103 | ||
| NaN | NaN | NaN | NaN | NaN | NaN | NaN | NaN | NaN | NaN | 1.6007 | 1.6094 | 1.6590 | 1.9132 | ||
| NaN | NaN | NaN | NaN | NaN | NaN | NaN | NaN | NaN | NaN | NaN | 1.5039 | 1.6502 | 1.9769 | ||
| NaN | NaN | NaN | NaN | NaN | NaN | NaN | NaN | NaN | NaN | NaN | NaN | 1.8388 | 1.9151 | ||
| NaN | NaN | NaN | NaN | NaN | NaN | NaN | NaN | NaN | NaN | NaN | NaN | NaN | 1.9243 | ||
| Rate parameter, | |||||||||||||||
| Orbit inclination, i | |||||||||||||||
| ES latitude, | 9.8678 | 10.1172 | 10.1891 | 9.5261 | 9.2793 | 9.3729 | 9.3072 | 9.3066 | 9.2476 | 9.2919 | 9.2763 | 9.2667 | 9.2673 | 9.2552 | |
| 10.9490 | 10.7976 | 9.5396 | 9.4617 | 9.4702 | 9.4077 | 9.3339 | 9.3232 | 9.3145 | 9.3424 | 9.3382 | 9.2878 | 9.3186 | 9.3206 | ||
| 7.9755 | 9.3073 | 10.1848 | 10.2797 | 9.5051 | 9.3438 | 9.3330 | 9.3051 | 9.2626 | 9.2973 | 9.2773 | 9.2654 | 9.2527 | 9.2481 | ||
| 7.0189 | 8.0187 | 9.2511 | 10.2487 | 10.0220 | 9.3057 | 9.3599 | 9.3083 | 9.2744 | 9.3104 | 9.3002 | 9.2706 | 9.2890 | 9.2896 | ||
| 7.1070 | 6.9667 | 8.0353 | 9.3656 | 10.2409 | 10.1571 | 9.3472 | 9.3401 | 9.2772 | 9.3222 | 9.2813 | 9.2749 | 9.2438 | 9.2536 | ||
| NaN | 7.0470 | 6.9514 | 7.9165 | 9.3034 | 10.2353 | 10.1621 | 9.3559 | 9.2997 | 9.3585 | 9.2960 | 9.2845 | 9.2656 | 9.2505 | ||
| NaN | NaN | 7.0018 | 6.9659 | 7.9953 | 9.3214 | 10.2443 | 10.1469 | 9.2910 | 9.3912 | 9.3140 | 9.2875 | 9.2399 | 9.2356 | ||
| NaN | NaN | NaN | 7.0394 | 6.8984 | 8.0022 | 9.3392 | 10.2286 | 10.1082 | 9.4209 | 9.3499 | 9.2977 | 9.2695 | 9.2465 | ||
| NaN | NaN | NaN | NaN | 6.9521 | 6.8918 | 7.9991 | 9.3174 | 10.1895 | 10.2072 | 9.3678 | 9.3487 | 9.2934 | 9.2639 | ||
| NaN | NaN | NaN | NaN | NaN | 6.9573 | 6.9004 | 7.9858 | 9.2827 | 10.2757 | 10.1639 | 9.3584 | 9.3328 | 9.2961 | ||
| NaN | NaN | NaN | NaN | NaN | NaN | 6.9589 | 6.8851 | 7.9537 | 9.3612 | 10.2210 | 10.1526 | 9.3583 | 9.3438 | ||
| NaN | NaN | NaN | NaN | NaN | NaN | NaN | 6.9545 | 6.8728 | 8.0376 | 9.3045 | 10.1982 | 10.1379 | 9.3821 | ||
| NaN | NaN | NaN | NaN | NaN | NaN | NaN | NaN | 6.9538 | 6.9553 | 7.9965 | 9.2952 | 10.1634 | 10.1416 | ||
| NaN | NaN | NaN | NaN | NaN | NaN | NaN | NaN | NaN | 7.0605 | 6.9440 | 8.0014 | 9.2414 | 9.9957 | ||
| NaN | NaN | NaN | NaN | NaN | NaN | NaN | NaN | NaN | NaN | 7.0826 | 6.9882 | 7.8742 | 9.7894 | ||
| NaN | NaN | NaN | NaN | NaN | NaN | NaN | NaN | NaN | NaN | NaN | 7.1230 | 7.5669 | 8.9129 | ||
| NaN | NaN | NaN | NaN | NaN | NaN | NaN | NaN | NaN | NaN | NaN | NaN | 8.1780 | 7.6105 | ||
| NaN | NaN | NaN | NaN | NaN | NaN | NaN | NaN | NaN | NaN | NaN | NaN | NaN | 6.9258 | ||
| Shape parameter, a | |||||||||||||||
| Orbit inclination, i | |||||||||||||||
| ES latitude, | 2.0032 | 1.8456 | 1.8402 | 1.6716 | 1.7100 | 1.7340 | 1.7449 | 1.7511 | 1.7543 | 1.7637 | 1.7632 | 1.7651 | 1.7702 | 1.7679 | |
| 2.1655 | 1.9754 | 1.6522 | 1.6934 | 1.7231 | 1.7409 | 1.7490 | 1.7540 | 1.7591 | 1.7614 | 1.7649 | 1.7663 | 1.7667 | 1.7666 | ||
| 1.6677 | 1.8992 | 1.9435 | 1.8657 | 1.6721 | 1.7127 | 1.7353 | 1.7436 | 1.7499 | 1.7599 | 1.7588 | 1.7621 | 1.7586 | 1.7636 | ||
| 1.6088 | 1.7424 | 1.9101 | 1.9636 | 1.8729 | 1.6705 | 1.7134 | 1.7323 | 1.7393 | 1.7562 | 1.7543 | 1.7568 | 1.7675 | 1.7563 | ||
| 1.6203 | 1.6962 | 1.7952 | 1.9295 | 1.9741 | 1.8764 | 1.6701 | 1.7079 | 1.7269 | 1.7506 | 1.7481 | 1.7527 | 1.7548 | 1.7517 | ||
| NaN | 1.5976 | 1.6651 | 1.8075 | 1.9402 | 1.9817 | 1.8801 | 1.6663 | 1.7024 | 1.7427 | 1.7421 | 1.7498 | 1.7327 | 1.7498 | ||
| NaN | NaN | 1.6369 | 1.6635 | 1.8108 | 1.9413 | 1.9814 | 1.8736 | 1.6573 | 1.7178 | 1.7295 | 1.7404 | 1.7402 | 1.7417 | ||
| NaN | NaN | NaN | 1.6445 | 1.6715 | 1.8127 | 1.9434 | 1.9763 | 1.8665 | 1.6778 | 1.7050 | 1.7302 | 1.7423 | 1.7363 | ||
| NaN | NaN | NaN | NaN | 1.6456 | 1.6718 | 1.8117 | 1.9378 | 1.9673 | 1.8869 | 1.6650 | 1.7061 | 1.7206 | 1.7275 | ||
| NaN | NaN | NaN | NaN | NaN | 1.6449 | 1.6710 | 1.8075 | 1.9279 | 1.9885 | 1.8715 | 1.6685 | 1.7048 | 1.7163 | ||
| NaN | NaN | NaN | NaN | NaN | NaN | 1.6440 | 1.6645 | 1.7968 | 1.9466 | 1.9668 | 1.8700 | 1.6689 | 1.6933 | ||
| NaN | NaN | NaN | NaN | NaN | NaN | NaN | 1.6368 | 1.6538 | 1.8118 | 1.9217 | 1.9582 | 1.8582 | 1.6591 | ||
| NaN | NaN | NaN | NaN | NaN | NaN | NaN | NaN | 1.6265 | 1.6684 | 1.7868 | 1.9054 | 1.9326 | 1.8204 | ||
| NaN | NaN | NaN | NaN | NaN | NaN | NaN | NaN | NaN | 1.6403 | 1.6414 | 1.7611 | 1.8477 | 1.8296 | ||
| NaN | NaN | NaN | NaN | NaN | NaN | NaN | NaN | NaN | NaN | 1.6074 | 1.5970 | 1.6574 | 1.9844 | ||
| NaN | NaN | NaN | NaN | NaN | NaN | NaN | NaN | NaN | NaN | NaN | 1.5302 | 1.7400 | 2.0124 | ||
| NaN | NaN | NaN | NaN | NaN | NaN | NaN | NaN | NaN | NaN | NaN | NaN | 1.9051 | 1.9381 | ||
| NaN | NaN | NaN | NaN | NaN | NaN | NaN | NaN | NaN | NaN | NaN | NaN | NaN | 1.9298 | ||
| Rate parameter, | |||||||||||||||
| Orbit inclination, i | |||||||||||||||
| ES latitude, | 9.4854 | 9.6587 | 9.9384 | 9.3116 | 9.0728 | 9.0317 | 8.9969 | 8.9756 | 8.9583 | 8.9661 | 8.9488 | 8.9440 | 8.9534 | 8.9475 | |
| 10.3295 | 10.6508 | 9.6070 | 9.1546 | 9.0625 | 9.0309 | 8.9989 | 8.9776 | 8.9675 | 8.9546 | 8.9515 | 8.9460 | 8.9355 | 8.9351 | ||
| 7.6674 | 8.8435 | 9.6689 | 9.9236 | 9.2595 | 9.0497 | 9.0065 | 8.9747 | 8.9588 | 8.9634 | 8.9429 | 8.9396 | 8.9208 | 8.9386 | ||
| 6.7932 | 7.5227 | 8.7334 | 9.6790 | 9.9223 | 9.2504 | 9.0394 | 8.9900 | 8.9562 | 8.9731 | 8.9424 | 8.9348 | 8.9586 | 8.9182 | ||
| 6.9480 | 6.8614 | 7.6001 | 8.7492 | 9.6886 | 9.9382 | 9.2493 | 9.0196 | 8.9703 | 8.9873 | 8.9450 | 8.9408 | 8.9327 | 8.9139 | ||
| NaN | 6.7756 | 6.7266 | 7.5953 | 8.7531 | 9.7130 | 9.9496 | 9.2345 | 9.0001 | 9.0167 | 8.9594 | 8.9542 | 8.8746 | 8.9231 | ||
| NaN | NaN | 6.8307 | 6.6879 | 7.5795 | 8.7557 | 9.7114 | 9.9298 | 9.2092 | 9.0479 | 8.9779 | 8.9616 | 8.9292 | 8.9203 | ||
| NaN | NaN | NaN | 6.8201 | 6.6873 | 7.5802 | 8.7575 | 9.6934 | 9.9105 | 9.2742 | 9.0104 | 8.9880 | 8.9710 | 8.9328 | ||
| NaN | NaN | NaN | NaN | 6.8046 | 6.6837 | 7.5755 | 8.7420 | 9.6708 | 9.9675 | 9.2362 | 9.0237 | 8.9654 | 8.9487 | ||
| NaN | NaN | NaN | NaN | NaN | 6.8013 | 6.6834 | 7.5681 | 8.7196 | 9.7269 | 9.9219 | 9.2539 | 9.0292 | 8.9823 | ||
| NaN | NaN | NaN | NaN | NaN | NaN | 6.8058 | 6.6760 | 7.5510 | 8.7727 | 9.6706 | 9.9225 | 9.2661 | 9.0351 | ||
| NaN | NaN | NaN | NaN | NaN | NaN | NaN | 6.8030 | 6.6671 | 7.6017 | 8.7233 | 9.6600 | 9.8991 | 9.2876 | ||
| NaN | NaN | NaN | NaN | NaN | NaN | NaN | NaN | 6.8055 | 6.7306 | 7.5743 | 8.7167 | 9.6255 | 9.8749 | ||
| NaN | NaN | NaN | NaN | NaN | NaN | NaN | NaN | NaN | 6.8898 | 6.7259 | 7.5850 | 8.6605 | 9.6210 | ||
| NaN | NaN | NaN | NaN | NaN | NaN | NaN | NaN | NaN | NaN | 6.9155 | 6.7657 | 7.6365 | 9.4222 | ||
| NaN | NaN | NaN | NaN | NaN | NaN | NaN | NaN | NaN | NaN | NaN | 7.1459 | 7.5283 | 8.4633 | ||
| NaN | NaN | NaN | NaN | NaN | NaN | NaN | NaN | NaN | NaN | NaN | NaN | 7.9448 | 7.2608 | ||
| NaN | NaN | NaN | NaN | NaN | NaN | NaN | NaN | NaN | NaN | NaN | NaN | NaN | 6.6159 | ||
| Shape parameter, a | |||||||||||||||
| Orbit inclination, i | |||||||||||||||
| ES latitude, | 2.0512 | 1.9235 | 1.8537 | 1.7406 | 1.6844 | 1.7333 | 1.7450 | 1.7537 | 1.7570 | 1.7618 | 1.7630 | 1.7656 | 1.7689 | 1.7680 | |
| 2.1942 | 2.0607 | 1.7717 | 1.6601 | 1.7164 | 1.7388 | 1.7508 | 1.7558 | 1.7613 | 1.7647 | 1.7677 | 1.7701 | 1.7681 | 1.7687 | ||
| 1.7309 | 1.8164 | 1.9409 | 1.9105 | 1.7446 | 1.6908 | 1.7336 | 1.7464 | 1.7500 | 1.7590 | 1.7580 | 1.7620 | 1.7657 | 1.7720 | ||
| 1.5853 | 1.7549 | 1.8968 | 1.9701 | 1.9155 | 1.7528 | 1.6897 | 1.7309 | 1.7402 | 1.7591 | 1.7563 | 1.7607 | 1.7604 | 1.7762 | ||
| 1.6239 | 1.6532 | 1.7886 | 1.9184 | 1.9776 | 1.9304 | 1.7523 | 1.6878 | 1.7279 | 1.7522 | 1.7538 | 1.7591 | 1.7573 | 1.7647 | ||
| NaN | 1.6489 | 1.6724 | 1.7993 | 1.9237 | 1.9910 | 1.9325 | 1.7512 | 1.6846 | 1.7395 | 1.7450 | 1.7540 | 1.7550 | 1.7582 | ||
| NaN | NaN | 1.6547 | 1.6754 | 1.7984 | 1.9330 | 1.9935 | 1.9317 | 1.7473 | 1.6970 | 1.7291 | 1.7440 | 1.7478 | 1.7502 | ||
| NaN | NaN | NaN | 1.6560 | 1.6715 | 1.8062 | 1.9326 | 1.9893 | 1.9235 | 1.7578 | 1.6838 | 1.7267 | 1.7376 | 1.7407 | ||
| NaN | NaN | NaN | NaN | 1.6526 | 1.6789 | 1.8052 | 1.9302 | 1.9815 | 1.9365 | 1.7465 | 1.6836 | 1.7237 | 1.7222 | ||
| NaN | NaN | NaN | NaN | NaN | 1.6606 | 1.6794 | 1.8026 | 1.9224 | 1.9943 | 1.9211 | 1.7483 | 1.6818 | 1.7154 | ||
| NaN | NaN | NaN | NaN | NaN | NaN | 1.6590 | 1.6753 | 1.7936 | 1.9316 | 1.9736 | 1.9156 | 1.7457 | 1.6728 | ||
| NaN | NaN | NaN | NaN | NaN | NaN | NaN | 1.6550 | 1.6660 | 1.8010 | 1.9081 | 1.9610 | 1.9026 | 1.7332 | ||
| NaN | NaN | NaN | NaN | NaN | NaN | NaN | NaN | 1.6450 | 1.6730 | 1.7752 | 1.8866 | 1.9276 | 1.8312 | ||
| NaN | NaN | NaN | NaN | NaN | NaN | NaN | NaN | NaN | 1.6509 | 1.6425 | 1.7422 | 1.7973 | 1.9083 | ||
| NaN | NaN | NaN | NaN | NaN | NaN | NaN | NaN | NaN | NaN | 1.6107 | 1.5687 | 1.7232 | 2.0355 | ||
| NaN | NaN | NaN | NaN | NaN | NaN | NaN | NaN | NaN | NaN | NaN | 1.6165 | 1.8079 | 2.0373 | ||
| NaN | NaN | NaN | NaN | NaN | NaN | NaN | NaN | NaN | NaN | NaN | NaN | 1.9495 | 1.9564 | ||
| NaN | NaN | NaN | NaN | NaN | NaN | NaN | NaN | NaN | NaN | NaN | NaN | NaN | 1.9366 | ||
| Rate parameter, | |||||||||||||||
| Orbit inclination, i | |||||||||||||||
| ES latitude, | 9.1342 | 9.5174 | 9.5944 | 9.3135 | 8.7818 | 8.7807 | 8.7426 | 8.7223 | 8.6959 | 8.6881 | 8.6741 | 8.6742 | 8.6742 | 8.6766 | |
| 9.7966 | 10.3752 | 9.7881 | 8.8842 | 8.8110 | 8.7746 | 8.7474 | 8.7192 | 8.7038 | 8.6957 | 8.6905 | 8.6867 | 8.6685 | 8.6762 | ||
| 7.6274 | 8.2279 | 9.2022 | 9.6381 | 9.2692 | 8.7674 | 8.7567 | 8.7267 | 8.6895 | 8.6886 | 8.6647 | 8.6670 | 8.6692 | 8.6931 | ||
| 6.6080 | 7.3062 | 8.2988 | 9.2230 | 9.6287 | 9.2905 | 8.7538 | 8.7376 | 8.6938 | 8.7173 | 8.6821 | 8.6788 | 8.6626 | 8.7096 | ||
| 6.8179 | 6.5901 | 7.3007 | 8.3061 | 9.2175 | 9.6659 | 9.2847 | 8.7465 | 8.7247 | 8.7338 | 8.7024 | 8.6934 | 8.6663 | 8.6864 | ||
| NaN | 6.7566 | 6.5695 | 7.2854 | 8.3000 | 9.2485 | 9.6723 | 9.2833 | 8.7361 | 8.7599 | 8.7128 | 8.7018 | 8.6785 | 8.6748 | ||
| NaN | NaN | 6.7136 | 6.5383 | 7.2623 | 8.3150 | 9.2536 | 9.6715 | 9.2719 | 8.7749 | 8.7319 | 8.7107 | 8.6841 | 8.6771 | ||
| NaN | NaN | NaN | 6.6823 | 6.5095 | 7.2720 | 8.3100 | 9.2416 | 9.6468 | 9.3038 | 8.7408 | 8.7284 | 8.6969 | 8.6821 | ||
| NaN | NaN | NaN | NaN | 6.6578 | 6.5203 | 7.2661 | 8.3021 | 9.2209 | 9.6820 | 9.2726 | 8.7454 | 8.7268 | 8.6719 | ||
| NaN | NaN | NaN | NaN | NaN | 6.6751 | 6.5234 | 7.2610 | 8.2885 | 9.2550 | 9.6393 | 9.2808 | 8.7496 | 8.7354 | ||
| NaN | NaN | NaN | NaN | NaN | NaN | 6.6781 | 6.5207 | 7.2526 | 8.3177 | 9.2060 | 9.6285 | 9.2832 | 8.7699 | ||
| NaN | NaN | NaN | NaN | NaN | NaN | NaN | 6.6827 | 6.5200 | 7.2868 | 8.2773 | 9.1899 | 9.6123 | 9.3061 | ||
| NaN | NaN | NaN | NaN | NaN | NaN | NaN | NaN | 6.6921 | 6.5679 | 7.2625 | 8.2650 | 9.1523 | 9.5221 | ||
| NaN | NaN | NaN | NaN | NaN | NaN | NaN | NaN | NaN | 6.7600 | 6.5619 | 7.2685 | 8.1612 | 9.4608 | ||
| NaN | NaN | NaN | NaN | NaN | NaN | NaN | NaN | NaN | NaN | 6.7813 | 6.5664 | 7.5990 | 9.0780 | ||
| NaN | NaN | NaN | NaN | NaN | NaN | NaN | NaN | NaN | NaN | NaN | 7.2701 | 7.4458 | 8.0980 | ||
| NaN | NaN | NaN | NaN | NaN | NaN | NaN | NaN | NaN | NaN | NaN | NaN | 7.7161 | 6.9900 | ||
| NaN | NaN | NaN | NaN | NaN | NaN | NaN | NaN | NaN | NaN | NaN | NaN | NaN | 6.3842 | ||
| Shape parameter, a | |||||||||||||||
| Orbit inclination, i | |||||||||||||||
| ES latitude, | 2.0864 | 1.9884 | 1.8169 | 1.7943 | 1.6412 | 1.7248 | 1.7438 | 1.7550 | 1.7609 | 1.7664 | 1.7714 | 1.7707 | 1.7703 | 1.7721 | |
| 2.2116 | 2.1213 | 1.8764 | 1.5897 | 1.7065 | 1.7368 | 1.7513 | 1.7599 | 1.7645 | 1.7665 | 1.7747 | 1.7742 | 1.7748 | 1.7745 | ||
| 1.7923 | 1.7348 | 1.9270 | 1.9337 | 1.8142 | 1.6412 | 1.7269 | 1.7468 | 1.7539 | 1.7655 | 1.7619 | 1.7680 | 1.7676 | 1.7691 | ||
| 1.5297 | 1.7356 | 1.8821 | 1.9664 | 1.9519 | 1.8180 | 1.6389 | 1.7278 | 1.7445 | 1.7576 | 1.7543 | 1.7642 | 1.7655 | 1.7646 | ||
| 1.6239 | 1.6565 | 1.7779 | 1.9041 | 1.9797 | 1.9592 | 1.8191 | 1.6388 | 1.7249 | 1.7473 | 1.7510 | 1.7577 | 1.7601 | 1.7588 | ||
| NaN | 1.6591 | 1.6767 | 1.7915 | 1.9167 | 1.9911 | 1.9649 | 1.8231 | 1.6361 | 1.7307 | 1.7462 | 1.7516 | 1.7553 | 1.7561 | ||
| NaN | NaN | 1.6676 | 1.6810 | 1.7985 | 1.9204 | 1.9936 | 1.9658 | 1.8162 | 1.6417 | 1.7218 | 1.7392 | 1.7478 | 2.1573 | ||
| NaN | NaN | NaN | 1.6709 | 1.6870 | 1.8007 | 1.9238 | 1.9959 | 1.9608 | 1.8265 | 1.6329 | 1.7194 | 1.7363 | 2.6343 | ||
| NaN | NaN | NaN | NaN | 1.6724 | 1.6879 | 1.8011 | 1.9240 | 1.9903 | 1.9688 | 1.8155 | 1.6332 | 1.7164 | 1.7308 | ||
| NaN | NaN | NaN | NaN | NaN | 1.6746 | 1.6876 | 1.8010 | 1.9156 | 1.9949 | 1.9541 | 1.8130 | 1.6334 | 1.7091 | ||
| NaN | NaN | NaN | NaN | NaN | NaN | 1.6731 | 1.6855 | 1.7926 | 1.9201 | 1.9743 | 1.9451 | 1.8060 | 1.6291 | ||
| NaN | NaN | NaN | NaN | NaN | NaN | NaN | 1.6700 | 1.6776 | 1.7929 | 1.8943 | 1.9580 | 1.9234 | 1.7826 | ||
| NaN | NaN | NaN | NaN | NaN | NaN | NaN | NaN | 1.6603 | 1.6760 | 1.7682 | 1.8697 | 1.9093 | 1.7970 | ||
| NaN | NaN | NaN | NaN | NaN | NaN | NaN | NaN | NaN | 1.6585 | 1.6442 | 1.7219 | 1.7171 | 1.9728 | ||
| NaN | NaN | NaN | NaN | NaN | NaN | NaN | NaN | NaN | NaN | 1.6097 | 1.5173 | 1.7822 | 2.0709 | ||
| NaN | NaN | NaN | NaN | NaN | NaN | NaN | NaN | NaN | NaN | NaN | 1.6951 | 1.8594 | 2.0537 | ||
| NaN | NaN | NaN | NaN | NaN | NaN | NaN | NaN | NaN | NaN | NaN | NaN | 1.9798 | 1.9692 | ||
| NaN | NaN | NaN | NaN | NaN | NaN | NaN | NaN | NaN | NaN | NaN | NaN | NaN | 1.9458 | ||
| Rate parameter, | |||||||||||||||
| Orbit inclination, i | |||||||||||||||
| ES latitude, | 8.8196 | 9.3308 | 9.1861 | 9.2502 | 8.5489 | 8.5670 | 8.5293 | 8.5090 | 8.4907 | 8.4811 | 8.4812 | 8.4660 | 8.4518 | 8.4567 | |
| 9.3468 | 10.0676 | 9.8322 | 8.6449 | 8.6084 | 8.5685 | 8.5380 | 8.5164 | 8.4966 | 8.4795 | 8.4907 | 8.4766 | 8.4677 | 8.4626 | ||
| 7.5795 | 7.7597 | 8.7975 | 9.3397 | 9.2387 | 8.5089 | 8.5396 | 8.5159 | 8.4881 | 8.4885 | 8.4597 | 8.4644 | 8.4493 | 8.4529 | ||
| 6.4075 | 7.0547 | 7.9508 | 8.8251 | 9.3577 | 9.2367 | 8.4880 | 8.5318 | 8.5000 | 8.4924 | 8.4577 | 8.4679 | 8.4561 | 8.4484 | ||
| 6.7047 | 6.4674 | 7.0536 | 7.9492 | 8.8321 | 9.3703 | 9.2355 | 8.4831 | 8.5173 | 8.5034 | 8.4701 | 8.4654 | 8.4547 | 8.4423 | ||
| NaN | 6.6531 | 6.4384 | 7.0389 | 7.9545 | 8.8556 | 9.3818 | 9.2454 | 8.4746 | 8.5307 | 8.5031 | 8.4748 | 8.4606 | 8.4516 | ||
| NaN | NaN | 6.6111 | 6.4100 | 7.0327 | 7.9549 | 8.8569 | 9.3822 | 9.2265 | 8.4932 | 8.5107 | 8.4837 | 8.4704 | 11.6161 | ||
| NaN | NaN | NaN | 6.5857 | 6.4036 | 7.0290 | 7.9578 | 8.8601 | 9.3696 | 9.2579 | 8.4709 | 8.5067 | 8.4846 | 17.2642 | ||
| NaN | NaN | NaN | NaN | 6.5714 | 6.4000 | 7.0262 | 7.9577 | 8.8481 | 9.3920 | 9.2259 | 8.4777 | 8.5106 | 8.4929 | ||
| NaN | NaN | NaN | NaN | NaN | 6.5756 | 6.3990 | 7.0300 | 7.9416 | 8.8626 | 9.3530 | 9.2231 | 8.4927 | 8.5222 | ||
| NaN | NaN | NaN | NaN | NaN | NaN | 6.5769 | 6.4042 | 7.0208 | 7.9641 | 8.8185 | 9.3373 | 9.2172 | 8.5267 | ||
| NaN | NaN | NaN | NaN | NaN | NaN | NaN | 6.5872 | 6.4044 | 7.0426 | 7.9226 | 8.7991 | 9.3054 | 9.2177 | ||
| NaN | NaN | NaN | NaN | NaN | NaN | NaN | NaN | 6.5948 | 6.4369 | 7.0282 | 7.9128 | 8.7370 | 9.1203 | ||
| NaN | NaN | NaN | NaN | NaN | NaN | NaN | NaN | NaN | 6.6509 | 6.4375 | 7.0166 | 7.7056 | 9.2740 | ||
| NaN | NaN | NaN | NaN | NaN | NaN | NaN | NaN | NaN | NaN | 6.6702 | 6.3810 | 7.5445 | 8.7644 | ||
| NaN | NaN | NaN | NaN | NaN | NaN | NaN | NaN | NaN | NaN | NaN | 7.3375 | 7.3430 | 7.7934 | ||
| NaN | NaN | NaN | NaN | NaN | NaN | NaN | NaN | NaN | NaN | NaN | NaN | 7.5042 | 6.7684 | ||
| NaN | NaN | NaN | NaN | NaN | NaN | NaN | NaN | NaN | NaN | NaN | NaN | NaN | 6.2083 | ||
| Shape parameter, a | |||||||||||||||
| Orbit inclination, i | |||||||||||||||
| ES latitude, | 2.1133 | 2.0407 | 1.8663 | 1.8277 | 1.6851 | 1.7151 | 1.7434 | 1.7543 | 1.7634 | 1.7690 | 1.7730 | 1.7757 | 1.7747 | 1.7801 | |
| 2.2236 | 2.1664 | 1.9608 | 1.6623 | 1.6910 | 1.7328 | 1.7511 | 1.7601 | 1.7679 | 1.7742 | 1.7770 | 1.7779 | 1.7768 | 1.7844 | ||
| 1.8464 | 1.7634 | 1.9054 | 1.9463 | 1.8627 | 1.6881 | 1.7180 | 1.7460 | 1.7568 | 1.7711 | 1.7679 | 1.7719 | 1.7718 | 1.7758 | ||
| 1.5715 | 1.7152 | 1.8664 | 1.9610 | 1.9725 | 1.8702 | 1.6873 | 1.7189 | 1.7443 | 1.7574 | 1.7629 | 1.7669 | 1.7658 | 1.7698 | ||
| 1.6176 | 1.6582 | 1.7717 | 1.8939 | 1.9824 | 1.9815 | 1.8733 | 1.6862 | 1.7153 | 1.7485 | 1.7528 | 1.7588 | 1.7612 | 1.7578 | ||
| NaN | 1.6675 | 1.6827 | 1.7860 | 1.9111 | 1.9917 | 1.9878 | 1.8782 | 1.6867 | 1.7171 | 1.7421 | 1.7518 | 1.7559 | 1.7612 | ||
| NaN | NaN | 1.6781 | 1.6874 | 1.7972 | 1.9143 | 1.9936 | 1.9895 | 1.8745 | 1.6893 | 1.7104 | 1.7379 | 1.7453 | 1.7527 | ||
| NaN | NaN | NaN | 1.6799 | 1.6963 | 1.7986 | 1.9170 | 1.9978 | 1.9867 | 1.8777 | 1.6819 | 1.7081 | 1.7317 | 1.7418 | ||
| NaN | NaN | NaN | NaN | 1.6883 | 1.6955 | 1.7993 | 1.9211 | 1.9909 | 1.9881 | 1.8674 | 1.6807 | 1.7453 | 1.7237 | ||
| NaN | NaN | NaN | NaN | NaN | 1.6861 | 1.6955 | 1.7996 | 1.9118 | 1.9915 | 1.9746 | 1.8627 | 1.6781 | 1.6952 | ||
| NaN | NaN | NaN | NaN | NaN | NaN | 1.6849 | 1.6942 | 1.7925 | 1.9092 | 1.9715 | 1.9623 | 1.8499 | 1.6713 | ||
| NaN | NaN | NaN | NaN | NaN | NaN | NaN | 1.6842 | 1.6870 | 1.7886 | 1.8857 | 1.9512 | 1.9312 | 1.8113 | ||
| NaN | NaN | NaN | NaN | NaN | NaN | NaN | NaN | 1.6740 | 1.6828 | 1.7609 | 1.8523 | 1.8820 | 1.8489 | ||
| NaN | NaN | NaN | NaN | NaN | NaN | NaN | NaN | NaN | 1.6644 | 1.6463 | 1.6979 | 1.7474 | 2.0230 | ||
| NaN | NaN | NaN | NaN | NaN | NaN | NaN | NaN | NaN | NaN | 1.6026 | 1.5620 | 1.8330 | 2.0953 | ||
| NaN | NaN | NaN | NaN | NaN | NaN | NaN | NaN | NaN | NaN | NaN | 1.7623 | 1.8999 | 2.0647 | ||
| NaN | NaN | NaN | NaN | NaN | NaN | NaN | NaN | NaN | NaN | NaN | NaN | 2.0023 | 1.9790 | ||
| NaN | NaN | NaN | NaN | NaN | NaN | NaN | NaN | NaN | NaN | NaN | NaN | NaN | 1.9584 | ||
| Rate parameter, | |||||||||||||||
| Orbit inclination, i | |||||||||||||||
| ES latitude, | 8.5432 | 9.1399 | 9.0974 | 9.1202 | 8.5964 | 8.3881 | 8.3606 | 8.3318 | 8.3159 | 8.3014 | 8.2988 | 8.2944 | 8.2826 | 8.2926 | |
| 8.9698 | 9.7735 | 9.7793 | 8.8345 | 8.4312 | 8.3942 | 8.3640 | 8.3383 | 8.3238 | 8.3219 | 8.3099 | 8.3004 | 8.2846 | 8.3080 | ||
| 7.5197 | 7.6751 | 8.4453 | 9.0607 | 9.1342 | 8.5590 | 8.3611 | 8.3452 | 8.3173 | 8.3285 | 8.2929 | 8.2901 | 8.2799 | 8.2844 | ||
| 6.4748 | 6.8508 | 7.6660 | 8.4985 | 9.0872 | 9.1384 | 8.5429 | 8.3518 | 8.3260 | 8.3161 | 8.2966 | 8.2894 | 8.2711 | 8.2777 | ||
| 6.6023 | 6.3675 | 6.8675 | 7.6707 | 8.5195 | 9.1022 | 9.1422 | 8.5359 | 8.3333 | 8.3363 | 8.2948 | 8.2840 | 8.2721 | 8.2523 | ||
| NaN | 6.5665 | 6.3426 | 6.8486 | 7.6805 | 8.5340 | 9.1141 | 9.1546 | 8.5354 | 8.3373 | 8.3136 | 8.2950 | 8.2791 | 8.2811 | ||
| NaN | NaN | 6.5273 | 6.3099 | 6.8477 | 7.6785 | 8.5321 | 9.1163 | 9.1432 | 8.5477 | 8.3180 | 8.3065 | 8.2834 | 8.2823 | ||
| NaN | NaN | NaN | 6.4935 | 6.3074 | 6.8422 | 7.6793 | 8.5404 | 9.1072 | 9.1546 | 8.5241 | 8.3179 | 8.2998 | 8.2902 | ||
| NaN | NaN | NaN | NaN | 6.4955 | 6.3003 | 6.8407 | 7.6895 | 8.5230 | 9.1128 | 9.1241 | 8.5273 | 8.2834 | 8.2992 | ||
| NaN | NaN | NaN | NaN | NaN | 6.4891 | 6.3005 | 6.8438 | 7.6709 | 8.5293 | 9.0800 | 9.1167 | 8.5360 | 8.3301 | ||
| NaN | NaN | NaN | NaN | NaN | NaN | 6.4918 | 6.3065 | 6.8397 | 7.6762 | 8.4912 | 9.0590 | 9.1003 | 8.5634 | ||
| NaN | NaN | NaN | NaN | NaN | NaN | NaN | 6.5068 | 6.3106 | 6.8529 | 7.6475 | 8.4680 | 9.0132 | 9.0711 | ||
| NaN | NaN | NaN | NaN | NaN | NaN | NaN | NaN | 6.5164 | 6.3391 | 6.8386 | 7.6242 | 8.3726 | 9.0403 | ||
| NaN | NaN | NaN | NaN | NaN | NaN | NaN | NaN | NaN | 6.5571 | 6.3402 | 6.8044 | 7.6273 | 9.0766 | ||
| NaN | NaN | NaN | NaN | NaN | NaN | NaN | NaN | NaN | NaN | 6.5688 | 6.4544 | 7.4789 | 8.4834 | ||
| NaN | NaN | NaN | NaN | NaN | NaN | NaN | NaN | NaN | NaN | NaN | 7.3598 | 7.2366 | 7.5378 | ||
| NaN | NaN | NaN | NaN | NaN | NaN | NaN | NaN | NaN | NaN | NaN | NaN | 7.3162 | 6.5865 | ||
| NaN | NaN | NaN | NaN | NaN | NaN | NaN | NaN | NaN | NaN | NaN | NaN | NaN | 6.0765 | ||
| Weight matrix, | |||||||||||||||
| Orbit inclination, i | |||||||||||||||
| ES latitude, | 1 | 1 | 1 | 1 | 1 | 1 | 1 | 1 | 1 | 1 | 1 | 1 | 1 | 1 | |
| 1 | 0.9434 | 1 | 0.9259 | 1 | 1 | 1 | 1 | 1 | 1 | 1 | 1 | 1 | 1 | ||
| 1 | 1 | 1 | 1 | 1 | 1 | 1 | 1 | 1 | 1 | 1 | 1 | 1 | 1 | ||
| 1 | 1 | 1 | 1 | 1 | 1 | 1 | 1 | 1 | 1 | 1 | 1 | 1 | 1 | ||
| 1 | 1 | 1 | 1 | 1 | 1 | 1 | 1 | 1 | 1 | 1 | 1 | 1 | 1 | ||
| 1 | 1 | 1 | 1 | 1 | 1 | 1 | 1 | 1 | 1 | 1 | 1 | 1 | 1 | ||
| 1 | 1 | 1 | 1 | 1 | 1 | 1 | 1 | 1 | 1 | 1 | 1 | 1 | 1 | ||
| 1 | 1 | 1 | 1 | 1 | 1 | 1 | 1 | 1 | 1 | 1 | 1 | 1 | 1 | ||
| 1 | 1 | 1 | 1 | 1 | 1 | 1 | 1 | 1 | 1 | 1 | 1 | 1 | 1 | ||
| 1 | 1 | 1 | 1 | 1 | 1 | 1 | 1 | 1 | 1 | 1 | 1 | 1 | 1 | ||
| 1 | 1 | 1 | 1 | 1 | 1 | 1 | 1 | 1 | 1 | 1 | 1 | 1 | 1 | ||
| 1 | 1 | 1 | 1 | 1 | 1 | 1 | 1 | 1 | 1 | 1 | 1 | 1 | 1 | ||
| 1 | 1 | 1 | 1 | 1 | 1 | 1 | 1 | 1 | 1 | 1 | 1 | 1 | 1 | ||
| 1 | 1 | 1 | 1 | 1 | 1 | 1 | 1 | 1 | 1 | 1 | 1 | 1 | 0.9524 | ||
| 1 | 1 | 1 | 1 | 1 | 1 | 1 | 1 | 1 | 1 | 1 | 1 | 1 | 1 | ||
| 1 | 1 | 1 | 1 | 1 | 1 | 1 | 1 | 1 | 1 | 1 | 0.9524 | 1 | 1 | ||
| 1 | 1 | 1 | 1 | 1 | 1 | 1 | 1 | 1 | 1 | 1 | 1 | 1 | 1.1765 | ||
| 1 | 1 | 1 | 1 | 1 | 1 | 1 | 1 | 1 | 1 | 1 | 1 | 1 | 1.2500 | ||
| Weight matrix, | |||||||||||||||
| Orbit inclination, i | |||||||||||||||
| ES latitude, | 1 | 1 | 1 | 1 | 1 | 1 | 1 | 1 | 1 | 1 | 1 | 1 | 1 | 1 | |
| 1 | 1.0526 | 1 | 0.9524 | 1 | 1 | 1 | 1 | 1 | 1 | 1 | 1 | 1 | 1 | ||
| 1 | 1 | 1 | 1 | 1 | 1 | 1 | 1 | 1 | 1 | 1 | 1 | 1 | 1 | ||
| 1 | 1 | 1 | 1 | 1 | 1 | 1 | 1 | 1 | 1 | 1 | 1 | 1 | 1 | ||
| 1 | 1 | 1 | 1 | 1 | 1 | 1 | 1 | 1 | 1 | 1 | 1 | 1 | 1 | ||
| 1 | 1 | 1 | 1 | 1 | 1 | 1 | 1 | 1 | 1 | 1 | 1 | 1 | 1 | ||
| 1 | 1 | 1 | 1 | 1 | 1 | 1 | 1 | 1 | 1 | 1 | 1 | 1 | 1 | ||
| 1 | 1 | 1 | 1 | 1 | 1 | 1 | 1 | 1 | 1 | 1 | 1 | 1 | 1 | ||
| 1 | 1 | 1 | 1 | 1 | 1 | 1 | 1 | 1 | 1 | 1 | 1 | 1 | 1 | ||
| 1 | 1 | 1 | 1 | 1 | 1 | 1 | 1 | 1 | 1 | 1 | 1 | 1 | 1 | ||
| 1 | 1 | 1 | 1 | 1 | 1 | 1 | 1 | 1 | 1 | 1 | 1 | 1 | 1 | ||
| 1 | 1 | 1 | 1 | 1 | 1 | 1 | 1 | 1 | 1 | 1 | 1 | 1 | 1 | ||
| 1 | 1 | 1 | 1 | 1 | 1 | 1 | 1 | 1 | 1 | 1 | 1 | 1 | 1 | ||
| 1 | 1 | 1 | 1 | 1 | 1 | 1 | 1 | 1 | 1 | 1 | 1 | 1 | 1 | ||
| 1 | 1 | 1 | 1 | 1 | 1 | 1 | 1 | 1 | 1 | 1 | 1 | 1 | 1 | ||
| 1 | 1 | 1 | 1 | 1 | 1 | 1 | 1 | 1 | 1 | 1 | 1 | 1 | 1 | ||
| 1 | 1 | 1 | 1 | 1 | 1 | 1 | 1 | 1 | 1 | 1 | 1 | 1 | 1 | ||
| 1 | 1 | 1 | 1 | 1 | 1 | 1 | 1 | 1 | 1 | 1 | 1 | 1 | 1.1111 | ||
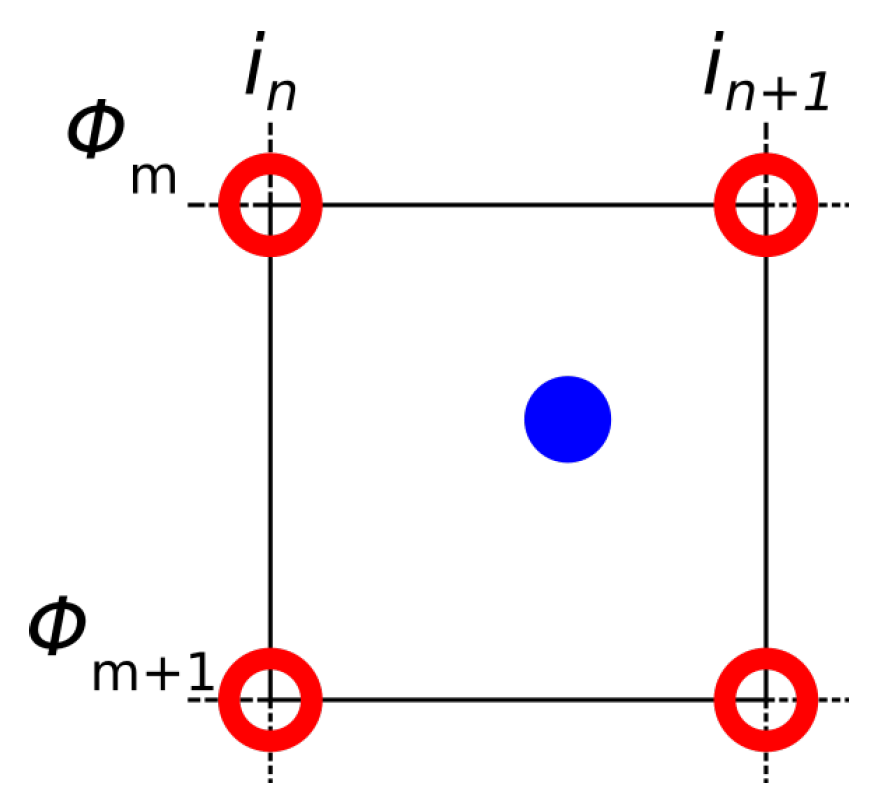
Appendix C
Interpolation for a Four-Point Mesh

References
- Crowe, K.; Raines, R. A model to describe the distribution of transmission path elevation angles to the Iridium and Globalstar satellite systems. IEEE Commun. Lett. 1999, 3, 242–244. [Google Scholar] [CrossRef]
- Li, S.Y.; Liu, C. An analytical model to predict the probability density function of elevation angles for LEO satellite systems. IEEE Commun. Lett. 2002, 6, 138–140. [Google Scholar] [CrossRef]
- Corazza, G.; Vatalaro, F. A statistical model for land mobile satellite channels and its application to nongeostationary orbit systems. IEEE Trans. Veh. Technol. 1994, 43, 738–742. [Google Scholar] [CrossRef]
- Davoli, F.; Kourogiorgas, C.; Marchese, M.; Panagopoulos, A.; Patrone, F. Small satellites and CubeSats: Survey of structures, architectures, and protocols. Int. J. Satell. Commun. Netw. 2019, 37, 343–359. [Google Scholar] [CrossRef]
- del Portillo, I.; Cameron, B.G.; Crawley, E.F. A technical comparison of three low earth orbit satellite constellation systems to provide global broadband. Acta Astronaut. 2019, 159, 123–135. [Google Scholar] [CrossRef]
- Popescu, O. Power Budgets for CubeSat Radios to Support Ground Communications and Inter-Satellite Links. IEEE Access 2017, 5, 12618–12625. [Google Scholar] [CrossRef]
- Hu, J.; Li, G.; Bian, D.; Gou, L.; Wang, C. Optimal Power Control for Cognitive LEO Constellation With Terrestrial Networks. IEEE Commun. Lett. 2020, 24, 622–625. [Google Scholar] [CrossRef]
- Chobotov, V.A. Orbital Mechanics, 3rd ed.; AIAA: Reston, VA, USA, 2002. [Google Scholar]
- Gongora-Torres, J.M.; Vargas-Rosales, C.; Aragón-Zavala, A.; Villalpando-Hernandez, R. Link Budget Analysis for LEO Satellites Based on the Statistics of the Elevation Angle. IEEE Access 2022, 10, 14518–14528. [Google Scholar] [CrossRef]
- Kolawole, M.O. Satellite Communication Engineering; Marcel Dekker, Inc.: New York, NY, USA, 2002; Chapter 2. [Google Scholar]
- Zhengsheng, C.; Qinghua, Z.; Xuerui, L.; Dashuang, S.; Hao, L.; Runtao, Z.; Jinlong, C. A reference satellite selection method based on maximal elevation angle during the observation period. In Proceedings of the 2017 Forum on Cooperative Positioning and Service, CPGPS 2017, 2017, number 2017 Forum on Cooperative Positioning and Service, CPGPS 2017, Harbin, China, 19–21 May 2017; pp. 268–272. [Google Scholar]
- Seyedi, Y. A Trace-Time Framework for Prediction of Elevation Angle Over Land Mobile LEO Satellites Networks. Wirel. Pers. Commun. 2012, 62, 793–804. [Google Scholar] [CrossRef]
- Su, Y.; Liu, Y.; Zhou, Y.; Yuan, J.; Cao, H.; Shi, J. Broadband LEO Satellite Communications: Architectures and Key Technologies. IEEE Wirel. Commun. 2019, 26, 55–61. [Google Scholar] [CrossRef]
- Qu, Z.; Zhang, G.; Cao, H.; Xie, J. LEO Satellite Constellation for Internet of Things. IEEE Access 2017, 5, 18391–18401. [Google Scholar] [CrossRef]
- Lopez-Salamanca, J.J.; Seman, L.O.; Berejuck, M.D.; Bezerra, E.A. Finite-State Markov Chains Channel Model for CubeSats Communication Uplink. IEEE Trans. Aerosp. Electron. Syst. 2020, 56, 142–154. [Google Scholar] [CrossRef]
- Tropea, M.; De Rango, F. A Comprehensive Review of Channel Modeling for Land Mobile Satellite Communications. Electronics 2022, 11, 820. [Google Scholar] [CrossRef]
- Saeed, N.; Elzanaty, A.; Almorad, H.; Dahrouj, H.; Al-Naffouri, T.Y.; Alouini, M.S. CubeSat Communications: Recent Advances and Future Challenges. IEEE Commun. Surv. Tutor. 2020, 22, 1839–1862. [Google Scholar] [CrossRef]
- Kodheli, O.; Lagunas, E.; Maturo, N.; Sharma, S.K.; Shankar, B.; Montoya, J.F.M.; Duncan, J.C.M.; Spano, D.; Chatzinotas, S.; Kisseleff, S.; et al. Satellite Communications in the New Space Era: A Survey and Future Challenges. IEEE Commun. Surv. Tutor. 2021, 23, 70–109. [Google Scholar] [CrossRef]
- Arapoglou, P.D.; Liolis, K.; Bertinelli, M.; Panagopoulos, A.; Cottis, P.; De Gaudenzi, R. MIMO over Satellite: A Review. IEEE Commun. Surv. Tutor. 2011, 13, 27–51. [Google Scholar] [CrossRef]
- Baeza, V.M.; Lagunas, E.; Al-Hraishawi, H.; Chatzinotas, S. An Overview of Channel Models for NGSO Satellites. In Proceedings of the 2022 IEEE 96th Vehicular Technology Conference (VTC2022-Fall), London, UK, 26–29 September 2022; pp. 1–6. [Google Scholar] [CrossRef]
- Loo, C. A statistical model for a land mobile satellite link. IEEE Trans. Veh. Technol. 1985, 34, 122–127. [Google Scholar] [CrossRef]
- Lutz, E.; Cygan, D.; Dippold, M.; Dolainsky, F.; Papke, W. The Land Mobile Satellite Communication Channel-Recording, Statistics, and Channel Model. IEEE Trans. Veh. Technol. 1991, 40, 375–386. [Google Scholar] [CrossRef]
- Abdi, A.; Lau, W.C.; Alouini, M.S.; Kaveh, M. A new simple model for land mobile satellite channels: First- and second-order statistics. IEEE Trans. Wirel. Commun. 2003, 2, 519–528. [Google Scholar] [CrossRef]
- Fontan, F.; Vazquez-Castro, M.; Cabado, C.; Garcia, J.; Kubista, E. Statistical modeling of the LMS channel. IEEE Trans. Veh. Technol. 2001, 50, 1549–1567. [Google Scholar] [CrossRef]
- National Aeronautics and Space Administration. General Mission Analysis Tool (GMAT) Version R2022a. Available online: http://sourceforge.net/projects/gmat/ (accessed on 15 March 2022).
- Gongora-Torres, J.M. Time Series for LEO. Available online: https://figshare.com/articles/dataset/TimeSeries_zip/22292953 (accessed on 17 March 2022).
- Al-Hraishawi, H.; Chougrani, H.; Kisseleff, S.; Lagunas, E.; Chatzinotas, S. A Survey on Nongeostationary Satellite Systems: The Communication Perspective. IEEE Commun. Surv. Tutor. 2022, 25, 101–132. [Google Scholar] [CrossRef]
- Papoulis, A. Probability, Random Variables, and Stochastic Processes; McGraw-Hill: New York, NY, USA, 1984. [Google Scholar] [CrossRef]


| Dry Mass | Drag Area | Solar Radiation Pressure Area |
|---|---|---|
| 5 kg | 1 m | 1 m |
| Semi-Major Axis, a | Orbit Inclinations, i | |
|---|---|---|
| 1 | 7378 km | 20, 25, …, 85 |
| 2 | 7578 km | 20, 25, …, 85 |
| 3 | 7778 km | 20, 25, …, 85 |
| 4 | 7978 km | 20, 25, …, 85 |
| 5 | 8178 km | 20, 25, …, 85 |
| 6 | 8378 km | 20, 25, …, 85 |
| Latitude | Longitude | Latitude | Longitude | ||
|---|---|---|---|---|---|
| ES | 0 | 276.7121 | ES | 45 | 259.7121 |
| ES | 5 | 276.7121 | ES | 50 | 259.7121 |
| ES | 10 | 276.7121 | ES | 55 | 259.7121 |
| ES | 15 | 267.7121 | ES | 60 | 259.7121 |
| ES | 20 | 276.7121 | ES | 65 | 259.7121 |
| ES | 25 | 261.7121 | ES | 70 | 265.7121 |
| ES | 30 | 259.7121 | ES | 75 | 265.7121 |
| ES | 35 | 259.7121 | ES | 80 | 265.7121 |
| ES | 40 | 259.7121 | ES | −85 | 259.7121 |
| ES | 20 | 25 | 30 | 35 | 40 | 45 | 50 | 55 | 60 | 65 | 70 | 75 | 80 | 85 |
|---|---|---|---|---|---|---|---|---|---|---|---|---|---|---|
| 7378 km | 1.39 | 1.50 | 1.48 | 1.31 | 1.30 | 1.34 | 1.35 | 1.35 | 1.35 | 1.37 | 1.37 | 1.36 | 1.36 | 1.37 |
| 7578 km | 1.62 | 1.79 | 1.80 | 1.65 | 1.56 | 1.61 | 1.62 | 1.63 | 1.63 | 1.64 | 1.64 | 1.64 | 1.64 | 1.64 |
| 7778 km | 1.57 | 1.77 | 1.82 | 1.73 | 1.55 | 1.61 | 1.63 | 1.64 | 1.64 | 1.65 | 1.65 | 1.66 | 1.66 | 1.66 |
| 7978 km | 1.63 | 1.74 | 1.83 | 1.79 | 1.62 | 1.60 | 1.63 | 1.65 | 1.65 | 1.66 | 1.66 | 1.66 | 1.66 | 1.67 |
| 8178 km | 1.70 | 1.66 | 1.83 | 1.82 | 1.70 | 1.55 | 1.63 | 1.65 | 1.66 | 1.67 | 1.67 | 1.67 | 1.70 | 1.67 |
| 8378 km | 1.75 | 1.67 | 1.82 | 1.84 | 1.75 | 1.58 | 1.63 | 1.66 | 1.67 | 1.68 | 1.68 | 1.68 | 1.68 | 1.68 |
| ES | 20 | 25 | 30 | 35 | 40 | 45 | 50 | 55 | 60 | 65 | 70 | 75 | 80 | 85 |
|---|---|---|---|---|---|---|---|---|---|---|---|---|---|---|
| 7378 km | 7.51 | 8.71 | 9.34 | 8.88 | 8.40 | 8.42 | 8.40 | 8.36 | 8.34 | 8.39 | 8.38 | 8.35 | 8.35 | 8.36 |
| 7578 km | 7.86 | 9.13 | 9.91 | 9.74 | 9.05 | 9.02 | 8.99 | 8.97 | 8.93 | 8.95 | 8.94 | 8.93 | 8.91 | 8.91 |
| 7778 km | 7.45 | 8.55 | 9.41 | 9.56 | 8.83 | 8.73 | 8.70 | 8.67 | 8.64 | 8.66 | 8.64 | 8.64 | 8.63 | 8.64 |
| 7978 km | 7.41 | 8.08 | 8.98 | 9.33 | 8.88 | 8.48 | 8.46 | 8.44 | 8.40 | 8.41 | 8.39 | 8.39 | 8.38 | 8.39 |
| 8178 km | 7.38 | 7.59 | 8.60 | 9.07 | 8.88 | 8.18 | 8.26 | 8.24 | 8.22 | 8.22 | 8.20 | 8.18 | 8.26 | 8.18 |
| 8378 km | 7.34 | 7.47 | 8.27 | 8.82 | 8.83 | 8.21 | 8.09 | 8.08 | 8.06 | 8.05 | 8.03 | 8.02 | 8.00 | 8.02 |
| Diagonals Range | ||||
|---|---|---|---|---|
| Altitude | () | () | () | () |
| 1000 km | 1.470954 | 1.638425 | 1.450794 | 1.488802 |
| 1200 km | 1.707323 | 1.935321 | 1.721572 | 1.752709 |
| 1400 km | 1.712923 | 1.951520 | 1.746205 | 1.754760 |
| 1600 km | 1.723436 | 1.955254 | 1.782190 | 1.757023 |
| 1800 km | 1.731110 | 1.952362 | 1.796549 | 1.774827 |
| 2000 km | 1.741450 | 1.954794 | 1.836833 | 1.760709 |
| Diagonals Range | ||||
|---|---|---|---|---|
| Altitude | () | () | () | () |
| 1000 km | 7.037052 | 9.459459 | 9.075805 | 8.805617 |
| 1200 km | 7.391963 | 9.840010 | 9.640436 | 9.284945 |
| 1400 km | 7.130587 | 9.319436 | 9.412412 | 8.952740 |
| 1600 km | 6.943998 | 8.879456 | 9.242146 | 8.693598 |
| 1800 km | 6.791048 | 8.510588 | 9.041604 | 8.632867 |
| 2000 km | 6.675182 | 8.224503 | 8.941424 | 8.305444 |
| Empirical Result | Proposed Method’s Result | Empirical Result | Proposed Method’s Results | Empirical Result | Proposed Method’s Results | Empirical Result | Proposed Method’s Results | |
|---|---|---|---|---|---|---|---|---|
| ES latitude, | 30 | 45 | 20 | 85 | ||||
| Orbit inclination, | 30 | 65 | 75 | 85 | ||||
| Orbit altitude, | 1000 km | |||||||
| Shape parameter, a | – | 1.4710 | – | 1.6384 | – | 1.4888 | – | 1.8387 |
| Rate Parameter, | – | 7.0371 | – | 9.4595 | – | 8.8056 | – | 7.0371 |
| 24.55 | 23.09 | 19.43 | 19.74 | 20.24 | 19.70 | 27.70 | 26.66 | |
| 18.40 | 16.86 | 14.19 | 13.13 | 14.94 | 13.48 | 18.12 | 18.90 | |
| 34.77 | 31.13 | 29.77 | 27.96 | 30.55 | 28.24 | 35.48 | 33.23 | |
| 17.46 | 16.26 | 14.24 | 12.45 | 14.49 | 12.93 | 16.32 | 17.96 | |
| 44.33 | 39.66 | 40.12 | 37.03 | 40.39 | 37.38 | 42.73 | 40.91 | |
| 15.93 | 15.88 | 13.40 | 12.05 | 13.50 | 12.61 | 14.79 | 17.29 | |
| Four-Point Mesh Setup | |||||
|---|---|---|---|---|---|
| 1400 | 1600 | 1400 | 1600 | ||
| 1.9515 | 1.9552 | 9.3194 | 8.8794 | ||
| 1.9515 | 1.9552 | 9.3194 | 8.8794 | ||
| 1.9515 | 1.9552 | 9.3194 | 8.8794 | ||
| 1.7462 | 1.7822 | 9.4112 | 9.2215 | ||
| Obtained parameters from interpolation | |||||
| 1.8776 | 1.8929 | 9.3529 | 9.0025 | ||
| 1.8853 | 9.1777 | ||||
| Empirical parameters | |||||
| 1.9804 | 9.5987 | ||||
| Satellite 1 | Satellite 2 | |
|---|---|---|
| Dry mass | 5 kg | 200 kg |
| Drag area | 1 m | 10 m |
| Solar radiation pressure area | 1 m | 10 m |
Disclaimer/Publisher’s Note: The statements, opinions and data contained in all publications are solely those of the individual author(s) and contributor(s) and not of MDPI and/or the editor(s). MDPI and/or the editor(s) disclaim responsibility for any injury to people or property resulting from any ideas, methods, instructions or products referred to in the content. |
© 2023 by the authors. Licensee MDPI, Basel, Switzerland. This article is an open access article distributed under the terms and conditions of the Creative Commons Attribution (CC BY) license (https://creativecommons.org/licenses/by/4.0/).
Share and Cite
Gongora-Torres, J.M.; Vargas-Rosales, C.; Aragón-Zavala, A.; Villalpando-Hernandez, R. Elevation Angle Characterization for LEO Satellites: First and Second Order Statistics. Appl. Sci. 2023, 13, 4405. https://doi.org/10.3390/app13074405
Gongora-Torres JM, Vargas-Rosales C, Aragón-Zavala A, Villalpando-Hernandez R. Elevation Angle Characterization for LEO Satellites: First and Second Order Statistics. Applied Sciences. 2023; 13(7):4405. https://doi.org/10.3390/app13074405
Chicago/Turabian StyleGongora-Torres, Juan Misael, Cesar Vargas-Rosales, Alejandro Aragón-Zavala, and Rafaela Villalpando-Hernandez. 2023. "Elevation Angle Characterization for LEO Satellites: First and Second Order Statistics" Applied Sciences 13, no. 7: 4405. https://doi.org/10.3390/app13074405
APA StyleGongora-Torres, J. M., Vargas-Rosales, C., Aragón-Zavala, A., & Villalpando-Hernandez, R. (2023). Elevation Angle Characterization for LEO Satellites: First and Second Order Statistics. Applied Sciences, 13(7), 4405. https://doi.org/10.3390/app13074405