Article

Performance Predictions of Sci-Fi Films via Machine Learning

by
Amjed Al Fahoum
1,* and
Tahani A. Ghobon
2
1
Department of Biomedical Systems and Informatics Engineering, Hijjawi Faculty for Engineering Technology, Yarmouk University, Irbid 21163, Jordan
2
School of Engineering Technology, Al Hussein Technical University, Irbid 21163, Jordan
*
Author to whom correspondence should be addressed.
Appl. Sci. 2023, 13(7), 4312; https://doi.org/10.3390/app13074312
Submission received: 31 December 2022 / Revised: 13 February 2023 / Accepted: 23 March 2023 / Published: 29 March 2023
(This article belongs to the Special Issue Advanced Computing and Neural Networks Applied in Learning Systems)

Abstract

:
The films teenagers watch have a significant influence on their behavior. After witnessing a film starring an actor with a particular social habit or personality trait, viewers, particularly youngsters, may attempt to adopt the actor’s behavior. This study proposes an algorithm-based technique for predicting the market potential of upcoming science fiction films. Numerous science fiction films are released annually, and working in the film industry is both profitable and delightful. Before the film’s release, it is necessary to conduct research and make informed predictions about its success. In this investigation, different machine learning methods written in MATLAB are examined to identify and forecast the future performance of movies. Using 14 methods for machine learning, it was feasible to predict how individuals would vote on science fiction films. Due to their superior performance, the fine, medium, and weighted KNN algorithms were given more consideration. In comparison to earlier studies, the KNN-adopted methods displayed greater precision (0.89–0.93), recall (0.88–0.92), and accuracy (90.1–93.0%), as well as a rapid execution rate, more robust estimations, and a shorter execution time. These tabulated statistics illustrate that the weighted KNN method is effective and trustworthy. If several KNN algorithms targeting specific viewer behavior are logically coupled, the film business and its global expansion can benefit from precise and consistent forecast outcomes. This study illustrates how prospective data analytics could improve the film industry. It is possible to develop a model that predicts a film’s success, effect, and social behavior by assessing features that contribute to its success based on historical data.

1. Introduction

As a significant industry in its own right, the film industry also plays a significant role in international trade and marketing. Movies are powerful weapons that can change people’s minds and alter our lives. The movies that teens watch significantly impact their conduct, both positively and negatively, according to a study published in [1]. A study published in [2] found that people are more likely to smoke after watching a movie with a smoking character.
Some filming locations are fascinating to viewers and will stay that way for a long time, no matter the time of year or season. This factor is there because they have been in popular movies. As a result, movies are why vacation bookings are up [3]. Movies in the science fiction (sci-fi) genre get high marks from critics. There are several visually and technically impressive science fiction films. Award ceremonies often include competition from films in different categories, including science fiction. According to Table 1, SF movies can take several forms, including drama, romance, horror, thriller, adventure, and action. A significant impact of science fiction on culture and technology has been observed. The research found that showing middle school kids sci-fi movies helped them think of new ways to solve problems and better understand how technology works [4]. More research supports the idea that science fiction films inspire people to think about what they could create.
Moreover, they will pique people’s curiosity about robotics and AI [5]. One study shows that after watching the film “The Day After Tomorrow,” whose plot revolves around the sudden transition of Earth’s climate into a new ice age, viewers’ perspectives are changed, at least temporarily. Everyone who saw the film understood their role in maintaining a healthy ecosystem and a consistent climate [6]. How a culture will react to a new product depends on how quickly people adapt to it [7]. Many sources of information on movies can be found on the web. Anyone with access to these statistics can use them to infer the factors contributing to a film’s financial success. Manufacturers can use these characteristics to create more marketable goods. The movies made in Hollywood bring in much money. With 2015′s record-breaking USD 38 billion worldwide box office gross, 5 films grossed over USD 1 billion, the most for Hollywood [8]. The top-grossing movies were made by just six studios [9]: 20th Century Fox, Marvel Studios, Walt Disney Pictures, Columbia Pictures, and Warner Bros.
When deciding whether or not to make a film, a filmmaker must consider several factors, the most prominent of which is the film’s potential box office take. The film’s success can be measured by how well it does at the box office. Many things affect a movie’s performance at the box office, such as its genre, writers, directors, actors, length, year of release, producers, and production company. The firms that sell, promote, and market the film are crucial to its overall success [10]. There are too many variables at play for anyone to accurately predict the status of the market or the profit of a particular film. Many scientific papers have employed machine learning algorithms to predict how a movie will do at the box office, how popular it will be, and how it will be rated. In [11], the researchers suggested a methodology for predicting movie success that incorporates machine learning, social network analysis, and text mining approaches. Their model extracts many sorts of characteristics, such as “who”, “what”, “when”, and “hybrid”. They examined movie success from three perspectives: audience, release, and movie. Their data was obtained from IMDB and Box Office Mojo. In [12], the researchers compared the performance and outcomes of three supervised learning approach models to forecast revenue: the linear regression model, the logistic regression model, and the support vector machine regression model. Their data comes from IMDB, Rotten Tomatoes, and Wikipedia. The researchers suggested machine learning strategies to predict movie popularity [13]. They used and compared the following classifiers: Logistic Regression, Simple Logistic, Multilayer Perceptron, J48, Nave Bayes, and PART. Their data source is IMDB, and they categorized the movies as Terrible, Poor, Average, and Excellent based on their IMDB rating, which is the same technique used by [14]. In [14], they offered a machine learning strategy based on intrinsic features, employing C4.5, PART, and correlation coefficients to predict movie popularity categorization, whereas [15] proposed a data mining approach to assess and forecast movie ratings. Using data mining techniques, such as neural networks, regression, and decision trees, researchers devised a way to predict how much money a movie will make at the box office and estimate its profit [16]. Opus Data gathered the dataset used in this article. The dataset was then supplemented with IMDB, IDMB, Metacritic, and Mojo information. They created a mathematical model [17] to predict movie ratings and success for Hollywood and Bollywood films. The films were categorized as Flop, Neutral, or Hit. For classification, the KNN method was utilized. The information was gathered from IMDB and social media networks, such as Facebook, Instagram, and Twitter. In [18], the writers projected a film’s profitability to aid early-stage production finance decisions. Using social network analysis and text mining techniques, the team presents a system that can automatically extract information on a movie’s cast, narrative, and release date from several data sources. In comparison to other methods, their data confirmed the system’s effectiveness. The feature selection strategy they employed considerably improved the forecast’s accuracy. Through an analysis of the industry’s most influential driving forces, they wanted to create a decision-making tool that may be utilized. Using a mathematical model, in [19], they could accurately anticipate the performance of upcoming films at the box office. Budget, cast, director, producer, set location, narrative writer, movie release date, competing movies released simultaneously, music, release location, and target audience are just a few factors considered when evaluating a film’s success. They developed a model by evaluating how distinct traits interact with one another. Each important component was assigned a weight, and the prediction was developed based on them. In addition, they illustrated the approach’s prescriptive potential by demonstrating how it may be used to select a set of income-maximizing actors. Instead of depending on the opinions of critics and others, the researchers in [20] provide a method for forecasting a film’s performance at the box office before its release. This paper presents an approach for estimating an IMDb rating using the IMDb Movie Dataset. Several algorithms were included in the study’s analysis, but Random forest generated the most accurate predictions. It was discovered that the number of individuals who voted for the picture, the number of critics who reviewed it, the number of Facebook likes it earned, the film’s running length, and its overall box office profits all had a substantial impact on the film’s IMDb rating. Dramas and biopics are often the highest-quality examples of their respective film genres. In [21], researchers employed regression techniques to develop a model that considers multiple factors, assigns a weight to each element, and predicts the success or failure of forthcoming films based on the factor’s value. In [22], models were created to forecast the performance and ratings of a new film before its premiere. A revenue threshold was established based on heuristics to classify the film as successful or unsuccessful. The comments on teasers and trailers were collected from YouTube since they are quite helpful when rating a film. Natural Language Processing (NLP) was used to extract keywords from user evaluations, and those reviews were evaluated as positive or negative based on emotional analysis. A detailed comparison of the various machine learning models used to estimate the success rate of a movie was made in [23]. These models’ accuracy and statistical significance were examined to determine which is the best predictor. There are also some observations about aspects that impact the success of movies. The analyzed models include regression models, machine learning models, a time series model, and a neural network, with the neural network exhibiting the highest accuracy at about 86%. In addition, as part of the testing, statistics regarding 2020′s film releases were evaluated. The authors of [24] made sure that the success of casting a movie depends on many things, such as the type of movie, when it comes out, who is in it, and how much money it makes in total. Understanding the risks associated with a film’s release, which might affect its success or failure, can be an important step in expanding the film industry. As a result, they offered an ensemble learning technique to assess such comprehension, in which predictions from previously guided attribute computations may be utilized to improve future success/failure accuracy. Diverse methods are employed in the literature to examine and compare the generated data. The dataset is used with the machine learning algorithms SVM, KNN, Naive Bayes, Boosting Ensemble Technique, Stacking Ensemble Technique, Voting Ensemble Technique, and MLP Neural Network to guess how well a movie will do at the box office. In [24], they used many algorithms and their trends to predict the outcome of a movie and showed that the suggested method is better than the current research when these algorithms and trends are used. In [25], their study uses ML to forecast a movie’s performance before its release, reducing risk. The Twitter sentimental analysis calculates the movie’s polarity and subjectivity from user evaluations. Machine learning systems anticipate IMDb ratings using those data. Decision tree regression, SVR, and random forest regression create a predictive model. The study compared three methods to anticipate movie success [25] accurately. They created two models in [26] to achieve their prediction goals. The first model, the rate prediction model (RPM), predicts user satisfaction with the product using an ensemble regression model. The second model is a temporal-product popularity model (T-PPM) that predicts the product’s temporal popularity using a random forest classifier. They gathered a new dataset, TweetAMovie, to test the IMDb and Twitter model proposals [26]. In [27], multiple classification algorithms based on machine learning are used in our movie dataset for multiclassification. The primary purpose of this research is to compare the efficacy of various machine learning techniques. This study compared Multinomial Logistic Regression (MLR), Support Vector Machine (SVM), Bagging (BAG), Naive Bayes (NBS), and K-Nearest Neighbor (KNN). At the same time, the noise was reduced using All KEdited Nearest Neighbors (AKNNs) (AENNs). These techniques predict the net profit of a film using the prior IMDb dataset. The algorithms anticipate the box office earnings for each of these five methods. In [28], they developed a method for predicting movie success rates based on tweets about movie trailers. The results show the film’s rating as several stars (1–5). We collected tweets on several films following the release of their trailers using the hashtag approach (#Hash). They have trained and tested our models using four main algorithms (Naive Bayes, SVM, decision trees, and KNN) on the NLTK movie review corpora. Training datasets for machine learning were not readily available for movie ratings, so they turned to a lexicon-based method. These three dictionaries have various word counts; each is assigned a score indicating its polarity. Finally, they compared their results with those of other movie rating websites, such as IMDB, and found them satisfactory [28].
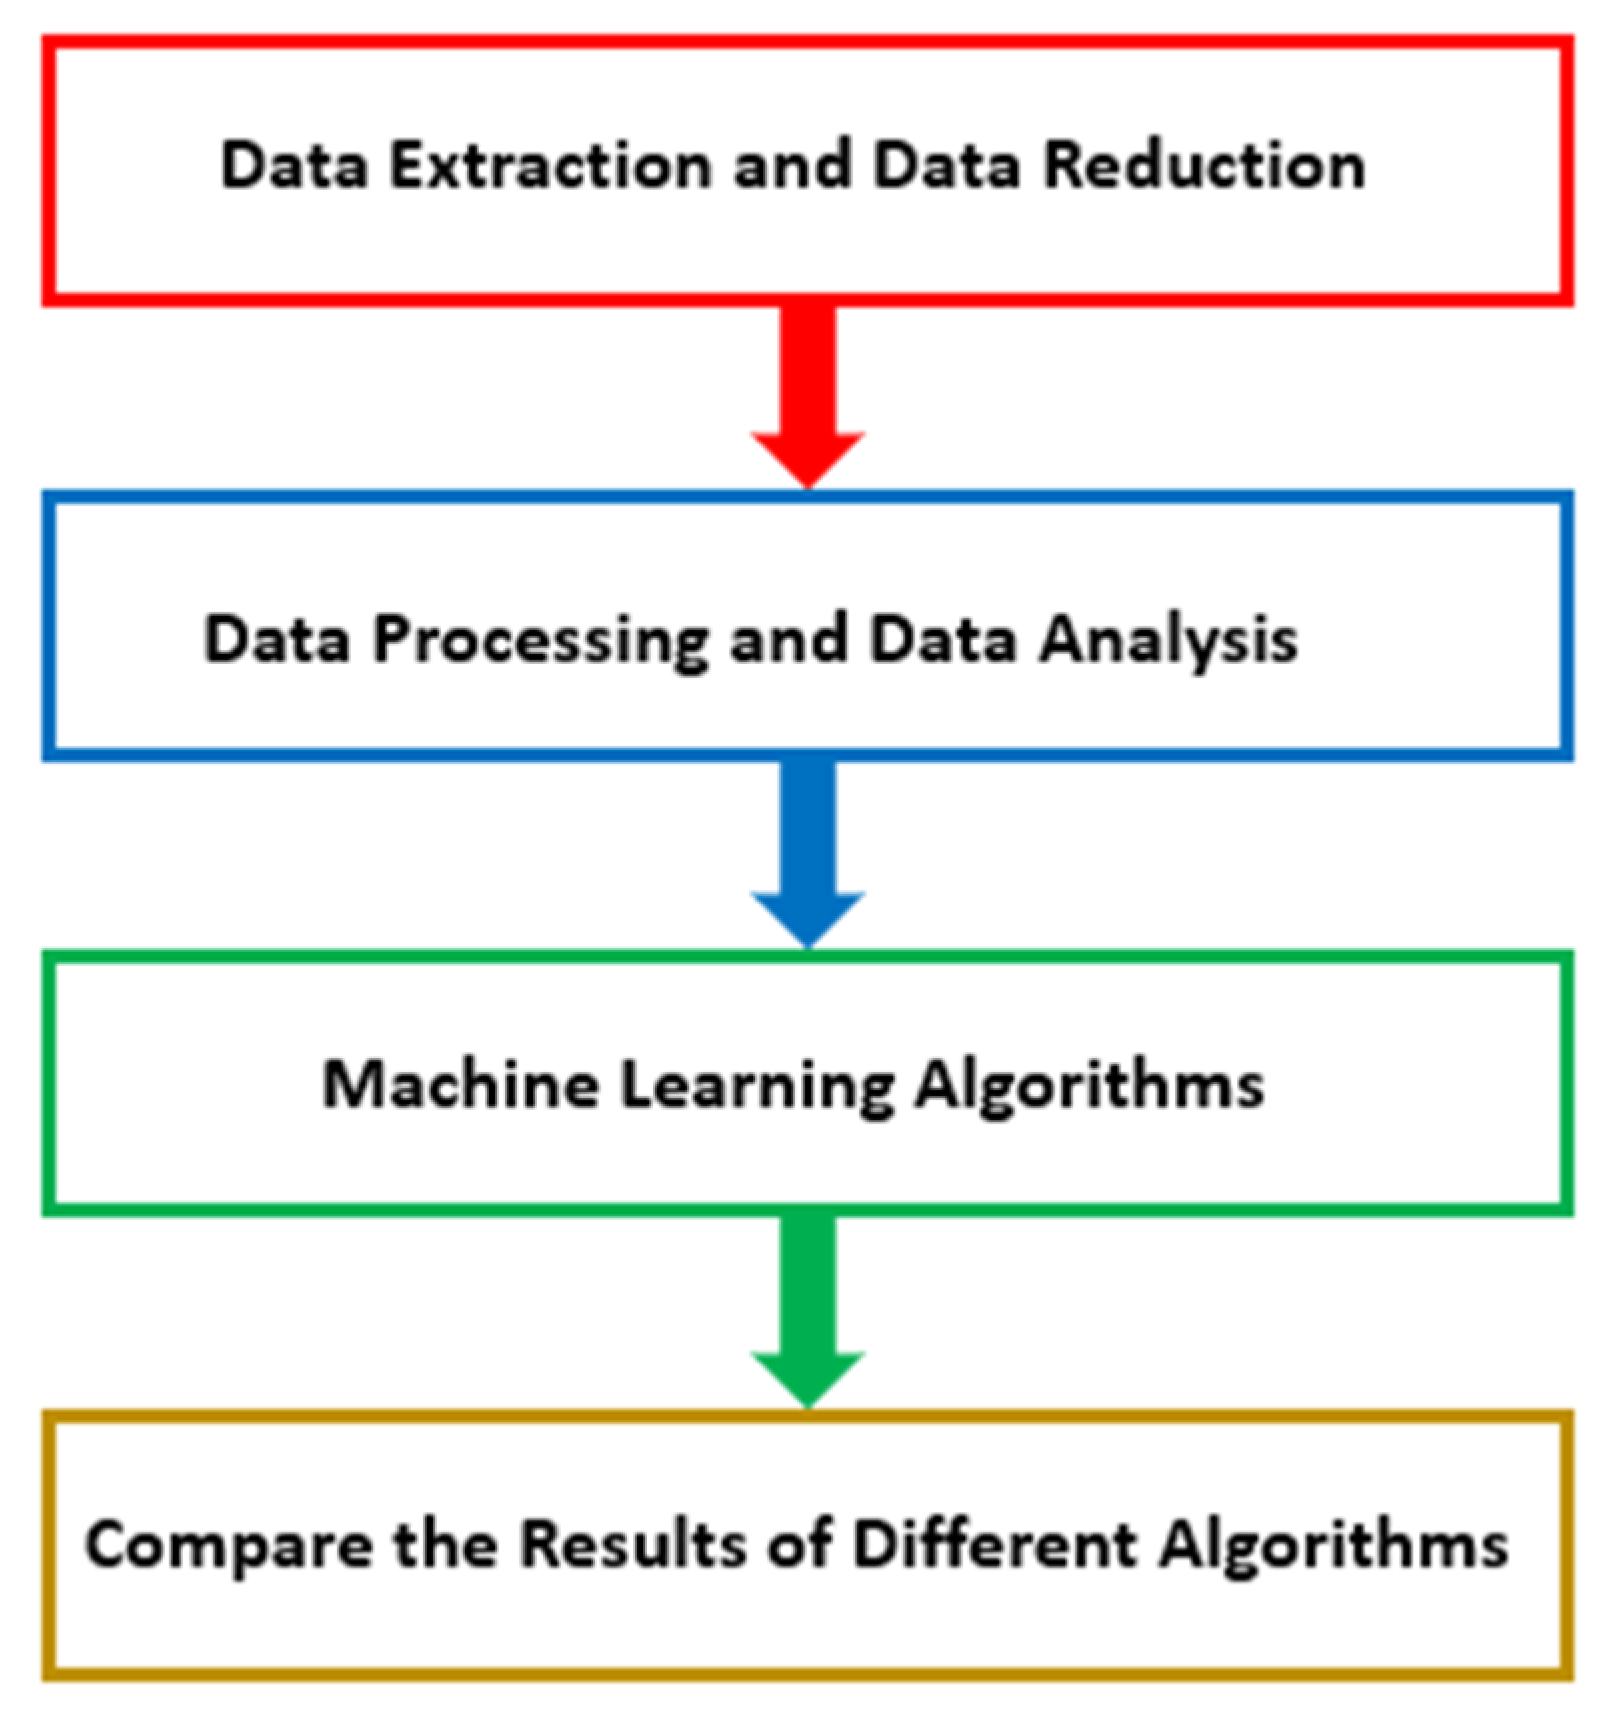
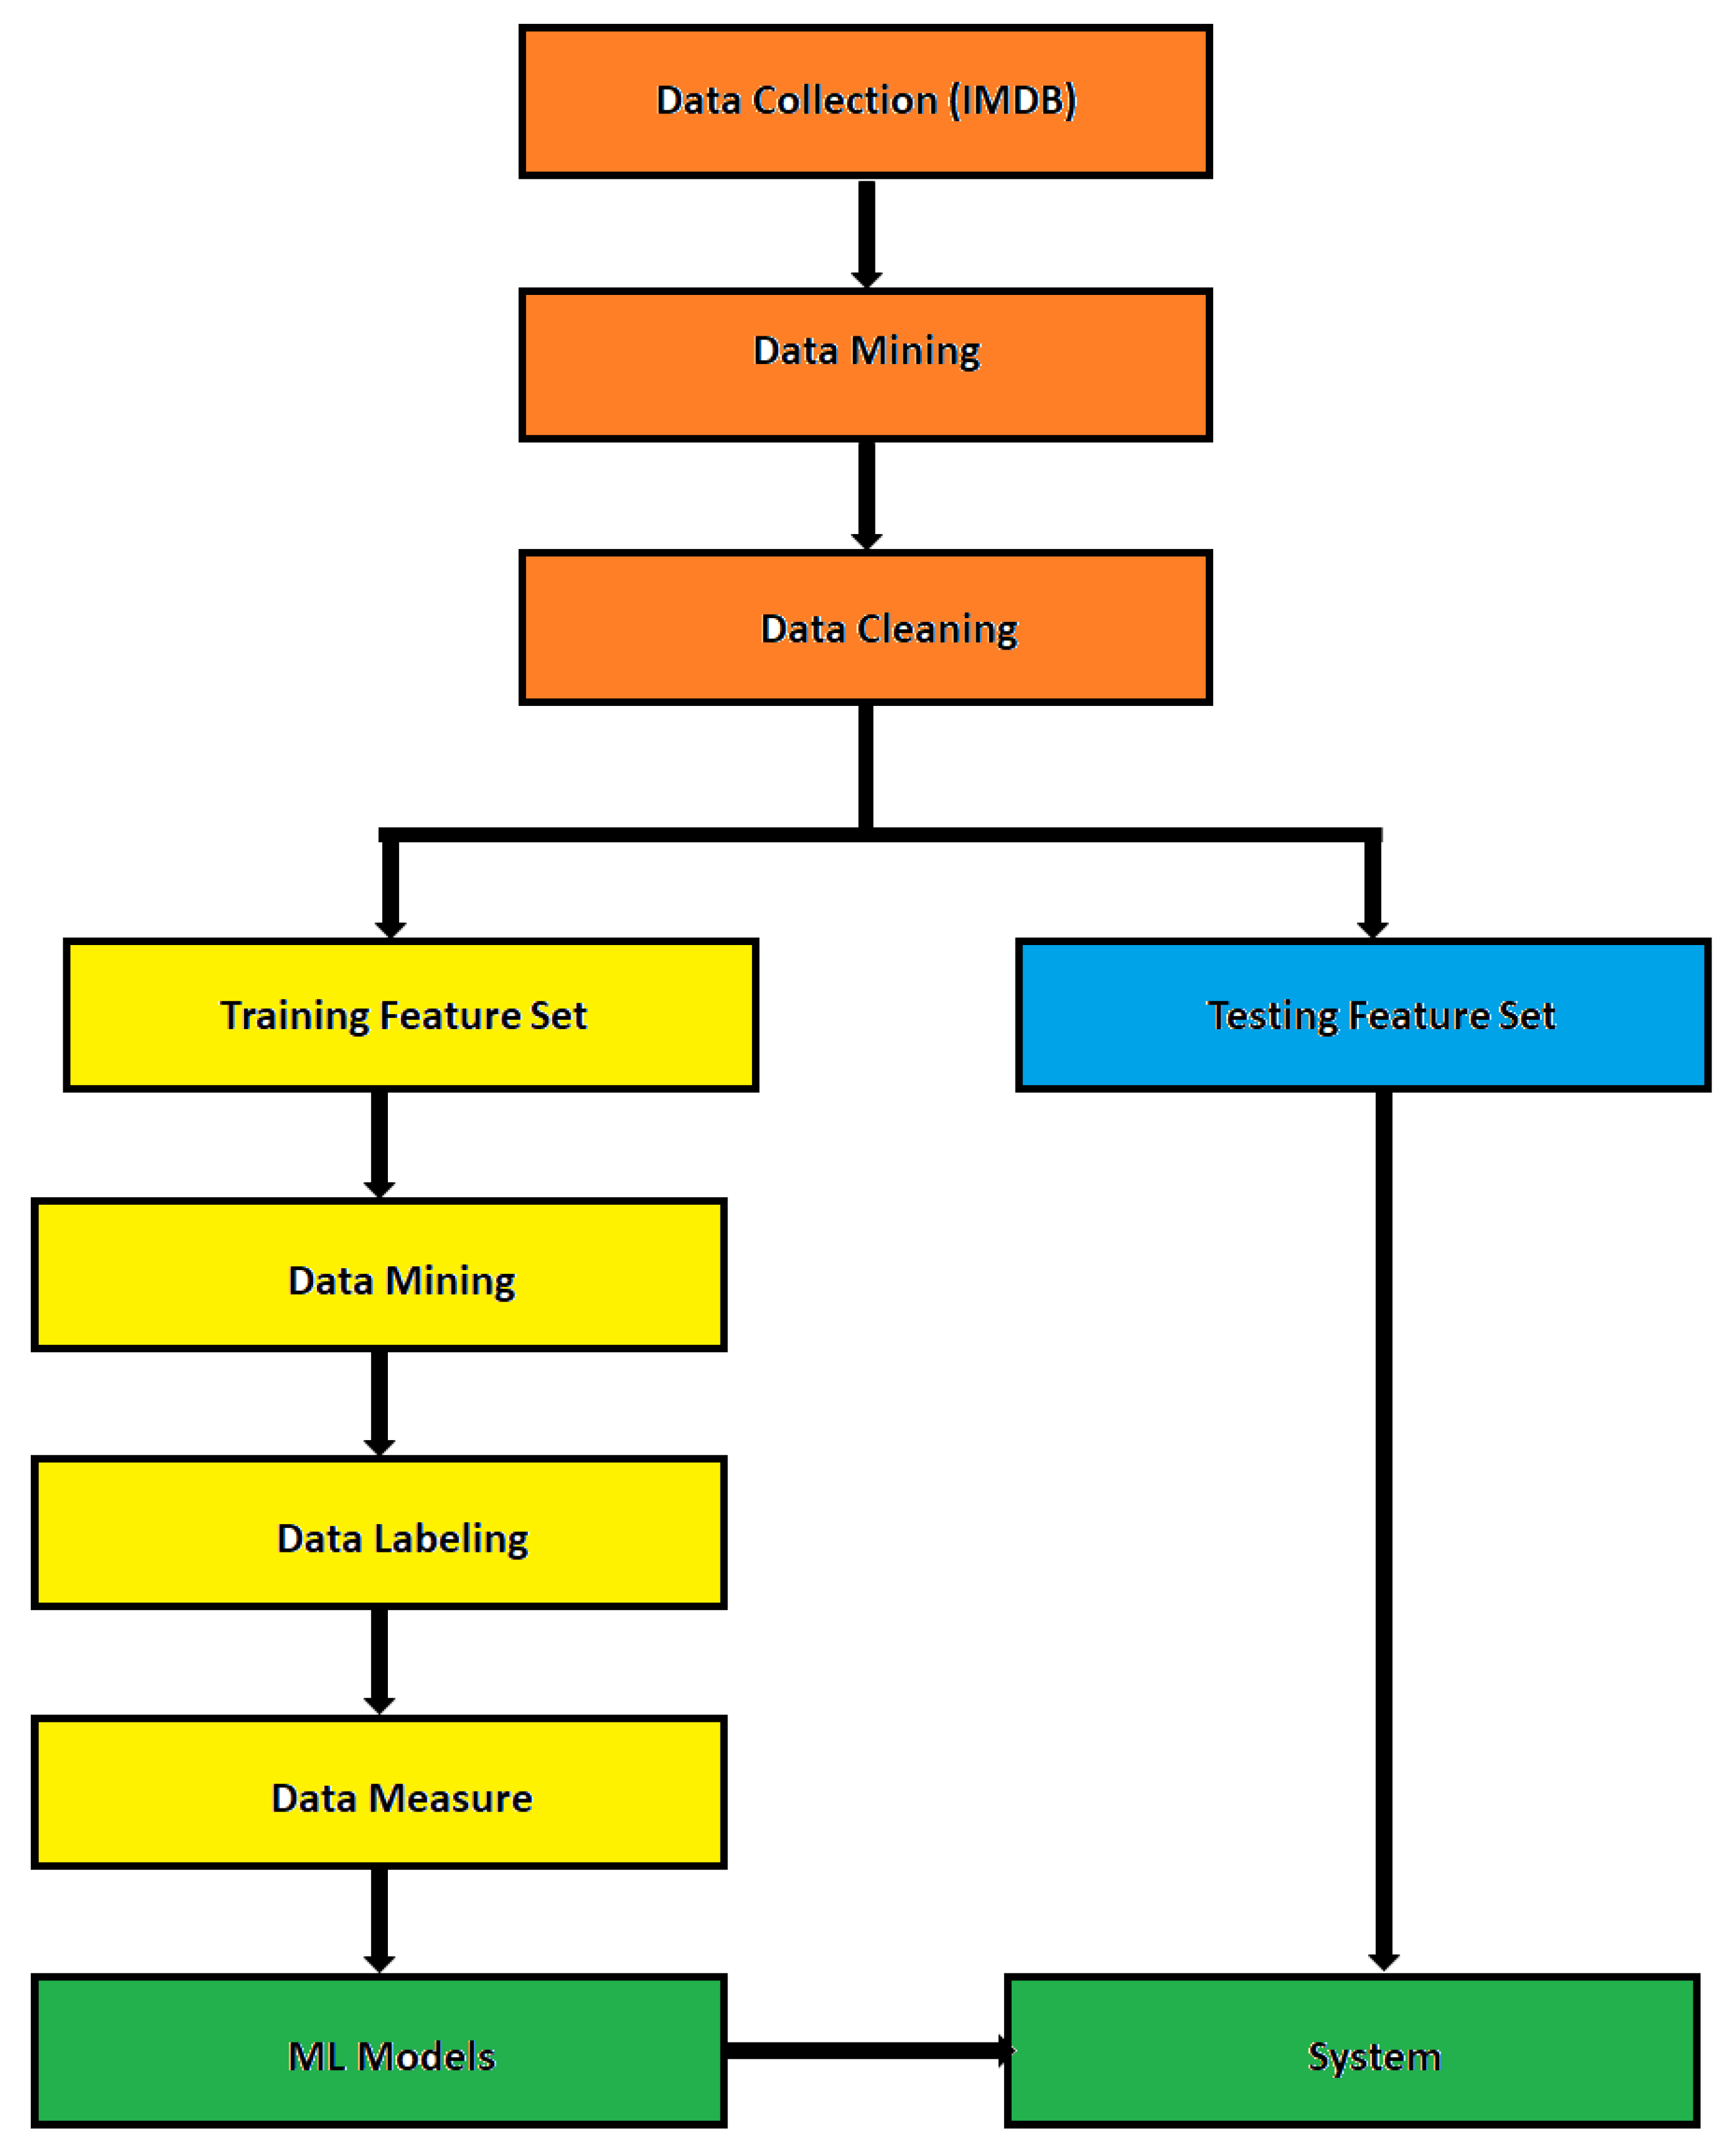
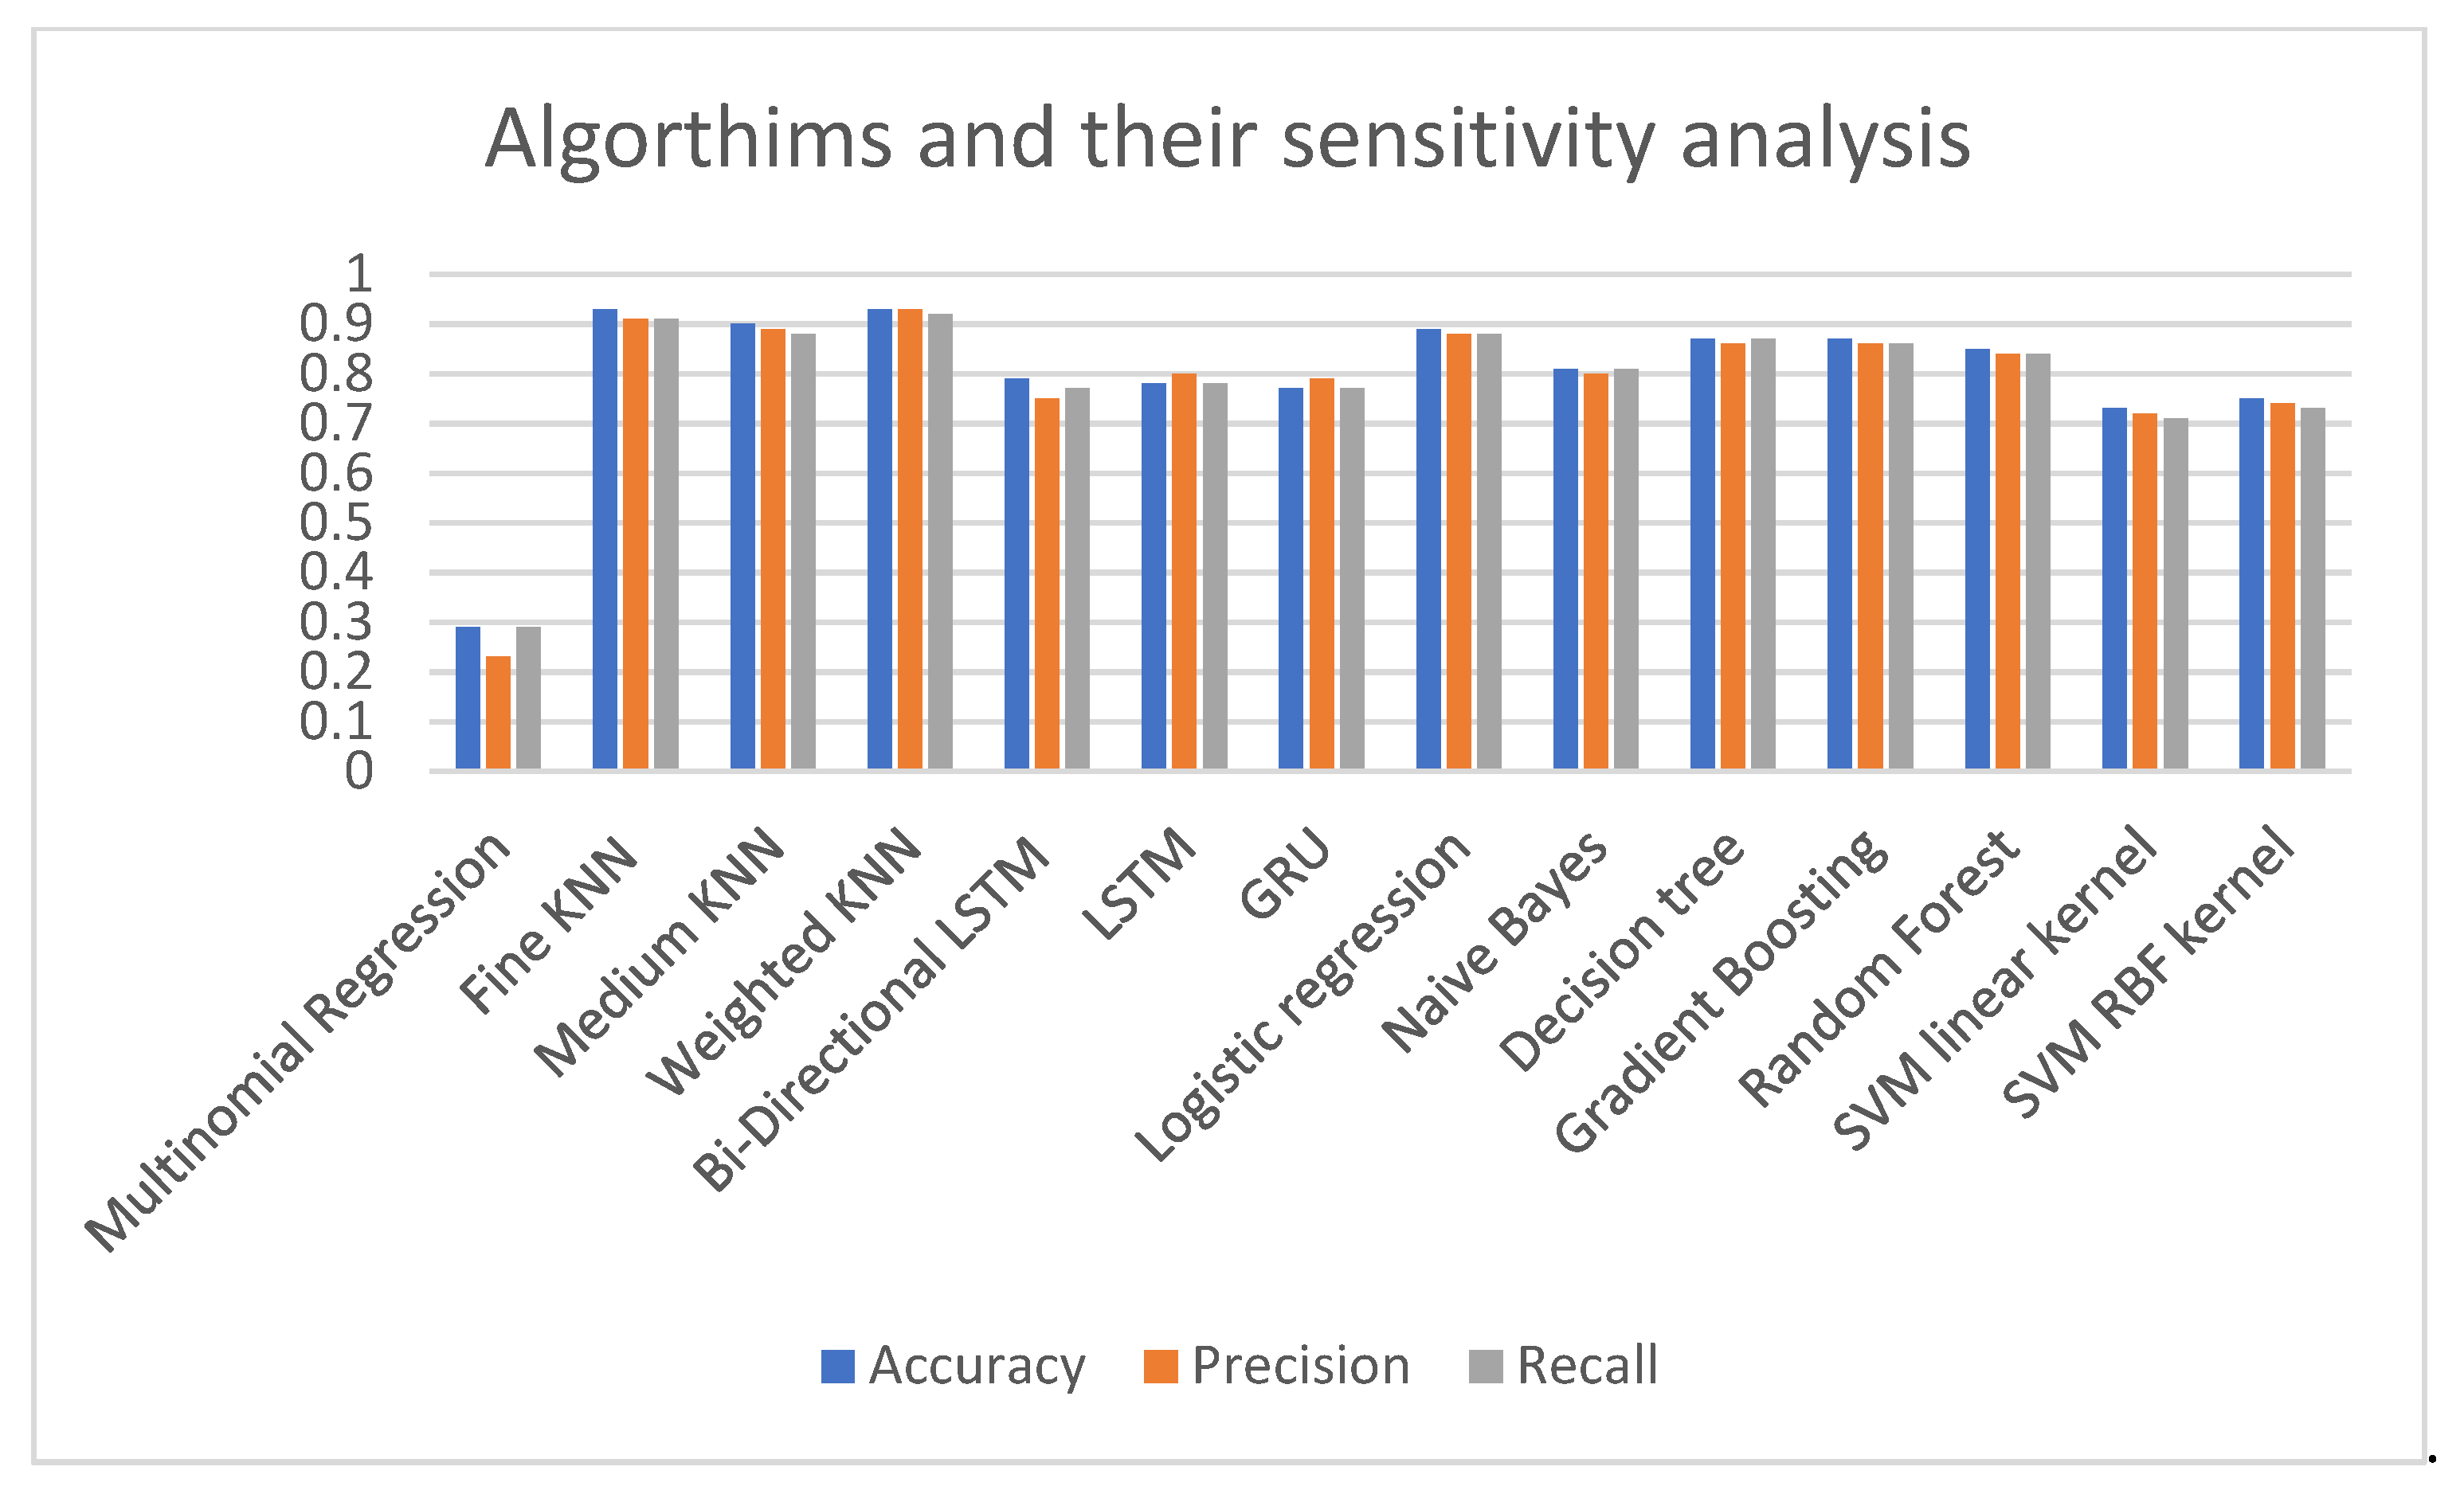
This study primarily assists with two primary outcomes by developing a viable method for predicting a film’s early success. This work demonstrates how diverse types of freely accessible data, including structured data, network data, and unstructured data, may be collected, merged, and analyzed to train machine learning algorithms. During the design and development of information system artifacts, these data-driven methodologies can assist firms with decision making by providing insightful predictions and recommendations. It is the most precise recommendation among the algorithms and actions that may be taken to obtain optimal results from these data and algorithms. Second, this research offers numerous innovative approaches for predicting the early success of movies. Included are the film’s plot, release date, producers, and directors, and we introduce a feature scoring approach that reduces the complexity of the optimization algorithm of the ML method. These elements demonstrated that each component substantially impacted the system’s performance and explained why movies are so popular. Contrary to the previous ML algorithms, this paper provides a modified KNN-ML approach as an alternate approach to open-space risk reduction that employs k-nearest neighbor approaches to discover discriminative characteristics of the feature set. This study aims to make a machine learning algorithm that improves on what we already know and gives a reasonable estimate of the success rate based on what we know, how we act, and how well the algorithm works. We will also show that our method has predictive value by showing how it can be used to suggest a group of agents that will bring in the most money. This study shows how predictive and prescriptive data analytics could help the science fiction movie industry in the future. However, it may be possible to create a model that can anticipate how a movie will do by analyzing box office returns and critic scores. This research uses 14 machine learning algorithms to make predictions about a film’s box office performance. These algorithms and their performance are evaluated and contrasted. The article is set up as follows. The next section lays out the theoretical basis for the proposed algorithm, the data collection process, the analysis, and the implementation of the machine learning algorithms. The implementation results are tabulated, and their outcomes are further monitored and thoroughly discussed. Finally, the conclusions are presented.

2. Methodology

As depicted in Figure 1, the suggested model in this work will undergo the following processes to increase its ability to forecast a film’s success.
-
Extraction and reduction of data
-
Data processing and analysis
-
Algorithms for machine learning
-
Evaluate the performance of various algorithms
Figure 1. Methodology.
Applsci 13 04312 g001

2.1. Data Extraction and Data Reduction

This work’s data was sourced predominantly from IMDB. IMDB is an online database that provides all data about movies, television, programs, home videos, video games, and streaming content, such as the names and ratings of actors, directors, writers, plot summaries, production crew, movie ratings, box office revenues, trailers, and more. Every movie on IMDB has a rating from 1 to 10. After extracting the data, all the unwanted files, movies of other genres other than sci-fi movies, TV series, movies with a running time of less than 1 h (60 min), and movies rated less than 1000 votes were excluded.
The following corrections are made from the initial dataset for films with missing or irrelevant information: the line containing the missing data was deleted, the empty fields with particular values were populated, and the values for the empty fields were calculated. After completing the described procedure, the final clean dataset contains 3151 movies. This dataset is used to produce the feature set.

2.2. Data Processing and Data Analysis

For analysis and classification purposes, the ratings are classified into four classes: flop, below average, average, and hit, as represented in Table 2. The same approach used in [29] is used in this paper. Data analysis and the study of the relationship between the factors that affect the movie’s success are critical. From the following four figures, we can extract meaningful data. Various plots were made from the data we extracted about sci-fi movies, and further data was extracted from these plots. The relationships between the run time in minutes and the popularity, the IMDB rating and the number of votes, and the IMDB rating and the run time in minutes are shown in Figure 2, Figure 3 and Figure 4, respectively. Moreover, Figure 5 shows the box office by month.
The highest-grossing science fiction movies of all time are shown in Table 3.

2.3. Feature Selection and Valuation

To identify the factors that may influence the movie’s success, a priori data from IMDB were analyzed to identify those features that strongly affect the movie’s rating. The regression of the parameters run time in minutes, year, number of votes, and box office are shown in Table 4.
It is evident from the table that these features are essential in determining the level of success—a strong positive correlation exists between run time, number of votes, and box office. However, a negative impact will affect the ratings over the years. The following data were also utilized as essential data to generate the feature vector for the ML algorithm: movie name, release year, release month, movie stars, directors, production studio, budget, IMDb Meta Score (Metacritic), IMDb rating, IMDb user vote, genres, and top actors’ social media followers (Instagram, Twitter, and Facebook). The analysis revealed a strong relationship between the factors described and the regression results. These factors play a significant role in movie success. By using these factors, calculating the success rate of an upcoming movie may be feasible. Every feature selected from the dataset was given a numerical value between 0 and 10 to mimic the overall rating criteria of the movie. The following table shows the features and their corresponding formulas that provide numerical values between 0 and 10.

2.4. Dataset Preparation

Figure 6 depicts the implementation structure of the proposed algorithm. The first step is data collection because predictions are based on historical information. Two popular and complementary sources, IMDb and Box Office, were selected to assess the algorithm’s efficacy. IMDb provides more detailed story summaries, while Box Office provides complete information on movie earnings and budgets. In other words, the two data sources can be combined to obtain data about several films. Regarding data collection techniques, the two sources are distinct. IMDb offers movie data via an application programming interface (API). The public can only access Box Office’s data through its website. The second step involves cleaning, transforming, consolidating, and storing data from both sources in a database. During this project, acquired data is formatted consistently, and duplicates are eliminated from the database. In film titles, only alphabetic and numeric characters are used. This standardization ensures that extraneous characters do not impede the matching of titles between the two data sources. The feature selection procedure ensures that representative weighting factors are introduced using only historical data, as shown in Table 5. The third step entails the creation of features that will ultimately be used to train a predictive model with the collected data. The feature set is partitioned into a training and testing feature set, in which 80 percent of the data is trained with the appropriate machine learning algorithm. When the feature vector has been determined, it is fed into the machine learning algorithm. A predictive model is trained using a complete and robust set of features. Employing machine learning techniques, the optimal prediction model and its parameters are identified based on accuracy, precision, and recall. The results are finally compiled and compared.

3. Machine Learning Algorithms

Numerous sectors have utilized information technology (IT) to create records, files, articles, photographs, scientific data, and other data types. To make better decisions based on the data collected by multiple apps, one must have a strategy for mining large datasets for insights. Researchers can extract significant insights from massive datasets by utilizing “knowledge discovery in databases” (KDD). Data mining (DM) uses various tools and algorithms to uncover and extract meaningful patterns from recorded data. Several disciplines have incorporated data mining approaches, including statistics, machine learning, pattern reorganization, artificial intelligence, and computational capabilities. Several techniques, including decision trees, neural networks, Naive Bayes, and K-Nearest Neighbor, are utilized in educational data mining (EDM). Examples of information discovery methods include classifications, association rules, and cluster analysis. One may use the collected data to forecast films’ impact, performance, and other results. Since its inception, nearest neighbor (NN) categorization has achieved widespread practical and academic use [30].
Its widespread popularity results from its ease of use and the quality of the programs it generates. Ultimately, the search demands considerable memory and computations, yet these factors rose and decreased after employing the NN method. NN classifiers identify an input based on its proximity to a training point neighbor (denoted X’). The K Nearest Neighbors methods are widely used in data mining and machine learning [31] due to their high precision. In addition to being one of the top ten DM techniques, this algorithm is effective and favorable in DM [30], pattern recognition [32], and machine learning [33]. The KNN classifier identifies the K training cases (Xr, r = 1…k) that are most similar to x and then classifies x based on the consensus of the k nearest neighbors. When working with massive amounts of training data, it may be essential to perform an excessive calculation due to the necessity of computing and ranking the distance between each training point and each new data point. Only the number of neighbors defines the complexity of KNN. The greater k, the smoother the extension of the classification border.
Consequently, as “k” increases, the complexity of KNN decreases. Supervised learning can increase KNN models’ categorization performance. The Nearest Prototype Classifier is a classification model that assigns observational class labels based on the training samples whose mean is closest to the observation. In addition, many NN classifiers can be created from the KNN classifier. The distance metric applied and the number of neighbors, represented by the K value, vary among these classifiers. Extracting relevant information or knowledge from raw data takes much work because data science was developed; consequently, it is desirable to use customized algorithms to process data.

KNN Algorithms

A vector represents each training sample in a multidimensional feature space and its corresponding class label. The training step of the method consists of just storing the feature vectors and class labels of the training instances. A user-defined constant k is utilized throughout the classification process to determine which label is more prevalent among the k training samples nearest to a query point. The Euclidean distance is commonly employed as a distance metric for continuous variables [33]. For discrete variables, such as text classification, an alternative metric, such as the overlap metric, may be used (or Hamming distance). In combination with Pearson and Spearman correlation coefficients, k-NN has been used to assess microarray data on gene expression. When the distance metric is learned with particular methods, such as large-margin nearest neighbor or neighboring component analysis, the accuracy of k-classification NN is frequently significantly enhanced [34]. When there is a disparity in the distribution of classes, the majority voting method fails. In other words, examples of a more common class tend to dominate the prediction of a new instance due to their dominance among the k nearest neighbors. One such option is incorporating a distance metric between the test site and its k nearest neighbors into the classification weighting procedure. Each of the k nearest points has its class (or value, in regression problems) enhanced by a weight proportional to the inverse distance between it and the test point. Abstraction in data representation is an additional method for addressing skew. In a self-organizing map (SOM), each node serves as a representation (center) of a cluster of similar points, regardless of their density in the original training data. The k-NN may then employ the SOM [35]. The optimal value of k will vary from dataset to dataset, but in general, more significant values of k lessen the influence of the noise on the classification at the expense of fewer clearly defined class borders. Multiple heuristics exist for choosing an appropriate k. The nearest neighbor approach is used in the rare scenario when the predicted class is the same as the class of the nearest training sample (i.e., when k = 1). Noise, irrelevant features, or incongruent feature scales can significantly impact the k-NN algorithm’s performance. Selecting or scaling characteristics to enhance categorization has been the subject of extensive study. Using evolutionary algorithms to finetune feature scaling is a common strategy. Another standard method is scaling features using the mutual information between the training data and the training classes. When solving a binary (two-class) classification issue, it is preferable to have k be an odd integer, so there are no ties. The bootstrap approach is often used to select the one that is best in this circumstance from an empirical perspective [36,37]. The kind of nearest neighbor classifier that assigns a point x to the same category as its closest neighbor in the feature space is the most intuitively understood. The one nearest neighbor classifier guarantees an error rate no worse than twice the Bayes error rate, even as the size of the training dataset approaches infinity (the minimum achievable error rate given the data distribution). Based on these considerations, we wish to categorize the science fiction films’ dataset and how their success may be scored, ascertain the classification structure, and display the relationships between the data item sets. This can aid in the early prediction of success rates and assist producers in discovering films with poor audience success and finding methods to improve them. The KNN has supervised learning; it is one of the simplest machine learning algorithms based on feature similarity. It can be used for both classification and regression problems. KNN is a classical non-parametric algorithm [38]; it preserves and uses the training data during the test point classification process. The distance between the training points and the test point is calculated, and then the KNN algorithm classifies the test point based on the closest neighbors of that point.
There are many distance formulas; the formula used in this paper is Euclidean distance, which is the most commonly used [39]. It is a particular case of the Minkowski distance where p = 2, cosine, and cubic Minkowski, which is also a case of the Minkowski where p = 3, depending on the algorithms.
Minkowski distance:
d x i , y i = x i y i p p
Euclidean distance:
d x i , y i = i = 1 n x i y i 2
Cosine distance:
d = 1 x i y i ( x i x i ) y i y i
Cubic Minkowski:
d x i , x j = i = 1 n   x i y i 3 3
where x i and x j are the test point and training point, respectively.
This study employed multiple KNN variants, including fine KNN, medium KNN, and weighted KNN. Table 6 displays the number of neighbors, the distance metric formula, and the distance weight for each type. The fine KNN has one neighbor, while the medium KNN has two, and the weighted KNN has 10. Fine KNN, medium KNN, and weighted KNN all employ Euclidean distance for their distance metrics. The equal distance (no distance weight) is used for fine KNN, medium KNN, and weighted KNN, while the squared inverse is used for weighted KNN. Further, other machine learning algorithms were implemented to compare the results and deduce certain features of the corresponding algorithm that may be considered for future adoption.

4. Results

The Receiver Operator Characteristic (ROC) is a probability curve representing the true positive rate versus the false positive rate. The area under the curve (AUC) is the measure of the ability of the classifier to distinguish between classes (separability). The confusion matrix and the AUC-ROC curve were analyzed to compare the results, in addition to the accuracy, prediction speed, and training time. The confusion matrix is an N × N matrix used to evaluate the classification model’s performance. Where N is the number of classes, in our example, N is 4, where the actual classes are on the y-axis, and the predicted classes are on the x-axis. The confusion matrix extracted each class’s true positive and false positive rates. The confusion matrix can generate the performance accuracy, precision, and recall measures [40].
A summary of the obtained results for different utilized KNN classifiers is provided in Table 7.
Figure 7 shows the AUC-ROC curves for one of the weighted KNN methods. Each subgraph represents the relationship between the true positive rate and the positive rate for the viewer’s opinion. Three main parameters are extracted from each graph: the ROC curve behavior, the AUC, and the accuracy of each classifier. The area under the receiver operating characteristic curves (AUC-ROCs) for one of the weighted KNN techniques is displayed in Figure 7; moving down the graph, it can be seen how the percentage of “yes” answers reflects the viewer’s confidence. Each graph is analyzed for its ROC curve behavior, AUC, and classifier accuracy, three key metrics.
An AUC of 0.99, a ROC point of 0.11, and a ROC that plateaus at a 1% true positive rate for a 0.18 percent false positive rate are all easily discernible in the graphic. However, the AUC for the below-average opinion is 0.99, the ROC point is (0.01, 0.94), and the ROC reaches one true positive rate at a false positive rate of 0.32, suggesting a more significant error is accomplished to guarantee the one true positive rate. Similarly, the flop opinion has an AUC of 1, the ROC point is (0.00, 0.93), and the ROC reaches a true positive rate of 1 at a false positive rate of 0 quickly. The ROC point for the hit opinion is (0.01, 0.6), and it achieves a true positive rate of 1 at a false positive rate of 0.2%, indicating that the rate of false positives is moderate.
Table 7 summarizes the results obtained when different KNN algorithms are implemented. The Fine KNN algorithm provides the highest accuracy of 93%, but it has the lowest speed among the three classes. On the other hand, the Medium KNN classifier has the highest accuracy for the Average class, with a value of 98%, but the lowest for the Hit class, with a value of 48%. The most consistent classifier is the weighted KNN classifier, which provides consistent estimates for average, below average, and flop at rates of 97%, 94%, and 93%, respectively. However, it did not perform as well with the Hit class as it did with others. The three classifiers somehow provide excellent accuracy, ranging from 90.3–93%.
Figure 8 and Table 8 summarize the results of various classification techniques. The results demonstrate their applicability and credibility by contrasting the provided algorithms’ findings with those in [41,42] and their citations.
The weighted KNN algorithm shows the highest and most robust results among the considered classifiers.

5. Discussion

This paper provides a modified KNN –ML approach as an alternate approach to open-space risk reduction that employs k-nearest neighbor approaches to discover discriminative characteristics. In order to study the role of k, we conduct contrastive learning with a variety of k values (within a given range) and compare the model’s performance in detecting out-of-domain (OOD) intents across the board (while other hyper-parameters remain constant). The results demonstrate that as the value of k is increased, the model’s performance (cosine-based) decreases across datasets. Indeed, this was to happen as k increased, and the possibility that an OOD sample would be incorrectly identified as in-domain (IND) decreased because of the decreased proportion of open space at the outset of the process. Later, as the IND semantic space shrank, a more significant percentage of intra-OOD samples were labeled as IND, and this trend tends to stabilize. Adopting this strategy also shows that the proposed method in this work is better than other methods for lowering the open-space risk, which is the risk that all IND intents from the same class will collide. These modifications to the KNN algorithm had a significant impact on the achieved results.
As listed in [18,19,20,21,22,23,24,25], the best achieved accuracy was very low compared to the tabulated results in this work. In [20], multiple algorithms were used for analysis; among these, the one with the highest prediction accuracy compared to previous studies was all random forest. The preliminary investigation revealed that the number of voting users, number of critics for reviews, number of Facebook likes, duration of the film, and gross receipts all significantly impact the IMDb score. Drama and biopic films were the best genre films [20]. Having mentioned that, it is evident that their approach depended not only on historical data, but also on future data, which limits its applicability. Furthermore, their results were below the tabulated results of this work. In [21], they analyzed some of the variables that can affect a film’s success and how these variables affect a film’s success over time. In their work, they came up with a model that considers many factors, gives each one a weight, and predicts whether a movie will do well or not based on how important each factor is. Their work could be enhanced so that their predictions are more accurate. However, more crucial indicators were required to evaluate their methodology and provide accurate statistics. Sivakumar, et al. trained an IMDb-extracted random forest algorithm to predict the success of a film. In addition, the Naive Bayer model was trained using YouTube user evaluations to estimate the rating of a movie [22]. The accuracy of the models was evaluated based on their performance on real-world datasets. Two results were reached: the rating of a new film cannot be anticipated in advance using the comments on its trailers and teasers on YouTube, while the success of a new film may be predicted in advance using online data or characteristics. An overall accuracy of 70% was achieved; however, they claimed that the success prediction model might be used as an early assessment tool for movies, which would benefit the movie business and its audience [22]. In [23], several ML models were analyzed. For each model, accuracy and statistical significance were evaluated to determine which model provided the most accurate predictions. There were more insights into the aspects that impact the success of movies. Regression models, machine learning models, a time series model, and a neural network were among the models evaluated. The neural network’s accuracy was approximately 86%. Additionally, 2020 film release statistics were examined as part of the assessment. In [24], gradient boosting was the most effective method in their analysis, with an 84.1287% success rate. According to the summary of the linked study, machine learning algorithms could help predict how well a movie will do by considering everything that could affect its success rate. Because of all, it might be possible to build on past results and make an algorithm that improves on the tested methods and gets better results. To further compare the results of this work, several works were summarized in [41,42]. In [41], three machine learning algorithms were analyzed and tabulated: Naive Bayes with 80.68% accuracy, Decision Trees C4.5 with 86.47% accuracy, and Logistic Regression with 89.98% accuracy. To predict movie success, the authors used a dataset from IMDB, and they classified the movies according to their IMDB rating into five classes: flop, average, good, hit, and super hit. In [42], they proposed a model to predict whether the movie would be a hit or flop before it was released using machine learning techniques and algorithms; they used the IMDB dataset in their paper. They imported 6 algorithms: Nave Bayes with 72.18% accuracy, Decision Tree with 81.04% accuracy, K-Nearest Neighbor with 73.76% accuracy, Support Vector Machine with 72.68% accuracy, Logistic Regression with 73.26% accuracy, and Random Forest with 85.2% accuracy. In [26], the comparison between the proposed models and the baseline approaches reveals the superiority of the presented models. The RPM and T-PPM enhanced accuracy by an average of 32.4% and 30%, respectively. Moreover, T-PPM improved the average precision and F-score by 6.7% and 2.5%, respectively. These results depended on future data.
The tabulated findings of this study indicate that the Weighted KNN generates accurate and robust outcomes.
It is worth considering an update to the ML algorithm by introducing further optimized methods. A new robust version of the graph regularization non-negative matrix factorization model is combined with graph regularization and structure-attribute similarity to capture semi-local topology structure and attribute information to solve the link prediction problem in attributed networks [43]. The Biased Local Rand Walk is utilized to evaluate the semi-local proximity and attribute similarity between local nodes to extract all of the link weight information from the original network. The graph regularization technology is then integrated with SARWS to investigate topology information. Moreover, the l2,1-norm is employed to eliminate random noise and spurious linkages. In conclusion, a unified link prediction model (GRNMF-AN) is proposed, and multiplicative updating methods are utilized to learn GRNMF parameters [43]. The authors investigate the viability of the proposed model using nine real-world attribution networks and four evaluation measures; experimental results reveal that their proposed approach outperforms standard techniques [43].
It is projected that a substantial proportion of valuable information that could be used to improve the quality of discovered communities will be ignored. To circumvent this limitation, we present a novel, straightforward, and successful Augment Graph Regularization Nonnegative Matrix Factorization for Attributed Networks (AGNMF-AN) technique [44]. Using Augment Attributed Graph (AAG), the topological structure and attributed nodes of the network are merged. Second, they presented a realistic approach for updating the affinity matrix. In contrast to conventional nonnegative matrix factorization methods based on graph regularization, the weight of the affinity matrix is adjusted adaptively during each iteration. Thirdly, the l2,1-norm is utilized to reduce the influence of random noise and outliers on the quality of the structural community. Experimental results reveal that the proposed strategy in attributed networks outperforms existing state-of-the-art methodologies [44].
In addition, there are more avenues for further investigation. For example, since this work has already made a numerical representation of historical data about the film, it would be interesting to connect members of the film crew with the period of interest to see if the popularity of an actor or director goes up or down over time. Instead of writing plot summaries, it would be more interesting to get together the full screenplays of many movies and read them all. The rhythm of a script might give more information about a film’s plot and unique traits. In addition, there are plans to add more aspects to the model, including those that address consumer spending power more definitely, such as external economic indicators, and those that take into account the sorts of movies and link them with those most suited to different seasons of the year. When the original story of a film is well-known and successful, it is easier to anticipate how much money it will earn. By adding more data and attributes to the dataset, it might be possible to use deep learning to predict the movie’s success in a more objective way. The outcomes of the future technique can be enhanced by employing more realistic criteria for selecting the film’s features and integrating data from many sources to make it more accessible to film creators.

6. Conclusions

The article describes the optimization objective for features that are not domain-specific. It presents a simple yet successful strategy for collecting discriminative semantic characteristics after examining the issues with current methods. The adopted strategy unites domain intents with their k-nearest neighbors and isolates them from samples of other classes to mitigate empirical and open-space risks. This optimization process enabled the KNN algorithms to outperform other ML algorithms. Moreover, the numerical representation of the feature correlated very well with the success rating, adding another advantage to the proposed algorithm. Extensive testing on challenging datasets validates the consistency and dependability of our strategy without imposing arbitrary limits on the distribution of features. Using multiple implementations of the KNN algorithm, projections of future interest in SF films were created. Based on their IMDB rating, movies were categorized as either Flip, Below Average, Average, or Hit. Fine, Weighted, and Medium KNN types are more accurate than other machine learning kinds. Each type of KNN predicts in less than 0.7 s.
In the future, other machine learning techniques will be performed and compared, and new criteria from sources other than IMDB will be employed to increase the accuracy of the prediction model. These sources include Rotten Tomatoes and Wikipedia, among others. Intuitively merging more than one KNN algorithm targeting specific viewer behavior may generate consistent and authentic predicted findings that help the film industry’s global expansion.

Author Contributions

Conceptualization, A.A.F. and T.A.G.; methodology, A.A.F.; software, T.A.G.; validation, A.A.F. and T.A.G.; formal analysis, A.A.F.; investigation, A.A.F.; resources, T.A.G.; data curation, T.A.G.; writing—original draft preparation, A.A.F. and T.A.G.; writing—review and editing, A.A.F.; visualization, T.A.G.; supervision, A.A.F.; project administration, A.A.F.; funding acquisition, A.A.F. All authors have read and agreed to the published version of the manuscript.

Funding

This research received no external funding.

Institutional Review Board Statement

Not applicable.

Informed Consent Statement

Not applicable.

Data Availability Statement

All data is provided in this paper.

Acknowledgments

The dataset’s developers are appreciated by the authors for making it accessible online. They also would like to express their gratitude to Yarmouk university for its support and the anonymous reviewers who helped them to make this paper better.

Conflicts of Interest

The authors declare that they have no conflict of interest to report regarding the present study.

References

  1. Udofia, N.A.; Anyim, J.S. Assessing the Impact of Modern Movies on Students—A Prospective Study. J. Cult. Soc. Dev. 2017, 31, 1–11. [Google Scholar]
  2. Lochbuehler, K.; Peters, M.; Scholte, R.H.J.; Engels, R.C.M.E. Effects of smoking cues in movies on immediate smoking behavior. Nicotine Tob. Res. 2010, 12, 913–918. [Google Scholar] [CrossRef] [PubMed]
  3. Vagionis, N.; Loumioti, M. Movies as a tool of modern tourist marketing. Tourismos 2011, 6, 353–362. [Google Scholar]
  4. Lin, K.-Y.; Tsai, F.-H.; Chien, H.-M.; Chang, L.-T. Effects of a science fiction film on the technological creativity of middle school students. Eurasia J. Math. Sci. Technol. Educ. 2013, 9, 191–200. [Google Scholar]
  5. Lorenčík, D.; Tarhaničová, M.; Sinčák, P. Influence of sci-fi films on artificial intelligence and vice-versa. In Proceedings of the 2013 IEEE 11th International Symposium on Applied Machine Intelligence and Informatics (SAMI), Herl’any, Slovakia, 31 January–2 February 2013. [Google Scholar]
  6. Lowe, T.; Brown, K.; Dessai, S.; Doria, M.D.F.; Haynes, K.; Vincent, K. Does tomorrow ever come? Disaster narrative and public perceptions of climate change. Public Underst. Sci. 2006, 15, 435–457. [Google Scholar] [CrossRef] [Green Version]
  7. Quader, N.; Gani, M.O.; Chaki, D.; Ali, M.H. A Machine Learning Approach to Predict Movie Box-Office Success. In Proceedings of the 20th International Conference of Computer and Information Technology (ICCIT), Dhaka, Bangladesh, 22–24 December 2017. [Google Scholar]
  8. Forbes. Experts Predict a Drop in Box Office Revenue in 2016 after a Record Year for Hollywood. 2016. Available online: https://www.forbes.com/sites/simonthompson/2016/01/05/experts-predict-a-drop-in-box-office-revenue-in-2016-after-arecord-year-for-hollywood/402059897195 (accessed on 20 March 2023).
  9. Subramaniyaswamy, V.; Vaibhav, M.V.; Prasad, R.V.; Logesh, R. Predicting Movie Box Office Success using Multiple Regression and SVM. In Proceedings of the International Conference on Intelligent Sustainable Systems (ICISS 2017), Palladam, India, 7–8 December 2017. [Google Scholar]
  10. Stimpert, J.L.; Laux, J.A.; Marino, C.; Gleason, G. Factors influencing motion picture success: Empirical review and update. J. Bus. Econ. Res. (JBER) 2008, 6, 11. [Google Scholar] [CrossRef] [Green Version]
  11. Lash, M.T.; Zhao, K. Early predictions of movie success: The who, what, and when of profitability. J. Manag. Inf. Syst. 2016, 33, 874–903. [Google Scholar] [CrossRef] [Green Version]
  12. Nithin, V.R.; Pranav, M. Predicting movie success based on IMDb data. Int. J. Data Min. Tech. Appl. 2014, 3, 365–368. [Google Scholar]
  13. Latif, M.H.; Afzal, H. Prediction of movies popularity using machine learning techniques. Int. J. Comput. Sci. Netw. Secur. (IJCSNS) 2016, 16, 127. [Google Scholar]
  14. Asad, K.I.; Ahmed, T.; Rahman, M.S. Movie popularity classification based on inherent movie attributes using C4. 5, PART and correlation coefficient. In Proceedings of the 2012 International Conference on Informatics, Electronics & Vision (ICIEV), Dhaka, Bangladesh, 18–19 May 2012. [Google Scholar]
  15. Saraee, M.H.; White, S.; Eccleston, J. A data mining approach to analysis and prediction of movie ratings. WIT Trans. Inf. Commun. Technol. 2004, 33, 343–352. [Google Scholar]
  16. Galvão, M.; Henriques, R. Forecasting movie box office profitability. J. Inf. Syst. Eng. Manag. 2018, 3, 22. [Google Scholar] [CrossRef] [PubMed] [Green Version]
  17. Gaikar, D.; Solanki, R.; Shinde, H.; Phapale, P.; Pandey, I. Movie success prediction using popularity factor from social media. Int. Res. J. Eng. Technol. 2019, 6, 5184–5190. [Google Scholar]
  18. Lash, M.T.; Fu, S.; Wang, S.; Zhao, K. Early prediction of movie success: What, who, and when. In Proceedings of the 2015 International Conference on Social Computing, Behavioral-Cultural Modeling, and Prediction; Agarwal, N., Xu, K., Osgood, N., Eds.; Springer: Washington, DC, USA, 2015; pp. 345–349. [Google Scholar]
  19. Ahmad, J.; Duraisamy, P.; Yousef, A.; Buckles, B. Movie success prediction using data mining. In Proceedings of the 2017 8th International Conference on Computing, Communication and Networking Technologies (ICCCNT), Delhi, India, 3–5 July 2017. [Google Scholar]
  20. Dhir, R.; Raj, A. Movie success prediction using machine learning algorithms and their comparison. In Proceedings of the 2018 First International Conference on Secure Cyber Computing and Communication (ICSCCC), Jalandhar, India, 15–17 December 2018. [Google Scholar]
  21. Chakraborty, P.; Zahidur, M.; Rahman, S. Movie success prediction using historical and current data mining. Int. J. Comput. Appl. 2019, 178, 47. [Google Scholar] [CrossRef]
  22. Sivakumar, P.; Rajeswaren, V.P.; Abishankar, K.; Ekanayake, E.M.U.W.J.B.; Mehendran, Y. Movie Success and Rating Prediction Using Data Mining Algorithms. J. Inf. Syst. Inf. Technol. (JISIT) 2020, 5, 72–80. [Google Scholar]
  23. Agarwal, M.; Venugopal, S.; Kashyap, R.; Bharathi, R. A Comprehensive Study on Various Statistical Techniques for Prediction of Movie Success. arXiv 2021, arXiv:2112.00395. [Google Scholar]
  24. Gupta, V.; Jain, N.; Garg, H.; Jhunthra, S.; Mohan, S.; Omar, A.H.; Ahmadian, A. Predicting attributes based movie success through ensemble machine learning. Multimed. Tools Appl. 2022, 82, 9597–9626. [Google Scholar] [CrossRef]
  25. Vijarania, M.; Gambhir, A.; Sehrawat, D.; Gupta, S. Prediction of Movie Success Using Sentimental Analysis and Data Mining. In Applications of Computational Science in Artificial Intelligence; IGI Global: Hershey, PA, USA, 2022; pp. 174–189. [Google Scholar]
  26. Alhijawi, B.; Awajan, A. Prediction of movie success using Twitter temporal mining. In Proceedings of the Sixth International Congress on Information and Communication Technology: ICICT 2021, London, UK, 24 September 2021; Springer: Singapore, 2022; Volume 1, pp. 105–116. [Google Scholar]
  27. Oyewola, D.O.; Dada, E.G. Machine Learning Methods for Predicting the Popularity of Movies. J. Artif. Intell. Syst. 2022, 4, 65–82. [Google Scholar] [CrossRef]
  28. Qaseem, D.M.; Ali, N.; Akram, W.; Ullah, A.; Polat, K. Movie Success-Rate Prediction System through Optimal Sentiment Analysis. J. Inst. Electron. Comput. 2022, 4, 15–33. [Google Scholar]
  29. Bristi, W.R.; Zaman, Z.; Sultana, N. Predicting imdb rating of movies by machine learning techniques. In Proceedings of the 2019 10th International Conference on Computing, Communication and Networking Technologies (ICCCNT), Kanpur, India, 6–8 July 2019. [Google Scholar]
  30. Papadopoulos, A.N.; Manolopoulos, Y. Nearest Neighbor Search: A Database Perspective; Springer Science & Business Media: Berlin/Heidelberg, Germany, 2006. [Google Scholar]
  31. Kononenko, I.; Matjaz, K. Machine Learning and Data Mining; Horwood Publishing: Devon, UK, 2007. [Google Scholar]
  32. Shakhnarovich, G.; Darrell, T.; Indyk, P. Nearest-neighbor methods in learning and vision. IEEE Trans. Neural Netw. 2008, 19, 377. [Google Scholar]
  33. Wu, X.; Kumar, V.; Quinlan, J.R.; Ghosh, J.; Yang, Q.; Motoda, H.; McLachlan, G.J.; Ng, A.; Liu, B.; Yu, P.S.; et al. Top 10 algorithms in data mining. Knowl. Inf. Syst. 2008, 14, 1–37. [Google Scholar] [CrossRef] [Green Version]
  34. Jaskowiak, P.A.; Campello, R.J.G.B. Comparing correlation coefficients as dissimilarity measures for cancer classification in gene expression data. In Proceedings of the Brazilian Symposium on Bioinformatics, Brasília, Brazil, 10–12 August 2011. [Google Scholar]
  35. Burgot, G.; Auffret, F.; Burgot, J.-L. Determination of acetaminophen by thermometric titrimetry. Anal. Chim. Acta 1997, 343, 125–128. [Google Scholar] [CrossRef]
  36. Nigsch, F.; Bender, A.; van Buuren, B.; Tissen, J.; Nigsch, E.; Mitchell, J.B.O. Melting point prediction employing k-nearest neighbor algorithms and genetic parameter optimization. J. Chem. Inf. Model. 2006, 46, 2412–2422. [Google Scholar] [CrossRef] [PubMed]
  37. Hall, P.; Park, B.U.; Samworth, R.J. Choice of neighbor order in nearest-neighbor classification. Ann. Stat. 2008, 36, 2135–2152. [Google Scholar] [CrossRef]
  38. Zhang, C.; Zhong, P.; Liu, M.; Song, Q.; Liang, Z.; Wang, X. Hybrid Metric K-Nearest Neighbor Algorithm and Applications. Math. Probl. Eng. 2022, 2022, 8212546. [Google Scholar] [CrossRef]
  39. Jawthari, M.; Stoffová, V. Predicting students’ academic performance using a modified kNN algorithm. Pollack Period. 2021, 16, 20–26. [Google Scholar] [CrossRef]
  40. Uddin, S.; Haque, I.; Lu, H.; Moni, M.A.; Gide, E. Comparative performance analysis of K-nearest neighbour (KNN) algorithm and its different variants for disease prediction. Sci. Rep. 2022, 12, 6256. [Google Scholar] [CrossRef] [PubMed]
  41. Tripathi, J.; Tiwari, S.; Saini, A.; Kumari, S. Prediction of movie success based on machine learning and twitter sentiment analysis using internet movie database data. Indones. J. Electr. Eng. Comput. Sci. 2023, 29, 1750–1757. [Google Scholar] [CrossRef]
  42. Sadashiv, S.; Sween, S.; Sankruth, S. Movie Success Prediction Using Machine Learning. Int. Res. J. Mod. Eng. Technol. Sci. 2021, 3, 2021–2024. [Google Scholar]
  43. Nasiri, E.; Berahmand, K.; Li, Y. Robust graph regularization nonnegative matrix factorization for link prediction in attributed networks. Multimed. Tools Appl. 2022, 82, 3745–3768. [Google Scholar] [CrossRef]
  44. Berahmand, K.; Mohammadi, M.; Saberi-Movahed, F.; Li, Y.; Xu, Y. Graph regularized nonnegative matrix factorization for community detection in attributed networks. IEEE Trans. Netw. Sci. Eng. 2022, 10, 372–385. [Google Scholar] [CrossRef]
Figure 2. Relationship between Run Time in Minutes and Popularity.
Applsci 13 04312 g002
Figure 3. Relationship between IMDB Rating and Number of Votes.
Applsci 13 04312 g003
Figure 4. Relationship between IMDB Rating and Run Time in Minutes.
Applsci 13 04312 g004
Figure 5. Box office by month.
Applsci 13 04312 g005
Figure 6. Implementation Model.
Applsci 13 04312 g006
Figure 7. Weighted KNN ROC.
Applsci 13 04312 g007
Figure 8. Accuracy, precision, and recall for various machine learning algorithms.
Applsci 13 04312 g008
Table 1. Science fiction movies genres.
MovieGenres
About TimeComedy, Drama, Fantasy, Romance, Sci-Fi
AlienHorror, Sci-Fi
A Clockwork OrangeCrime, Drama, Sci-Fi
Boss LevelAction, Mystery, Thriller, Sci-Fi
CoherenceDrama, Horror, Mystery, Thriller, Sci-Fi
DuneAction, Adventure, Sci-Fi
InceptionAction, Adventure, Thriller, Sci-Fi
Iron SkyAction, Adventure, Comedy, Sci-Fi
Mac and MeAdventure, Family, Fantasy, Sci-Fi
MaggieDrama, Horror, Sci-Fi
MegaforceAction, Sci-Fi
OkjaAction, Adventure, Drama, Sci-Fi
OnlyDrama, Romance, Sci-Fi
The DayAction, Drama, Horror, Sci-Fi, Thriller
The MartianAdventure, Drama, Sci-Fi
Table 2. Rating Classification.
Range of RatingClass
0.0–3.5Flop
3.6–5.8Below Average
5.9–7.4Average
7.5–10.0Hit
Table 3. Highest-Grossing Sci-Fi Movies.
MovieMonthBox Office
Avatar12USD 2,847,246,203
Star Wars: The Force Awakens12USD 2,068,223,624
Jurassic World5USD 1,670,516,444
Star Wars: The Last Jedi12USD 1,332,539,889
Jurassic World: Fallen Kingdom5USD 1,308,467,944
Transformers: Dark of the Moon 6USD 1,123,794,079
Transformers: Age of Extinction 6USD 1,104,054,072
Star Wars: The Rise of Skywalker 12USD 1,074,144,248
Rogue One: A Star Wars Story 12USD 1,056,057,273
Jurassic Park6USD 1,033,928,303
Star Wars: Episode I–The Phantom Menace 5USD 1,027,082,707
Table 4. Correlation matrix.
IMDB_RatingRuntime_minsYear Num_VotesBox_Office
IMDB_Rating1.0000000.392518−0.2019700.5556940.283635
Runtime_mins0.3925181.0000000.0669250.4307080.451454
Year−0.2019700.0669251.0000000.0308600.113318
Num_Votes0.5556940.4307080.0308601.0000000.639275
IMDB_Rating0.2836350.4514540.1133180.6392751.000000
Table 5. Feature numerical representation.
FeatureNumerical Formula
Actor 10 × Average actor’ Movie ratings over five years/max rating of the actors during the five years
Director10 × Average director’s movie ratings/maximum rating of the directors
MonthAverage ratings of the movies in that month
Year10–0.2 × number of years
Run timeProbability of run time × 10;
Production studio10 × (Sum of ratings of the studio/Total sum of ratings of the top six studios)
Critic review of the movie storySum of positive critics in the first 1000 story reviews/(sum of all positive and negative critics in the 1000 story reviews)
Genres10 × sum of ratings for Sci Fic genre/total ratings for all genre;
Movie starsAverage rating of the top 5 actors in the movie
Top actor’s social media followers10 × (Number of followers of the top five actors in the movie/top maximum number of flowers for five actors)
Expected budgetRegression equation between IMDB ratings and budget
Table 6. KNN algorithms.
AlgorithmNumber of NeighborsDistance MetricDistance WeightStandardize Data
Fine KNN1EuclideanEqualTrue
Medium KNN10EuclideanEqualTrue
Weighted KNN10EuclideanSquared InverseTrue
Table 7. Summary of the results for different KNN algorithms.
KNN ClassifierAccuracy (%)Prediction Speed (obs/s)Training TimeClass True Positive Rate
AverageBelow AverageFlopHit
Fine KNN93.0~31,0000.632896%93%100%77%
Medium KNN90.3~24,0000.2174698%89%73%48%
Weighted KNN92.9~24,0000.2190397%94%93%60%
Table 8. Accuracy, precision, and recall for various machine learning algorithms.
AlgorithmAccuracyPrecisionRecall
Multinomial Regression0.290.230.29
Fine KNN 0.930.910.91
Medium KNN0.900.890.88
Weighted KNN0.930.930.92
Bi-Directional LSTM0.790.750.77
LSTM0.780.800.78
GRU0.770.790.77
Logistic regression0.890.880.88
Naive Bayes0.810.800.81
Decision tree0.870.860.87
Gradient Boosting0.870.860.86
Random Forest0.850.840.84
SVM linear kernel0.730.720.71
SVM RBF kernel0.750.740.73
Disclaimer/Publisher’s Note: The statements, opinions and data contained in all publications are solely those of the individual author(s) and contributor(s) and not of MDPI and/or the editor(s). MDPI and/or the editor(s) disclaim responsibility for any injury to people or property resulting from any ideas, methods, instructions or products referred to in the content.

