
Influencing Factors and Prewarning of Unsafe Status of Construction Workers Based on BP Neural Network

Abstract
:1. Introduction
2. Research Methods and Technical Routes
2.1. The Index System Was Determined by the Statistical Method of Word Frequency in the Literature
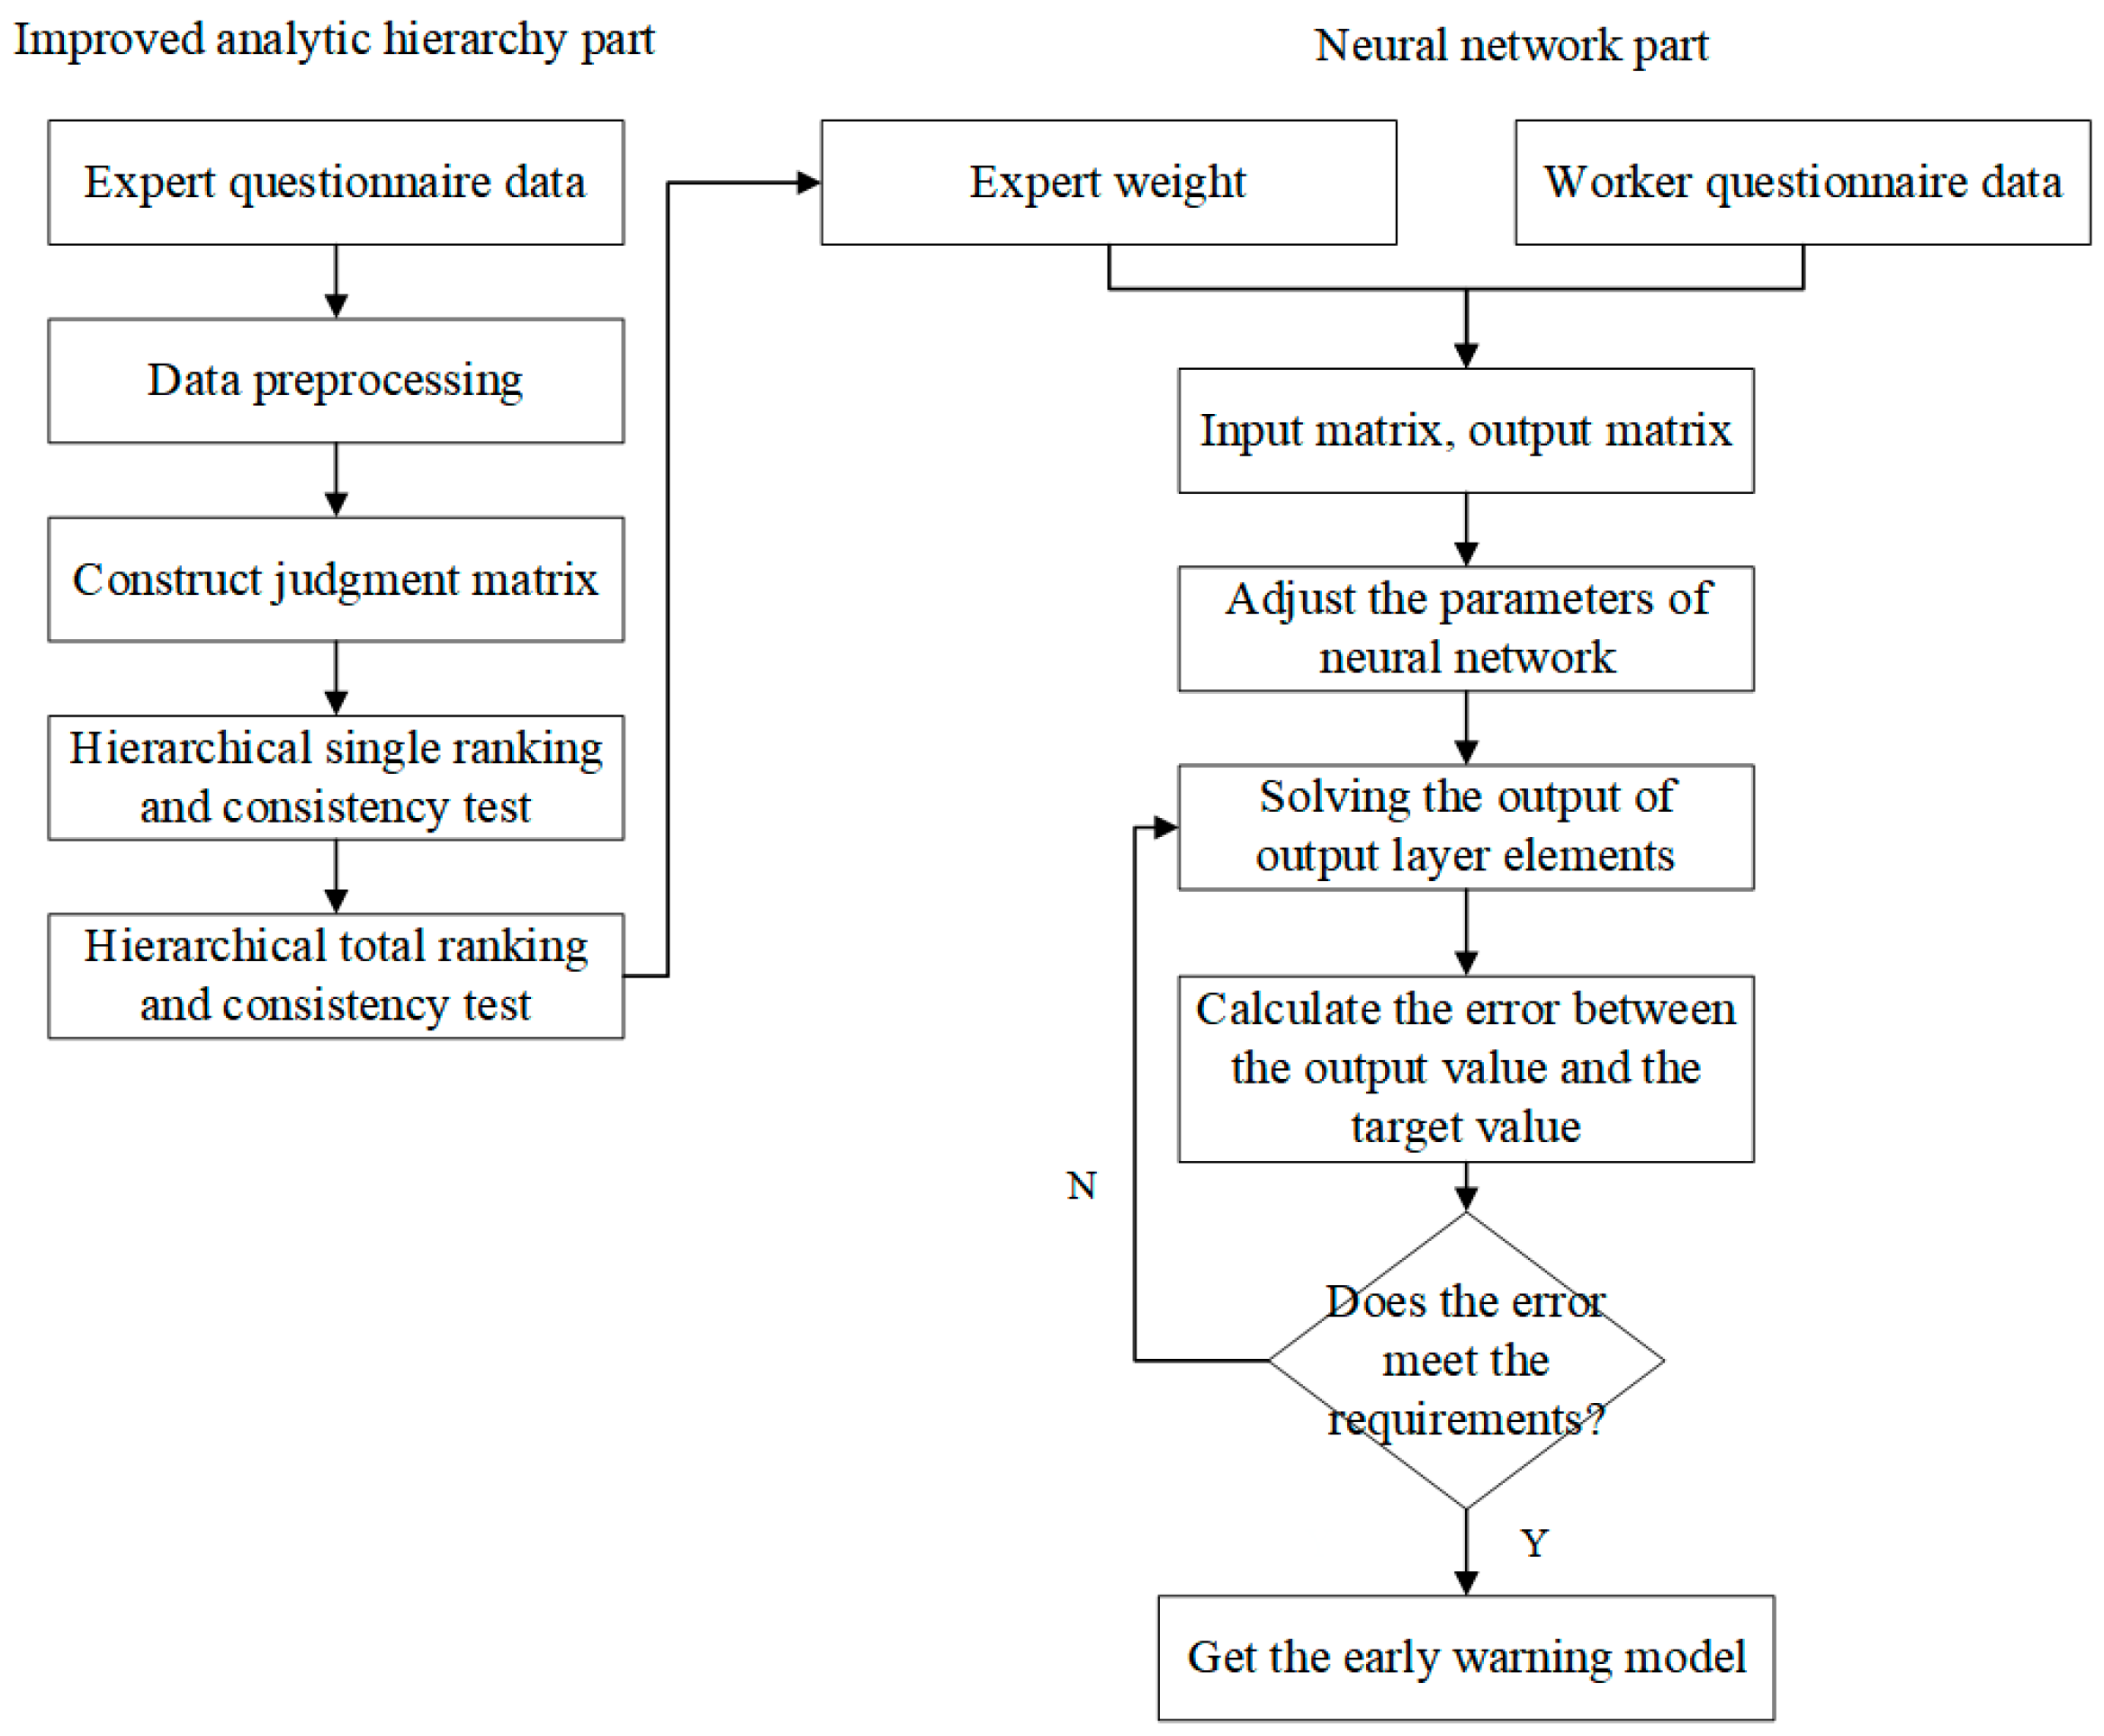
2.2. Research Process
2.3. Improved AHP
2.3.1. Establishment of Hierarchical Structure Model
2.3.2. Judgment Matrix Construction
2.3.3. Hierarchical Single Ordering and Consistency Check
- (1)
- Hierarchical single sorting
- (2)
- Calculation of consistency index CI
- (3)
- Calculation of the corresponding average random consistency index RI
- (4)
- Calculation of consistency ratio CR
2.3.4. Hierarchical Total Sorting and Consistency Test
- (1)
- Hierarchical total ranking
- (2)
- Consistency test
2.4. BP Neural Network
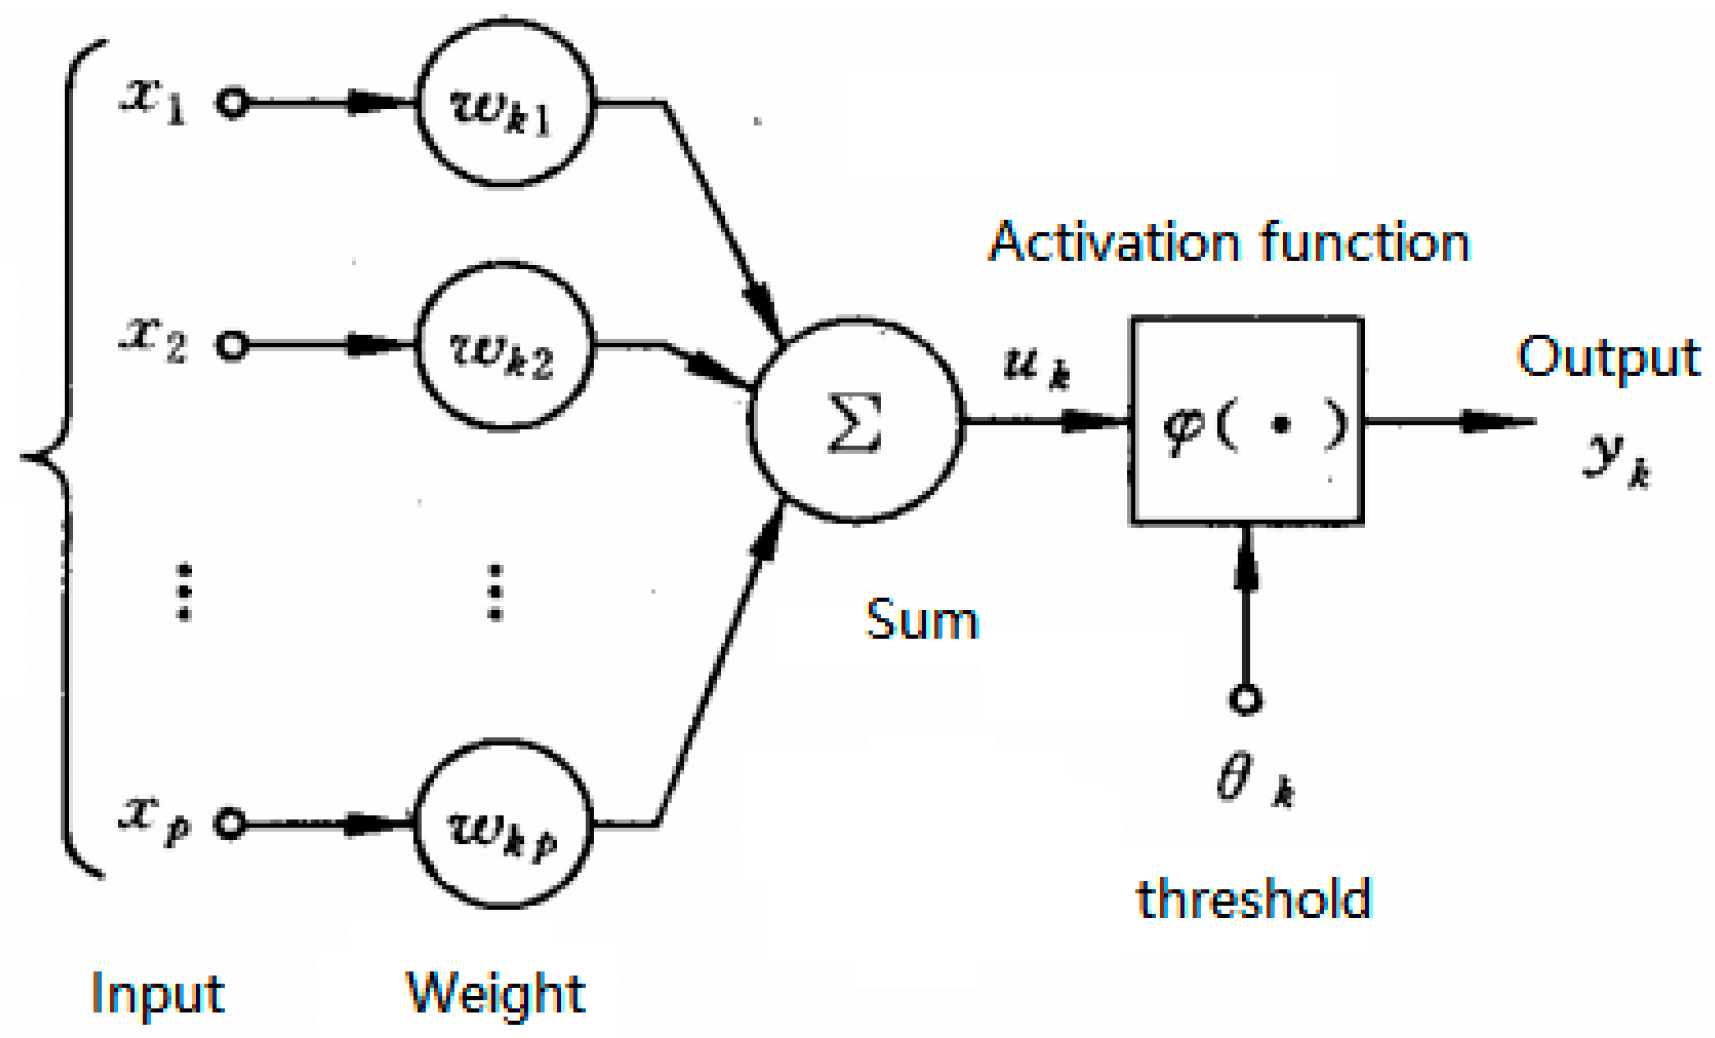
2.4.1. Artificial Neuron Model
2.4.2. Establishment of the Number of Hidden Neurons
2.4.3. Training Function
2.4.4. Data Preprocessing
2.4.5. Solving the Weight of Each Factor
3. Data Source and Analysis
3.1. The Improved AHP Is Used to Solve the Expert Weight
3.1.1. Establishing a Hierarchical Structure Model
3.1.2. Constructing Judgment Matrix
3.1.3. Hierarchical Single Ordering and Consistency Check
3.1.4. Hierarchical Total Ordering and Consistency Check
3.1.5. Analysis of Results
3.2. Using a Neural Network to Build an Early Warning Model
3.2.1. Questionnaire Design
3.2.2. Input of the Early Warning Model
3.2.3. Output of the Early Warning Model
3.2.4. Training of Early Warning Model
- (1)
- Determining the number of input neurons and the input matrix
- (2)
- Determining the number of output neurons and the output matrix
- (3)
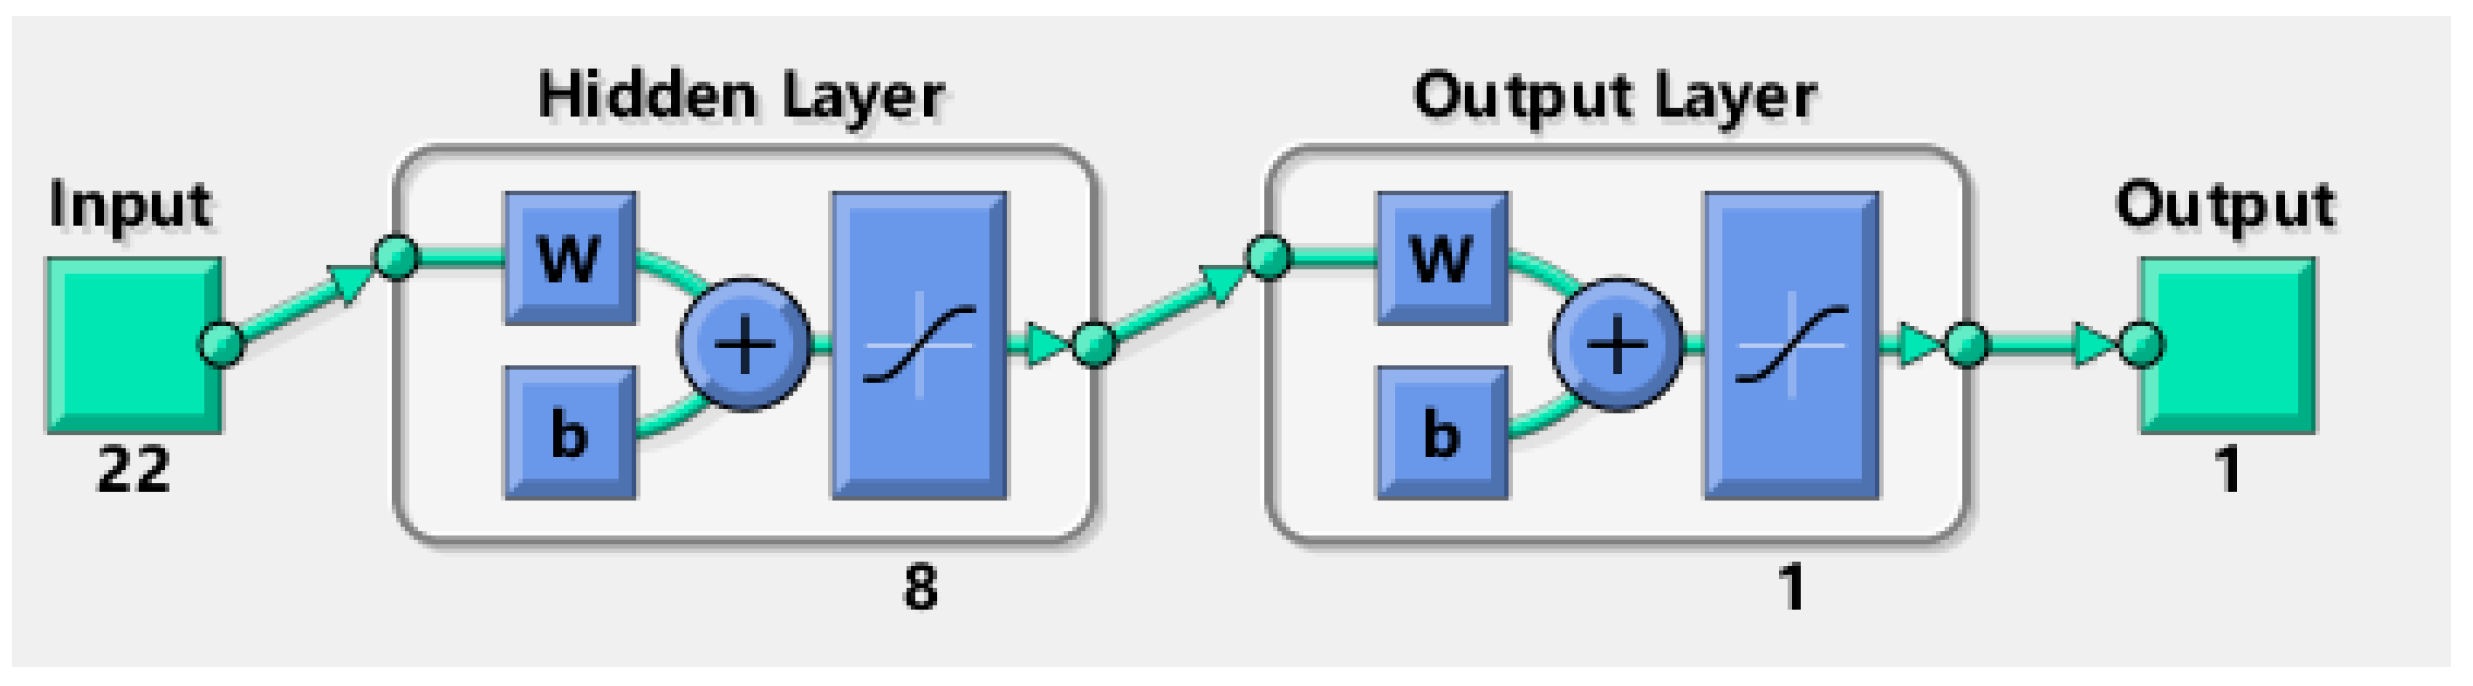
- Determining the number of hidden neurons
- (4)
- Levenberg–Marquardt algorithm
- (5)
- Importing data and determining parameters
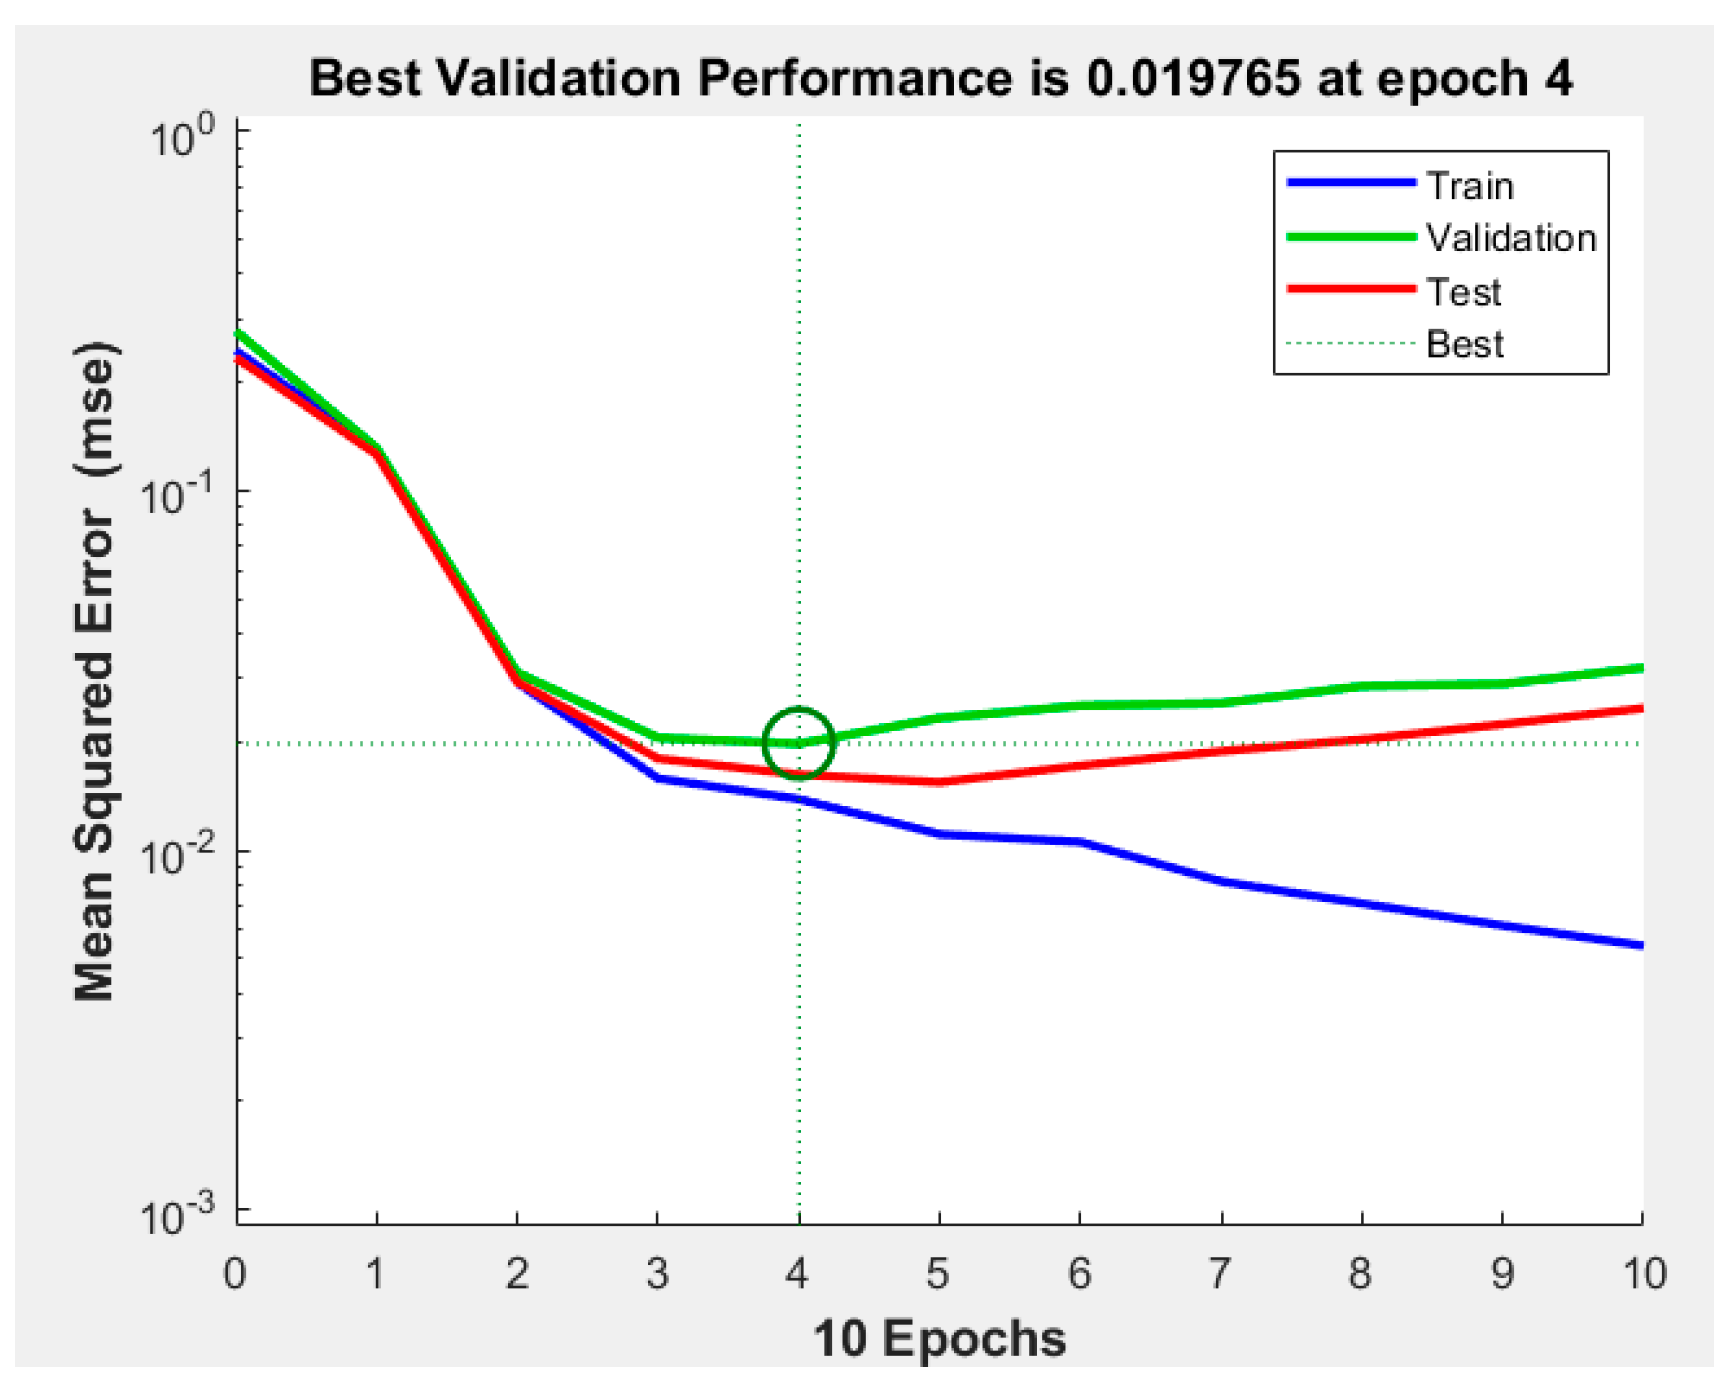
3.2.5. Training the Model
3.2.6. Model Accuracy Test
3.2.7. Weight Correction of Each Factor Indicator
3.3. Analysis of Results
3.3.1. Weight Correction Analysis
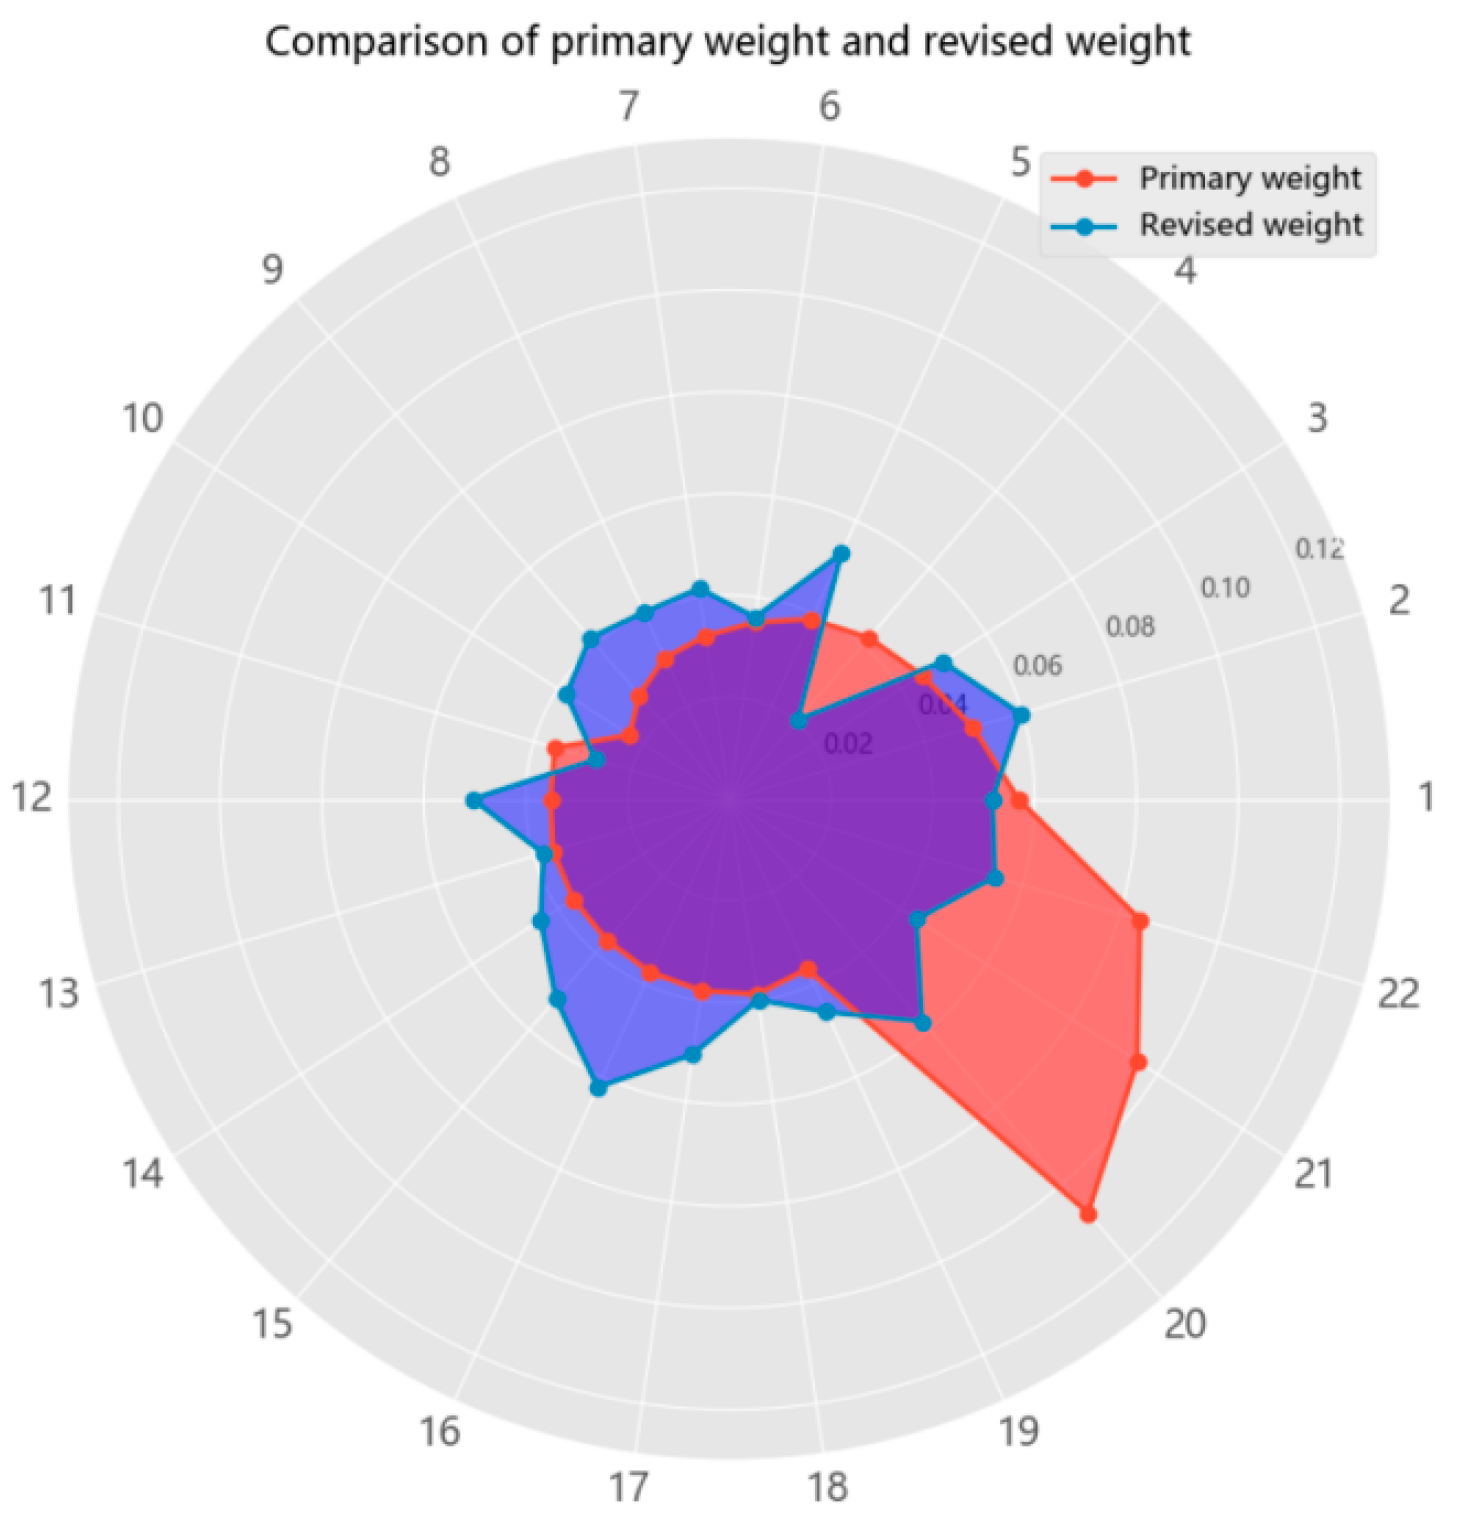
3.3.2. Comparative Analysis of Primary Weight and Revised Weight
4. Engineering Application
4.1. Worker Forecast
4.2. Sensitivity Analysis
4.3. Follow-Up Research
5. Conclusions
Author Contributions
Funding
Institutional Review Board Statement
Informed Consent Statement
Data Availability Statement
Conflicts of Interest
References
- Ni, G.D.; Gao, F.N.; Xu, H.; Qiao, Y.N. Literature Review on Unsafe Behaviors of Construction Workers in China. J. Eng. Manag. 2020, 34, 54–59. [Google Scholar] [CrossRef]
- Circular of the General Office of the Ministry of Housing and Urban-Rural Development on the Production Safety Accidents of Housing and Municipal Engineering in 2017. Available online: https://www.mohurd.gov.cn/gongkai/zhengce/zhengcefilelib/201803/20180323_235474.html (accessed on 23 March 2018).
- Circular of the General Office of the Ministry of Housing and Urban-Rural Development on the Production Safety Accidents of Housing and Municipal Engineering in 2019. Available online: https://www.mohurd.gov.cn/gongkai/zhengce/zhengcefilelib/202006/20200624_246031.html (accessed on 24 June 2020).
- Circular of the General Office of the Ministry of Housing and Urban-Rural Development on the Production Safety Accidents of Housing and Municipal Engineering in 2021. Available online: https://www.mohurd.gov.cn/gongkai/zhengce/zhengcefilelib/202210/20221026_768565.html (accessed on 27 October 2022).
- Shi, Y.F.; Lu, J.F. Research on the impact of construction workers fatigue on unsafe behaviors based on SEM. J. Xi’an Univ. Sci. Technol. 2020, 40, 712–719. [Google Scholar] [CrossRef]
- Wang, C.Y.; Wang, Q. ISM modeling and Analysis of lnfluencing Factors of Construction Workers Unsafe Behaviors. J. Hubei Univ. Technol. 2017, 32, 37–40+108. [Google Scholar] [CrossRef]
- Meng, X.; Liu, Q.; Luo, X.; Zhou, X. Risk assessment of the unsafe behaviours of humans in fatal gas explosion accidents in China’s underground coal mines. J. Clean. Prod. 2019, 210, 970–976. [Google Scholar] [CrossRef]
- Shin, M.; Lee, H.S.; Park, M.; Moon, M.; Han, S. A system dynamics approach for modeling construction workers’ safety attitudes and behaviors. J. Clean. Prod. 2014, 68, 95–105. [Google Scholar] [CrossRef]
- Wu, F.; Xu, H.; Sun, K.-S.; Hsu, W.-L. Analysis of Behavioral Strategies of Construction Safety Subjects Based on the Evolutionary Game Theory. Buildings 2022, 12, 313. [Google Scholar] [CrossRef]
- Choi, B.; Lee, S.H. An Empirically Based Agent-Based Model of the Sociocognitive Process of Construction Workers’ Safety Behavior. J. Constr. Eng. Manag. 2018, 144, 04017102. [Google Scholar] [CrossRef]
- Jiang, Y.Q.; Yuan, Y.B.; Zhang, M.Y. Research on the Spread of Unsafe Behaviors of Construction Workers Basedon AHP fuzzy Comprehensive Evaluation. J. Eng. Manag. 2021, 35, 131–136. [Google Scholar] [CrossRef]
- Xu, R.; Shen, J.J.; Pan, Y. Study on Influencing Factors and Weights of Miners’ Unsafe Behavior based on AHP. Shandong Coal Technology 2019, 10, 222–224. [Google Scholar] [CrossRef]
- Zhao, H.C.; Tian, S.C.; Deng, Z.S.; Wang, P.; Huang, X. Study on Consequence Serious Degree of Miners’ Unsafe Behavior Based on AHP. Coal Proj. 2014, 46, 117–120. [Google Scholar] [CrossRef]
- Zhao, J.N.; Guo, J.P.; Hou, D.S.; Wang, X.N. Analysis of brittleness of falling accident based on analytic hierarchy process. China Saf. Prod. Sci. Technol. 2009, 5, 204–208. [Google Scholar] [CrossRef]
- Pei, Z.Q. Study on Coal Mine Safety Culture Fuzzy Comprehensive Assessment and Application Based on AHP. Master’s Thesis, Xi’an University of Science and Technology, Xi’an, China, 2009. [Google Scholar] [CrossRef]
- Shapira, A.; Simcha, M. Ahp-based weighting of factors affecting safety on construction sites with tower cranes. J. Constr. Eng. Manag. 2009, 135, 307–318. [Google Scholar] [CrossRef]
- Lu, C.-S.; Tsai, C.-L. The effect of safety climate on seafarers’ safety behaviors in container shipping. Accid. Anal. Prev. 2010, 42, 1999–2006. [Google Scholar] [CrossRef]
- Mearns, K.; Reader, T. Organizational support and safety outcomes: An un-investigated relationship? Saf. Sci. 2008, 46, 388–397. [Google Scholar] [CrossRef]
- Siu, O.; Phillips, D.R.; Leung, T. Safety climate and safety performance among construction workers in hong kong: The role of psychological strains as mediators. Accid. Anal. Prev. 2004, 36, 359–366. [Google Scholar] [CrossRef] [PubMed]
- Seo, D.-C. An explicative model of unsafe work behavior. Saf. Sci. 2005, 43, 187–211. [Google Scholar] [CrossRef]
- Guo, S.Y.; Zhang, P.; Ding, L.Y. Time-statistical laws of workers’ unsafe behavior in the construction industry: A case study. Phys. A Stat. Mech. Its Appl. 2018, 515, 419–429. [Google Scholar] [CrossRef]
- Neal, A.; Griffin, M.A.; Hart, P.M. The impact of organizational climate on safety climate and individual behavior. Saf. Sci. 2000, 34, 99–109. [Google Scholar] [CrossRef]
- Ye, G.; Yang, L.J.; Wang, H.X.; Fu, Y.; Tang, X.Y. Study on Influencing Factors of Construction Workers’ Unsafe BehaviorBased on Multi Level Hierarchical Structure Model. Saf. Environ. Eng. 2019, 26, 129–134. [Google Scholar] [CrossRef]
- Tang, L.L.; Zhang, Y.B.; Qi, S.J.; Chen, M.; Niu, D.Y. Influence of Formal Group Safety Atmosphere on Conformity Unsafe Behaviors of Construction Workers. J. Huaqiao Univ. (Nat. Sci. Ed.) 2020, 41, 26–31. [Google Scholar] [CrossRef]
- Wang, Z.H.; Zhao, Y.Z. Construction WorkersUnsafe Behavior Research Analysis and Evaluation Model. J. Appl. Funct. Anal. 2015, 17, 198–208. [Google Scholar]
- Li, H.S.; Jiang, Q.Q. Research on the Influencing Factors of Construction Workers’ Unsafe Behaviors Based on DEMATEL-ISM. J. Eng. Manag. 2019, 33, 143–147. [Google Scholar] [CrossRef]
- Qi, S.J.; Cheng, J.L.; Zhang, Y.B. Construction of Model of Unsafe Behavior of Construction Workers Considering Organizational Climate. J. Huaqiao Univ. (Nat. Sci. Ed.) 2018, 39, 198–204. [Google Scholar] [CrossRef]
- Sun, S.M.; Gao, X.D.; Sun, H.; Fu, G. Study on causes of accidents in construction of natural gas pipelines. China Saf. Sci. 2020, 30, 8–13. [Google Scholar] [CrossRef]
- Gong, Y.H.; Wang, Z. Research on formation mechanism of undergraduates’ unsafe acts. China Saf. Sci. 2014, 24, 3–7. [Google Scholar] [CrossRef]
- Yang, X.G.; Zhang, G.J.; Jia, Y.F. Study on the influence of management factors on unsafe psychological behavior of construction workers. Constr. Saf. 2018, 33, 44–50. [Google Scholar] [CrossRef]
- Song, S.X.; Sun, Y.C.; Song, X.Y.; Chen, S. Analysis and control measures of construction vehicle operation injury accident. People’s Yellow River 2019, 41, 163–165. [Google Scholar]
- Cui, T.J.; Li, S.X. Research on the relationship between emotional safety culture, psychological capital and safety behavior of construction workers. Sci. Technol. Dev. 2021, 17, 484–490. [Google Scholar]
- Feng, T. Research on Safety Management Strategies Based on the Relationship between Emotions and the Influence of Unsafe Behavior of Construction Workers. Ph.D. Thesis, Xi’an University of Architecture and Technology, Xi’an, China, 2017. [Google Scholar]
- Dai, N.N.; Yang, L.; Zhu, J.Q. Research on influencing factors of chemical construction workers’ safety behaviors. China Saf. Sci. 2020, 30, 41–46. [Google Scholar] [CrossRef]
- Chou, G.F.; Yu, X.S. Safety Cognition Enhancement Strategy of Construction Workers Based on Rough Sets. Ind. Eng. Manag. 2019, 24, 120–127. [Google Scholar] [CrossRef]
- Chen, X.Y.; Shi, S.L.; Li, R.Q.; Li, Y.; You, B. Human Factors Analysis of Building Construction Safety Based on Modified HFACS and SPA. J. Hunan Univ. Sci. Technol. (Nat. Sci. Ed.) 2020, 35, 63–69. [Google Scholar] [CrossRef]
- Chang, Y.-M. The relationship between safety culture and safety performance among construction workers. Saf. Sci. 2012, 50, 1093–1097. [Google Scholar]
- Ni, Q.Q.; Xie, Y.F.; Xu, S.; Li, H. Construction and Evaluation Method of Group Safety Stress Factor of Construction Workers. J. Civ. Eng. Manag. 2020, 37, 146–152. [Google Scholar] [CrossRef]
- Guo, S.Y.; Zhou, X.Y.; Tang, B.; Gong, P. Exploring the behavioral risk chains of accidents using complex network theory in the construction industry. Phys. A Stat. Mech. Its Appl. 2020, 560, 125012. [Google Scholar] [CrossRef]
- Huang, Q.Q.; Qi, S.J.; Zhang, Y.B. The Influence Mechanism of Unsafe Psychology and Physical Health to Unsafe Behavior of Construction Workers. Eng. Econ. 2018, 28, 33–37. [Google Scholar] [CrossRef]
- Tong, R.; Yang, X.; Parker, T.; Zhang, B.; Wang, Q. Exploration of relationships between safety performance and unsafe behavior in the Chinese oil industry. J. Loss Prev. Process Ind. 2020, 66, 104167. [Google Scholar] [CrossRef]
- Liu, H.; Gong, M.J.; Zhang, Y. Analysis of Fatigue Influencing Factors of Construction Workers Based on ISM. Archit. Chongqing 2021, 20, 23–24. [Google Scholar] [CrossRef]
- Xue, M.H.; Li, H.M. Setting-up and evaluation making of the management system for the personnel safety accumulated points based on the game theory. J. Saf. Environ. 2020, 20, 1773–1781. [Google Scholar] [CrossRef]
- Yao, Y.L. Study of Miner Unsafe Behavior Based on Grey Correlation Analyzing. Ind. Saf. Environ. Prot. 2017, 43, 35–38. [Google Scholar]
- Chen, Y.; Li, S.; Zhang, Y.H.; Cao, Q.R. Research on Herding Effect in Unsafe Behavior Based on Evolutionary Game. Tech. Econ. 2020, 39, 144–155. [Google Scholar] [CrossRef]
- Kaming, P.F. Assessing the impact of construction site environmental conditions on safety. J. Constr. Eng. Manag. 2002, 128, 240–248. [Google Scholar]
- Clarke, S. The impact of safety management practices on construction worker injury rates. J. Saf. Res. 2011, 42, 431–438. [Google Scholar] [CrossRef]
- Smith, J. Personality traits and safety behaviors of construction workers. Constr. Build. Mater. 2017, 150, 123–131. [Google Scholar] [CrossRef]
- Johnson, S. The impact of psychological factors on construction workers’ unsafe behavior. Constr. Manag. Econ. 2017, 35, 572–581. [Google Scholar]
- Luo, Z.Q.; Yang, S.L. Comparative Study on Several Scales in AHP. Syst. Eng.-Theory Pract. 2004, 24, 51–60. [Google Scholar] [CrossRef]
- Si, S.K.; Sun, Z.L. Mathematical Modeling Algorithms and Applications, 2nd ed.; National Defense Industry Press: Beijing, China, 2016; pp. 167–174. ISBN 9787118103601. [Google Scholar]
- Dong, Y.F. Research on Levenberg-Marquardt Neural Network Algorithm. Mark. Mod. 2009, 568, 385. [Google Scholar] [CrossRef]
- Jia, G.S.; He, C.Q.; Chen, Y.T.; Sun, J. Early Warning of Construction Workers’ Safety Behavior from Cross-level Perspective. J. Tongji Univ. (Nat. Sci. Ed.) 2019, 47, 568–574. [Google Scholar] [CrossRef]
- Wu, K.X.; Zhang, Y.J.; Zhang, M. Application of Behavior-based Safety in Coal Mine Safety Management and Assessment System. Coal Mine Saf. 2017, 48, 218–220. [Google Scholar] [CrossRef]
- Xia, Y.; Sun, W.J.; Dong, J.J. Research on Safety Early Warning System for Falling Accidents Based on Cloud-BIM for Construction Workers. Sci. Technol. Manag. Res. 2020, 40, 251–257. [Google Scholar] [CrossRef]

| Serial Number | High-Frequency Words | Number of Articles |
|---|---|---|
| 1 | Safety climate [24,25] | 66 |
| 2 | Security awareness [26,27] | 46 |
| 3 | Security attitude [6,28] | 40 |
| 4 | Safety knowledge [29,30] | 39 |
| 5 | Safety education [31,32] | 34 |
| 6 | Workers’ emotions [33,34] | 31 |
| 7 | Security perception [35,36] | 26 |
| 8 | Security culture [37,38] | 26 |
| 9 | Security leadership [39,40] | 21 |
| 10 | Work experience [26,29] | 19 |
| 11 | Psychological factors [28,36] | 17 |
| 12 | Safety compliance [41] | 16 |
| 13 | Workers’ fatigue [5,42] | 15 |
| 14 | Skills level [27] | 14 |
| 15 | Safety input [30,35] | 13 |
| 16 | Safety supervision [28,31] | 12 |
| 17 | safety regulation [43] | 10 |
| 18 | Workmate impact [44,45] | 9 |
| 19 | Safety communication [24,27] | 8 |
| 20 | Construction conditions [46] | 8 |
| 21 | Management level [40,47] | 6 |
| 22 | Workers’ character [48,49] | 4 |
| Serial Number | Factor | Interpretation |
|---|---|---|
| 1 | Safety climate | Safety level of working environment |
| 2 | Security awareness | Summarization of construction workers’ psychological experience of safety |
| 3 | Safety attitude | Some opinions and intentions of construction workers after evaluating the significance or importance of construction to safety in production |
| 4 | Safety education | Necessary means of transmitting safety experience |
| 5 | Workers’ emotions | The tendency and dynamic response of workers to objects based on their needs |
| 6 | Safety culture | Safe production mode in construction industry |
| 7 | Safety leadership | Managers’ ability regarding safety guidance and command for construction workers |
| 8 | Work experience | Work background of workers in construction industry |
| 9 | Safety compliance | Workers’ compliance with production safety regulations |
| 10 | Workers’ fatigue | The state of long-term and high-load physical labor of construction workers |
| 11 | Level of skill | Construction workers’ ability to work |
| 12 | Safety input | Relevant incentive policies developed to ensure all human, material and financial resources are invested in security |
| 13 | Safety supervision | Supervision and management of workers’ insecurity by managers |
| 14 | Safety regulation | Enterprise formulates rules and regulations on safe production |
| 15 | Workmate impact | Communicate, monitor and avoid unsafe behavior among employees |
| 16 | Safety communication | Safety leadership of management personnel and cooperation with workers; group communication efficiency |
| 17 | Fabrication condition | The construction environment of construction enterprises and construction teams under reasonable organization construction conditions |
| 18 | Level of management | Managers’ ability regarding safety guidance and command for construction workers |
| 19 | Workers’ character | Attitude to reality and more stable psychological characteristics in habitual behavior |
| 20 | Conservatory measure | Workers protect against threats to certain parts of the body during work |
| 21 | Worker age | Number of years workers have lived |
| 22 | Group cohesiveness | Collective activities organized by managers emphasize cognitive factors of cohesion and group solidarity based on the process of collective activities |
| Scale | Implication |
|---|---|
| Factor i is as important as factor j | |
| The i factor is slightly more important than the j factor | |
| The i factor is more important than the j factor | |
| The i factor is more important than the j factor | |
| The i factor is more important than the j factor |
| n | 3 | 4 | 5 | 6 | 7 | 8 | 9 | 10 |
|---|---|---|---|---|---|---|---|---|
| RI | 0.2843 | 0.4682 | 0.5850 | 0.6607 | 0.7010 | 0.7341 | 0.7618 | 0.7833 |
| Layer A | … | Total ranking weight of layer B | ||||
| Layer B | … | |||||
| Criterion Layer | Factor |
|---|---|
| Human factor | Workmate impact, skills level, age of workers, security attitude, work experience, workers’ fatigue, safety compliance, workers’ character; workers’ emotions |
| Management factor | Group cohesion, safety communication, management level, safety education, security culture, safety regulation, safety supervision; safety input |
| Environmental factor | Safety climate, construction conditions; protection measures |
| Matrix | λmax | Eigenvector | CI | CR | n | Is CR Less than 0.1? |
|---|---|---|---|---|---|---|
| A | 3.000 | (0.381, 0.331, 0.287) | 0.000 | 0.000 | 3 | Yes |
| B1 | 10.256 | (0.149, 0.131, 0.118, 0.110, 0.102, 0.092, 0.085, 0.080, 0.071, 0.061) | 0.028 | 0.036 | 10 | Yes |
| B2 | 9.247 | (0.108, 0.106, 0.109, 0.110, 0.111, 0.113, 0.115, 0.117, 0.111) | 0.031 | 0.041 | 9 | Yes |
| B3 | 3.000 | (0.375, 0.332, 0.293) | 0.000 | 0.000 | 3 | Yes |
| Factor | Weight | Billing | Factor | Weight | Billing |
|---|---|---|---|---|---|
| Protection measures | 0.1076 | 1 | Workmate impact | 0.0367 | 12 |
| Age of workers | 0.0953 | 2 | Workers’ character | 0.0367 | 12 |
| Group cohesion | 0.0841 | 3 | Safety regulation | 0.0367 | 12 |
| Safety climate | 0.0568 | 4 | Safety supervision | 0.0361 | 15 |
| Security awareness | 0.0499 | 5 | Skills level | 0.0357 | 16 |
| Security attitude | 0.0450 | 6 | Safety input | 0.0351 | 17 |
| Safety education | 0.0419 | 7 | Security culture | 0.0351 | 17 |
| Workers’ emotions | 0.0390 | 8 | Security leadership | 0.0324 | 19 |
| Management level | 0.0387 | 9 | Work experience | 0.0305 | 20 |
| Construction conditions | 0.0381 | 10 | Workers’ fatigue | 0.0271 | 21 |
| Safety communication | 0.0374 | 11 | Safety compliance | 0.0232 | 22 |
| Worker Information | Attributes | Proportion |
|---|---|---|
| Age | 18–26 | 8% |
| 27–35 | 22% | |
| 36–44 | 24% | |
| 45–53 | 40% | |
| 53 and above | 6% | |
| Has the worker experienced an accident | Experienced an accident | 24% |
| No accident | 76% | |
| Area | Sichuan | 17% |
| Shandong | 19% | |
| Jiangsu | 20% | |
| Jilin | 13% | |
| Others | 31% | |
| Education level | Bachelor’s degree and above | 1% |
| Specialist | 15% | |
| High school | 31% | |
| Junior high school and below | 53% | |
| Type of work | Skilled worker | 27% |
| Ordinary worker | 52% | |
| Manager | 14% | |
| Others | 7% | |
| Gender | Female | 22% |
| Male | 78% |
| Grade | State | Fractional Interval |
|---|---|---|
| 1 | Security | (0, 0.25) |
| 2 | Mild risk | (0.25, 0.5) |
| 3 | Moderate risk | (0.5, 0.75) |
| 4 | Severe risk | (0.75, 1) |
| Sample Number | True Score | Actual Grade | Actual States | Predictive Score | Prediction Grade | Prediction State | Is the State Predicted Correctly? |
|---|---|---|---|---|---|---|---|
| 1 | 0.304 | 2 | Mild risk | 0.265 | 2 | Mild risk | Y |
| 2 | 0.391 | 2 | Mild risk | 0.380 | 2 | Mild risk | Y |
| 3 | 0.782 | 4 | Severe risk | 0.723 | 3 | Moderate risk | N |
| 4 | 0.782 | 4 | Severe risk | 0.720 | 3 | Moderate risk | N |
| 5 | 0.304 | 2 | Mild risk | 0.273 | 2 | Mild risk | Y |
| 6 | 0.695 | 3 | Moderate risk | 0.729 | 3 | Moderate risk | Y |
| 7 | 0.043 | 1 | Security | 0.257 | 2 | Mild risk | N |
| 8 | 0.739 | 3 | Moderate risk | 0.680 | 3 | Moderate risk | Y |
| 9 | 0.608 | 3 | Moderate risk | 0.685 | 3 | Moderate risk | Y |
| 10 | 0.173 | 1 | Security | 0.252 | 2 | Mild risk | N |
| 11 | 0.217 | 1 | Security | 0.257 | 2 | Mild risk | N |
| 12 | 0.565 | 3 | Moderate risk | 0.690 | 3 | Moderate risk | Y |
| 13 | 0.652 | 3 | Moderate risk | 0.728 | 3 | Moderate risk | Y |
| 14 | 0.260 | 2 | Mild risk | 0.286 | 2 | Mild risk | Y |
| 15 | 0.391 | 2 | Mild risk | 0.401 | 2 | Mild risk | Y |
| Hidden Layer 1 | Hidden Layer 2 | Hidden Layer 3 | Hidden Layer 4 | Hidden Layer 5 | Hidden Layer 6 | Hidden Layer 7 | Hidden Layer 8 | |
|---|---|---|---|---|---|---|---|---|
| Input layer 1 | 0.367 | 0.344 | −0.523 | 0.445 | 0.117 | −0.261 | −0.312 | 0.162 |
| Input layer 2 | 0.541 | 0.404 | −0.502 | 0.513 | 0.492 | 0.156 | 0.086 | −0.221 |
| Input layer 3 | −0.111 | 0.293 | 0.134 | 0.571 | 0.134 | −0.325 | 0.182 | 0.686 |
| Input layer 4 | 0.179 | 0.067 | 0.036 | 0.109 | 0.117 | −0.147 | −0.099 | −0.257 |
| Input layer 5 | −0.254 | −0.482 | −0.315 | 0.425 | 0.199 | −0.045 | 0.331 | −0.544 |
| Input layer 6 | −0.075 | −0.172 | 0.158 | 0.422 | −0.397 | 0.106 | −0.193 | 0.241 |
| Input layer 7 | 0.262 | 0.224 | −0.396 | 0.259 | 0.156 | −0.234 | −0.49 | 0.021 |
| Input layer 8 | 0.526 | −0.291 | −0.07 | −0.174 | 0.25 | −0.101 | −0.144 | 0.415 |
| Input layer 9 | 0.444 | 0.368 | 0.033 | −0.27 | −0.458 | −0.102 | 0.045 | −0.326 |
| Input layer 10 | 0.344 | −0.388 | 0.429 | −0.069 | −0.391 | −0.091 | −0.033 | 0.113 |
| Input layer 11 | −0.182 | 0.232 | −0.053 | 0.171 | 0.433 | −0.034 | −0.005 | 0.234 |
| Input layer 12 | −0.135 | 0.003 | −0.675 | −0.372 | −0.004 | 0.476 | 0.41 | −0.392 |
| Input layer 13 | 0.095 | −0.016 | −0.334 | −0.283 | −0.413 | 0.424 | −0.236 | −0.059 |
| Input layer 14 | −0.384 | 0.084 | −0.21 | 0.266 | 0.187 | 0.392 | −0.247 | −0.384 |
| Input layer 15 | −0.298 | 0.359 | −0.275 | 0.335 | 0.029 | 0.669 | −0.515 | −0.063 |
| Input layer 16 | −0.425 | 0.495 | −0.381 | 0.262 | 0.359 | 0.429 | −0.506 | −0.186 |
| Input layer 17 | −0.292 | 0.219 | 0.019 | 0.537 | −0.414 | −0.094 | −0.581 | −0.325 |
| Input layer 18 | 0.421 | −0.018 | −0.171 | −0.164 | 0.37 | 0.312 | −0.444 | 0.051 |
| Input layer 19 | −0.103 | −0.459 | −0.168 | −0.288 | −0.408 | −0.136 | −0.358 | −0.33 |
| Input layer 20 | 0.462 | 0.3 | −0.318 | 0.219 | −0.242 | 0.646 | −0.424 | −0.218 |
| Input layer 21 | 0.337 | −0.138 | −0.096 | −0.073 | −0.504 | −0.249 | 0.277 | 0.465 |
| Input layer 22 | 0.079 | −0.507 | −0.341 | −0.121 | 0.341 | −0.405 | −0.625 | −0.243 |
| Factor | Weight | Criterion Layer | Factor | Weight | Criterion Layer |
|---|---|---|---|---|---|
| Safety communication | 0.062 | Management factor | Safety regulation | 0.044 | Management factor |
| Security awareness | 0.060 | Human factor | Age of workers | 0.044 | Human factor |
| Protection measures | 0.058 | Environmental factor | Workers’ fatigue | 0.042 | Human factor |
| Group cohesion | 0.054 | Management factor | Security leadership | 0.042 | Management factor |
| Workers’ emotions | 0.053 | Human factor | Work experience | 0.040 | Human factor |
| Workmate impact | 0.052 | Human factor | Management level | 0.040 | Management factor |
| Safety climate | 0.052 | Environmental factor | Safety supervision | 0.038 | Management factor |
| Construction conditions | 0.051 | Environmental factor | Safety compliance | 0.038 | Human factor |
| Safety input | 0.050 | Management factor | Security culture | 0.036 | Management factor |
| Security attitude | 0.050 | Human factor | Skills level | 0.027 | Human factor |
| Workers’ character | 0.046 | Human factor | Safety education | 0.021 | Management factor |
| Serial Number | Factor | Serial Number | Factor |
|---|---|---|---|
| 1 | Safety climate | 12 | Safety input |
| 2 | Security awareness | 13 | Safety supervision |
| 3 | Security attitude | 14 | Safety regulation |
| 4 | Safety education | 15 | Workmate impact |
| 5 | Workers’ emotions | 16 | Safety communication |
| 6 | Security culture | 17 | Construction conditions |
| 7 | Security leadership | 18 | Management level |
| 8 | Work experience | 19 | Workers’ character |
| 9 | Workers’ fatigue | 20 | Protection measures |
| 10 | Safety compliance | 21 | Age of workers |
| 11 | Skills level | 22 | Group cohesion |
| Worker Number | Type of Work | Predictive Score | Prediction Grade | Early Warning States | Worker Number | Type of Work | Predictive Score | Prediction Grade | Early Warning States |
|---|---|---|---|---|---|---|---|---|---|
| 1 | Plasterer | 0.32 | 2 | Mild risk | 17 | Frame workers | 0.267 | 2 | Mild risk |
| 2 | 0.339 | 2 | Mild risk | 18 | 0.268 | 2 | Mild risk | ||
| 3 | 0.361 | 2 | Mild risk | 19 | 0.27 | 2 | Mild risk | ||
| 4 | 0.367 | 2 | Mild risk | 20 | 0.272 | 2 | Mild risk | ||
| 5 | 0.378 | 2 | Mild risk | 21 | 0.721 | 3 | Moderate risk | ||
| 6 | 0.385 | 2 | Mild risk | 22 | 0.724 | 3 | Moderate risk | ||
| 7 | 0.386 | 2 | Mild risk | 23 | 0.731 | 3 | Moderate risk | ||
| 8 | 0.393 | 2 | Mild risk | 24 | 0.735 | 3 | Moderate risk | ||
| 9 | Steel workers | 0.282 | 2 | Mild risk | 25 | Masonry workers | 0.32 | 2 | Mild risk |
| 10 | 0.284 | 2 | Mild risk | 26 | 0.339 | 2 | Mild risk | ||
| 11 | 0.287 | 2 | Mild risk | 27 | 0.361 | 2 | Mild risk | ||
| 12 | 0.289 | 2 | Mild risk | 28 | 0.367 | 2 | Mild risk | ||
| 13 | 0.29 | 2 | Mild risk | 29 | 0.378 | 2 | Mild risk | ||
| 14 | 0.713 | 3 | Moderate risk | 30 | 0.385 | 2 | Mild risk | ||
| 15 | 0.715 | 3 | Moderate risk | 31 | 0.386 | 2 | Mild risk | ||
| 16 | 0.718 | 3 | Moderate risk | 32 | 0.71 | 3 | Moderate risk |
| Worker Number | Factor | 500% Change | 700% Change | 900% Change | 1100% Change | ||||
|---|---|---|---|---|---|---|---|---|---|
| Score | State | Score | State | Score | State | Score | State | ||
| 1 | Safety climate | 0.674 | III | 0.6 | III | 0.497 | II | 0.406 | II |
| 1 | Security leadership | 0.496 | II | 0.364 | II | 0.307 | II | 0.289 | II |
| 1 | Safety communication | 0.673 | III | 0.604 | III | 0.516 | III | 0.43 | II |
| 2 | Safety climate | 0.43 | II | 0.313 | II | 0.287 | II | 0.282 | II |
| 2 | Security leadership | 0.581 | III | 0.477 | II | 0.38 | II | 0.32 | II |
| 2 | Workmate impact | 0.632 | III | 0.554 | III | 0.488 | II | 0.438 | II |
| 2 | Safety communication | 0.65 | III | 0.579 | III | 0.503 | III | 0.432 | II |
| 2 | Protection measures | 0.652 | III | 0.588 | III | 0.524 | III | 0.471 | II |
| 3 | Security leadership | 0.606 | III | 0.527 | III | 0.441 | II | 0.369 | II |
| 3 | Workmate impact | 0.632 | III | 0.569 | III | 0.518 | III | 0.478 | II |
| 4 | Safety climate | 0.679 | III | 0.618 | III | 0.521 | III | 0.42 | II |
| 4 | Workmate impact | 0.632 | III | 0.569 | III | 0.508 | III | 0.456 | II |
| 4 | Safety communication | 0.48 | II | 0.365 | II | 0.312 | II | 0.31 | II |
| 4 | Protection measures | 0.643 | III | 0.595 | III | 0.544 | III | 0.495 | II |
| Worker Number | Before Training | After Training | ||||
|---|---|---|---|---|---|---|
| Score | Grade | State | Score | Grade | State | |
| 1 | 0.735 | 3 | Moderate risk | 0.67 | 3 | Moderate risk |
| 2 | 0.731 | 3 | Moderate risk | 0.671 | 3 | Moderate risk |
| 3 | 0.724 | 3 | Moderate risk | 0.694 | 3 | Moderate risk |
| 4 | 0.721 | 3 | Moderate risk | 0.672 | 3 | Moderate risk |
Disclaimer/Publisher’s Note: The statements, opinions and data contained in all publications are solely those of the individual author(s) and contributor(s) and not of MDPI and/or the editor(s). MDPI and/or the editor(s) disclaim responsibility for any injury to people or property resulting from any ideas, methods, instructions or products referred to in the content. |
© 2023 by the authors. Licensee MDPI, Basel, Switzerland. This article is an open access article distributed under the terms and conditions of the Creative Commons Attribution (CC BY) license (https://creativecommons.org/licenses/by/4.0/).
Share and Cite
Liu, N.; Xie, D.; Wang, C.; Bai, Y. Influencing Factors and Prewarning of Unsafe Status of Construction Workers Based on BP Neural Network. Appl. Sci. 2023, 13, 4026. https://doi.org/10.3390/app13064026
Liu N, Xie D, Wang C, Bai Y. Influencing Factors and Prewarning of Unsafe Status of Construction Workers Based on BP Neural Network. Applied Sciences. 2023; 13(6):4026. https://doi.org/10.3390/app13064026
Chicago/Turabian StyleLiu, Ningning, Danfeng Xie, Changlong Wang, and Yun Bai. 2023. "Influencing Factors and Prewarning of Unsafe Status of Construction Workers Based on BP Neural Network" Applied Sciences 13, no. 6: 4026. https://doi.org/10.3390/app13064026
APA StyleLiu, N., Xie, D., Wang, C., & Bai, Y. (2023). Influencing Factors and Prewarning of Unsafe Status of Construction Workers Based on BP Neural Network. Applied Sciences, 13(6), 4026. https://doi.org/10.3390/app13064026