Abstract
Traffic infrastructure safety is a core topic in traffic construction and development. As the impact of global climate change becomes more and more significant, extreme weather brings more and more safety issues to the normal operation of subway systems. Therefore, it is an urgent issue in the construction of subway systems to fully prepare for extreme weather and improve system resilience under external disturbances. The resilience of a complex system generally refers to its ability to adapt to external disturbances and return to a functional state. As one of several key infrastructure systems in large cities, a subway system needs to be highly resilient to cope with various risks, and it needs to recover quickly under uncertain weather conditions and other external damage events. In order to achieve the goal of conducting a real-time resilience assessment of a subway system, this study adopts the Bayesian network and the traditional failure mode and effect analysis (FMEA) method to realize resilience assessment with multiple performance indicators. Combined with the risk matrix method from FMEA, multiple important indicators of a subway system under the influence of extreme weather are obtained. These important indicators are integrated into the resilience assessment of the subway system within a Bayesian method. In this paper, the feasibility and applicability of the proposed method are verified by taking the Changping Line of the Beijing subway under extreme rainfall weather (>10 mm) as a case.
1. Introduction
Transportation infrastructure safety is a core issue in construction and development. As the impact of global climate change becomes more and more pronounced, countries around the world are being affected by an increasing number of extreme weather events, which have brought more and more security issues to the normal operation of national transportation systems [1]. In order to deal with the above-mentioned safety problems of subway systems, it is very critical to evaluate resilience objectively and accurately. The resilience of a complex system generally refers to its ability to adapt to external disturbances and return to a functional state. As one of several key infrastructure systems in large cities, the subway system needs to be highly resilient to cope with various risks and to quickly recover from external damage events. In order to achieve this goal, it is urgent to establish a subway resilience assessment model based on an accurate extreme weather forecast and on the historical data of a subway system operation. In this way, the resilience assessment of an online subway system under extreme weather can be realized.
In terms of the resilience of critical infrastructure systems, the quantitative resilience index currently used by scholars mainly includes the following. The first is the famous “resilience triangle” method proposed by M. Bruneau et al. in 2003 [2]. This index has good generality and has been applied to different types of system resilience assessments. In addition, A. Rose defined static toughness and dynamic toughness, respectively [3]. A time-varying system resilience index was proposed by D. Henry and J.E. Ramirez-Marquez in 2012 [4]. In 2010, J.W. Wang and others proposed the resilience index of enterprise information systems after damage [5]. In 2014, a resilience index for infrastructure network systems based on complex network theory was proposed by M. Omer et al. [6]. In addition to the above indicators for the quantitative calculation of system resilience in a deterministic way, some scholars have proposed resilience indicators that consider randomness [7,8,9,10].
The resilience assessment of transportation networks has always been a widespread subject of scholars, which is also one of the main aspects of applying the resilience assessment method to practical infrastructures [11,12,13,14]. In terms of transportation network resilience assessment, scholars have also proposed different resilience indices and specific calculation methods [15,16,17,18,19]. For example, the National Infrastructure Advisory Council defined the resilience of infrastructure systems as the ability of a system to predict, withstand, adapt, and recover from natural disasters and other destructive events [15]. In 2012, T.M. Adams and others applied the resilience triangle method to evaluate the resilience of highway networks under extreme weather [16]. In 2014, R. Faturechi and E. Miller-Hooks gave a mathematical model to achieve the calculation and comprehensive optimization of evaluation indicators such as coping ability, readiness, robustness, flexibility, and resilience [17]. In 2015, two intrinsic traffic resilience indexes for inland water transport networks were proposed by H. Baroud et al. [18]. In 2017, A.A. Ganin and others studied the assessment method for the efficiency and resilience of urban transportation networks [19]. W. Wang et al. studied the performance degradation process of traffic networks under flood damage based on network seepage in 2019 [20]. In addition, L. Zhang et al. studied the resilience of urban traffic networks under congestion failure [21]. N.U.I. Hossain et al. studied the resilience of port infrastructure based on a Bayesian network approach [22]. In 2020, Y. Saadat et al. identified vulnerable segments for resilience analysis of the Washington DC metro network and proposed approaches for obtaining recovery strategies considering both connectivity and total cost minimization [23]. In 2021, Y. Gao and J.W. Wang provided an approach for the resilience assessment of urban transportation systems considering the effects of recovery strategies, which can address the issue of lacking recovery process modeling in traditional system resilience analyses [24]. In 2022, X. Pan et al. proposed approaches for simplifying traffic network modeling and studied resilience recovery optimization considering recovery sequence and resource allocation [25]. More recently, Q. Qi et al. introduced robustness and vulnerability measurements for the subway network, and optimized subway system resilience under general station interruption, interchange station interruption, or traffic tunnel failure [26].
Some scholars in the field of transportation network resilience assessment have defined resilience from different perspectives. A commonality among these definitions is that they all emphasize the ability of the system to remain functional under a disruptive event, as well as the time and resources required to restore system performance. However, these transportation system resilience analyses still have the following disadvantages. First, most previous studies only focused on assessing the resilience of transportation networks under certain types of disruptive events, ignoring the critical issue of system resilience prediction before a new disruptive event. Moreover, specifically for subway systems, their resilience usually considers only one operation indicator, while the performance of the subway system is usually characterized by a set of indicators. Therefore, it is of great significance to evaluate the resilience of subway systems from the perspective of multiple indicators and provide predictions before new external disruptive events. From this perspective, this paper proposes a new method for evaluating the resilience of subway systems before new extreme rainfall events, combining the failure mode and effect analysis (FMEA) method and the Bayesian network method.
In this paper, the functional structure of a subway system is decomposed, and a complete set of performance indicators is obtained. Then, by introducing the FMEA technology that has been successfully applied to reliability analysis, the possible failure modes are determined, and indicators with high-risk levels are identified. Based on the proposed resilience assessment index system and combined with meteorological monitoring data, a Bayesian network model for subway resilience assessment is established. The objectives of this work are to estimate line-level resilience under extreme weather and realize resilience assessment with multi-indicators. In this way, this work can be helpful to assist in the smart operation of Beijing’s subway systems. Different from previous works using Bayesian networks to find major factors that influence system resilience, such as N.U.I. Hossain et al. [22], this work uses Bayesian networks to characterize how extreme weather events impact system resilience and assess subway system resilience under new weather events.
The structure of this paper is as follows. Section 2 proposes and constructs the subway system resilience index system and combines the FMEA analysis to determine the key resilience indicators of the subway system. Section 3 builds the resilience assessment model of a subway system based on actual data. Section 4 takes the failure data of the Changping Line of the Beijing subway in extreme rainfall weather as a case and outputs its resilience assessment results. Section 5 concludes the article.
2. Risk-Based Performance Indicators Selection
FMEA is a technique used to identify failures in the system design and production before they reach the customers [27,28]. When applying FMEA, we should analyze the failure mode, failure cause, and failure impact of the subway system. In the traditional FMEA method, risk analysis is usually adopted to evaluate the importance of each failure mode. Thus, this section introduces the risk analysis method of a subway system, including the importance of the evaluation of operating indicators and the failure probability calculation.
2.1. Failure Risk Analysis of a Subway System
The risk analysis of the subway system can obtain the critical failure modes that affect the operation of the subway. The corresponding performance indicators of these critical failure modes are used for resilience assessment.
2.1.1. Risk Assessment
Risk assessment is a method to assess the impact and possibility of potential failures [29]. Based on the results of the risk analysis, the shortcomings of the subway system can be identified.
2.1.2. Risk Matrix Approach
The risk matrix can visually express the risk levels in the system, which is helpful for researchers to determine the key parts of risk management [30]. An example of the risk matrix is shown in Figure 1.
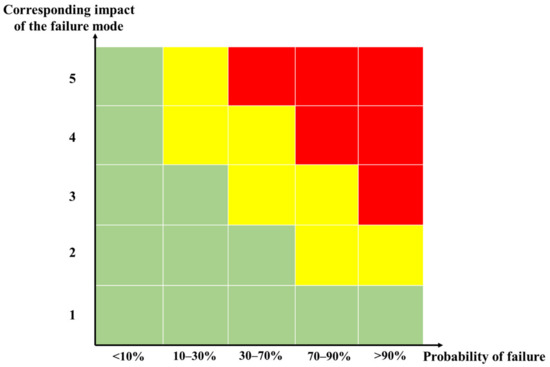
Figure 1.
An example of the risk matrix.
In the risk matrix, the x-axis represents the failure probability and the y-axis represents the corresponding impact of the failure mode. The specific discretization of the x-axis and y-axis can be determined according to the actual system. In Figure 1, the green-marked slots represent low-risk failure modes, yellow-marked slots represent medium-risk failure modes, and red-marked ones represent high-risk failure modes. The yellow- and red-marked modes are the important failure modes whose risks should be reduced and controllable.
In Section 2.2 and Section 2.3, the methods for calculating the failure mode impact (y-axis) and failure probability (x-axis) of the risk matrix are introduced briefly.
2.2. Impact Analysis for Risk Assessment
In order to carry out the risk analysis, it is necessary to decompose the system into minimal functional units. In this way, the full set of operating parameters and their impact on the system behavior can be determined.
2.2.1. Function Decomposition
The purpose of functional structure decomposition is to divide the main system into several sub-systems. Each sub-system has a corresponding function, and we can analyze its failure mode. The subsystems can be divided into the first-level subsystem, the second-level subsystem, and so on. The minimum subsystem is determined by the feature of the main system. Figure 2 is an example of the functional decomposition diagram.
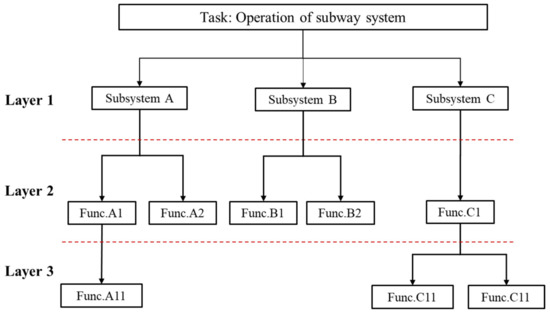
Figure 2.
An example of the functional decomposition of a subway system.
2.2.2. Determining the Full Set of Operating Parameters
In order to obtain the full set of operating parameters, the important step is to analyze the failure modes and failure causes of the subway system.
A failure mode is the manifestation of a corresponding failure. The failure mode is usually defined according to the phenomenon that causes the subway system failure, such as lighting failure, drainage system failure, power supply system failure, etc. When analyzing the failure of a specific system of a subway, it is necessary to analyze the function of the system. Combining the function decomposition of the subway system, the complete set of failure modes is obtained.
Failure cause analysis can start from two dimensions, namely, direct causes and indirect causes. In the process of analyzing the failure causes of a subway system under extreme weather, the direct cause mainly refers to the specific extreme weather conditions, such as strong wind and heavy rainfall. Different weather may lead to different failure modes. Indirect reasons refer to the characteristics of the station or line itself, such as the transfer station and large passenger flow station, etc. The combination of these two reasons constitutes the failure causes of the functions.
According to the failure modes and failure causes of a subway system and expert experience, we can obtain the operating parameters corresponding to the relevant functions of sub-systems. The operating parameters corresponding to all sub-functions form the complete set of operating parameters.
2.2.3. Operating Parameter Importance Evaluation
The purpose of failure impact analysis is to determine the impact of each possible failure mode of a subway system and analyze its severity. According to the severity of the failure modes, we can identify the important evaluation results of the corresponding operating parameters.
Combining the failure mode analysis, failure cause analysis, and function decomposition, the failure impact can be obtained, that is, the impact of the failure modes under different failure causes on the operating parameters. The greater the degree of impact, the higher the importance of the operating parameters. The criteria for evaluating the operating parameters importance are shown in Table 1 below.

Table 1.
Criteria for operating parameters importance evaluation.
The relationship of the failure mode, failure cause analysis, function decomposition, and operating parameters is shown in Figure 3.
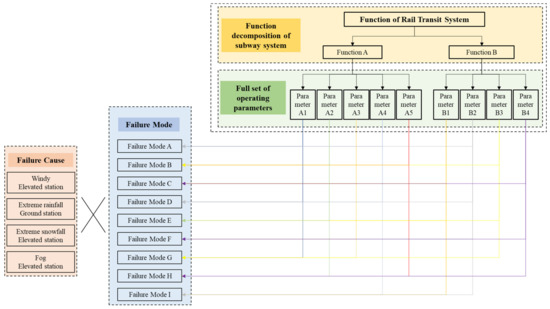
Figure 3.
The relationship of the failure mode, failure cause analysis, function decomposition, and operating parameters.
2.3. Probability Calculation of Each Failure Mode
The probability corresponding to the failure mode can be calculated from the data. The probability of the failure modes determines the x-axis of the risk matrix.
According to the various failure modes and their corresponding failure causes that have been analyzed, combined with the statistical data of subway operation failures, the probability of failure modes can be obtained through statistical analysis. The method of calculating the failure probability is divided into the steps below.
First, count the data on extreme weather. It is necessary to define the number of days of extreme weather, in this way, the corresponding failure on these days can be counted.
Second, combined with the corresponding failure data. The number of failures in extreme weather can be obtained for each subway line or station.
Third, calculate the probability of each failure. Usually, we consider the occurrence of a failure corresponding to the extreme weather as the probability of the failure.
In this way, we can calculate the probability of the failure modes in Equation (1).
where, and represent the number of failures in extreme weather and normal weather, respectively; and represent the number of days of extreme weather and normal weather, respectively.
In order to divide the x-axis of the risk matrix, we should divide the failure probability into different categories. The common standard of the category as shown in Table 2.

Table 2.
Classification levels of failure probability.
3. Resilience Assessment with Multiple Performance Indicators
3.1. Resilience Metrics of Subway Lines under Extreme Precipitation
Based on the key performance indicators obtained via the risk matrix analysis in the previous section, the historical data of the above key performance indicators of different lines in the Beijing subway system are collected over a period to form a time series of the indicators at line level. Necessary data analysis and pre-processing are performed on these historical time series as needed.
Considering severe weather events such as heavy rainfall, the resilience process curves of each key performance indicator are obtained. Based on the classical resilience assessment methods such as the “resilience triangle”, each key performance indicator of each line is defined, reflecting how the key performance indicators under each severe weather are affected, and supporting the multi-dimensional line resilience assessment that integrates different aspects of each key performance indicator. A schematic of the variation process containing degradation and recovery stages of each key performance indicator for subway lines is shown in Figure 4, where different lines indicate different key performance indicators for a subway line.
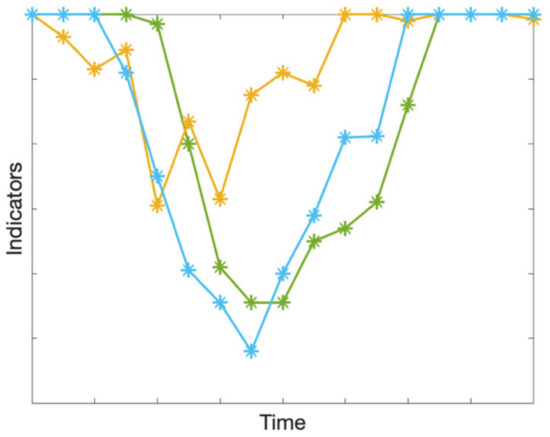
Figure 4.
Schematic of the variation of line key indicators in the Beijing subway system over time.
3.2. Bayesian Network Modeling for Resilience Assessment
In the previous subsection, the historical operational data of each line of the Beijing subway system required for the subway resilience assessment were obtained and preprocessed, and the time series of different key performance indicators of each line for the time periods before and after each of the severe weather events were generated. The corresponding resilience assessment indicators were also defined. Here, the Bayesian network model required for the resilience assessment is developed based on these data. Above all, a multi-dimensional method for resilience assessment at the subway line level can be completed with the subway resilience indicator system and FMEA proposed in this work.
First, we create the variables of parent and child nodes for the Bayesian network model. The structure of this Bayesian network is schematically shown in Figure 5. The child node in the Bayesian network (the red node in Figure 5) represents the resilience values for each key performance indicator of each line estimated during severe weather. In order to estimate a resilience value, the main influencing factors associated with it are selected as each parent node (each blue node in Figure 5). This work focuses on the effects of different types and severity levels of severe weather events on the resilience values of subway system lines. Therefore, several influencing factors such as the type of severe weather, the time when the severe weather occurs, and the spatial distribution of the severe weather are considered here as the parent nodes in the constructed Bayesian network.
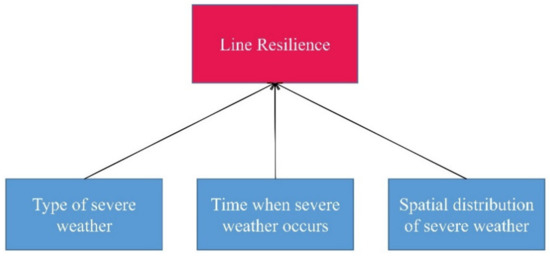
Figure 5.
Schematic of the Bayesian network structure in the resilience assessment.
After that, we define random variables for all parent and child nodes in the Bayesian network. Some of them can be discrete variables, while others are continuous variables. Moreover, the continuous variables among them are transformed into discrete variables by discretization to facilitate calculation. In addition, it is noted that the spatial distribution of severe weather may be multi-dimensional in distribution. Therefore, it is also necessary to be decomposed into multiple one-dimensional variables. At this point, the structure of the Bayesian network has been determined, and it can be assumed that the listed individual parent nodes have casual relationships with the child node.
Finally, it is necessary to obtain the historical time series for each parent and child variable based on the historical data obtained in the previous section. For the child node (line resilience) of the Bayesian network, it is possible to directly start from the data obtained in the previous section on the change in each key performance indicator for different lines before and after each severe weather event, and calculate the area of the resilience triangle for that indicator for a period after each event as the line’s resilience value for that key performance indicator during that severe weather event. Thus, the resilience value of each key performance indicator for each line can be obtained after severe weather events in history, thus forming a time series of length for the child node. For each parent variable, a value for that variable can be obtained similarly after each severe weather event in history, thus also forming a historical time series of length for each parent. We denote the time series of parent and child nodes by and , , where represents the number of parent nodes.
3.3. Resilience Assessment of Subway Lines Considering Multiple Performance Indicators
First, the estimation of the subway line resilience given information of a new severe weather event can be conducted based on the Bayesian probability theory. According to the Bayesian probability formula, if the joint probability distribution of the parent variable and the child variable is known, the conditional probability distribution of the child variable can be obtained as:
Thus, the estimates of the child variable given the observed values of the parent variables can be obtained by Equation (3):
After the above, the inference formula for the Bayesian network model of resilience assessment at the line level during severe weather events can be formed. The joint distribution of parent and child variables can be obtained by fitting the Gaussian mixture distribution with the historical time series of all nodes to form the formula for the conditional expectation of the child node. This resilience assessment model reflects the effect of the main influencing factors such as basic characteristics of lines, passenger flow characteristics, traffic capacity, equipment capacity, and safety and emergency response capacity on the resilience assessment results of lines. Using the proposed model, the predicted resilience value of each key performance indicator under a new extreme weather event can be calculated.
Finally, based on the results of the severity levels of different key performance indicators of the subway obtained in the FMEA, the weights of key indicators are defined. The assessment result of the overall resilience of each line can be obtained by calculating the weighted average. Through certain discretization methods, the resilience levels of lines can be determined to support the emergency management of the subway system. The schematic of the line resilience assessment results is shown in Figure 6. Here, different resilience assessment results of different subway lines are marked with different colors.
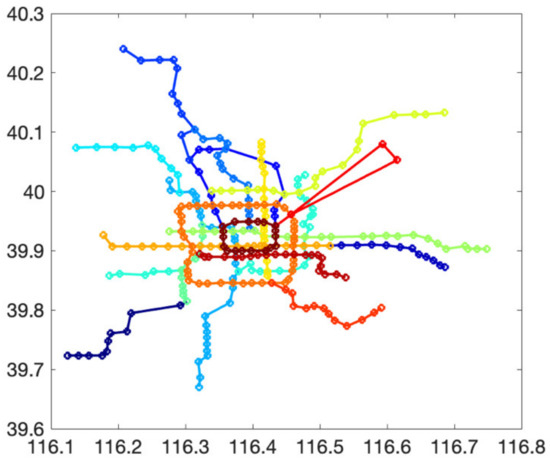
Figure 6.
Schematic of the results of the subway line resilience assessment.
4. Case Study
4.1. Description of Data Considered in the Case Study
According to the function decomposition, the subway system can be divided into six subsystems, namely, the electromechanical system, the signal system, the communication system, the power supply system, the line system, and the vehicle system. The structure of the subway system is shown in Figure 7.
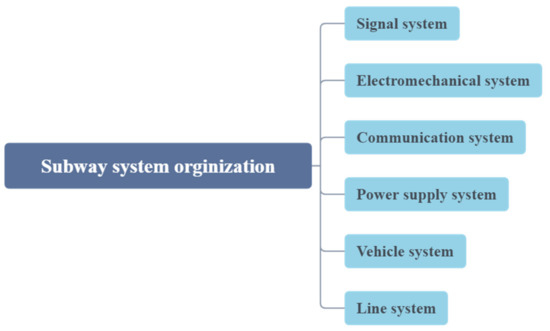
Figure 7.
The structure of the subway system.
Due to the large number of lines in the Beijing subway system, this paper selects the Changping Line as a case to analyze the failure mode in the case of extreme rainfall weather. According to the results of the risk analysis, the resilience assessment of the Changping Line is carried out.
4.2. Risk Analysis of Changping Line
4.2.1. Operating Parameter Importance Evaluation
The function decomposition of the subway system is mainly carried out from the level of its equipment structure. Electromechanical equipment can be divided into nine subsystems, the signal system can be divided to sixteen subsystems, the communication system can be divided into nine subsystems, the power supply system can be divided into four subsystems, the line system can be divided into three subsystems, and the vehicle system can be divided into eight subsystems. Each subsystem has a corresponding function, which has the corresponding operating parameters.
In order to obtain the operating parameters, a failure mode and failure cause analysis should be conducted. In the process of failure mode analysis, referring to the current failure data recording in the subway system, the possible failure modes of the sub-systems in extreme rainfall are determined. In this case study, we analyze the failure data of the Changping Line in the Beijing subway, and the characteristics of each station are not considered. Thus, only the failure caused by extreme weather is considered.
Combined with the failure data and failure modes, we can obtain the full set of the operating parameters corresponding to the sub-functions in extreme weather. In this case, we regard the sub-functions as the operating parameters. The relationship between failure modes and operating parameters of the electromechanical system is shown in Table 3. The rest of the failure modes analysis results of the Changping Line are shown in Appendix A.

Table 3.
The failure mode analysis results of the electromechanical system—examples.
After clarifying the failure modes and corresponding failure causes, combined with the sub-functions of the subway system, the relationship of these parts of the electromechanical system can be obtained as shown in Table 4. The rest of the relationship results can be seen in Appendix A.

Table 4.
The relationship of failure modes, failure causes, and sub-functions of the electromechanical system—examples.
After obtaining the sub-function and the corresponding failure modes, the importance evaluation of the sub-function is conducted. The importance evaluation of each sub-function is scored by experts on the Beijing subway system. Combined with the failure data in the past years and the expert experience during the subway operation, the score of the sub-function is obtained.
Combined with Table 3 and Table 4 and expert scoring, the importance evaluation results of the operating parameters can be obtained in Table 5. The rest of the scoring results can be seen in Appendix A.

Table 5.
The importance evaluation results of the electromechanical system—examples.
4.2.2. Probability of Failure Mode
According to the method in Section 2.3, the failure probability of the failure modes caused by extreme rainfall can be calculated as shown in the following steps.
First, count the data of extreme rainfall days from 2018 to 2022. Here, rainfall in a single day exceeding 10 mm is considered extreme rainfall; therefore, there are 96 days of extreme rainfall in total.
Second, combined with the failure data of 5 years, the number of failures in extreme rainfall days in the Changping Line can be obtained.
Third, according to the failure data, the failure probability of each failure mode can be calculated by the following equation:
According to Equation (4), the failure probability of the Changping Line can be calculated as shown in Table 6. The rest of the failure probability results are shown in Appendix A.

Table 6.
Failure mode probability of electromechanical system of each line—examples.
Based on the above results, we can divide the failure probability of failure modes into five categories as shown in Table 7.

Table 7.
Classification levels of failure probability.
4.2.3. Risk Matrix of Changping Line
After obtaining the corresponding failure probability and the importance evaluation results of the Changping Line, the risk matrix under extreme rainfall can be drawn according to the method in Section 2.1. For the Changping Line, the comprehensive evaluation results of the electromechanical system are shown in Table 8. The results of other systems are shown in Appendix A.

Table 8.
The comprehensive results of the electromechanical system of the Changping Line.
According to the comprehensive evaluation results, the risk matrix of the Changping Line under extreme rainfall weather can be drawn in Figure 8. Based on the analysis results, the position of the operating parameters in the risk matrix can be determined.
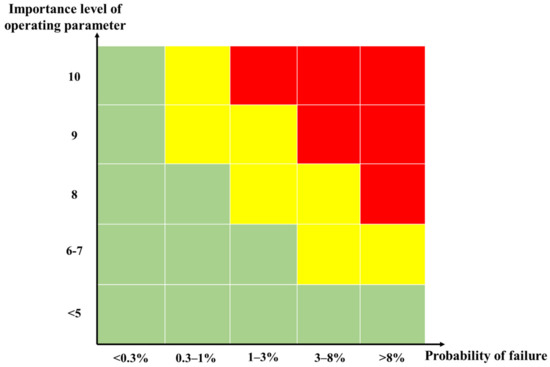
Figure 8.
Risk matrix of the Changping Line.
Combined with the results of the risk matrix, for the Changping Line, in extreme rainfall weather, the important indicators are escalators, moving walks, and barrier-free access, low-voltage power distribution system, traction power supply system, switch equipment, and vehicle connection system. The resilience assessment of the Changping Line can be carried out based on the important indicators.
4.3. Resilience Assessment Results
Here, the proposed approach for subway line resilience assessment is applied to estimate the resilience level of the Changping Line under heavy rainfall. We construct the Bayesian network model for each of the obtained five key performance indicators “escalators, moving walks and barrier-free” access, “low-voltage power distribution system”, “traction power supply system”, “switch equipment”, and “vehicle connection system”. The child node and the parent node represent the resilience value of each indicator and the daily rainfall amount, respectively. Here, the child node has discrete values of resilience areas for each indicator, and the parent node has continuous values of daily rainfall amounts. Based on the failure data in extreme rainfall days in 2022, we calculate the fitted Gaussian mixture distribution over the parent and child nodes for each Bayesian network to obtain the conditional expectation of the child node given the observed value of the parent node. This is the estimated resilience value of each key performance indicator given the information of a new rainstorm event.
As the first case in this paper, we use the last day with extreme rainfall in 2022 (22 August) to test our resilience evaluation approach. The daily rainfall amount of this day is 31.5 mm, which is the input of each Bayesian network we constructed here. Then, the estimated resilience values for all key performance indicators are obtained, and the resilience percentage score for each key performance indicator is calculated as 1 minus the ratio between the estimated resilience value and the maximal resilience value of this indicator in the historical data. A weighted average of the resilience scores for the five key performance indicators is calculated, where the weights are determined based on the risk matrix of the Changping Line obtained from the FMEA, to obtain the overall resilience score for the Changping Line under a new rainstorm event. In the case considered here, the resilience scores, weights, and weighted average resilience scores of each indicator are shown in Table 9. In this case, the resilience score is 98.96 for “escalators, moving walks and barrier-free” access, and 100 for all the other indicators. Then, the overall resilience score of the Changping Line is 99.88. Finally, based on some discretization method, the resilience scores of the five key performance indicators are transformed into the resilience levels. At the same time, the weighted average of the line’s resilience score is also transformed into a grade classification to obtain the overall resilience level of the Changping Line in this extreme rainfall event.

Table 9.
Resilience assessment of the Changping Line under a new rainstorm event (22 August 2022).
As the second case in this paper, we also estimate the resilience of the Changping Line on another day with extreme rainfall (28 July 2022), as shown in Table 10. The daily rainfall amount of this day is 55.5 mm. In this case, we find that “Escalators, moving walks and barrier-free” access has a resilience score of 91.49, which is slightly smaller than the first case. All the other four key indicators have resilience scores of 100. Thus, the resilience score of the entire Changping Line is 99.05 on this day. All of these resilience scores were also transformed into resilience levels.

Table 10.
Resilience assessment of the Changping Line under a new rainstorm event (28 July 2022).
4.4. Analysis of the Results
In the first case illustrated above (22 August 2022), all five key indicators have high resilience levels, while the entire Changping Line also has a high resilience level. The results indicate that these five key sub-systems for the Changping Line tend to have lower failure probabilities on this day. Only “escalators, moving walks and barrier-free” access has a relatively higher chance to fail compared with the other four key sub-systems. Moreover, the whole Changping Line is predicted to have a high resilience level on this day. Notice that the true resilience scores of the five key indicators are all 100 on this day, which helps to validate our resilience evaluation approach.
In the second case (28 July 2022), our results suggest that “escalators, moving walks and barrier-free” access tends to have a relatively higher chance to fail compared with the first case. The other four key indicators are again predicted to be unaffected by this extreme rainfall event. Similar to the first case, all five key indicators, as well as the whole Changping Line, are predicted to have a high resilience level on this day. Moreover, the true resilience score of this day is 80.97 for “escalators, moving walks and barrier-free” access, and they are all 100 for the other four key indicators, which agree well with our resilience evaluation results.
These resilience assessment results support the emergency management of the Changping Line during rainstorm events.
5. Conclusions and Remarks
Through FMEA analysis and the risk matrix method, this paper established the complete operation index of a subway system, and analyzed the important indicators that affect the normal operation of the system. The resilience values of these important indicators were evaluated to obtain the results of the line resilience of the rail transit system. This paper takes the Beijing Subway Changping Line as an example to verify the effectiveness of the proposed method. Through the analysis of the failure data in the past five years, the important indicators affecting the operation of the Changping Line were obtained, and the resilience evaluation was carried out. For two days with extreme rainfall events in 2022, all five key indicators as well as the whole Changping Line were predicted to have high resilience levels. Only “escalators, moving walks and barrier-free” access had a slightly lower resilience score compared with the other four critical sub-systems. The evaluated resilience results agree with the true resilience scores on the same days. Our approach supports the emergency management of subway lines under extreme rainfall events.
However, due to the lack of data, the method proposed in this article has not been verified on more lines and stations of the Beijing subway system. At the same time, because of the poor failure and extreme weather data, the accuracy of the Bayesian network training results is not high enough. On the basis of this research, the authors plan to combine the percolation theory with the Bayesian network model to evaluate the resilience of complex networks in the future.
Author Contributions
Conceptualization, Y.W. and J.L. (Jie Liu); methodology, J.L. (Jingyu Liang) and Y.D.; software, Y.D. and D.Z.; validation, Y.W., Y.N. and F.D.; formal analysis, J.L. (Jingyu Liang) and Y.D.; investigation, Y.W. and F.D.; resources, F.D.; data curation, Y.N.; writing—original draft preparation, J.L. (Jingyu Liang) and Y.D.; writing—review and editing, D.Z. and J.L. (Jie Liu); visualization, J.L. (Jingyu Liang) and Y.D.; supervision, J.L. (Jie Liu); project administration, Y.W., D.Z. and J.L. (Jie Liu); funding acquisition, Y.W. and D.Z. All authors have read and agreed to the published version of the manuscript.
Funding
This research was funded by The National Natural Science Foundation of China grant number 72171009; National Key Technology Research, Development Program of China grant number 2020YFB160070X; Beijing Nova Program grant number Z211100002121098; Beijing Subway Scientific Research Project grant number 2022000581000003.
Institutional Review Board Statement
Not applicable.
Informed Consent Statement
Not applicable.
Data Availability Statement
The data presented in this study are available on request from the corresponding author. The data are not publicly available due to the data comes from the operation process of Beijing subway and cannot be obtained from outside.
Conflicts of Interest
The authors declare no conflict of interest.
Appendix A

Table A1.
The Comprehensive Analysis Results of the Changping Line.
Table A1.
The Comprehensive Analysis Results of the Changping Line.
| System | Coding | Secondary Sub-Function | Failure Mode | Failure Mode Probability | Importance Evaluation Result |
|---|---|---|---|---|---|
| Electromechanical system | 0101 | Environment and equipment monitoring system | Environment control failure | 0.03% | 9 |
| 0102 | Integrated monitoring system | 10 | |||
| 0103 | Escalators, moving walks and barrier-free access | Elevator failure | 3.35% | 6 | |
| 0104 | Low-voltage lighting | Lighting failure | 0.00% | 8 | |
| 0105 | Automatic fire alarm system | Fire alarm failure | 0.04% | 9 | |
| 0106 | Water supply and drainage and fire extinguishing system | Failure of fire extinguishing equipment | 0.00% | 9 | |
| 0107 | Platform door | Platform door failure | −0.27% | 10 | |
| 0108 | Access control system | Water supply and drainage failure | 0.00% | 8 | |
| 0109 | Ventilation air conditioning and heating | HVAC equipment failure | 0.00% | 8 | |
| Signal system | 0201 | Axle counting indoor equipment | Axle counting failure | 0.00% | 9 |
| 0202 | Outdoor shaft counting head | 0.00% | 9 | ||
| 0203 | ATS equipment | ATS failure | 0.08% | 7 | |
| 0204 | Interlocking device | Interlock failure | 0.00% | 9 | |
| 0205 | Switch equipment | Switch equipment failure | 0.38% | 9 | |
| 0206 | Power supply equipment | Power supply failure | 0.00% | 9 | |
| 0207 | Track circuit equipment | 0.00% | 9 | ||
| 0208 | Vehicle ATP/ATO equipment | 0.00% | 9 | ||
| 0209 | Ground ATP equipment | Ground ATP failure | 0.00% | 9 | |
| 0210 | Departure timer | Departure timer failure | 0.00% | 4 | |
| 0211 | Transponder device | 0.00% | 8 | ||
| 0212 | Signal device | Signal machine failure | 0.09% | 9 | |
| 0213 | DCS wired network equipment | DCS failure | 0.00% | 8 | |
| 0214 | DCS wireless network trackside equipment | 0.00% | 8 | ||
| 0215 | DCS wireless network vehicle equipment | 0.00% | 8 | ||
| 0216 | Maintenance monitoring System | 0.00% | 5 | ||
| Communication system | 0301 | Private telephone system | Dispatch call failure | 0.00% | 10 |
| 0302 | Service telephone system | Robocall failure | 0.00% | 6 | |
| 0303 | Dedicated wireless communication | Wireless communication failure | 0.00% | 10 | |
| 0304 | Transmission system | Communication transmission failure | 0.00% | 10 | |
| 0305 | Video surveillance system | CCTV failure | 0.00% | 10 | |
| 0306 | Broadcasting system | Environmental control failure | 0.03% | 10 | |
| 0307 | Clock system | Clock failure | 0.00% | 6 | |
| 0308 | Power systems | 0.00% | 6 | ||
| 0309 | Passenger information system | PIS failure | 0.14% | 6 | |
| Power supply system | 0401 | Medium voltage power supply system | 10KV failure | 0.16% | 10 |
| 0402 | Low-voltage power distribution system | 400V failure | 1.14% | 9 | |
| 0403 | Traction power supply system | Traction power supply failure | 0.33% | 10 | |
| 0404 | Automation | Electricity from failure | −0.44% | 10 | |
| Line system | 0501 | Track (rail fastener) | Fasteners failure | 0.09% | 8 |
| 0502 | Switch equipment | Switch equipment failure | 0.38% | 10 | |
| 0503 | Contact rail network system | Catenary rail/catenary failure | 0.00% | 10 | |
| Vehicle system | 0601 | Vehicle connectivity system | Car failure | 8.80% | 8 |
| 0602 | Auxiliary power supply system | Auxiliary circuit failure | 0.00% | 7 | |
| 0603 | Network and vehicle auxiliary monitoring system | Control loop failure | 0.00% | 5 | |
| 0604 | Air conditioning and ventilation systems | Air conditioner failure | 0.05% | 7 | |
| 0605 | Traction system | Traction/traction motor failure | 0.00% | 8 | |
| 0606 | Suspension system | 0.00% | 9 | ||
| 0607 | Braking System | Brake/foundation brake/electric brake failure | 0.00% | 9 | |
| 0608 | Bogie | Bogie failure | 0.00% | 10 | |
| 0609 | Train announcement | Train announcement failure | 0.034% | 8 | |
| 0610 | Main circuit | Main circuit failure | 0.000% | 10 | |
| 0611 | Transmission | Transmission failure | 0.000% | 10 | |
| 0612 | Wheel | Wheel failure | 0.000% | 10 | |
| 0613 | Air compressor | Air compressor failure | −0.005% | 10 | |
| 0614 | Car door | Car door failure | −0.130% | 10 | |
| 0615 | Train communication | Train communication failure | −0.019% | 10 |
References
- Marusin, A.; Marusin, A.; Ablyazov, T. Transport Infrastructure Safety Improvement Based on Digital Technology Implementation. In Proceedings of the International Conference on Digital Technologies in Logistics and Infrastructure (ICDTLI 2019), St. Petersburg, Russia, 4–5 April 2019; Atlantis Press: Paris, France, 2019; pp. 348–352. [Google Scholar]
- Bruneau, M.; Chang, S.E.; Eguchi, R.; Lee, G.C.; O’Rourke, T.D.; Reinhorn, A.M.; Shinozuka, M.; Tierney, K.; Wallace, W.A.; von Winterfeldt, D. A framework to quantitatively assess and enhance the science the seismic resilience of communities. Earthq. Spectra 2003, 19, 733–752. [Google Scholar] [CrossRef]
- Rose, A. Economic resilience to natural and man-made disasters: Multi-disciplinary origins and contextual dimensions. Environ. Hazard 2007, 7, 383–398. [Google Scholar] [CrossRef]
- Henry, D.; Ramirez-Marquez, J. Generic metrics and quantitative approaches for system resilience as a function of time. Reliab. Eng. Syst. Saf. 2012, 99, 114–122. [Google Scholar] [CrossRef]
- Wang, J.W.; Gao, F.; Ip, W. Measurement of resilience and its application to enterprise information systems. Enterp. Inf. Syst. 2010, 4, 215–223. [Google Scholar] [CrossRef]
- Omer, M.; Mostashari, A.; Lindemann, U. Resilience analysis of soft infrastructure systems. Procedia. Comput. Sci. 2014, 28, 565–574. [Google Scholar] [CrossRef]
- Chang, S.; Shinozuka, M. Measuring improvements in the disaster resilience of communities. Earthq. Spectra 2004, 20, 739–755. [Google Scholar] [CrossRef]
- Ouyang, M.; Duenas-Osorio, L.; Min, X. A three-stage resilience analysis framework for urban infrastructure systems. Struct. Saf. 2012, 36, 23–31. [Google Scholar] [CrossRef]
- Ayyub, B. Systems resilience for multihazard environments: Definition, metrics, and valuation for decision making. Risk Anal. 2014, 34, 340–355. [Google Scholar] [CrossRef] [PubMed]
- Franchin, P.; Cavalieri, F. Probabilistic assessment of civil infrastructure resilience to earthquakes. Comput. Aided Civ. Infrastruct. Eng. 2015, 30, 583–600. [Google Scholar] [CrossRef]
- Twumasi-Boakye, R.; Sobanjo, J. Civil infrastructure resilience: State-of-the-art on transportation network systems. Transp. A Transp. Sci. 2019, 15, 455–484. [Google Scholar] [CrossRef]
- Zhou, Y.; Wang, J.; Yang, H. Resilience of Transportation Systems: Concepts and Comprehensive Review. IEEE Trans. Intell. Transp. Syst. 2019, 20, 4262–4276. [Google Scholar] [CrossRef]
- Gu, Y.; Fu, X.; Liu, Z.; Xu, X.; Chen, A. Performance of transportation network under perturbations: Reliability, vulnerability, and resilience. Transp. Res. Part E Logist. Transp. Rev. 2020, 133, 101809. [Google Scholar] [CrossRef]
- Sun, W.; Bocchini, P.; Davison, B. Resilience metrics and measurement methods for transportation infrastructure: The state of the art. Sustain. Resilient Infrastruct. 2020, 5, 168–199. [Google Scholar] [CrossRef]
- National Infrastructure Advisory Council (NIAC). Critical Infrastructure Resilience: Final Report and Recommendations; National Infrastructure Advisory Council: Arlington, VA, USA, 2009.
- Adams, T.; Bekkem, K.; Toledo-Durán, E. Freight Resilience Measures. J. Transp. Eng. 2012, 138, 1403–1409. [Google Scholar] [CrossRef]
- Faturechi, R.; Miller-Hooks, E. A Mathematical Framework for Quantifying and Optimizing Protective Actions for Civil Infrastructure Systems. Comput. Aided Civ. Infrastruct. Eng. 2014, 29, 572–589. [Google Scholar] [CrossRef]
- Baroud, H.; Barker, K.; Ramirez-Marquez, J.; Rocco, C. Inherent costs and interdependent impacts of infrastructure network resilience. Risk Anal. 2015, 35, 642–662. [Google Scholar] [CrossRef]
- Ganin, A.; Kitsak, M.; Marchese, D.; Keisler, J.; Seager, T.; Linkov, I. Resilience and efficiency in transportation networks. Sci. Adv. 2017, 3, e1701079. [Google Scholar] [CrossRef]
- Wang, W.; Yang, S.; Stanley, H.E.; Gao, J. Local floods induce large-scale abrupt failures of road networks. Nat. Commun. 2019, 10, 2114. [Google Scholar] [CrossRef]
- Zhang, L.; Zeng, G.; Li, D.; Huang, H.; Stanley, H.E.; Havlin, S. Scale-free resilience of real traffic jams. Proc. Natl. Acad. Sci. USA 2019, 116, 8673–8678. [Google Scholar] [CrossRef]
- Hossain, N.; Nur, F.; Hosseini, S.; Jaradat, R.; Marufuzzaman, M.; Puryear, S.M. A Bayesian network based approach for modeling and assessing resilience: A case study of a full service deep water port. Reliab. Eng. Syst. Saf. 2019, 189, 378–396. [Google Scholar] [CrossRef]
- Saadat, Y.; Ayyub, B.; Zhang, Y.; Zhang, D.; Huang, H. Resilience-Based Strategies for Topology Enhancement and Recovery of Metrorail Transit Networks. ASCE-ASME J. Risk Uncertain. Eng. Syst. Part A Civ. Eng. 2020, 6, 04020017. [Google Scholar] [CrossRef]
- Gao, Y.; Wang, J.W. A resilience assessment framework for urban transportation systems. Int. J. Prod. Res. 2021, 59, 2177–2192. [Google Scholar] [CrossRef]
- Pan, X.; Dang, Y.; Wang, H.; Hong, D.; Li, Y.; Deng, H. Resilience model and recovery strategy of transportation network based on travel OD-grid analysis. Reliab. Eng. Syst. Saf. 2022, 223, 108483. [Google Scholar] [CrossRef]
- Qi, Q.; Meng, Y.; Zhao, X.; Liu, J. Resilience Assessment of an Urban Metro Complex Network: A Case Study of the Zhengzhou Metro. Sustainability 2022, 14, 11555. [Google Scholar] [CrossRef]
- Stamatis, D.H. Failure Mode and Effect Analysis: FMEA from Theory to Execution; Quality Press: Nottingham, UK, 2003. [Google Scholar]
- Chin, K.S.; Wang, Y.M.; Poon, G.K.K.; Yang, J.B. Failure mode and effects analysis by data envelopment analysis. Decis. Support Syst. 2009, 48, 246–256. [Google Scholar] [CrossRef]
- Faustman, E.M.; Omenn, G.S. Risk Assessment. In Casarett and Doull’s Toxicology: The Basic Science of Poisons; McGraw Hill: New York, NY, USA, 2008; pp. 107–128. [Google Scholar]
- Knutson, B.; Huettel, S.A. The risk matrix. Curr. Opin. Behav. Sci. 2015, 5, 141–146. [Google Scholar] [CrossRef]
Disclaimer/Publisher’s Note: The statements, opinions and data contained in all publications are solely those of the individual author(s) and contributor(s) and not of MDPI and/or the editor(s). MDPI and/or the editor(s) disclaim responsibility for any injury to people or property resulting from any ideas, methods, instructions or products referred to in the content. |
© 2023 by the authors. Licensee MDPI, Basel, Switzerland. This article is an open access article distributed under the terms and conditions of the Creative Commons Attribution (CC BY) license (https://creativecommons.org/licenses/by/4.0/).