1. Introduction
The steel industry is a crucial component of the global economy, providing essential raw materials for a wide range of other industries. Research in this area is critical to the development of new processes, materials, and technologies that improve the efficiency, quality, and sustainability of steel production. Considering the market size of the steel industry, the environmental, social, and economic impact of these types of improvements cannot be overstated.
High-strength low-alloy (HSLA) steels typically undergo a processing schedule in which the steel spends some time in a high-temperature, fully austenitic state. During subsequent processing, the steel eventually cools down, resulting in one or several phase transformations from the face-centered cubic austenite phase into the body-centered cubic (or near-equivalent) phases, along with any precipitates that may have formed during the processing steps. The role of the austenite phase is to serve as a parent microstructure, affecting the morphology and crystallography of the transformation products, as well as the kinetics and thermodynamics of the transformations. Information regarding the parent austenite structure is therefore important both from a scientific as well as an industrial processing perspective. Real-time measurement of the parent austenite microstructure would allow improved control of production processes toward improved product quality and economy, as well as tailored properties in the final product.
An important aspect of the parent austenite structure is the tendency to form annealing twins during grain growth. In this context, twinning implies that the arrangement of atoms in one grain can be generated in the other via a reflection across a common plane, mostly parallel to the grain boundary interface. For steels, a major part of the twinning interface is parallel to one of the {111} planes, with a 60° rotation around the plane normal required to shift the atomic structure across the boundary to that of its twin. A special feature of this arrangement is that it results in a coherent, low-energy boundary between the twin and the matrix. The twinning boundaries play an important role in the recrystallization and grain growth of the parent austenite microstructure. However, their quantification from the final product imposes some special difficulties.
Grain size measurements using laser ultrasonics (LUS) have a long history. The grain size in cubic phases can be inferred from the attenuation of the ultrasonic waves in polycrystalline materials with high confidence [
1,
2,
3,
4,
5,
6]. Additionally, it has been shown that the attenuation is the same regardless of the coherency of the boundary [
7,
8,
9]. This means that LUS has the capability to detect annealing twins as well as other boundaries. While LUS has been applied to study low-alloy high-temperature austenite structure evolution in the past [
1,
3,
5], the metallographic data for verification have been obtained using selective etching followed by light optical microscopy, which imposes some limitations to identifying annealing twin boundaries.
The direct quantitative measurement of the parent austenite structure via conventional means is difficult in any case due to the high temperatures (600–1000 °C) in which the phase is naturally present. Instead, the parent structure is inferred by studying room-temperature specimens that have undergone a solid-state phase transformation. Lath martensite is a convenient structure for these kinds of studies. The martensite transformation occurs at temperatures below 500 °C and requires rapid cooling for most alloying compositions. The rapid cooling ensures that most of the alloying and impurity elements are left approximately in the same place as at the beginning of cooling. This has the important consequence that the parent grain structure can be determined for martensitic steels by optical metallography of polished and selectively etched cross-section surfaces. The selective etching relies on the segregation of certain impurity elements to the high-energy grain boundaries during annealing. However, the impurity elements do not segregate to the low-energy twin boundaries, leaving them unresolvable via optical metallography. Low impurity levels prevent the use of the method entirely. Thus, light optical microscopy is unsuitable for calibrating LUS measurements to give an indication of the grain size of the twinned structure in low-alloy steels.
Another important aspect of the martensite microstructure is that its morphology and crystallography are strictly related to the parent austenite morphology. Firstly, the martensite laths that form via shear in the austenite grains do not cross grain boundaries; secondly, each lath has a rigidly determined orientation relationship with the crystallographic orientation of the parent phase. This allows the reconstruction of the parent austenite phase from orientation maps measured via electron backscatter diffraction (EBSD) with a scanning electron microscope for martensitic microstructures. The reconstructed austenite orientation maps offer a view into the crystallographic texture of the high-temperature austenite, as well as the ability to resolve both non-twinned and twinned boundaries [
10,
11,
12,
13,
14]. Moreover, the reconstructed austenite maps do not rely on impurity element segregation, allowing the technique to be used on clean modern steels. The use of reconstructed parent austenite orientation maps, therefore, allows the calibration and verification of the LUS method to gauge the twinned austenite grain size in HSLA steels.
Another option for calibration is to use a steel alloying composition that remains in a metastable austenitic state at room temperature. A wide range of stainless-steel alloys fulfill this condition. Both the twinned and un-twinned structures can then be characterized via EBSD measurements at room temperature, allowing LUS calibration. However, the difference in chemistry from low-alloy steels is notable, and no experimental work has been reported thus far wherein this approach is verified to give reliable calibration data for measuring twinned grain size in low-alloy steel with the LUS method.
In this work, we show how in situ LUS measurements are calibrated using grain sizes obtained from ex situ orientation maps for austenitic 304 stainless steel, with twin boundaries included, and how this method is then used to predict in situ the grain size in a broad range of low-alloy steel compositions. The LUS grain sizes are compared with grain sizes determined from reconstructed austenite orientation maps. The results show that LUS is able to provide in situ grain size metrics of a twinned microstructure for both austenitic stainless and HSLA steels. Parent austenite grain reconstruction that is capable of resolving annealing twin boundaries is shown to be a requirement for the validation of the results.
2. Calculations
In this section, the significance of the twinning boundaries in LUS measurements is examined by considering the effect of twinning density in austenitic stainless and HSLA steels. Several approaches have been proposed over the years to model the relationship of the twinning boundaries with the parent grains in face-centered cubic materials [
7,
15,
16,
17]. Pande et al. [
15] determined twinning density
p as the number of twin intersections over a unit of length. Their experimental work indicates a simple relation between the twinning density,
p, and grain size
D:
in which
D is the grain size determined as the mean linear intercept,
D0 is a grain size below which twins can no longer be found, and
B is an empirical constant dependent on the material, affected strongly by the stacking fault energy of the alloying composition. Linear intercept values measured from either optical metallographs or orientation maps lend themselves to the calculation of twinning density
p, provided that values both including and excluding twins have been measured. The twinning density is then given via
where
Dn is the mean linear intercept value calculated when the intersections occurring at twin boundaries are disregarded. Combining Equations (1) and (2), the relationship of
D with
Dn is given via
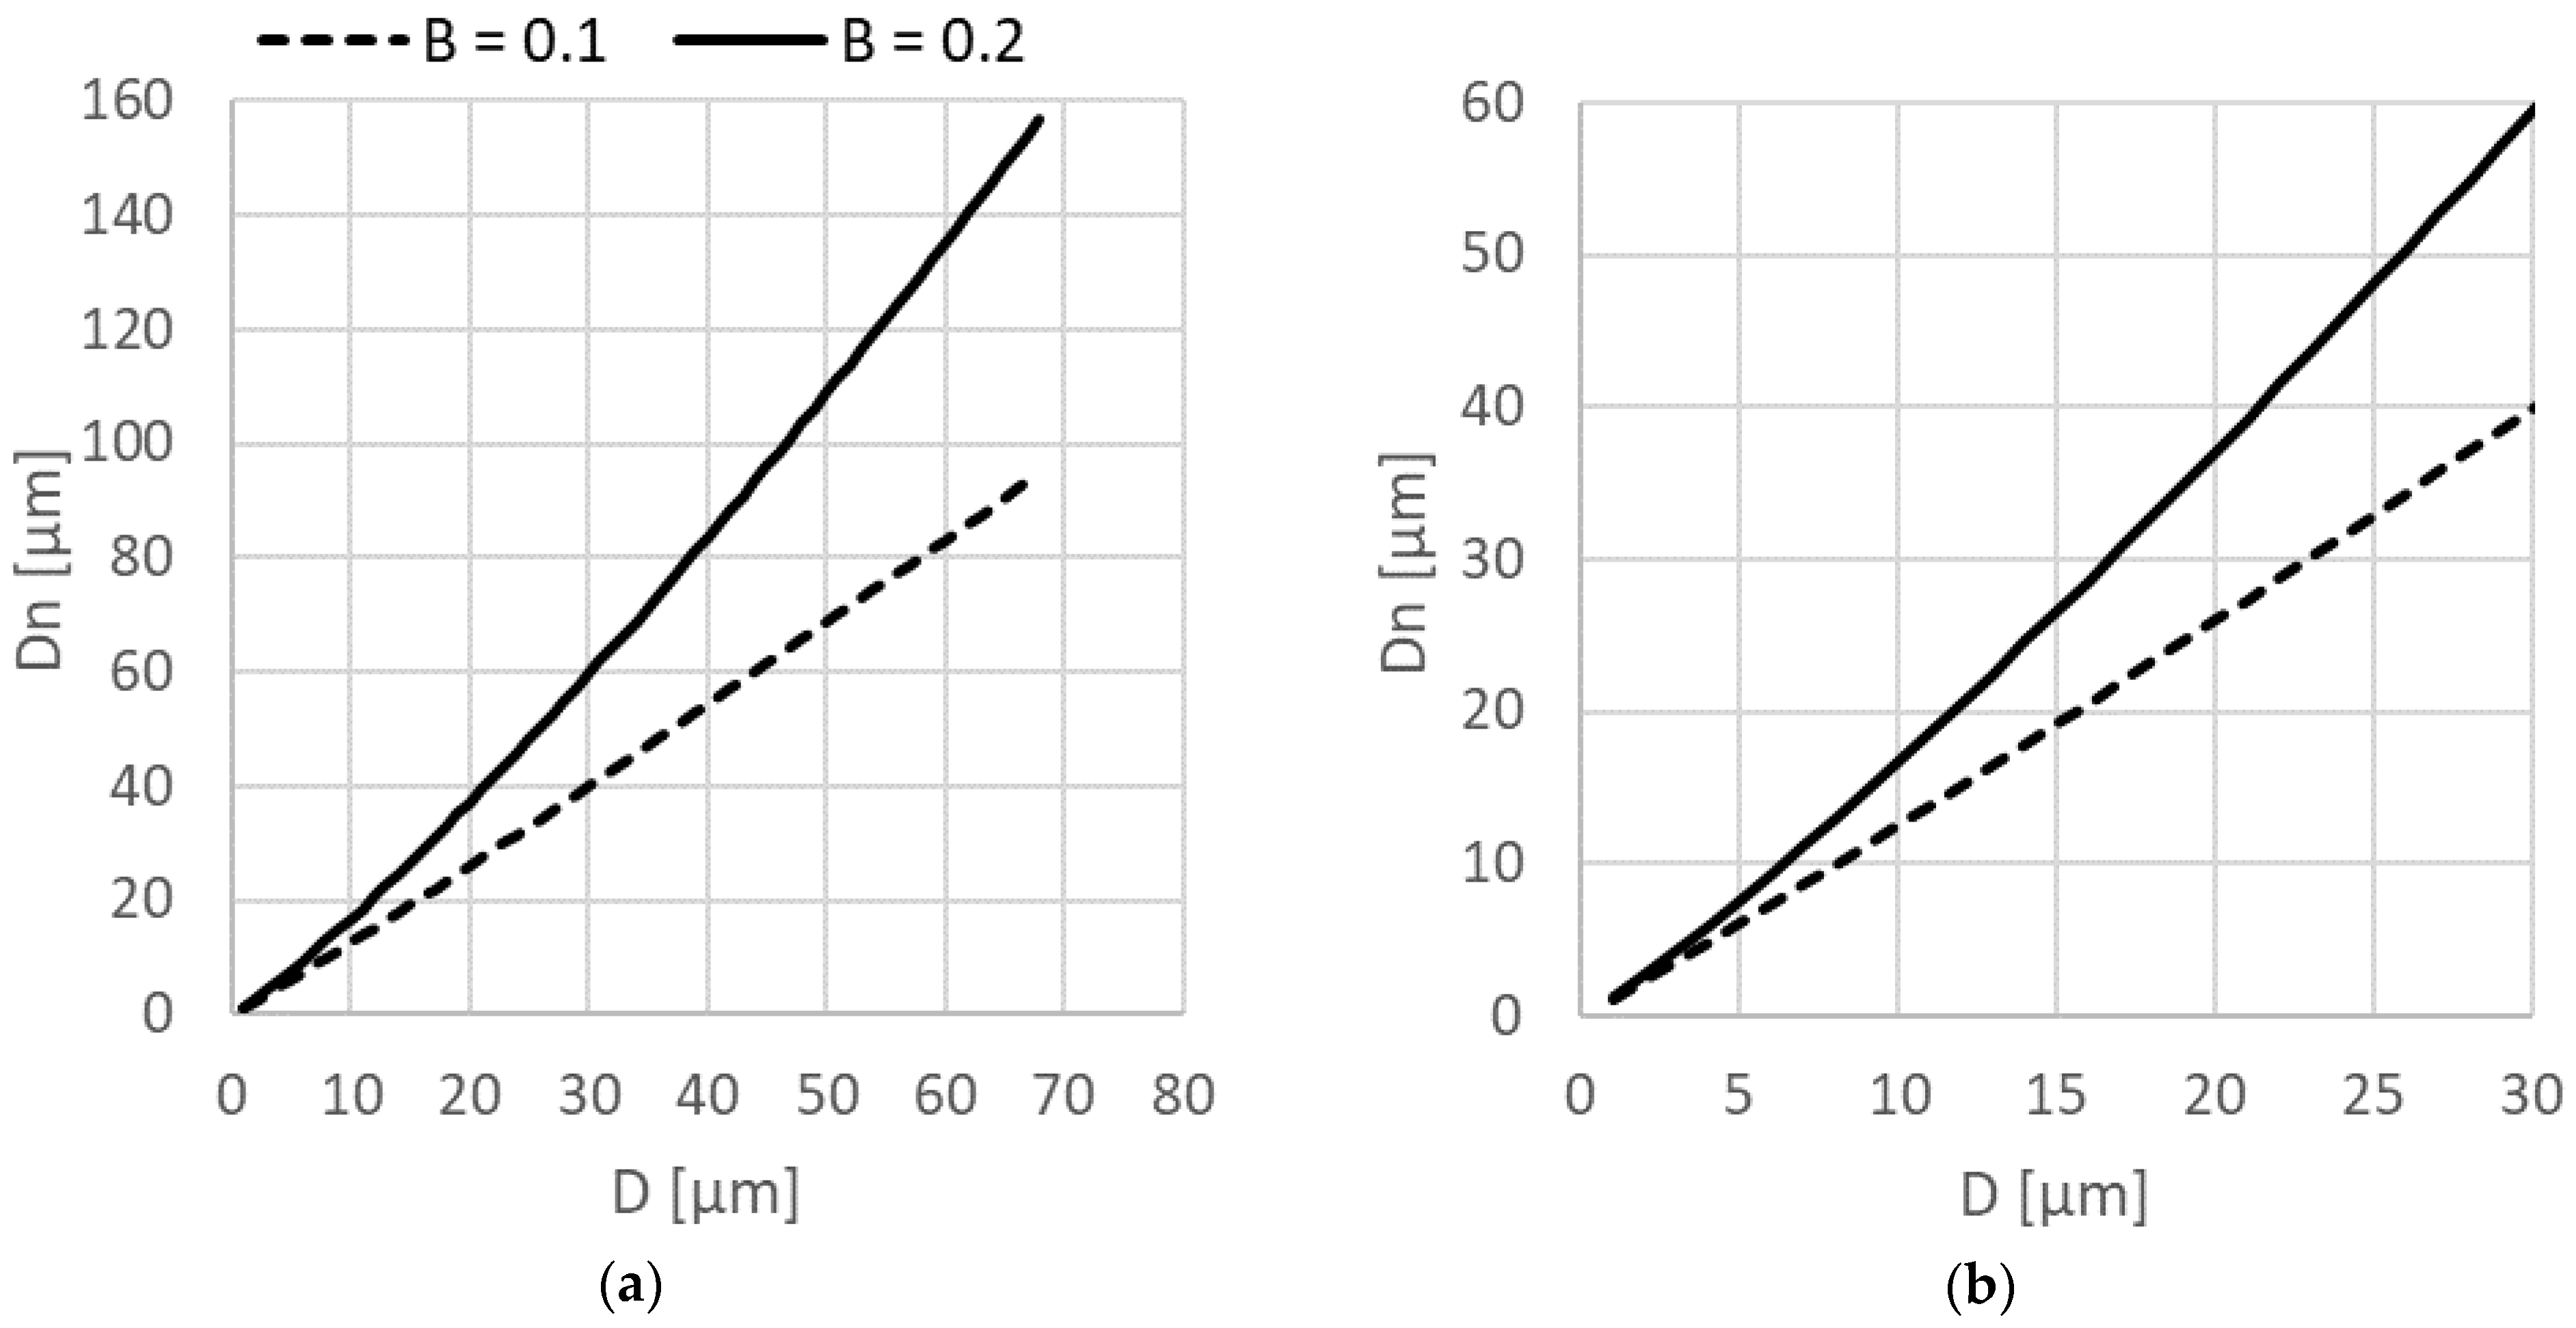
Using Equation (3),
Dn values were calculated for a range of grain sizes using the hypothetical values
B = 0.2 and
B = 0.1 and
D0 = 0.1 μm.
Figure 1 shows the calculated
Dn values with respect to
D. Both relationships are very close to linear, with the non-twinned grain size being approximately 2.4 times that of the twinned grain size for
B = 0.2 and 1.5 times for
B = 0.1. The apparently nearly linear relationship over a wide range of grain sizes indicates that LUS can be calibrated to make reasonably accurate predictions of grain sizes
Dn disregarding twins, using data from optical micrographs insensitive to twinning boundaries. However, the figure also clearly shows that this assumption holds only for materials with a similar relationship between twinning density
p and grain size
D.
From an industrial perspective, it would be desirable to spend as little effort as possible on calibration in order to reduce downtime and to quickly implement the method for new products. In the case of LUS measurements in low-alloy steels, the question is how much difference in the twinning behavior can be expected between various low-alloy compositions. The alloying composition does have a significant effect on the twinning density by affecting the energy stored in the twinning interfaces. The interfacial energy is commonly known as the stacking fault energy (SFE). Olson and Cohen [
18] suggested the following equation for calculating the SFE:
where
ρ is the molar surface density,
ΔGγ→ε is the free energy change of the austenite to epsilon martensite transformation,
is a strain energy term, and
σγ/ε is the interfacial energy between the austenite and epsilon martensite phases.
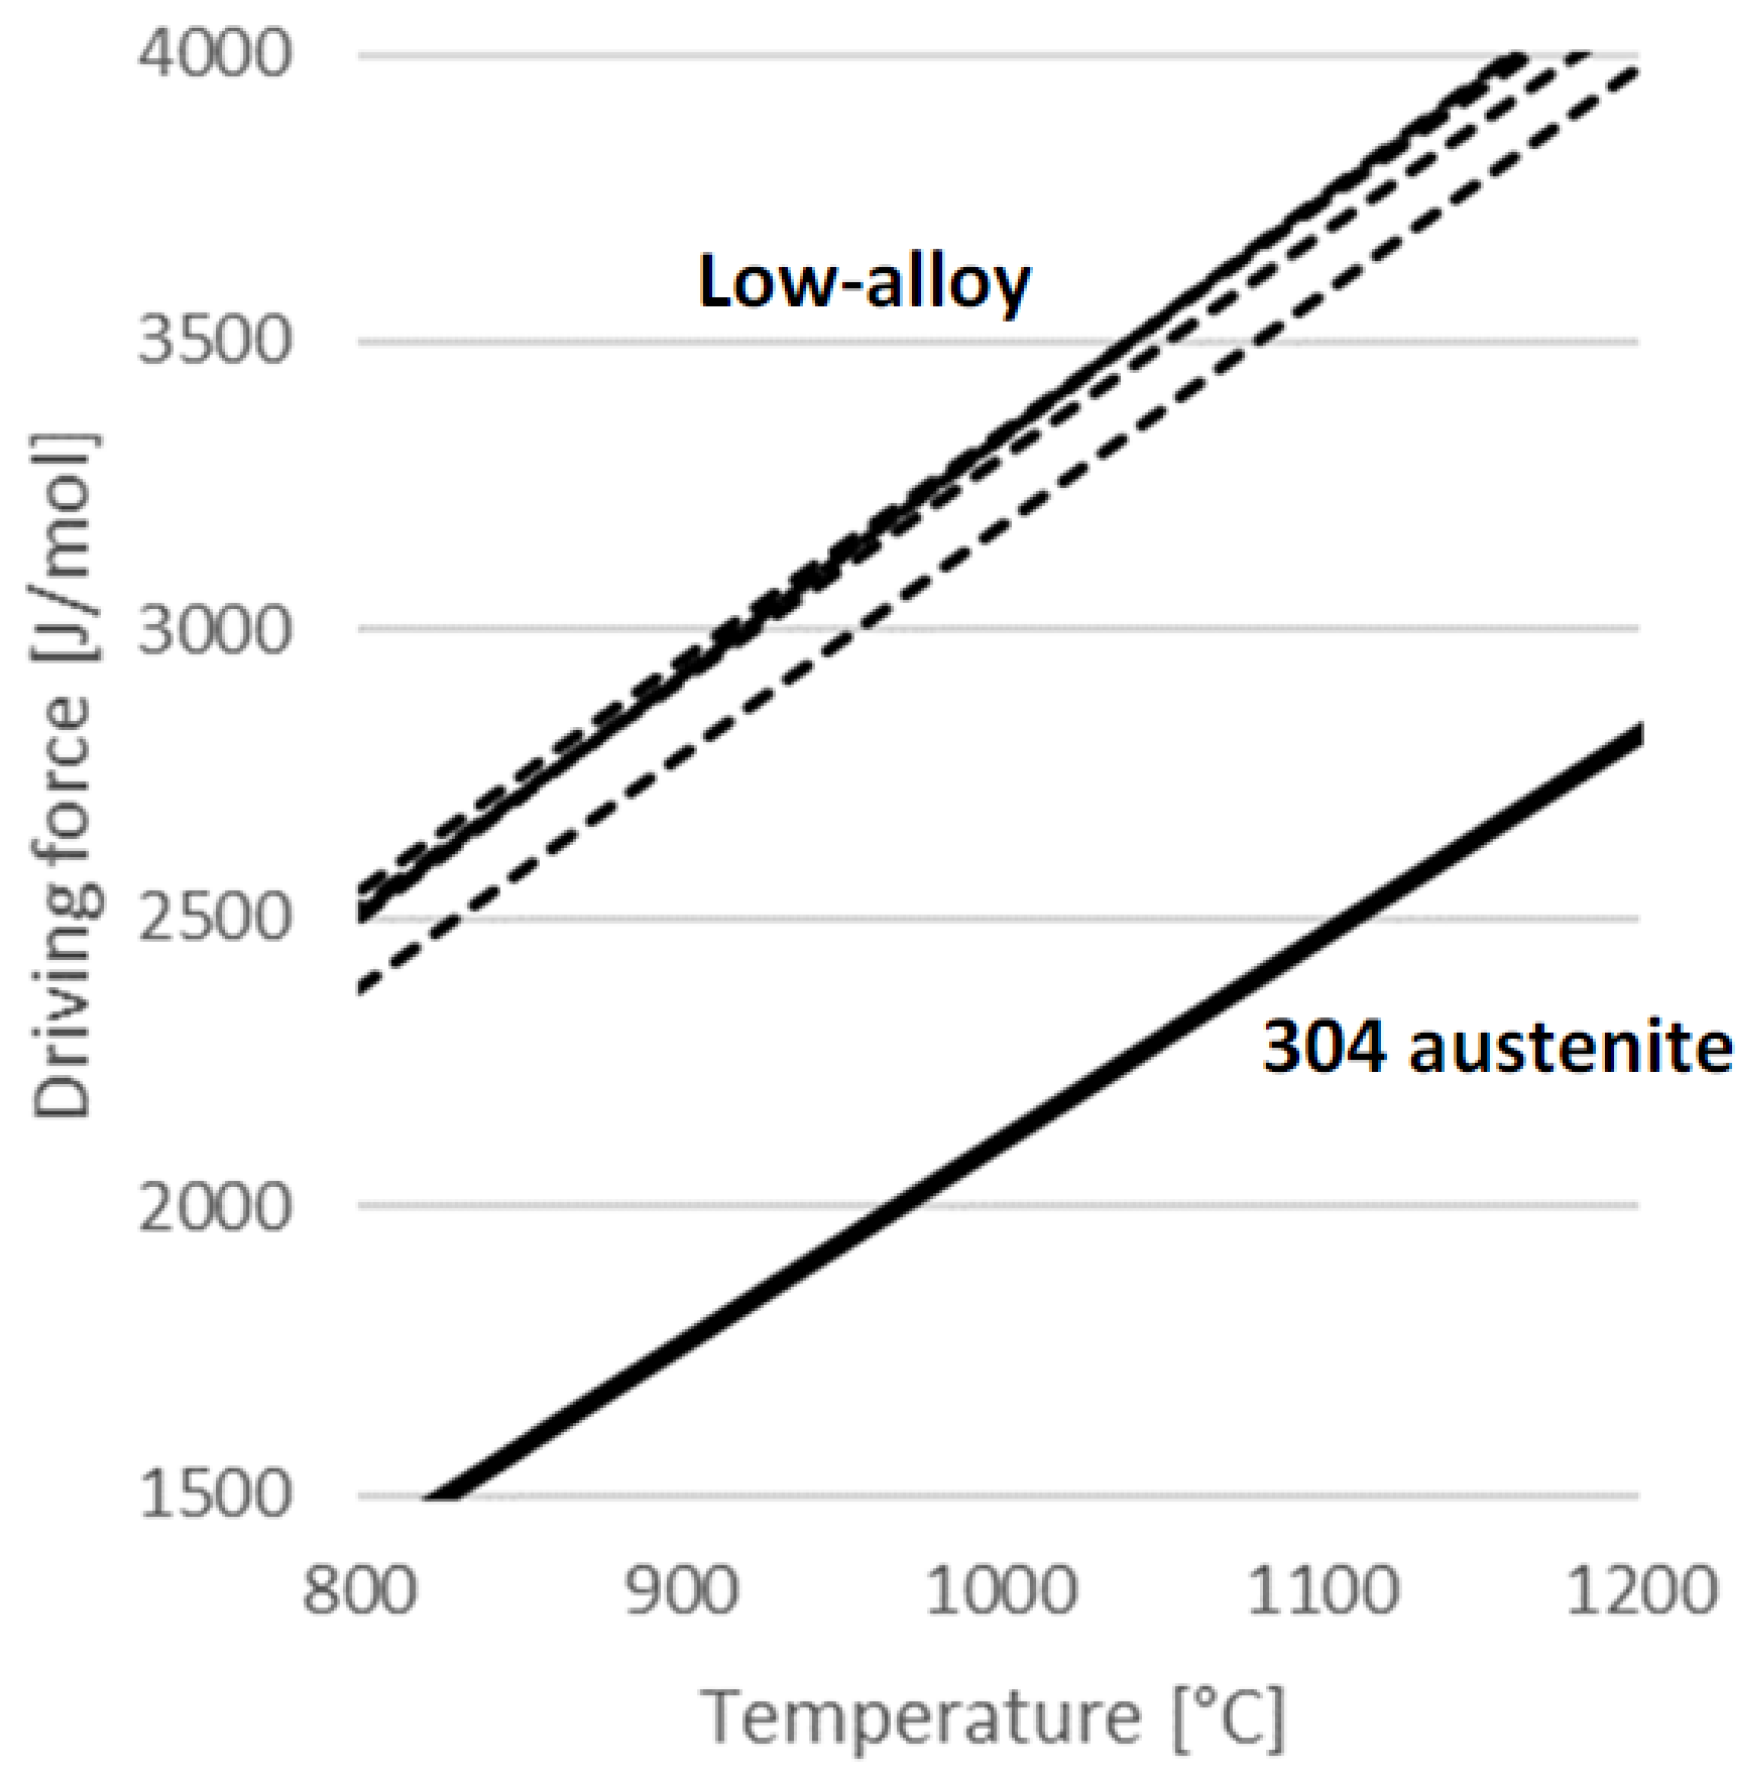
Figure 2 shows the term
ΔGγ→ε calculated with Thermo-Calc R2022b [
19] with the TCFE11 database for the temperature range 800–1300 °C for three low-alloy high-strength steels, a tool steel, and a high-Si quenching and partitioning composition. Despite the relative differences, each alloy had less than 5 wt% total alloying elements. A comparative value is shown for austenitic 304 stainless steel. The stainless steel has a considerably lower
ΔGγ→ε compared with the low-alloy steels, which exhibit only small differences between one another.
Considering only the free energy change
ΔGγ→ε, it is a reasonable assumption that most low-alloy steels with less than 5 wt% alloying additions should exhibit an approximately similar evolution in twinning density with respect to grain size. In reality, twinning is also affected by factors such as crystallographic texture, pre-strain or prior deformation, as well as inclusions or precipitates [
17]. When present, these factors affect the grain growth behavior and therefore also the tendency to form annealing twins. It is therefore a reasonable assumption that differences in twinning behavior may well be expected even for low-alloy steels.
The present discussion aims to indicate the potential of LUS measurements for the on-line measurement of grain size in low-alloy steels. The obvious pitfall is the use of twinning-insensitive data, such as those obtained from LOM measurements, for the calibration and verification of the LUS measurements, especially when the intention is to implement the measurements for the production of a wide range of steel compositions and production routes.
3. Materials and Methods
The Gleeble 3800 thermomechanical simulator (Dynamic Systems Inc., New York, NY, USA) was used to conduct heat treatments on a range of high-strength low-alloy (HSLA) steel compositions. Three commercial high-strength low-alloy steels, one high-vanadium tool steel, one high-silicon quenching and partitioning material, and two experimental compositions were selected for the trials. Each steel had less than 5 wt% alloying elements besides iron. LUS measurements of grain size were conducted during the heat treatments, and the grain sizes were later validated based on EBSD orientation map data.
Each material was annealed at various temperatures (in the range of 900 to 1200 °C) to obtain a range of grain sizes, followed by gas quenching to obtain a fully martensitic specimen. In each heat treatment, sufficient time was allowed during annealing for the grain size to stabilize before quenching (they were later verified against the LUS data). After the heat treatments, cross-sections were cut from each specimen for obtaining orientation maps via SEM. The sectioned specimens were mounted in conductive resin, and ground and polished with standard metallographic preparation techniques, with the final polishing step conducted using colloidal silica. The microscopy work was conducted with a Zeiss Gemini 450 field emission SEM (Carl Zeiss Microscopy GmbH, Jena, Germany), outfitted with an Oxford Instruments Symmetry EBSD detector (Oxford Instruments, High Wycombe, UK). The orientation maps were measured with the Symmetry detector in the quarter-thickness region, on a measurement area of 1 mm2, using a step size of 0.5 μm. This resulted in approximately 4 million orientation pixels per map.
The parent austenite orientation maps were reconstructed using the variant graph algorithm [
14] in MTEX 5.8.1 running on Matlab R2021b. Due to the large size of the datasets, memory was preserved by merging the close-together variants in the graph in the first reconstruction step, and restoring them in the second step, similar to the description in [
14]. For each dataset, the variant graph was run through 3 clustering iterations in the first step using an inflation parameter of 1, followed by 2 iterations in the second step with the default inflation parameter of 1.05. The reconstructed austenite orientation maps were resolved into grain maps, using standard MTEX grain reconstruction with a 5° angular tolerance.
Finally, the grain size was determined from the grain boundary maps using an automated version of the mean linear intercept (MLI) method. The grain boundary intercepts were counted from 300 vertical lines overlaid on each map. Edge grains in the maps were disregarded by redacting the length of the line before the first and last intercept. Essentially, each line started at a grain boundary and ended at one. Mean linear intercept values were determined both including and disregarding twin boundaries. In addition, a minimum intersect value was set to 1 μm for grain sizes below 10 μm, and 2 μm for those over 10 μm to filter noise from the analysis. The analysis was repeated on each dataset, with the difference that the annealing twin boundaries were disregarded in order to obtain the non-twinned grain size. The twin boundaries were identified based on the boundary misorientation corresponding to 60° at around {111}, with a 5° angular tolerance.
In situ LUS measurements were conducted using the Gleeble (GLUS) during each heat treatment to obtain a value for grain size at the start of cooling. These LUS measurements were carried out in a similar manner as described in [
20,
21,
22,
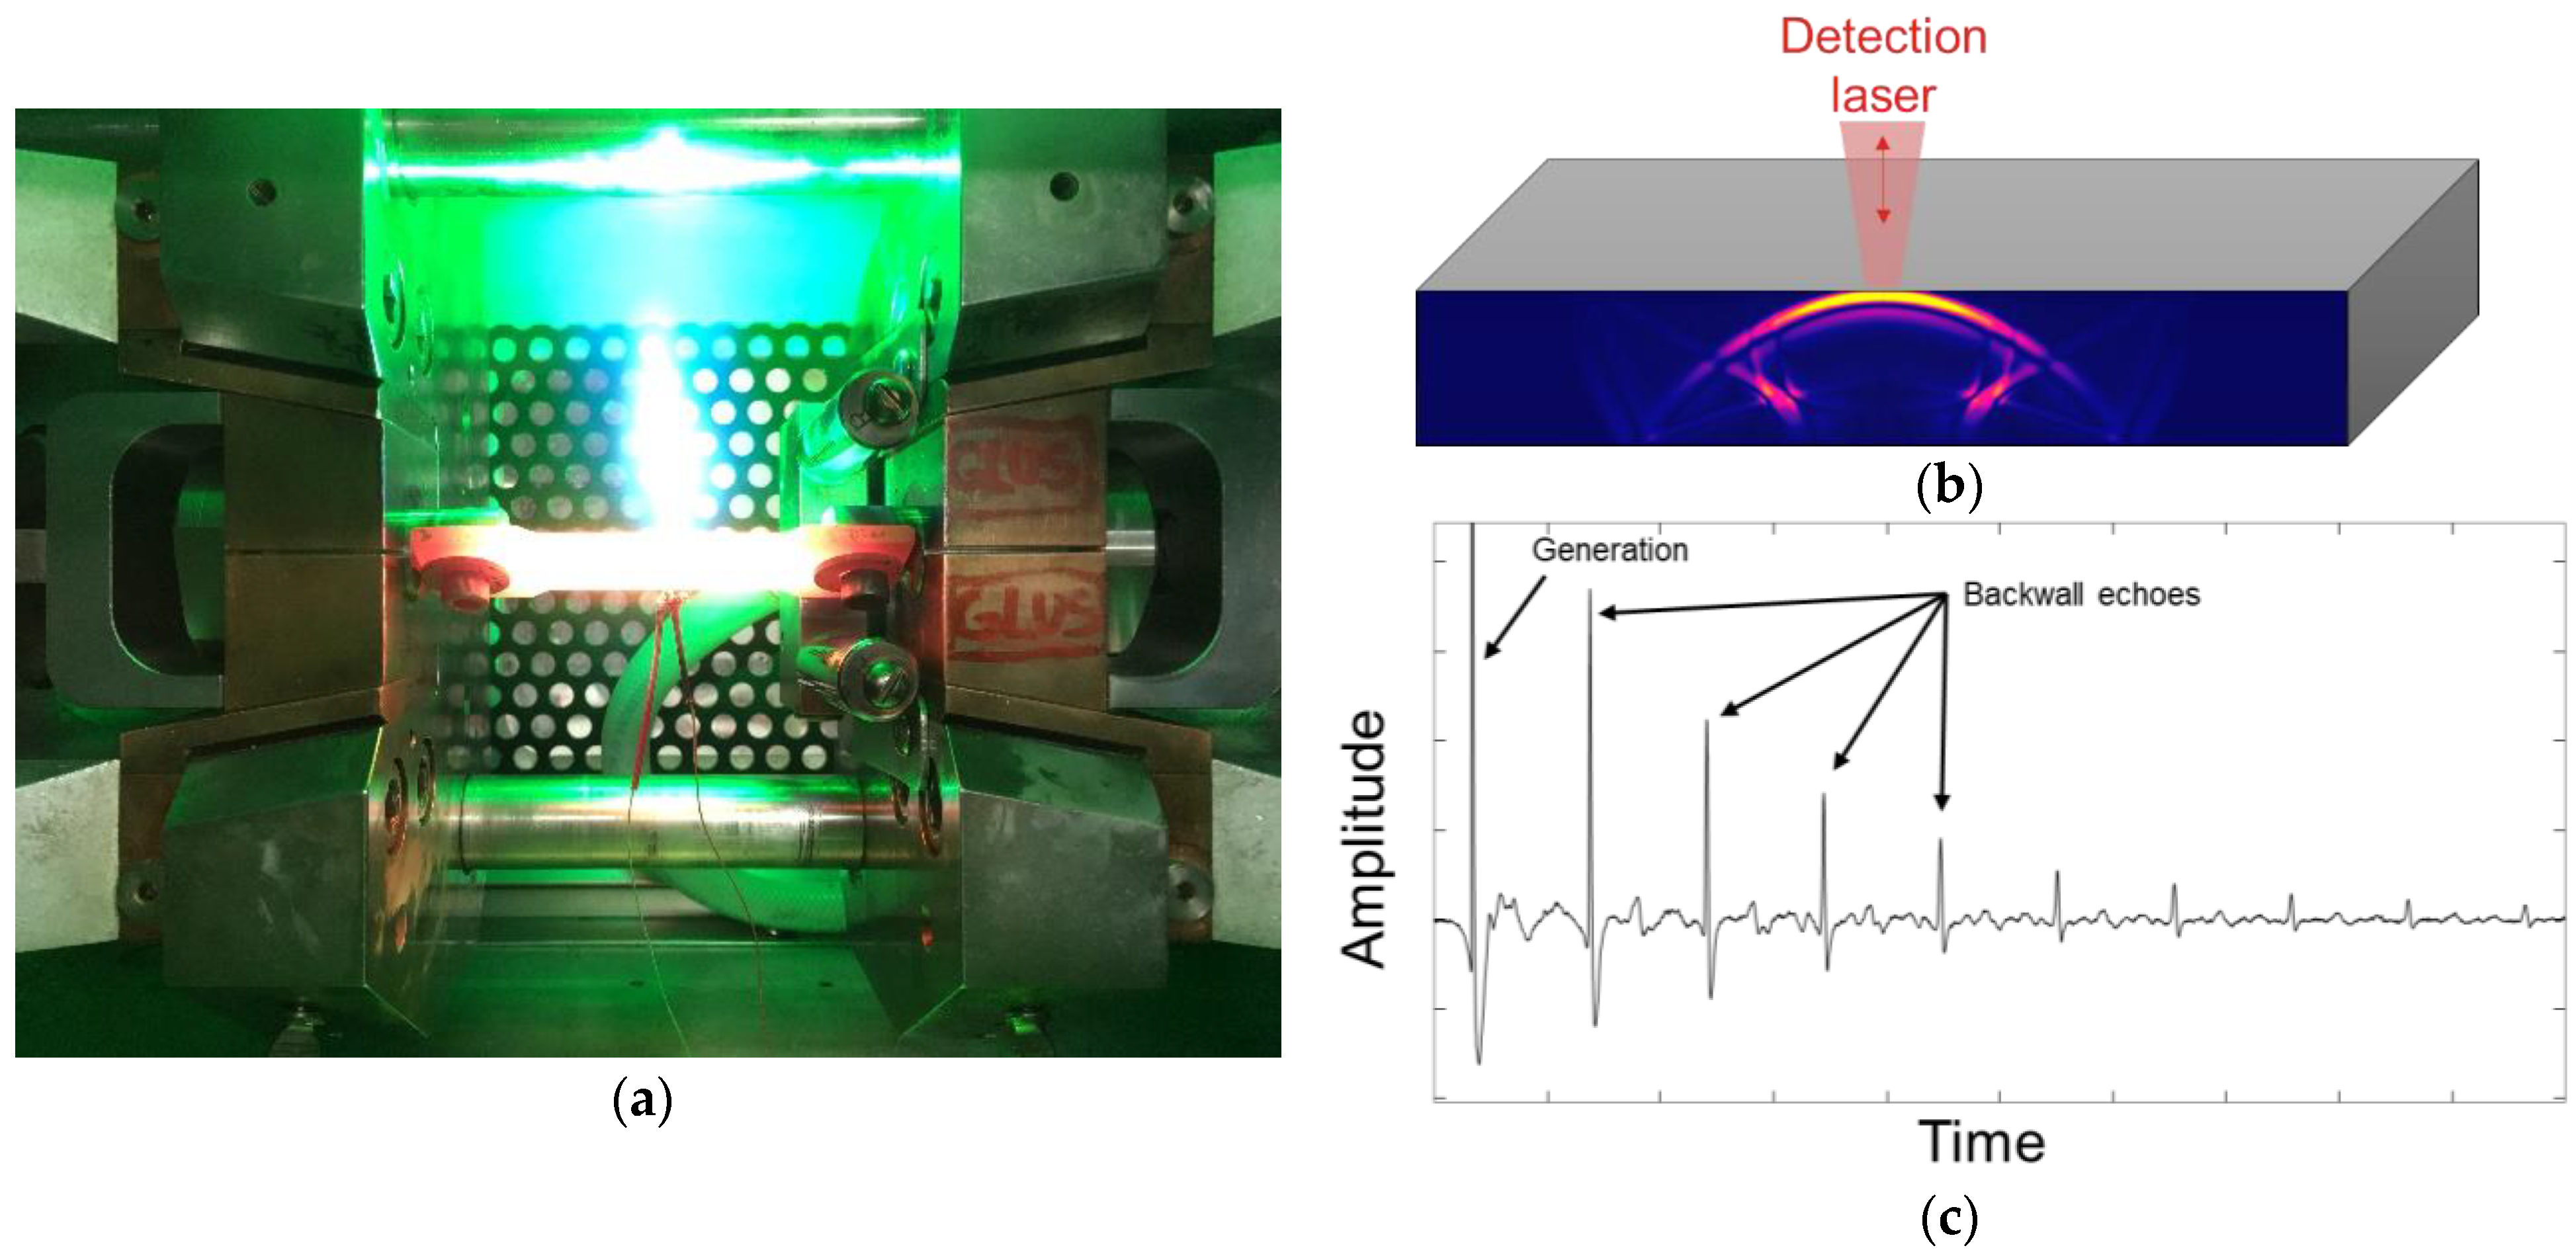
23], whereby the third-order frequency-dependent attenuation is correlated with the austenite grain size to achieve a temperature-dependent calibration curve used to calculate the average grain size from the LUS measurements in austenitic samples. The typical GLUS measurement procedure is displayed in
Figure 3a–c, where in
Figure 3a, the ultrasound was generated in the hot sample via ablation on the surface with a ~150 mJ generation laser with 5.5 ns long pulses at a 532 nm wavelength, which was operated at 1–20 Hz depending on the duration of the GLUS measurement. The ultrasonic signal response from the sample was measured with a TECNAR detection laser system and interferometer, as illustrated in
Figure 3b, wherein the first longitudinal wave looking like a parabola reaches the surface after being reflected at the bottom.
The signal from the TECNAR interferometer was sampled with a 1.6 GS data acquisition card resulting in signals similar to those displayed in
Figure 3c, which displays the generation event and the consecutive backwall echoes. After the annealing program and the data collection, the grain size was calculated for the measurements of interest, serving as input for the following analysis.
The data for the calibration curve used herein came from measurements conducted on stainless-steel samples, annealed to various grain sizes, and determined ex situ from orientation maps measured via electron backscatter diffraction. Some stainless-steel specimens were also measured with the GLUS at room temperature for the calibration curve.
The HSLA materials were annealed and quenched in the Gleeble similarly to the stainless-steel samples, after which the orientation maps of the austenite microstructure were measured and the grain size was determined with the parent austenite reconstruction method described above, both with and without annealing twin boundaries. Three commercial high-strength low-alloy steels, one high-vanadium tool steel, one high-silicon quenching and partitioning material, and two experimental compositions were selected for the studies based on their commercial importance, compositional differences, and in the case of the expected difference in the precipitate density of the tool steel.
4. Results
4.1. Parent Grain Reconstruction
For every reconstructed map, at least 97% of the orientation domains in the martensitic orientation maps could be assigned a parent austenite orientation. After assigning a parent orientation to each individual orientation pixel based on domain information, parent grain maps could be constructed.
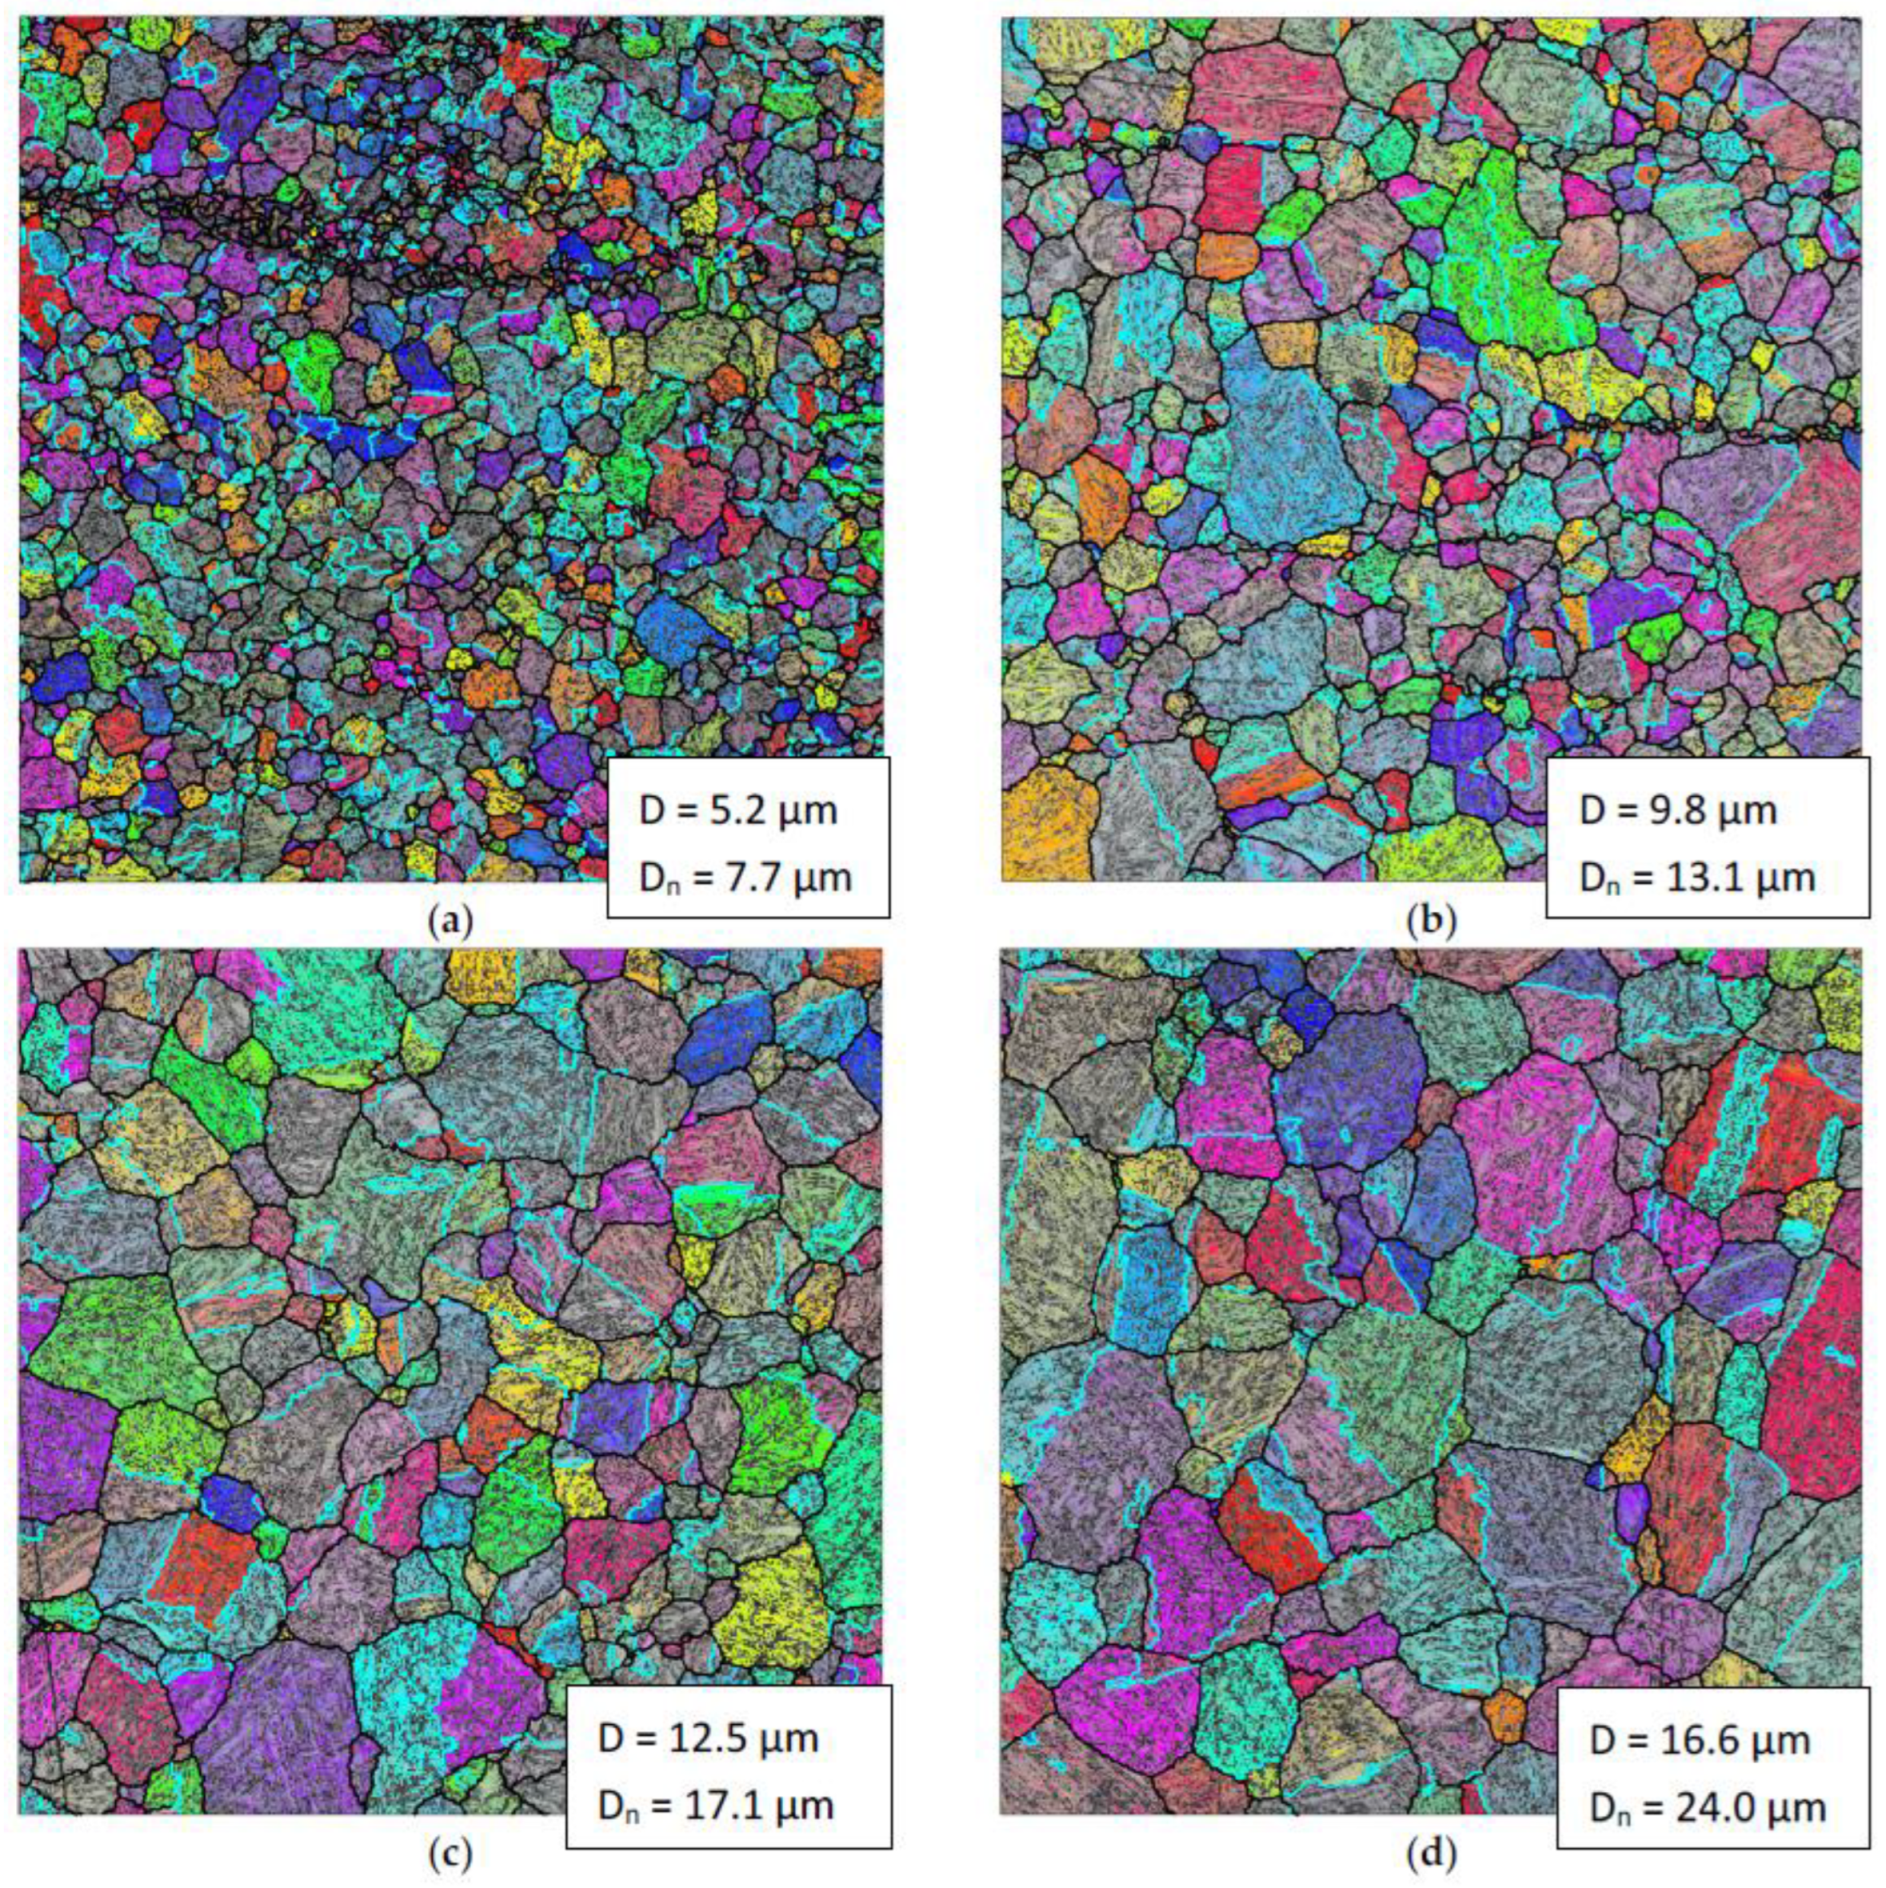
Figure 4 shows examples of the reconstructed parent austenite grain maps at different grain sizes for the “Tool steel” composition. MLI values including twins (
D) and excluding twins (
Dn) are indicated. In all cases, the equiaxed parent grain structure appears to have been reconstructed successfully, based on visual analysis. The reconstructed annealing twin boundaries, on the other hand, exhibit irregular shapes that do not meet the typical twin morphology of mostly linear boundaries parallel to the twinning planes. Despite the irregularities, the boundaries were found to approximately follow the twinning boundary plane.
4.2. Grain Size Determination
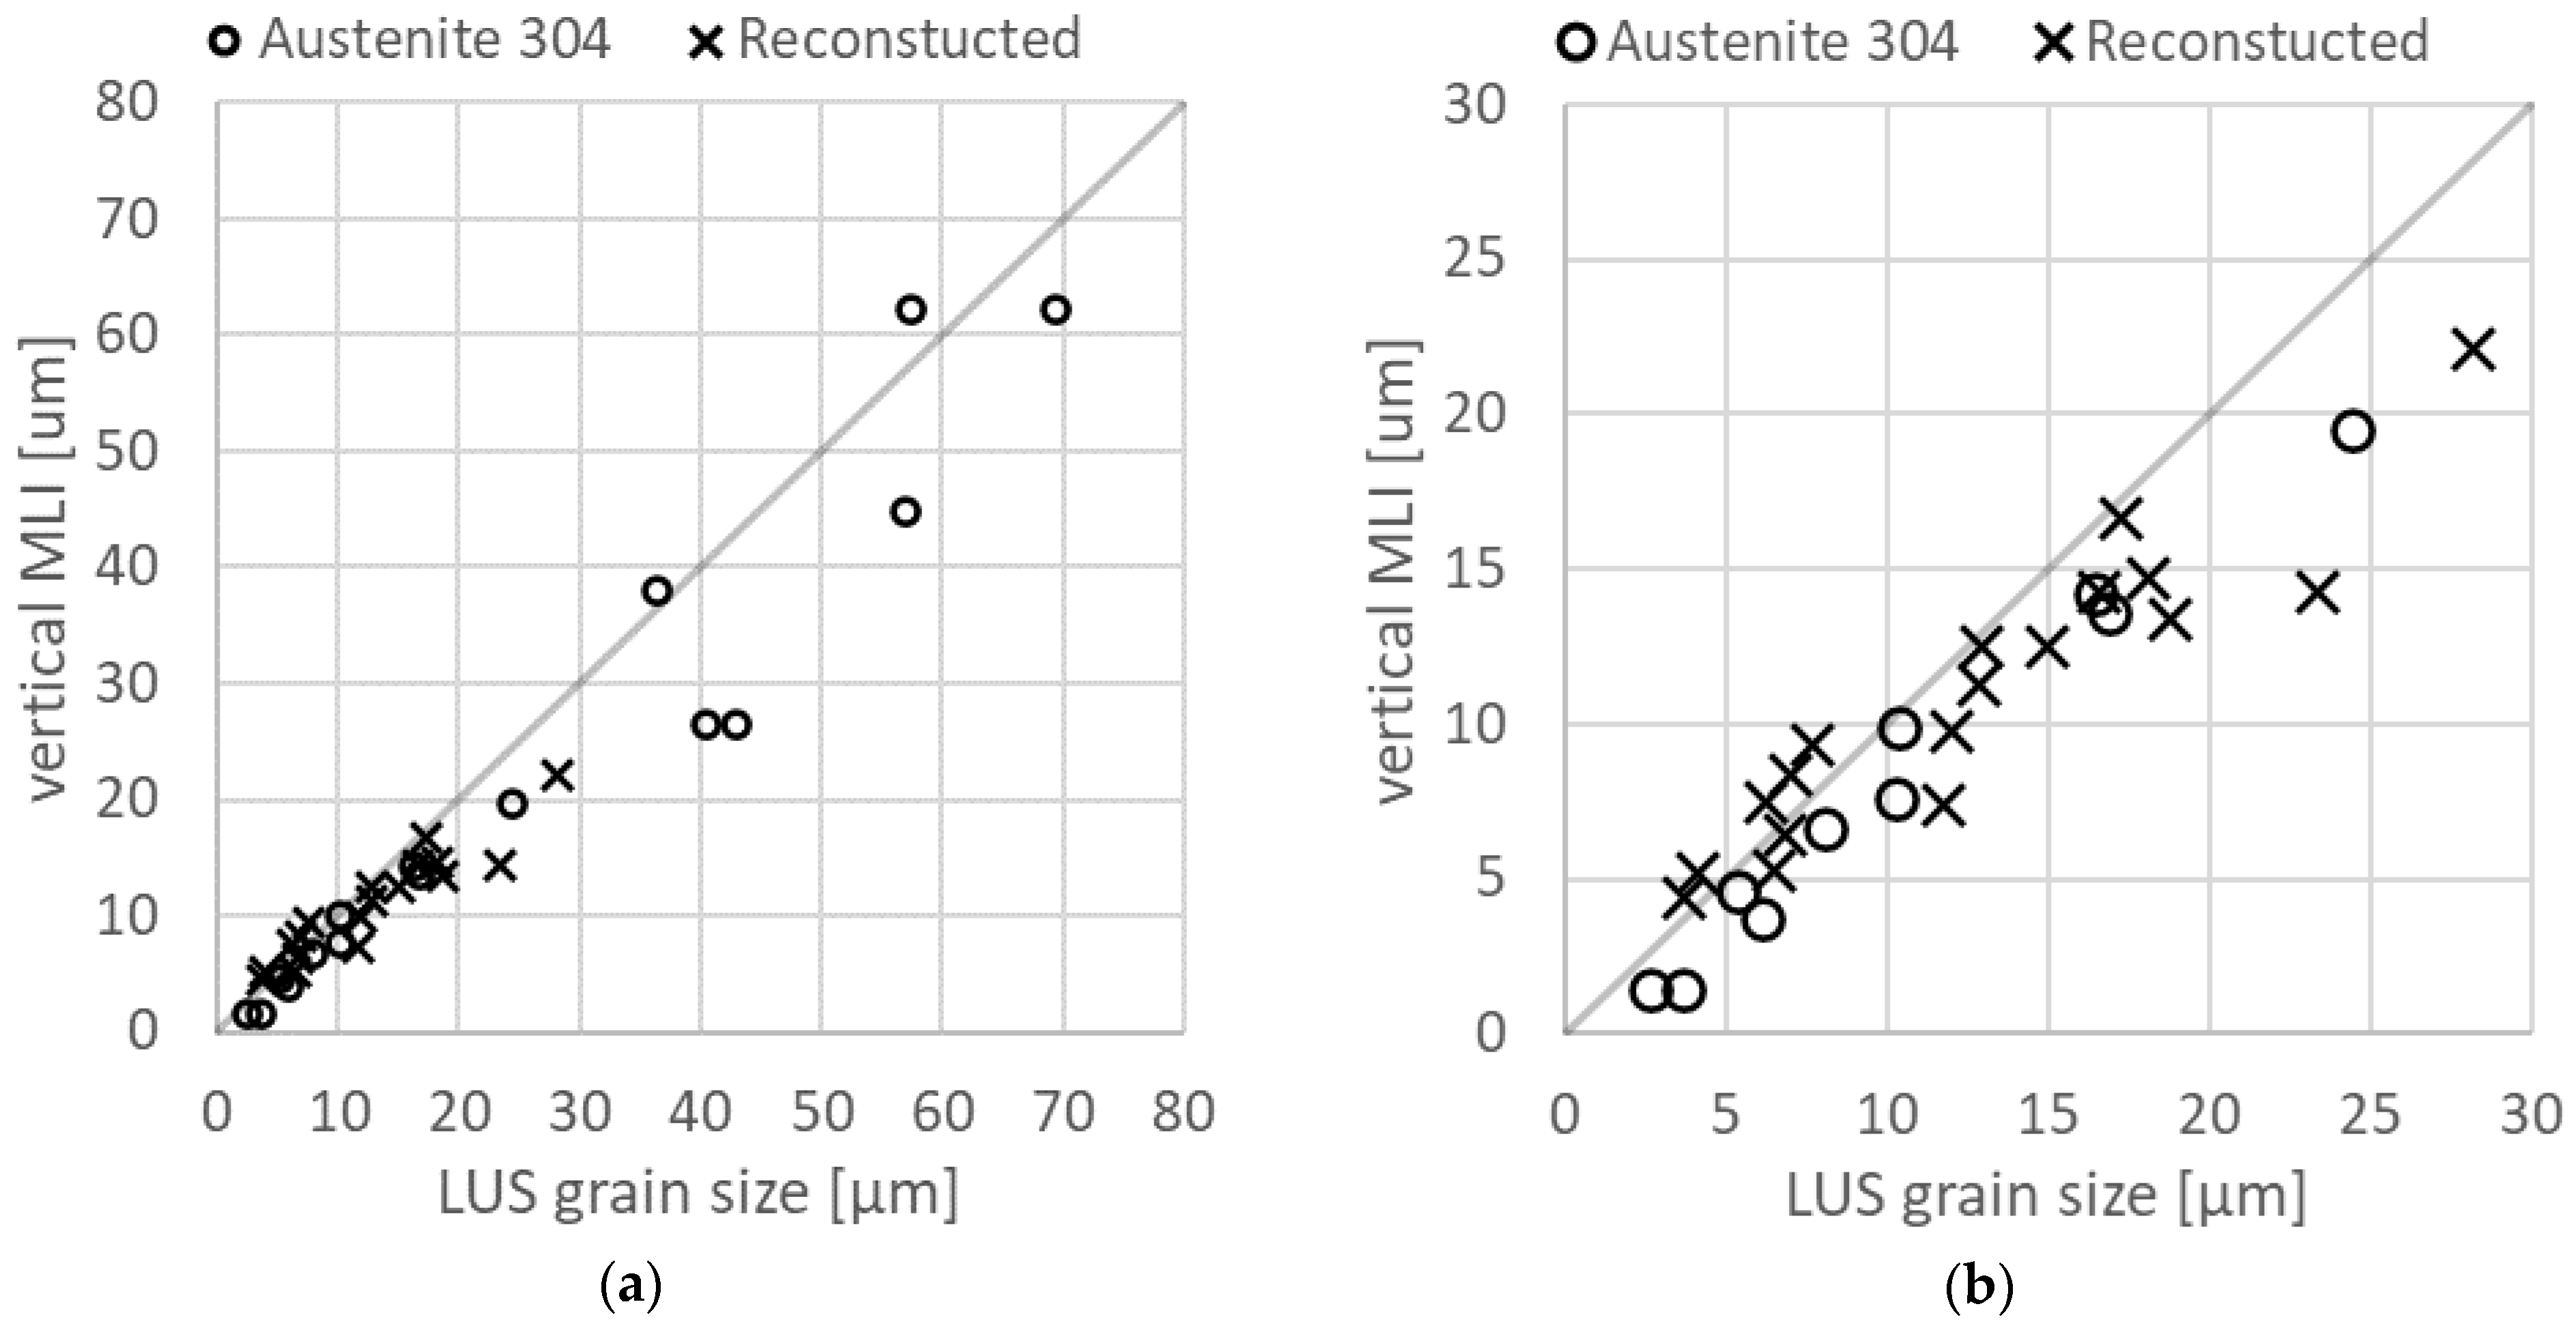
Figure 5 shows the results of the grain size determined via laser ultrasonic measurements with respect to the vertical mean linear intercept values. The figure indicates a good correspondence between the LUS predictions and the measured MLI at grain sizes below 30 μm.
5. Discussion
The results indicate a good correspondence between the grain size determined via LUS and the MLI from reconstructed maps. However, at grain sizes below 10 μm, the reconstructed MLI slightly exceeds the grain size predicted with LUS, and at grain sizes exceeding 20 μm, the measured MLI values slightly undershoot the LUS values. With the limited data at hand, it is not clear if this is due to a systematic error or a random outcome. The relative error for the LUS measurements, on the other hand, is roughly the same over the entire range, and the correlation between the LUS and the EBSD grain size, i.e., R2, for the stainless-steel calibration curve is just over 0.8.
Previous studies have shown that the coherency of a boundary does not affect the attenuation of an LUS signal. The grain size given using LUS, then, always includes the attenuation from annealing twin boundaries as well. Moreover, the grain size was determined from an in situ measurement at the annealing temperature just before quenching, and, for a sufficiently fast quench, should be representative of the prior austenite grain size of the phase transformation products.
The reconstructed grain map gives the twin boundaries as well. However, as discussed, there are some uncertainties regarding the correct twin orientation in the vicinity of the original annealing twin boundary.
Figure 3 shows the issue clearly: some twin boundaries follow the expected morphology, while others appear irregular and incomplete where they would be expected to linearly follow the twinning plane boundary.
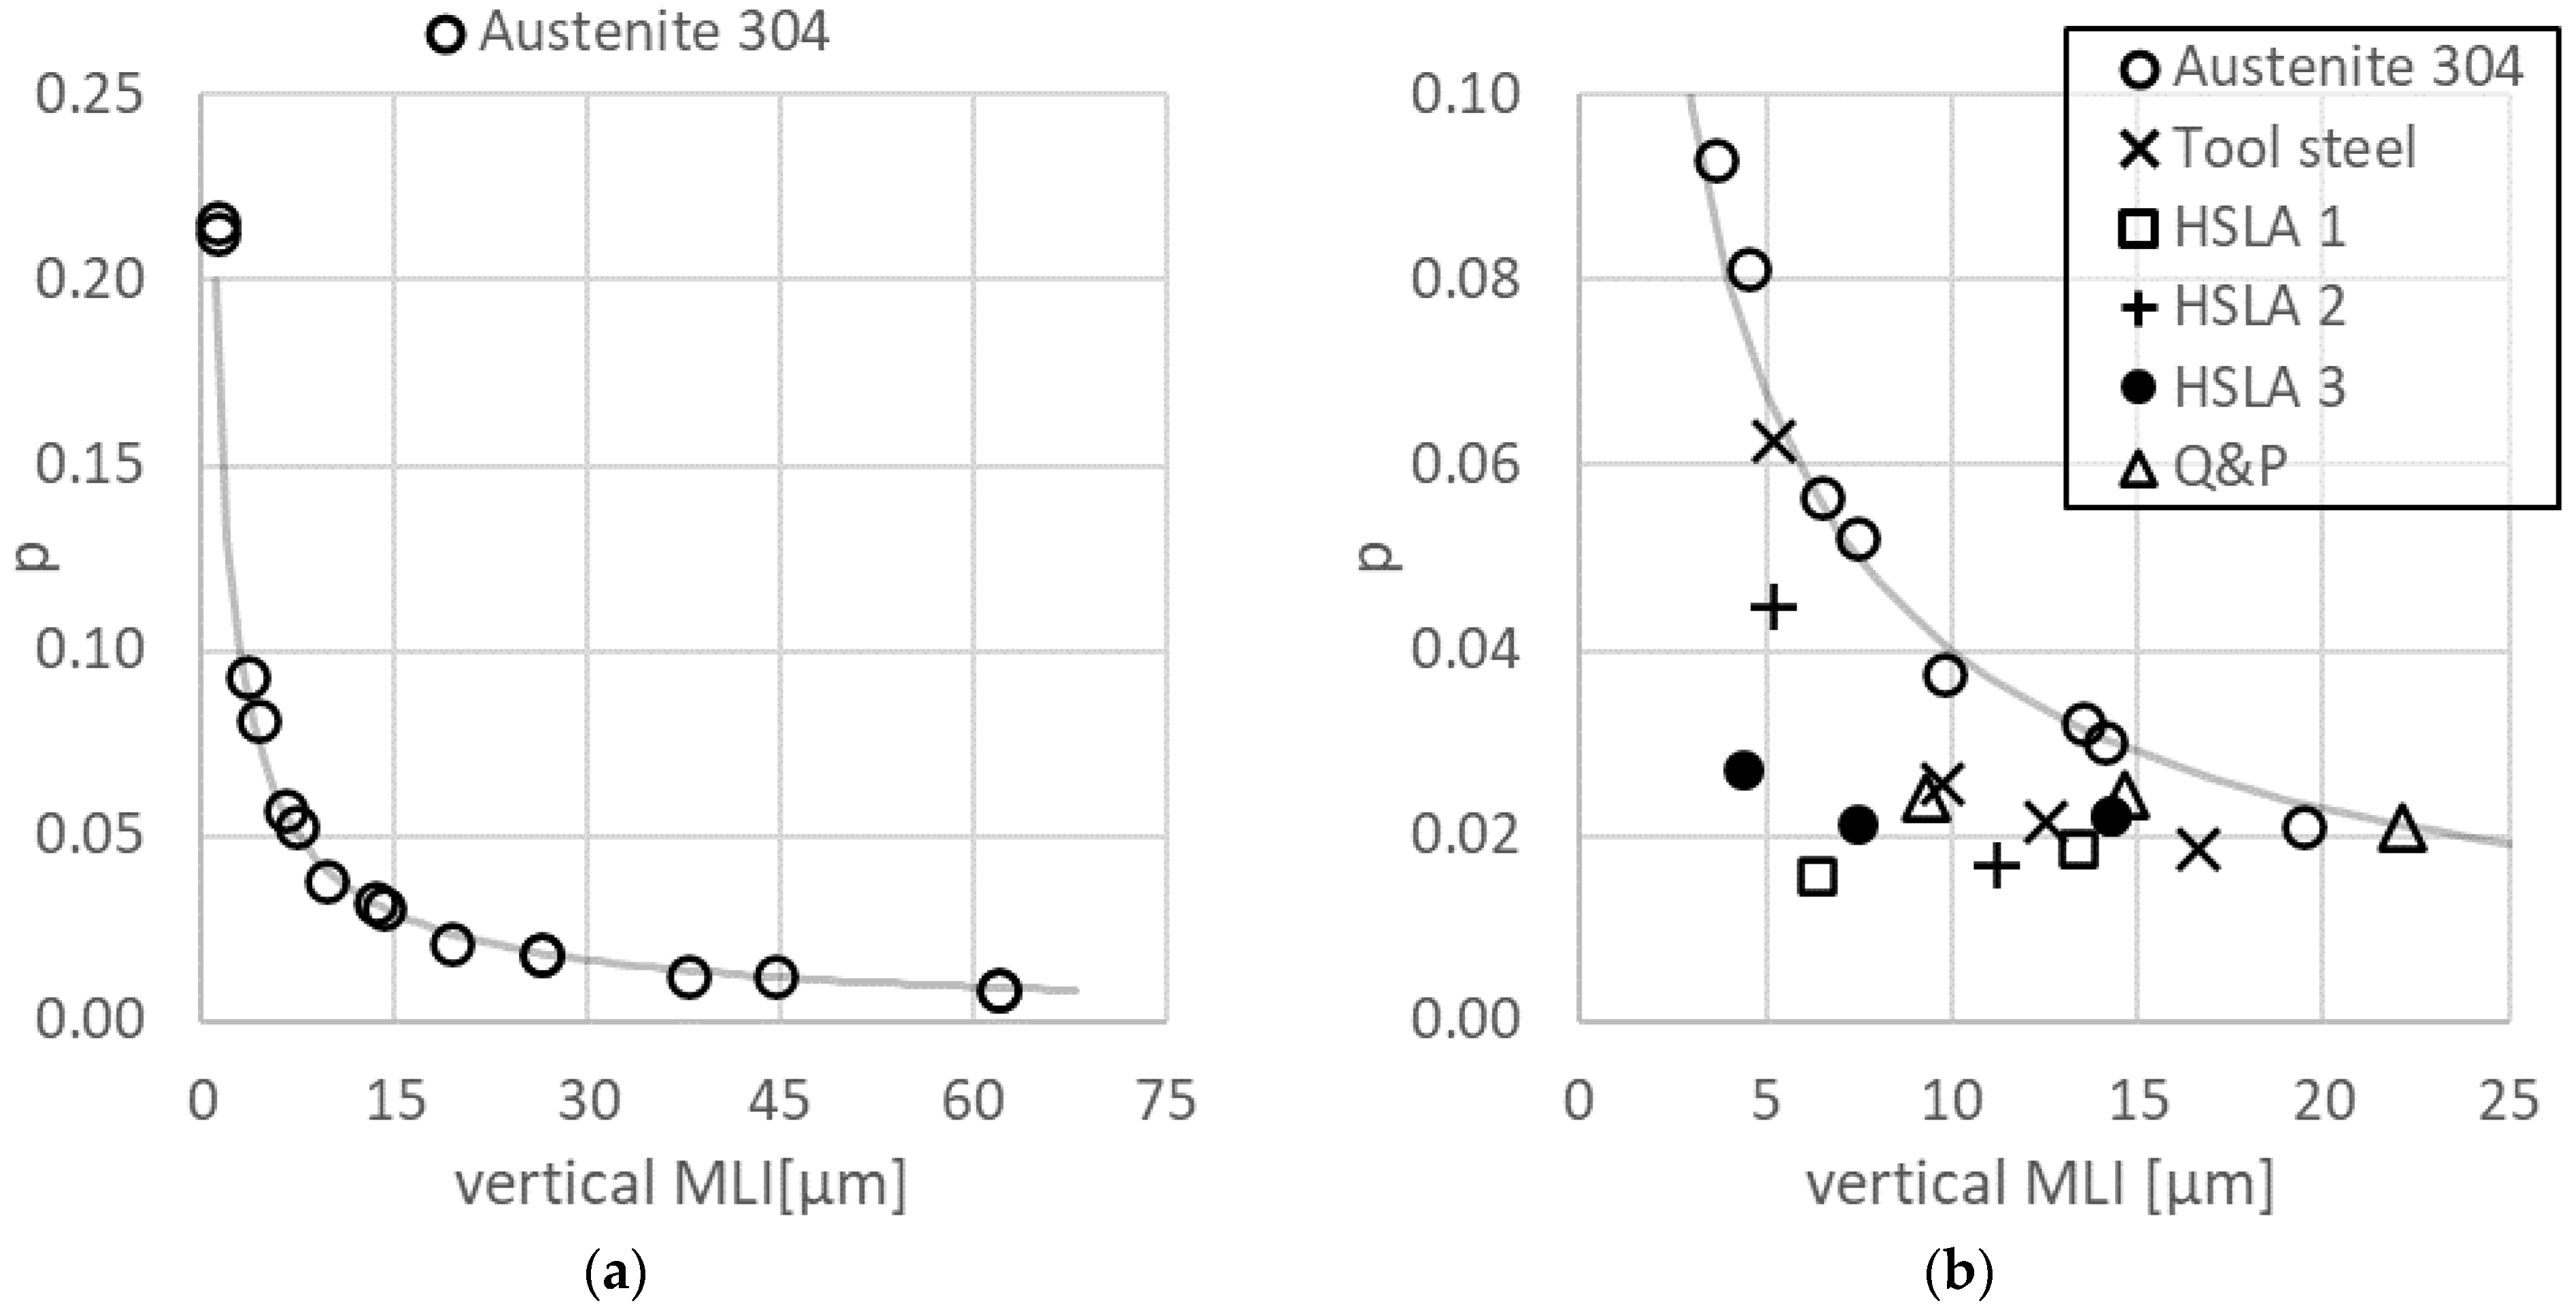
Figure 6 shows the twinning densities calculated with Equation (1) plotted with respect to the grain size
D, given as MLI.
Figure 6a shows the full range of grain sizes measured for 304, as well as a line plotted using Equation (1) with the parameters
B = 0.2 and
D0 = 0.1 μm. The figure clearly shows the twinning density of 304 has an excellent fit with Equation (1).
Figure 6b shows the twinning densities for the reconstructed data, along with the 304 densities, and the relationship is given in Equation (1).
The twinning densities for the reconstructed data do not follow the relationship given in Equation (1) fitted for the stainless steel results, but instead, exhibit an approximate density of 0.02 for a wide range of grain sizes. The difference is significant enough that it merits consideration on the basis of the quality of the reconstructions as well as the possible physical reasons for the differences in predictions.
One measure of reconstruction quality is the fit between each individual reconstructed orientation pixel and the orientation of each domain in the variant graph, measured as the misorientation angle between the pixel and the domain orientations. A low fit indicates that there is very little variability in the orientation relationship between martensite and austenite. Another way to put this is that the orientation map can be described very well in terms of an austenite to martensite transformation, meaning that all structural units in the map indeed correspond to martensite. Furthermore, the low values of fit increase confidence in the correct twin indexation, since the mis-indexation of twins using representative orientation relationships results in a misfit in the reconstructed map [
10].
Table 1 shows the mean fit values for each reconstructed orientation map in this study. The tool steel and the quenching and partitioning (Q and P) steel in this study had notably better fit values compared with the rest of the alloys, for all the studied grain sizes.
Figure 5b shows there is almost no change in the twinning density for grain sizes above 5 μm for either material. This is consistent with the rest of the data on the low-alloy steels.
The similarities in twinning densities above a grain size of 5 μm indicate the materials do not exhibit major differences in twin formation. In the present alloys, the differences in SFE related to composition are indeed likely to be very small. In addition, the crystallographic texture was found to be very weak in the reconstructed austenite in all cases. Additionally, the reconstructed austenite had a morphology and orientation spread consistent with a fully recrystallized and equiaxed austenite structure for all materials. This precludes the effect of strain on twinning density. It is possible, however, that there is some difference in precipitation density between the materials. This difference could explain the scatter in the twinning density at the smallest grain sizes. Equation (1) does indicate that major differences in twinning density would occur at lower grain sizes.
The examination of the reconstruction results based on the twinning density do not indicate an obvious conflict with previous studies on twinned materials. The observation that the twinning density appears to be lower in the reconstructed alloys than in the stainless steel is therefore likely to be the result of the differences in stacking fault energy rather than systematic errors in reconstruction.
6. Conclusions
The suitability of metastable austenitic stainless steel for the calibration of LUS measurements for in situ twinned grain size measurements in HSLA steels was investigated. The LUS measurements were validated using a novel approach based on parent austenite orientation maps reconstructed from the orientation maps of martensite measured at room temperature. The present findings can be summarized as follows:
Parent austenite reconstruction using martensite orientation maps was used to verify that stainless steel with metastable austenite at room temperature can be used for the calibration of laser ultrasonic measurements of twinned grain size in HSLA steels.
There are significant differences in the twinning density between HSLA and austenitic stainless steels. At smaller grain sizes, differences were also observed between the HSLA steels.
A twinning-sensitive method is necessary to validate the LUS data. The parent austenite grain reconstruction of martensitic orientation maps measured using EBSD was found to be suitable for this purpose.


 ,
, 


