Abstract
E-Government is one area of digitization that has been under way for several years in European countries. In this paper, we focus on identifying different indices that are aimed at measuring digitalization or e-Government. The results of the analysis showed that there are several indices that focus on this area within the EU, such as EGDI, EPI, LOSI, DGI, e-Government benchmark, Eurostat—Internet use, GII, DSGI, Going Digital toolkit, and DESI. Subsequently, the index areas to be used in the DEA method to measure the efficiency of e-Government-related inputs and outputs within the EU were identified. Inputs and outputs were selected logically and then verified using correlation analysis. Among the input and output indices chosen were Internet usage, DSGI, GII, e-Government benchmark, and interaction with public administration online. From the analysis, three inputs and three outputs were used and the models were output oriented. After implementing the correlation, it can be said that the values between the selected sub-variables are suitable for DEA analysis. Two models were chosen for the calculation, namely the CCR and BCC models. The CCR model found 10 states to be efficient and BCC model found 13 states to be efficient. In addition, in the close analysis, we took a closer look at the CCR model’s inference. Countries such as Denmark, Finland, Estonia, Malta, and Portugal were efficient outliers. When comparing the regions within the EU, we can conclude that the countries of Northern Europe are the most efficient in the field of digitalization (e-Government). As many as four countries out of seven are efficient.
1. Introduction
The process of transformation from the traditional paper-based form of communication, data archiving, etc. has been changed by the advent of the Internet and its use within states. Digitization is affecting all aspects of policy and domains, from purchasing of goods and services through the Internet to handling of official business. Digital technology has erased boundaries, including in the way people live, work, and communicate. The public sector is no exception. The impact of the COVID-19 pandemic has also accelerated the uptake of and increased investment in digital technology. A number of countries have rethought the role of the state and forced the development of digital technologies. The pace of progress has varied across countries, as has the overall development of e-Government. There are several metrics for determining different levels of digitization and e-Government. With the development of digital government, public administrations and institutions around the world have changed—both structurally and in terms of the dynamics between governments and people. This can be observed through various indicators that measure the state of digitalization. There are a number of metrics that can be used to measure the state of e-Government within the EU. As early as 2005, the authors Derek Fine and Tamarie Johnson noted that public sector companies face many challenges similar to those of private sector companies, namely in the area of digital assets [1]. Jessica Breaugh, Maike Rackwitz, and Gerhard Hammerschmid argue that government digitization projects require collaborative approaches for successful development and implementation [2]. One of the components of digitalization is e-Government. E-Government refers to the use of information and communication technology (ICT) applications to deliver various government services. It is increasingly recognized that e-Government is moving towards a holistic approach and that sustainable governance requires strategic national planning. The OECD defines the different developments of e-Government [3,4] as follows: Analogue government: closed operations and internal focus, analogue procedures. E-Government: digitization of existing government processes and online delivery of public services through the use of information and communication technologies (ICT), in particular the Internet. Digital government: the use of digital technologies and data to transform the design and implementation of public policies and services to achieve more open and citizen-centric approaches [5]. There are several definitions in the field of e-Government. In addition, these definitions have undergone an evolution as new technologies, such as AI and machine learning, have been added. Table 1 shows the evolution of the concept of e-Government by different authors.

Table 1.
Definitions of e-Government.
The DEA method is used in various fields. It is now possible to measure the level of efficiency using the DEA (data envelopment analysis) method. The DEA method can also be used in digitization [12,13]. This article focuses on the use of the method in the case of digitalization in the EU and selected countries. The DEA method has different applications; therefore, it is necessary to look at where this method has been applied. Mohamed Elhag and Silvena Boteva used the DEA method for the conceptual evaluation of energy input–output analysis on the island of Crete. Researchers have also used DEA to evaluate the agricultural sector. The inputs that contributed most to outputs were human factors, soil care, and crop protection [13].
Indicators for measuring digitization: The purpose of this study was to use the DEA method in the field of digitalization within the EU. The OECD identifies efficiency measures in the DESI; however, in this study we identify efficiency using selected indices and their sub-categories that focus on technological efficiency. The OECD research is devoted to the input-oriented model, whereas ours uses the output-oriented model. Therefore, it is necessary to identify possible input and output data. Multi-criteria decision analysis (MCDA) has already been used in another study; therefore, it is appropriate to look at the DEA method and its use. The basic indices include the Digital Economy and Society Index, e-Government Development Index, e-Participation index, Local Online Service Index, Digital Government Index, e-Government benchmark, Eurostat—Internet use, Global Innovation Index, Digital Skills Gap Index, and Going Digital Toolkit. Table 2 lists the individual indices with their abbreviation and the year of their first measurement, followed by more detailed information.
Table 2.
Summary of the digitalization and e-Government indices.
For a closer comparison, we chose two main indicators to measure digitalization and e-Government. DESI measures the state of digitalization across the EU. The index provides an overall picture of the state and performance of individual Member States. As Table 1 shows, there are a number of indices focusing on different areas of digitization. A less common area tends to be e-Government [20]. The level of the DESI across the EU is shown in Figure 1.
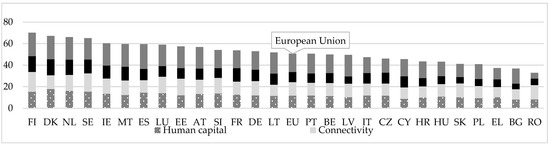
Figure 1.
The level of the DESI across the EU.
Table 3 shows the overall digitization scores for Germany, Romania, Lithuania, and Spain from 2018 to 2022 compared to the European average. The overall degree of digitization in the EU is high, but some countries are lagging behind, such as Romania. The pandemic caused a reduction in the adoption of digitization across Europe [20].
Table 3.
Overall level of the DESI.
The appropriate DESI score dropped in 2021 because of the COVID-19 pandemic. Of the selected countries, Spain only managed to drop by 0.1. In 2022, all countries except Romania were above the EU average [20].
The Recovery and Resilience Facility is the key instrument at the heart of Next Generation EU, which will support economies in all Member States. Each country focuses on a different area of digitization that is needed in the country. The document focuses on areas such as digital services, data transformation, public procurement, and cyber and information security [20,21].
Germany’s recovery and resilience plan supports the digital transition with several investments and reforms. Digital challenges for Germany include lagging investments in digital infrastructure. Germany is investing EUR 3 billion to make public services digitally accessible at federal and regional levels [22].
Lithuania’s recovery and resilience plan supports the digital transition with reforms and investments in connectivity of EUR 73 million. The plan also includes substantial reforms and investments to digitalize the public sector (EUR 117 million), to promote digital skills for children, employees, civil servants, senior citizens, etc. [23].
Spain’s recovery and resilience plan supports the digital transition with investments in the digitalization of the public administration, in digital skills and digital inclusion, in cyber security, and in connectivity. It will invest EUR 3.6 billion in digital skills training. The plan includes investment of EUR 3.2 billion in the digital transformation of the public administration [24].
Romania’s recovery and resilience plan has the objective of addressing most of the country’s digital technology. Public administration digitalization investments amount to EUR 1.5 billion. In addition, digitalization of health includes investments of EUR 470 million for developing an integrated e-Health system. In addition, investments for digitalization of education (EUR 881 million) aim at improving digital pedagogical skills, educational content, and educational equipment [25].
In addition to the partial results of Germany, Romania, Spain, and Latvia in the DESI, it is necessary to look at the overall picture of all EU countries. A slight increase in DESI is occurring across the EU, so it is important to see the overall picture of EU digitization. A number of countries, such as Estonia, Denmark, and Finland, are leaders in digitalization. Therefore, it would be useful to establish a method and data to determine the efficiency within the EU in the field of digitalization policy and the e-Government area [14]. The United Nations has created a database to record and store data on the development of e-Government in 193 countries around the world. An important indicator of e-Government development and progress is the e-Government Development Index, abbreviated as EGDI. Out of 43 European countries, 24 countries have achieved a very high EGDI. European Union countries are among the leaders in e-Government because all countries have a high or very high level of EGDI [14]. According to the EGDI, a number of countries have low levels of e-Government, but of the selected countries, all have very high levels of the EGDI, apart from Romania. Table 4 shows the level of the EGDI in selected countries.
Table 4.
EGDI levels in selected countries and the five best countries.
Denmark and Finland are in the leading positions (in reverse order compared to the DESI). The top five countries are Denmark, Finland, South Korea, New Zealand, Iceland, and Iceland. Of the selected countries, Spain is the leader followed by Germany, Lithuania, and lastly Romania. Lithuania and Romania recorded the highest number of marriages compared to 2018. Spain’s progress has been moderate, but Germany has made almost no progress in 4 years [14]. A total of 87% of services across Europe require identification, either offline or online. Electronic identification solutions (referred to as eIDs) are like online passports. People use their eID to prove who they are online. The European leaders in eID are Iceland, Denmark, Estonia, Finland, Norway, Malta, Lithuania, and Denmark, where more than 90% of services are available through a national eID. Figure 2 shows the digital maturity of all participating countries. The overall maturity score is composed of the four key dimensions of User Centricity, Transparency, Key Enablers, and Cross-Border Services [15].
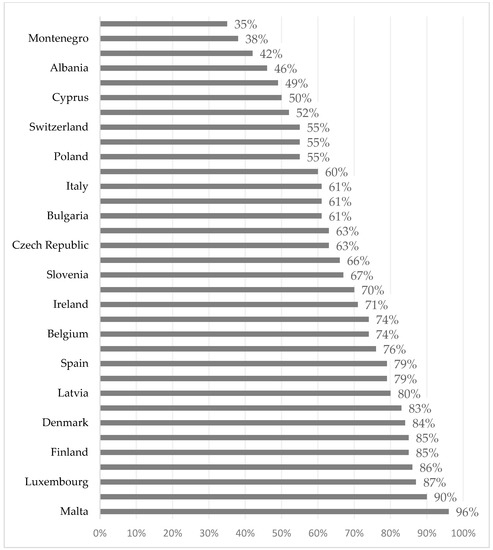
Figure 2.
The digital maturity of European countries.
Malta has the most mature digital government, at 96%, followed by Estonia at 90%. The selected countries are ranked Germany (63%), Lithuania (83%), Hungary (66%), and Spain (79%). Lithuania achieved a surprising result as it ranked the best among the selected countries. Overall, most EU countries have a high level of digital maturity [15].
Digital transformation in public administration is very important. There are many studies that deal with this area, and in recent years several academic articles have been written in this field (Table 5).
Table 5.
Literature review on digitization and e-Government.
2. Materials and Methods
The aim of this paper is to highlight the use of DEA method in the field of digitalization, focusing on the area of e-Governance, and to identify the various uses of the DEA method in different areas using available indices that identify digitization and e-Governance. The aim of the paper is also to identify the efficiency and inefficiency of countries in the EU in the field of digitalization. The methodology of the article is described in Table 6.
Table 6.
Methodology of the article.
The methodology of digital transformation is shown in the flowchart in Figure 3.
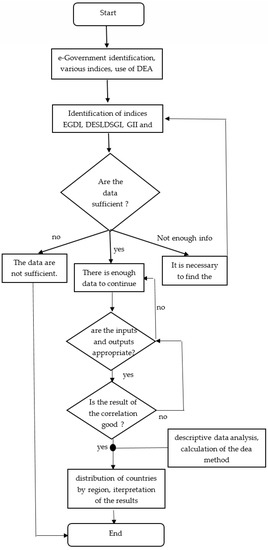
Figure 3.
Methodology. (Source: own processing).
The DEA method provides a ranking of the important management methods. It enables the evaluation of efficiency based on selected inputs and outputs. DEA was first used in 1978 by Charnes, Cooper, and Rhodes as a CCR model. In 1984, Bunker, Charnes, and Cooper introduced a variant of BCC that evaluates the efficiency of decision units under the assumption of variable returns to scale [36,37].
The basic DEA models are the CRR input- and output-oriented model, the BCC input- and output-oriented model, and the SBM model. In addition to these models, there are also modify-variate models which include the Malmquist index and super-efficiency model. The super-efficiency model works on the principle that the effective units are set equal to zero, thus removing them from the ensemble, and thus a new effective frontier is created from which efficiency is measured [37]. The basic objective of the DEA method is to compare organizational units, which are also referred to as DMUs. Each DMU uses a certain number of inputs for its activities and the activities result in certain outputs [38].
DEA models are based on the assumption that there is a set of admissible possibilities. This set is formed by all possible combinations of inputs and outputs, and is bounded by so-called efficient frontiers. Efficient units are those units whose combinations of inputs and outputs lie on the efficient frontier. Efficiency frontiers of the CCR and BCC models are shown in Figure 4.
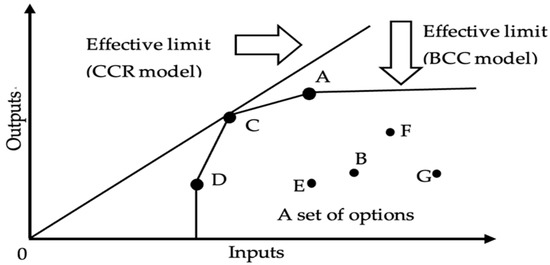
Figure 4.
CCR and BCC models shown graphically. (Source: elsevier.com [online]. (accessed on 11 January 2022). Available on the Internet: https://lnk.sk/5789 (accessed on 15 December 2015), own processing).
Figure 4 shows the sets of production options for the CCR and BCC models. The CCR model assumes consistent returns to scale, whereas the BCC model assumes inconsistent returns to scale. The set of options contains a convex hill, which is the set of existing nodes containing input nodes that are larger and output nodes that are smaller than the nodes in the set. The effective level is located on a straight line, or at multiple points on a straight line (see Figure 4). The formulas for calculating the output-oriented CCR and BCC models are shown in Table 7 [39].
Table 7.
CCR and BCC formulas of the output model.
Regarding model orientation, three variants are distinguished: input-oriented, output-oriented, and non-oriented. The input-oriented DEA model means that an inefficient subject becomes efficient by reducing its inputs while its outputs remain at least at the same level. The aim was to measure the efficiency of outcomes such as satisfaction with eID, interaction with public administration, and number of online services. In this study, we chose an oriented model. The general form of the output-oriented DEA model is determined in Table 7 [37].
The number calculated to express efficiency is called the efficiency value, D. This D-efficiency value can be obtained between 0 and 1.0. If the value is closer to 1.0, the model is more efficient. Since the efficiency value is calculated based on the most efficient node (D-efficiency value of 1.0), it is possible to determine how the nodes that do not reach the value of 1.0 differ from the efficient nodes [37]. The CCR model calculates the weights of the inputs and outputs, called the optimization calculation, so that for a DMU it is as accurate as possible in terms of its efficiency while respecting the maximum unit efficiency conditions of all other units [40].
Selection of Inputs and Outputs
The meaning and purpose of the analysis depends on the chosen inputs and outputs in the model. Inputs and outputs should be logically linked, as this is a production process. To ensure that the inputs and outputs are chosen correctly, we use correlation analysis. Using correlation analysis, we select the relationship between variables and eliminate variables with both very strong and very weak correlations [41,42].
In addition to the appropriate correlation coefficient between the right-hand side variables, the inputs and outputs must be matched to the number of DMUs. The rule of thumb used is the sum of the number of inputs and outputs ≤1/3 or 1/5 of the total number of DMUs.
The statistical relationship between the variables can be determined using the Spearman correlation coefficient. The correlation coefficient r is defined by Relation (1):
where N = number of elements, D = difference between x_n and y_n, i.e., two rows, r = correlation coefficient.
The correlation coefficient takes values from the interval ⟨−1; 1⟩ and expresses the degree of linear correlation between the variable. A value of −1 indicates absolute indirect dependence, 0 indicates no linear dependence, and 1 indicates absolute direct dependence between two variables. In DEA analysis, it is advisable that the correlation coefficient should not exceed 0.8 or else the efficiency result may be biased. The ideal correlation coefficient is in the range of 0.3–0.8 and, depending on the number of units, is validated at a significance level of 0.05 [42,43].
To use the DEA method, it is necessary to select the input and output units. Deciding on the appropriate input and output units to achieve the desired result is not an easy task. Thus, the method is used within the EU, which has 27 member states. The total number of inputs and outputs (m + s) is sought to be minimized to achieve a good predictive value of the model. As the number of inputs and outputs increases, all DMUs can become efficient. Hence, the model must satisfy the criterion m + s < n/5. In our study, we use 27 subjects and there is one input or output for every 5 subjects. This means that n = 27 and we have to divide this number by 5. This result will give us 5 or 6 inputs or outputs, or a combination of them. The total number of inputs and outputs that can be used is 5 to 6 at most. The input units are chosen from the composite indexes or a separate index. In terms of perspective, the GII: R&D investment index can reflect different levels of economic and social development and serve as an economic input, while the Internet usage index serves as a human input, providing an indication of Internet participation. Regarding the DSGI, it is an economic input to the DEA method. The CCR and BBC models focus on technological efficiency in the framework of e-Government, where 3 outputs have been selected. The models are output-oriented.
The 2 units from the e-Government benchmark are chosen as output units. One of the units is the availability of online e-Government services within the country and the other unit is the satisfaction with eID. The last output index chosen is the interaction with online government. For all input and output indices see Table 8.
Table 8.
Input and output DMU units.
We focused on two areas as inputs. The first area is the human factor, which represents the total number of Internet users in the country. The second area is the economic factor. In the economic factor, we chose to promote digital skills. This was because, if the government does not promote the digital skills of the population, it cannot grow the use of digital or e-Government services. The second economic factor is the share of GDP (Gross Domestic Product) supporting innovation. This factor represents the knowledge society, which is important in the world’s leading companies and an important factor for competitiveness and innovation creation. The outputs were chosen analogous to the inputs. That is, one of the output factors is the human factor, which represents the overall communication with the public administration online. Subsequently, two technological factors were chosen that represent the basis for the use of e-Government services. One of these is satisfaction with the eID, because if there is low satisfaction with the means of logging in, citizens will not use these services. The second economic factor is the availability of online services, because if there is a low number of online services, citizens are not able to use their desired service. In this analysis using DEA, 6 indices were chosen that may reflect different factors between countries within the EU. Other indices that can be used in this analysis include GDP, HDI, DESI, ICT investment, World Digital Competitiveness Capability Index, number of digital public services for citizens, number of digital public services for businesses, education spending (% of GDP), and others. Based on the selection of values, an input- or output-oriented CCR/BCC model can be created. The EU consists of 27 EU Member States. The aim of our measurement was also determined by the means of measurement or the choice of the model orientation, because we were interested in input–output effects so that we can measure the technological efficiency of e-Government in a given country. The outputs and inputs used in the analysis are unique to the system under consideration. Because we aimed to maximize the outcomes of the technology part of e-Government, we used an output-oriented model [40]. The DEA analysis not only focused on evaluating the efficiency improvement in e-Government for each country, but the countries were also divided into their areas within the EU as much as possible to compare the efficiency scores from the different EU areas. Table 9 shows the inputs and outputs for all DMUs and country breakdown by region.
Table 9.
Inputs and outputs data for the DEA method.
Correlation analysis is an important criterion for determining appropriate inputs and outputs. We performed correlation analysis for each combination of variables. The results of the correlation analysis are shown in Table 10.
Table 10.
Values of correlation coefficients between inputs and outputs.
Individual letters represent selected inputs and outputs:
- A (number of Internet users in % Penetration),
- B (DSGI—government support),
- C (Gross expenditure on research and development, % GDP), D (service online e-Government),
- E (satisfaction with eID login in [%]),
- F (interaction with public administration).
From the results of the correlation analysis, studying the literature on the use of DEA models, and consultation, it can be said that the values between the variables are suitable for DEA analysis. This confirmed the suitability of the selected inputs and outputs in the proposed DEA models. The descriptive statistics of the inputs and outputs used are shown in Table 11.
Table 11.
Descriptive statistics of inputs and outputs used.
Three inputs and three outputs were used in the analysis. For a more detailed description of the individual inputs and outputs, their maximum, minimum, average value, etc. were evaluated in each input.
3. Results
In this section, we apply the CCR and BCC models to evaluate the efficiency of e-Government in the EU. The computed results of the CCR and BCC models are presented in Table 12. The computation was performed using DEA-application.
Table 12.
Results of the DEA analysis.
In addition to the model results, the value of super-efficiency in both models was calculated. The CCR model found 10 states to be efficient and the BCC model found 13 states to be efficient. According to the CCR model, the Slovak Republic has an efficiency rate of 0.930, and according to the BCC model, this value is 0.986. The most efficient countries in terms of e-Government efficiency according to the CCR model are Greece, Italy, Portugal, Malta, Latvia, Estonia, Finland, Denmark, Poland, and Hungary. For the BCC model, these countries are joined by Austria, Romania, and Bulgaria. For some countries, the result may seem surprising, as the level of e-Government is not at a high level compared to other EU countries. However, these countries are becoming efficient because of their inputs.
Big differences between the results of the CRR and the BCC models are seen for Romania and Cyprus, that is, countries can have better results in one area, thus increasing their efficiency level. Table 11 shows the country rankings based on efficiency; for the CCR model, the ranking is given in column 6, and for the BCC model it is given in the last column. The overall efficiency ratio in the CCR model is 0.949 and in the BCC model it is 0.973.
In addition to evaluating the standard efficiency of the models, the so-called super-efficiency model was also used. Next, we discuss the results from the CCR model in the context of super-efficiency. Units that were found to be inefficient in the original model still took on the same values in the super-efficiency model.
3.1. Different among the Area of the European Union
From the results of the analysis carried out, there are obvious differences between the EU regions (Western, Northern, Southern, and Eastern EU regions) in the e-Government efficiency scores within EU-27. In 12 countries, representing almost half of the countries, the efficiency is lower than the average efficiency in the CCR model. This implies that almost half of the countries do not achieve even a primary efficiency score when building e-Government systems. In addition, e-Government services are still not being used to handle government business. The results of the CCR model in the Western EU are shown in Figure 5.
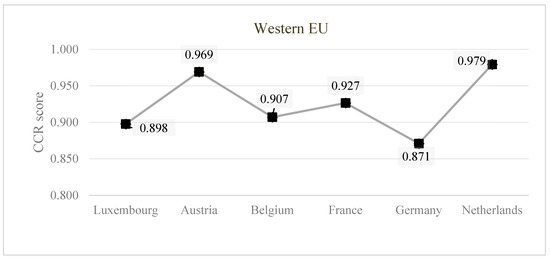
Figure 5.
Results of the CCR model in the Western EU. Source: own processing.
E-Government requires more attention from states with lower average efficiency. Figure 5 shows that within the Western EU the efficiency ranges from 0.871 to 0.979.
None of the Western EU countries have reached the efficient frontier of the CCR model, and thus can be considered inefficient. The highest score within the Western EU was achieved by the Netherlands (0.979) and the lowest by Germany (0.871) for the specified inputs and outputs. The results for the Northern, Eastern, and Southern EU regions are shown in Figure 5.
Figure 6 shows that for four of the seven countries within Northern EU, the efficiency rate is the highest. Within the Eastern EU there are two efficient countries, and the remainder do not even reach overall primary efficiency. The last area is the Southern EU, and within this region we can observe four of the eight countries are efficient. Through this analysis we found that the Northern EU countries do not invest a large amount of resources in inputs, but produce good quality outputs. On the other hand, the Western EU countries invest a large amount of resources in inputs, but their effect on outputs is not sufficient to be considered efficient. The raises the question of how the outputs should be adjusted or improved to turn an inefficient DMU into an efficient DMU.
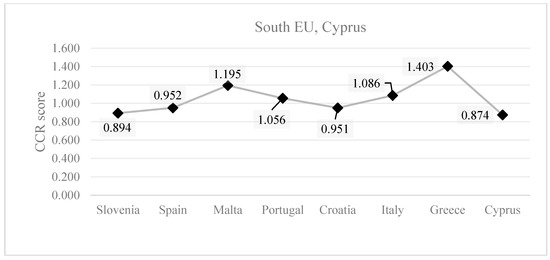
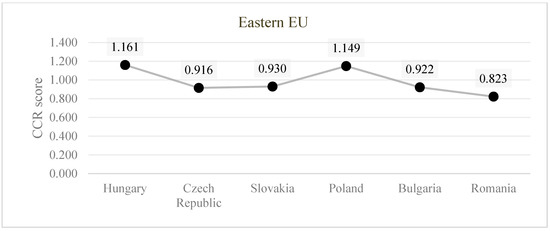
Figure 6.
CCR model results across Northern, Eastern, and Southern EU. Source: own processing.
Table 13 shows that not every output needs to be changed for the country to become efficient. For some countries, one output needs to be modified, but for others, two out of three outputs need to be modified. Countries that are efficient do not need to modify any output.
Table 13.
Changing outputs to achieve efficiencies.
3.2. Change in Outcomes for Selected Countries in the Region
The differences between countries are evident; in order to become effective and achieve a score of 1 in the DEA analysis a country needs to adjust outputs. For this comparison, countries from each EU region were selected. Figure 7 shows the countries and their change in output.

Figure 7.
Selected co untries and their change in output.
The results of the analysis show that Germany has to adjust two out of three outcomes. Germany should increase satisfaction with eID by 27% and increase interaction by 2.66 while keeping the same inputs. Consequently, Lithuania should inc rease the number of online e-Government services to 94.25% and increase interaction with the public administration by 3.19. To become efficient, Spain should increase the number of e-Government services by 0.41% and increase interaction with the public administration by 6.19. Romania scored the lowest efficiency of all countries, and to become efficient it should increase satisfaction with eID by 27.48% and increase interaction to at least a score of 38.99 out of 12. The number of online e-Government services is sufficient for the inputs.
The results also show that countries perform well but often fall short in either one or two outputs. It has been shown that public administration can be effectively promoted towards efficient, honest, open, and transparent governance through e-Government. It is essential for the European Union to use e-Government and to optimize and improve processes in communicating with citizens.
DEA analysis shows that some countries do not pay enough attention to building e-Government in some areas. This implies that they are not efficient compared to countries that use less inputs and catch up with high outputs. Governments should encourage greater openness and disclosure of information in government affairs, and the use of e-Government should be increased. In addition, satisfaction with eIDs should also increase, and interaction between citizens and the public administration should be enhanced. Modern public administrations should not only play the role of requesters of e-Government information, but should also be providers of information. Other countries can use similar analysis to identify sources of low efficiency and thus improve efficiency in that area.
4. Discussion
The research problem was to find suitable indicators to measure the efficiency of e-Government within the EU. Based on the results and output of DEA analysis, it is possible to say that some countries are inefficient. The most effective countries in the framework of e-Government are in the Scandinavian region, such as Estonia, Finland, Denmark, and Latvia. The inputs of these countries are in appropriate proportion to the outputs and their level of e-Government. We can see a big difference between Estonia, as a country belonging to the Eastern Bloc and having a relatively low level of GDP, and Denmark, whose GDP is much larger. In addition, this is the problem of Western Europe, which spends a large amount on inputs relative to the level of outputs and thus does not achieve efficiency. Thus, we can conclude that even a country with a low budget can achieve a high level of e-Government, if the spending of resources is effective in relation to their output [44].
One of the opportunities is to improve the transition to digitalization in public services. The European Union has developed several strategies for improving digitalization and e-Government. One is Europe’s Digital Decade: digital targets for 2030 and the other is the Recovery Plan for Europe [45,46]. In the coming years, individual Member States will improve their transformation to an e-digital economy and it would therefore be appropriate to focus on measuring the technological efficiency of e-Government. Studies show us that there are several indices that measure different areas of digitalization, e-Government, etc. Therefore, it is useful to use these data to better identify the areas in which some countries, such as Romania and Germany, are lagging behind, in order to improve their performance.
Digitalization plays an important role in all EU policies. Digital solutions bring with them opportunities and are important in rebuilding economies after the COVID-19 crisis, during the ongoing energy crisis, etc., to consolidate their position in the world economy. Digital technologies are increasingly contributing to increased productivity, efficiency, and sustainability and, above all, the overall well-being of the population [47].
Technological development is one of the important aspects that increases the rate of economic growth at the macro level. At the same time, the effective use of technological progress in various spheres of society leads not only to economic but also to social development [48].
The application of digitalization in several areas of the economy and society is taking place at different levels. Digitalization is one of the European Union’s priorities. The EU wants to improve the digital skills of its population, provide training for workers, and move towards a digitization in public services that respects fundamental rights and values [49,50].
During the writing of the first section and the determination of the topic of the paper, questions arose that needed to be answered. The questions and answers that arose during the processing of the article are as follows. Is it possible to use the DEA method to determine the efficiency of digitalization within the EU? Yes, it is possible to use the DEA method in different ways if the input parameter is set correctly. Is the data set necessary to meet the requirements of the DEA method available? There are a number of indices that are formed by appropriate input and output data. Is it possible to use the DEA method within the EU and to make comparisons with countries outside the EU? This is not possible because the metrics are not uniform or there are no comparable data. Is it possible to focus only on e-Government in the context of digitalization? Yes, there is a sufficient data set to enable the determination of the efficiency of e-Government digitization in EU Member States. Many authors have been addressing the issue of digitization for several years. The topic of digitization is still relevant, and as we can see in 2022 and 2021, authors are paying attention to this topic all over the world. The level of digitization varies from country to country, as do the solutions. The European Union is one of the leaders in digitization, as confirmed by the EGDI index. However, as the results of this paper show, many countries are efficient and the e-Government parameter in some countries needs to be improved to adequately respond to the input values and avoid unnecessary wastage of resources. These results are also supported by research conducted in China. Within the EU, the problem is similar, in that some countries are inefficient, such as Romania, Lithuania, and Germany. Measuring efficiency using the DEA method can help governments to know which areas need to be improved while maintaining or reducing inputs, in order to achieve the same level of output as other EU countries with which they can establish closer cooperation. Cooperation within the EU will be very important in the future if there is to be unification and closer integration of the eID, foreign residency, use of e-services within the EU, etc. With the increasing digitalization, there is a growing concern about e-waste, which is becoming an issue. The EU is trying to eliminate this problem by gradually modifying the legislation on small and medium-sized e-electronic devices [49,50,51,52]. In order to measure the success of the introduction of new rules in the European market, it would be appropriate to measure their efficiency using the DEA method, in all areas, since an efficient approach results in the better use of resources in a given area, which could result in financial savings that could be used in other areas. As mentioned in the first section, many authors have used the DEA method to measure efficiency, e.g., in agriculture, energy, and overall digitalization. The DEA method has a wide range of applications in different fields. As mentioned in the introductory part of this thesis, the recovery and resilience plan is intended to help selected or all countries in their digital transformation. These investments and their results will only be visible in a few years’ time. Therefore, we need to trace how effective these financial resources have been in influencing the results of e-Government, whether in terms of eID satisfaction, increased interaction between citizens and public administration, or increased number of online services.
Contributions and Limitations
The article focuses on the use of the DEA method using various indices that include the countries of the European Union. In developing the article, we identified various limits or opportunities for further research.
One of the main limitations is that countries do not record investments or resources used in e-Government for a certain period using a uniform standard, which would enable these data to be examined for use in the DEA method. Another problem is access to data that could be used for non-EU countries. Further limits and restrictions are listed in Table 14.
Table 14.
Insights from this study and the limits.
5. Conclusions
The article provides an overview of the use of the DEA method, in which we identified that this method is used in different areas of digitization to measure efficiency. In addition, the first part of the paper defines all the available indices to measure digitalization, such as DESI, EGDI, DSGI, E-Government benchmark, GII, and the Going Digital Toolkit. The paper focuses on measuring the efficiency of digitization in e-Government in the context of renewability.
Digitalization can be seen as a tool to achieve sustainable development and provides access to untapped and integrated big data sites with potential benefits for society. Therefore, it is necessary to look at all aspects and areas of digitalization that can contribute to this. One of these areas is e-Government, since it changes the functioning of the state in the digital domain so that it should contribute to reducing the bureaucratic burden on both citizens and state institutions. E-Government brings a number of benefits to citizens, such as 24/7 availability, saving money, and saving time. However, it may also have a secondary impact, particularly in terms of increased demand for electricity and electrical equipment, more waste, greater consumption of scarce resources for battery production, higher electricity consumption in the telecommunications sector, etc. [52,53,54,55].
Consequently, authors Abdul-Lateef Balogun, Danny Marks et al. also stated that digitalization is a key factor [53]. As is already evident, several authors have focused on digitalization as one of the key factors. In this paper, we focused on the efficiency of digitalization in the field of e-Government, which may be one of the key elements of the functioning of the state in the future.
The results of this article show that the countries of the Northern European Union are efficient in the field of digitalization. Those countries are Denmark, Finland, Lithuania, and Estonia. The resources they spend on building e-Government infrastructure and services are efficiently matched in outputs.
The results of the CCR model show that 10 of the 27 countries are efficient, representing 37% of the countries. On the other hand, 63% of countries are inefficient within the EU. There are several reasons for this. One cause may be spending excessive resources on inputs, because even countries with less economic power can perform better. These countries are not spending resources efficiently to achieve the desired effect. Countries within the EU should reconsider spending resources on inputs in order to achieve efficient spending of resources on outputs.
Among the limitations that we identified while writing the article is the low number of articles using the DEA method in the e-Government field, although there are a number of studies in other areas of digitalization. Other limitations include the absence of non-EU index data. Having these data could make comparisons outside the EU more feasible. This also suggests an idea for another article, namely, looking for common parameters within the world, or the creation of such an index, which would also include the economic aspects of e-Government in the regions.
In addition, as already mentioned, few studies have examined the use of the DEA method in e-Government. Further research could also measure the outcome of digitalization within the EU using established indices, thereby measuring the impact of digitalization on the economy, society, and public sector. Another possible research area could be the measurement of the efficiency of e-Government based on the time level, because input data could relate to the resources spent on the informatization of society and the output level of digitization.
Not enough attention is paid to digitization and e-Government. Efficiency has not been measured within this area using the DEA method. However, such research has already been conducted in China. The OECD study is devoted to the input-oriented model, whereas ours uses the output-oriented model. See Table 15 for a comparison with another study [55,56].
Table 15.
Comparison of the research with other studies.
Author Contributions
Conceptualization, M.K., K.R.S., J.S. and V.B.; methodology, M.K. and K.R.S.; software, M.K.; validation, J.S. and V.B.; formal analysis, M.K. and V.B.; investigation, M.K., K.R.S., J.S. and V.B.; resources, M.K., K.R.S., J.S. and V.B.; data curation, M.K. and V.B.; writing—M.K., K.R.S., J.S. and V.B.; writing—review and editing, M.K., K.R.S., J.S. and V.B.; visualization, M.K. and V.B.; supervision, K.R.S.; project administration, J.S. and V.B. All authors have read and agreed to the published version of the manuscript.
Funding
This paper was supported by project VEGA 1/0460/22, VEGA 1/0524/22, VEGA 1/0248/21.
Institutional Review Board Statement
Not applicable.
Informed Consent Statement
Informed consent was obtained from all subjects involved in the study.
Data Availability Statement
The data presented are available on request from the corresponding author.
Conflicts of Interest
The authors declare no conflict of interest.
References
- Fine, D.; Johnson, T. Digital Asset Management in the Public Sector. J. Digit. Asset Manag. 2005, 1, 25–31. [Google Scholar] [CrossRef]
- Breaugh, J.; Rackwitz, M.; Hammerschmid, G. Leadership and Institutional Design in Collaborative Government Digitalisation: Evidence from Belgium, Denmark, Estonia, Germany, and the UK. Gov. Inf. Q. 2023, 101788. [Google Scholar] [CrossRef]
- OECD Digital Government Index. Public Governance Policy Paper; OECD: Paris, France, 2020; p. 15. [Google Scholar] [CrossRef]
- United Nations. United Nations E-Government Survey 2012; United Nations: New York, NY, USA, 2012; pp. 9–35. [Google Scholar]
- Digital Government Index. Available online: https://www.oecd.org/gov/digital-government-index-4de9f5bb-en.htm (accessed on 9 January 2023).
- Malodia, S.; Dhir, A.; Mishra, M.; Bhatti, Z.A. Future of E-Government: An Integrated Conceptual Framework. Technol. Forecast. Soc. Chang. 2021, 173, 121102. [Google Scholar] [CrossRef]
- Scholta, H.; Mertens, W.; Kowalkiewicz, M.; Becker, J. From One-Stop Shop to No-Stop Shop: An E-Government Stage Model. Gov. Inf. Q. 2019, 36, 11–26. [Google Scholar] [CrossRef]
- Spirakis, G.; Spiraki, C.; Nikolopoulos, K. The impact of electronic government on democracy: E-democracy through e-participation. Electron. Gov. 2010, 7, 75–88. [Google Scholar] [CrossRef]
- Evans, D.; Yen, D.C. E-Government: Evolving Relationship of Citizens and Government, Domestic, and International Development. Gov. Inf. Q. 2006, 23, 207–235. [Google Scholar] [CrossRef]
- UNDPEPA; ASPA. Assessing the Progress of the UN Member States. Benchmarking E-government: A Global Perspective; United Nations Department of Economic and Social Affairs: New York, NY, USA, 2002. [Google Scholar]
- Silcock, R. What is e-government. Parliam. Aff. 2001, 54, 88–101. [Google Scholar] [CrossRef]
- Wirtz, B.; Daiser, P. E-Government Strategy Process Instruments, 1st ed.; German University of Administrative Sciences Speyer: Speyer, Germany, 2015; p. 191. ISBN 9783000204457. [Google Scholar]
- Elhag, M.; Boteva, S. Conceptual Assessment of Energy Input-Output Analysis and Data Envelopment Analysis of Greenhouse Crops in Crete Island, Greece. Environ. Sci. Pollut. Res. 2019, 26, 35377–35386. [Google Scholar] [CrossRef]
- E-Government Development Index. Available online: https://publicadministration.un.org/egovkb/en-us/About/Overview/-E-Government-Development-Index (accessed on 9 January 2023).
- EGovernment Benchmark. 2022. Available online: https://digital-strategy.ec.europa.eu/en/library/egovernment-benchmark-2022 (accessed on 9 January 2023).
- Data Services-Eurostat. Available online: https://ec.europa.eu/eurostat/web/main/eurostat/web/main/help/faq/data-services (accessed on 9 January 2023).
- Global Innovation Index (GII). Available online: https://www.wipo.int/global_innovation_index/en/ (accessed on 9 January 2023).
- Digital Skills Gap Index. Available online: https://dsgi.wiley.com/ (accessed on 9 January 2023).
- OECD Going Digital Toolkit. Available online: https://goingdigital.oecd.org/indicator/53 (accessed on 17 March 2022).
- The Digital Economy and Society Index (DESI). Available online: https://digital-strategy.ec.europa.eu/en/policies/countries-digitisation-performance (accessed on 20 January 2022).
- Recovery and Resilience Facility. Available online: https://commission.europa.eu/business-economy-euro/economic-recovery/recovery-and-resilience-facility_en#how-does-it-work (accessed on 7 March 2023).
- Germany’s Recovery and Resilience Plan. Available online: https://commission.europa.eu/business-economy-euro/economic-recovery/recovery-and-resilience-facility/germanys-recovery-and-resilience-plan_en (accessed on 7 March 2023).
- Lithuania’s Recovery and Resilience Plan. Available online: https://commission.europa.eu/business-economy-euro/economic-recovery/recovery-and-resilience-facility/lithuanias-recovery-and-resilience-plan_en (accessed on 7 March 2023).
- Spain’s Recovery and Resilience Plan. Available online: https://commission.europa.eu/business-economy-euro/economic-recovery/recovery-and-resilience-facility/spains-recovery-and-resilience-plan_en (accessed on 7 March 2023).
- Recovery and Resilience Plan for Romania. Available online: https://commission.europa.eu/business-economy-euro/economic-recovery/recovery-and-resilience-facility/recovery-and-resilience-plan-romania_en (accessed on 7 March 2023).
- Dhaoui, I. E-Government for Sustainable Development: Evidence from MENA Countries. J. Knowl. Econ. 2022, 13, 2070–2099. [Google Scholar] [CrossRef]
- Onyango, G.; Ondiek, J.O. Digitalization and Integration of Sustainable Development Goals (SGDs) in Public Organizations in Kenya. Public Organ. Rev. 2021, 21, 511–526. [Google Scholar] [CrossRef]
- Ha, L.T. Are Digital Business and Digital Public Services a Driver for Better Energy Security? Evidence from a European Sample. Environ. Sci. Pollut. Res. 2022, 29, 27232–27256. [Google Scholar] [CrossRef]
- Schneider, D.; Klumpe, J.; Adam, M.; Benlian, A. Nudging Users into Digital Service Solutions. Electron. Mark. 2020, 30, 863–881. [Google Scholar] [CrossRef]
- Tammpuu, P.; Masso, A. Transnational Digital Identity as an Instrument for Global Digital Citizenship: The Case of Estonia’s E-Residency. Inf. Syst. Front. 2019, 21, 621–634. [Google Scholar] [CrossRef]
- Ullah, A.; Pinglu, C.; Ullah, S.; Abbas, H.S.M.; Khan, S. The Role of E-Governance in Combating COVID-19 and Promoting Sustainable Development: A Comparative Study of China and Pakistan. Chin. Polit. Sci. Rev. 2021, 6, 86–118. [Google Scholar] [CrossRef]
- Wu, J.; Guo, D. Measuring E-Government Performance of Provincial Government Website in China with Slacks-Based Efficiency Measurement. Technol. Forecast. Soc. Chang. 2015, 96, 25–31. [Google Scholar] [CrossRef]
- Härmand, K. Digitalisation before and after the COVID-19 Crisis. ERA Forum 2021, 22, 39–50. [Google Scholar] [CrossRef]
- Idzi, F.M.; Gomes, R.C. Digital Governance: Government Strategies That Impact Public Services. Glob. Public Policy Gov. 2022, 2, 427–452. [Google Scholar] [CrossRef]
- Paul, S.; Das, S. Accessibility and Usability Analysis of Indian E-Government Websites. Univers. Access Inf. Soc. 2020, 19, 949–957. [Google Scholar] [CrossRef]
- Omrani, H.; Alizadeh, A.; Naghizadeh, F. Incorporating Decision Makers’ Preferences into DEA and Common Weight DEA Models Based on the Best–Worst Method (BWM). Soft Comput. 2020, 24, 3989–4002. [Google Scholar] [CrossRef]
- Charnes, A.; Cooper, W.W.; Rhodes, E. Measuring the Efficiency of Decision Making Units. Eur. J. Oper. Res. 1978, 2, 429–444. [Google Scholar] [CrossRef]
- Cova-Alonso, D.J.; Díaz-Hernández, J.J.; Martínez-Budría, E. A Strong Efficiency Measure for CCR/BCC Models. Eur. J. Oper. Res. 2021, 291, 284–295. [Google Scholar] [CrossRef]
- Nishiuchi, H.; Todoroki, T.; Kishi, Y. A Fundamental Study on Evaluation of Public Transport Transfer Nodes by Data Envelop Analysis Approach Using Smart Card Data. Transp. Res. Procedia 2015, 6, 391–401. [Google Scholar] [CrossRef]
- Aminuddin, W.M.W.M.; Ismail, W.R. Integrated Simulation and Data Envelopment Analysis Models in Emergency Department. AIP Conf. Proc. 2016, 1784, 050003. [Google Scholar] [CrossRef]
- Data Envelopment Analyza Efektivnosti. Available online: http://pc2.iam.fmph.uniba.sk/dea/model.html (accessed on 27 February 2023).
- Spearman’s Rank Order Correlation Using SPSS Statistics—A How-To Statistical Guide by Laerd Statistics. Available online: https://statistics.laerd.com/spss-tutorials/spearmans-rank-order-correlation-using-spss-statistics.php (accessed on 27 February 2023).
- Šoltés, E. Regresná a Korelačná Analýza s Aplikáciami; Wolters Kluwer: Alphen aan den Rijn, The Netherlands, 2008; pp. 223–228. [Google Scholar]
- Formovanie Digitálnej Budúcnosti Európy. Available online: https://commission.europa.eu/strategy-and-policy/priorities-2019-2024/europe-fit-digital-age/shaping-europes-digital-future_sk (accessed on 12 January 2023).
- Digitalizácia: Dôležitosť, Benefity a Legislatíva EÚ. Available online: https://www.europarl.europa.eu/news/sk/headlines/society/20210414STO02010/digitalizacia-dolezitost-benefity-a-legislativa-eu (accessed on 12 January 2023).
- Arsova, S.; Corpakis, D.; Genovese, A.; Ketikidis, P.H. The EU Green Deal: Spreading or Concentrating Prosperity? Resour. Conserv. Recycl. 2021, 171, 105637. [Google Scholar] [CrossRef]
- Khusainov, B.D.; Shirov, A.A.; Baizakov, N.A. The Quality of Growth and Digitalization in the Eurasian Integration Countries: An Econometric Analysis. Stud. Russ. Econ. Dev. 2022, 33, 547–554. [Google Scholar] [CrossRef]
- Estonian-Finnish E-Governance without Borders—E-Estonia. Available online: https://e-estonia.com/estonian-finnish-e-governance-without-borders/ (accessed on 21 February 2023).
- Long-Awaited Common Charger for Mobile Devices Will Be a Reality in 2024|News|European Parliament. Available online: https://www.europarl.europa.eu/news/en/press-room/20220930IPR41928/long-awaited-common-charger-for-mobile-devices-will-be-a-reality-in-2024 (accessed on 12 January 2023).
- Soete, L.; Verspagen, B.; Ziesemer, T.H.W. Economic Impact of Public R&D: An International Perspective. Ind. Corp. Chang. 2022, 31, 1–18. [Google Scholar] [CrossRef]
- Nagovnak, P.; Kienberger, T.; Baumann, M.; Binderbauer, P.; Vouk, T. Improving the Methodology of National Energy Balances to Adapt to the Energy Transition. Energy Strateg. Rev. 2022, 44, 100994. [Google Scholar] [CrossRef]
- Vereecken, W.; van Heddeghem, W.; Deruyck, M.; Puype, B.; Lannoo, B.; Joseph, W.; Colle, D.; Martens, L.; Demeester, P.; Ayre, R.; et al. Worldwide Electricity Consumption of Communication Networks. Opt. Express 2012, 20, B513–B524. [Google Scholar] [CrossRef]
- Balogun, A.L.; Marks, D.; Sharma, R.; Shekhar, H.; Balmes, C.; Maheng, D.; Arshad, A.; Salehi, P. Assessing the Potentials of Digitalization as a Tool for Climate Change Adaptation and Sustainable Development in Urban Centres. Sustain. Cities Soc. 2020, 53, 101888. [Google Scholar] [CrossRef]
- Yalçın, E.C. Efficiency Measurement of Digitalization on EU Countries: A Study Based on Data Envelopment Analysis. Int. J. Manag. Knowl. Learn. 2021, 10, 323–333. [Google Scholar] [CrossRef]
- Umbach, G.; Tkalec, I. Evaluating E-Governance through E-Government: Practices and Challenges of Assessing the Digitalisation of Public Governmental Services. Eval. Program Plann. 2022, 93, 102118. [Google Scholar] [CrossRef]
- Európska Komisia Predstavila Digitálny Kompas Do Roku 2030|Ministerstvo Investícií, Regionálneho Rozvoja a Informatizácie SR. Available online: https://www.mirri.gov.sk/aktuality/digitalna-agenda/europska-komisia-predstavila-digitalny-kompas-do-roku-2030/index.html (accessed on 21 February 2023).


Disclaimer/Publisher’s Note: The statements, opinions and data contained in all publications are solely those of the individual author(s) and contributor(s) and not of MDPI and/or the editor(s). MDPI and/or the editor(s) disclaim responsibility for any injury to people or property resulting from any ideas, methods, instructions or products referred to in the content. |
© 2023 by the authors. Licensee MDPI, Basel, Switzerland. This article is an open access article distributed under the terms and conditions of the Creative Commons Attribution (CC BY) license (https://creativecommons.org/licenses/by/4.0/).