Abstract
The startup process is the crucial transition phase of the supercritical carbon-dioxide Brayton cycle, so it is essential to focus on and investigate the transient performance for the system’s safety and stability. The pressure in the buffer tank approaches the safety upper limit with different startup schemes during the joint commissioning of the compressor and heater in a MWe-scale experiment system, while the maximum temperature is 309 °C. Hence, dynamic simulations are carried out to explore the dynamic startup characteristics from a cold state or a warm state to the turbine pre-start condition, in which 60% of the rated mass flow rate and 67% of the rated compressor speed are reached in the end. The results show that, when starting from a cold state, the startup scheme of simultaneously heating and speeding up has a limited effective application scope. Two venting operations during the above process help the system establish heat regeneration and promote temperature uniformity in the system. Furthermore, when starting from a warm state with an existing temperature gradient in the system, the startup scheme of simultaneously heating and speeding up is more effective and has a more extensive range of control.
1. Introduction
The supercritical carbon dioxide (sCO2) power generation system has remarkable advantages in efficiency, volume, and flexibility over traditional steam power generation due to its excellent thermophysical properties, small compression power consumption, compact structure, and fewer components [1,2]. It has a wide range of applications, including solar and nuclear power generation [3,4], ship propulsion [5], waste heat utilization [6], and coal-fired power generation [7]. Therefore, it is increasingly becoming a new generation of advanced power technology with high efficiency, low cost, and environmental-friendliness.
For a new form of thermal power conversion system coupled with versatile heat sources, in existing research, the investigators analyze the key problems and control strategies that affect the stability, safety, and flexibility of the sCO2 closed Brayton cycle. The sCO2 Brayton cycle has the characteristics of nonlinear physical properties, strong internal interactions of a closed system, and compression near the critical point, resulting in its unique transient performance. Among them, nonlinear physical properties refer to the abrupt changes in sCO2 density, thermal conductivity, specific heat, and viscosity in the near-critical region, which present challenges to the design and operation of the compressors, low-temperature recuperators, and coolers working in the near-critical region. The strong internal interaction of a closed system refers to the strong interaction among the processes of compression, heating, expansion, and cooling of the working fluid in the closed system, which means that the upstream disturbance will quickly and significantly affect the downstream components, while local changes will be transmitted to the whole system. Compression near the critical point means that the compressor works near the critical point to greatly reduce the compression power consumption. However, the density at the compressor inlet varies greatly even for a small change in temperature and pressure in the near-critical region, so the compressor inlet condition may easily drop into the two-phase region, leading to droplet formation that would damage the compressor impeller and affect the stability and safe operation of the system. These responses will pose significant challenges to the system’s integrated design and efficient co-ordination. Therefore, as a technology with less maturity, numerous challenges, and great potential, the dynamic performance and control strategies of the sCO2 Brayton cycle need to be carefully investigated before its real application in power generation.
Currently, the available research on dynamic performance focuses mostly on three areas: startup, shutdown, and off-design conditions. When the system deviates from the design point, local disturbances take place, and accident conditions occur, the research on off-design conditions primarily focuses on the regulation methods that comprehensively address the efficiency, stability, response speed, and load regulation range issues [8,9,10,11,12,13,14,15]. However, there is limited and inadequate research on startup and shutdown during the transition phase. Using a suitable and practical startup and shutdown sequence and control strategy, temperature and pressure fluctuations can be minimized, and the safety of system components can be ensured. Hence, it is critical to guide the smooth startup of the system from a cold state and to ensure the safe shutdown under the designed working conditions. At the simulation level, Liese [16] from the National Energy Technology Laboratory (NETL) uses the commercial software Aspen Plus to simulate the detailed continuous process of shutdown from 4 MW to a warm condition and subsequent startup from the warm condition of a 10 MW recompression cycle. By manually changing the opening of the outlet valves of the main compressor and recompressor and the inlet valve of the turbine in sequence, it meets the requirement that the change rate of the Turbine Inlet Temperature (TIT) is less than 2 °C per minute. Finally, it takes 30 min and 45 min, respectively, for shutdown and startup to reach a positive load. Luu [17] uses the commercial software Dymola to simulate the process from a cold-start to full-load operation (including four continuous operation stages) for the 2 MW solar-assisted recompression sCO2 Brayton cycle. Based on the phase diagram of CO2, an effective control strategy for solar energy fluctuation is developed and combined with the startup scheme to guide the cycle through the transient phase and maintain the supercritical state. It is found that the recompression cycle has high stability when the load fluctuates, and CO2 can maintain a supercritical state. Marchionni [18] creates a one-dimensional and three-dimensional heat transfer model of the Printed Circuit Heat Exchanger (PCHE) in the commercial codes GT-SUITE and Fluent, respectively. The Colebrook equation and Gnieliski correlation are employed for the fanning factor and heat transfer calculation in the 1-D model, respectively. The periodic and symmetry boundary conditions are used in the 3-D model. The 1-D model is verified by comparing the result of the pressure drop, temperature profile, and local heat transfer with the 3-D model. After the benchmarking, the 1-D approach is used to model a 630 kW PCHE recuperator to predict the performance at design points and off-design points. The transient results show that the sCO2 thermal expansion is intensified due to the rapid reduction in density and the rapid increase in pressure during the startup of the recuperator. The startup process should be controlled to prevent a drastic change in PCHE temperature and thermal stress. In the absence of a comprehensive description of the startup and shutdown process in the existing research, Wang [19] from Tianjin University (TJU) simulates the detailed startup and shutdown process of about a 500 kW recompression cycle using the commercial software MATLAB/Simulink and believes that the fuel supply and compressor speed changes should be co-ordinated. The compressor speed should be increased before the fuel increases at startup, while the compressor speed should be reduced later than the fuel decreases at shutdown. During startup and shutdown, the charging valve and the discharging valve at the cooler inlet are used to control the inlet pressure of the main compressor to keep it between the critical pressure and 10 MPa, and the compressor backflow valve is used to avoid surge in the main compressor and the recompressor. Herrera [20] from the Gas Technology Institute (GTI) uses the commercial code Flownex to evaluate the stable startup method and the control strategy of emergency shutdown for simple and recompression cycles at a 10 MW sCO2 test facility built by Southwest Research Institute (SwRI). The startup periods of the simple and recompression cycles are 7 h and 10 h, respectively. The simulation results show that the use of inventory control during startup can ensure that the system pressure and flow rate increase steadily, and the circulating flow does not exceed the component limits. They reduce the set temperature of the TIT first and then shut down the compressor during shutdown to avoid the High-Temperature Recuperator (HTR)’s inlet temperature exceeding 600 °C.
Many research institutions have studied the startup and shutdown processes of kW- and MW-scale experimental plants. Wright [21] from Sandia National Laboratories (SNL) has developed a feasible cold startup method in the simple recuperative cycle test to ensure that the flow in the cycle is in the design direction during the process from cold to hot idle, and the turbine bypass valve is used to ensure the positive flow of the main compressor and heater during cold startup to preheat the system. Conboy [22] then employs Wright’s simple cycle startup method in the startup from the cold state to the turbine power-output state in an experiment of the recompression cycle with a Turbine–Compressor (T–C) coaxial arrangement. The initial fill must ensure that the design working conditions are met and that two-phase states at the compressor inlet during startup are avoided. At the beginning, the turbine bypass is fully opened to preheat the hot side of the system and prevent reverse flow. The speed of the main compressor and the recompressor are increased to 25,000 rpm at the same time, and the bypass switching starts when the TIT is 350 K. After that, the power of the electric heater continued to be increased. As the density difference at the inlet of the main compressors and recompressors gradually increases during the startup process, it is necessary to control the speed to match the pressure ratios of the two compressors to prevent surge and balance the outlet pressure. At this stage, when the TIT is between 550 and 650 K, the main compressor and the recompressor reach power balance, respectively. With the increase in speed and temperature, the maximum power output of 15 kW is reached, while the TIT is 750 K, the regenerative power is 1.35 MW, and the electric heater power is 350 kW. Clementoni [23] from Bechtel Marine Propulsion Corporation (BMPC) investigates the operation and control of a small power unit rated at 100 kW. They first charge the CO2 required by the rated working condition, then warm up the heater and cooler to 74 °C and 38 °C, respectively, preheat the hot side of the cycle to ensure the forward flow of the turbine, and then increase the speed to 37,500 rpm at idle speed to ensure the stable operation of the T–C and the minimum circulation flow. Then, according to the maximum temperature-rise rate of 111 °C per hour, the temperature will rise to the hot idle working condition, complete the net zero output of power, and finally increase the speed again to the rated working condition with the maximum TIT of 299 °C. Meanwhile, 70% of the flow during startup flows through the compressor bypass. For the Sunshot initiative, the main purpose is to test the operating performance of the 10 MW turbine. In the 2019 experiment, in order to avoid dry ice formation from the dry gas seal during the fill, they fill the loop with hot flow through dry gas seals, and simultaneously fill the rest of the loop through the filling pump. At the same time, by comparing the design working condition with the filling temperature and pressure, it is found that the cycle mass is too much when the filling temperature is less than 32 °C. In the turbine startup phase, effective heat recuperation is established with a constant, small flow, and mass is vented to ensure the proper inlet pressure of the pump [24]. In the 2021 experiment, in which the test condition successfully reaches 715 °C, 23.4 MPa, and 27,000 rpm, they focus on these essential issues as well, such as ice formation, heater trips, starting-up methods, loop mass balance, and controlled shutdowns. During the above test, they also illuminate the importance of the management of filling and venting [25]. Smith [26] pays attention to the safety of the shutdown process in the Supercritical Transformation of Electrical Power (STEP), mainly focusing on the interactions among the components such as temperature migration and settle-out pressure. Overheating, shock cooling, and compressor density swing are all caused by temperature migration. The settle-out pressure will cause overpressure on components. By using the check valve at the outlet of the recompressor and the quick closing of the control valve at the inlet of the turbine, the high-pressure and low-pressure sections can be separated. The automated trip sequences employed by the Distributed Control System (DCS) are also given to reduce the damage to components.
Some published research on startup is shown in Table 1. It can be seen that the experiment and dynamic simulation of the dynamic characteristics and control methods for the startup process from the kW to MW scale have been studied. In general, the simulation lacks the support of systematic experimental data, and most of them only verify the component model instead of the system model with experimental or simulation data, which is unable to effectively reflect experimental phenomena. Furthermore, there has not been enough research carried out on the application scope of the startup scheme of simultaneous heating and speeding-up under the actual constraints of the experimental system. Therefore, we will analyze the stable startup methods of the system by means of dynamic simulation, quantitatively analyze the matching relationship between heating and speeding up, and explore the optimal control strategies for the process during compressor–heater joint startup. This paper is based on the MWe-scale sCO2 experimental facility of the Institute of Engineering Thermophysics (IET) under the Chinese Academy of Sciences (CAS), which was completed in December 2021 and put into commissioning operation. At present, the compressor speedup tests from the cold state, the joint commissioning of compressor and heater tests, and other tests have been carried out in our facility. In order to verify the reliability of the simulation method, both the component sub-model and the system model are validated with experiment results.

Table 1.
Existing research on the startup process.
2. Experimental System and Test Results
2.1. The MWe-Scale sCO2 Test Plant
IET has built a 1 MWe sCO2 experimental power plant of the simple recuperated closed Brayton cycle [27]. The layout of the system is shown in Figure 1. The system mainly includes the compressor (C), turbine (T), low-temperature recuperator (LTR), high-temperature recuperator (HTR), cooler (CL), heater, hydraulic dynamometer (HD), and other auxiliary systems (dry gas seal system, control system, gearbox oil station, cooling system, charging system, lubricating oil station, etc.). V1 represents the compressor inlet regulating valve, V2 represents the compressor outlet regulating valve, V3 represents the compressor bypass valve, V4 represents the turbine inlet regulating valve, and V5 represents the turbine bypass regulating valve. The designed system performance parameters are shown in Table 2; the parameters of each component are shown in Table 3. The self-developed sCO2 two-stage centrifugal compressor has completed the full-load test under various inlet conditions and has reached the design speed [28]. In the minor cycle of the buffer tank, CO2 is pressurized by the pneumatic circulating pump and electric booster pump, heated to the supercritical state by the electric heater, and stored in the buffer tank. Then, sCO2 enters the LTR and HTR for heat regeneration after being boosted by the compressor. The external heat source is a gas-fired sCO2 heater. The working medium enters the heater for heat absorption and then enters the turbine for expansion. The expansion work is consumed and measured by the hydraulic dynamometer. After being recuperated by the HTR and LTR, the exhaust sCO2 enters the cooler for heat rejection. Finally, it returns to the buffer tank to complete the closed cycle.
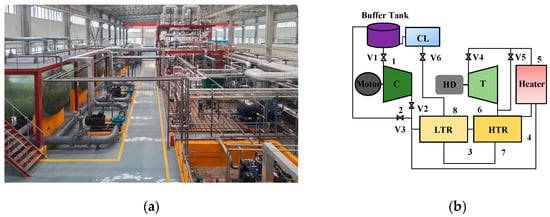
Figure 1.
System layout: (a) photo of the experimental system; (b) configuration.
Table 2.
Nominal parameters of the experimental system.
Table 3.
Parameters of each component.
2.2. The Low-Parameter Test Result of the Compressor–Heater Joint Commissioning
Recently, our team conducted the low-parameter commissioning of the experimental system. The purpose of the experiment is to test the performance of the combined operation and continuous startup of the compressor and heater when the compressor operates at low speed, the heater operates at low load, and the system is in a low-pressure state. The parameters of the measurement sensor for the pressure, temperature, and mass flow rate are shown in Table 4. According to the startup mode of the compressor and heater, the test process can be divided into four phases, as shown in Figure 2a and Table 5. P1 and T1 represent the compressor inlet pressure and temperature, respectively; P2 represents the outlet pressure; m1 represents the compressor flow rate; nc represents the compressor speed; and TIT represents the heater outlet temperature. The time points of sCO2 venting are shown by the black arrow at the top of Figure 2.
Table 4.
Measurement parameters.
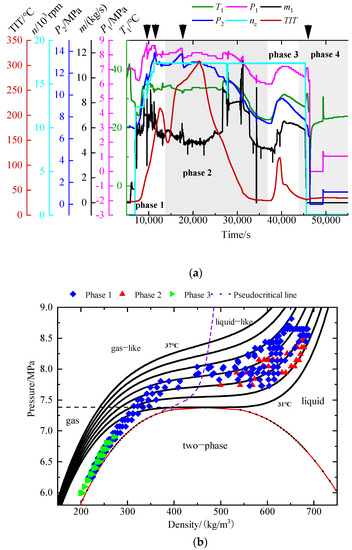
Figure 2.
Test result: (a) test data for compressor-heater joint startup; (b) CO2 pressure-density diagram at the compressor inlet.
Table 5.
Startup features of each phase.
In phase 1, the compressor speed and heat supply are increased simultaneously, and the turbine bypass valve V5 is kept about 40% open for pressure-holding control. From the initial 6874 s to 7060 s, the compressor speed is lifted from 0 rpm to 12,000 rpm. At this time, P1 is reduced from 7.13 MPa to 6.26 MPa, and m1 is increased to 6 kg/s, meeting the minimum requirements of 2 kg/s for the heater operation. The compressor speed and fuel consumption both increase from 7060 s to 12,740 s. The speed increases from 12,000 rpm to 17,500 rpm, and TIT increases from 27 °C to 212 °C. During this process, P1 increases from 6.26 MPa to 8.82 MPa and from 7.73 MPa to 8.44 MPa, respectively, mainly due to the increase in fuel supply. Since the pressure in the tank tends to exceed the safe pressure limit of the buffer tank, the hand valve at the compressor outlet is used for manually venting twice. After venting, the pressure in the tank decreases in varying degrees, causing the m1 to decrease to a certain extent, maintaining about 5 kg/s in the end.
In phase 2, the compressor speed remains the same at 17,500 rpm, and the heater is restarted to raise the temperature from the relative warm state. Subsequently, CO2 is heated from 145 °C to 309 °C. The heater combustion conditions are different in the meantime, and there are two different ranges in the temperature-rise rate: about 2.98 °C per minute from 14,200 s to 16,460 s and about 0.61 °C per minute from 16,460 s to 21,417 s, respectively. Due to the influence of the temperature rise, P1 increases from 8.05 MPa to 8.45 MPa and from 7.74 MPa to 8.14 MPa, respectively, in the two sections with different temperature-rise rates. To avoid the risk of overpressure in the tank during the startup process, it is also vented once, as in phase 1. It can be seen from the change in P1 and TIT that the heater temperature-rise rate is positively related to the increase in P1. In this phase, m1 is increased from 5 kg/s to 6 kg/s due to the influence of the rising of TIT, and then decreased to 5 kg/s due to the venting. After the heater trips, m1 is mainly affected by the opening of the turbine bypass valve V5. When TIT is cooled to a cold state of 30 °C, P1 is mainly affected by the compressor operation and decreases from 8.14 MPa to 6.20 MPa.
In phase 3, the heater is restarted to raise the temperature from the relative cold state. The cycle startup mode is similar to that in phase 2. The CO2 is heated from 30 °C to 115 °C, and the change rate of TIT is similar to that in phase 1, from 37,725 s to 39,628 s. P1 increases from 6.20 MPa to 7.21 MPa. Due to the lower initial pressure in the tank, the pressure at the compressor inlet is not close to the upper limit, and no emergency venting is carried out. The opening of V5 is increased from 30% to 40%, and m1 is increased from 5 kg/s to 7 kg/s.
In phase 4, after the TIT drops to 32 °C, the compressor speed is gradually reduced in 45,332 s as the system shuts down, and m1 rapidly drops to 0 kg/s as the compressor turns off, followed by venting, and the system pressure is released in 46,346 s.
To sum up, there are three main experimental phenomena, as follows:
- (a)
- The startup scheme of simultaneously heating and speeding up utilized in phase 1 still causes overpressure in the buffer tank and leads to forced evacuation and pressure relief; in the meantime, P1 first drops and then rises under the above startup mode, while, when the temperature rises alone, P1 rises monotonously.
- (b)
- In the same startup mode, a high temperature-rise rate causes P1 to rise more than a low temperature-rise rate does.
- (c)
- When starting from a relatively warmer state, the variation in compressor inlet pressure is obviously less than that from a colder state.
In addition, according to the physical properties of CO2, the pressure–density diagram is drawn in Figure 2b. In phase 1, CO2 at the compressor inlet gradually changes from a gaseous state to a supercritical gas-like state and finally to a supercritical liquid-like state. In phase 2, the compressor’s inlet CO2 is always kept in a supercritical liquid-like state. In phase 3, CO2 at the compressor inlet is always in a gaseous state. It can be seen that, with the increase in system temperature, the compressor’s inlet state gradually approaches the supercritical liquid-like state.
According to the literature [19], the main compressor inlet pressure could be maintained at a reasonable level by co-ordinating the compressor speed and fuel supply, and the wasteful discharging of CO2 would be avoided. Meanwhile, the literature [29] found that the compressor inlet density and pressure could change smoothly when the rotation speed and fuel are increased simultaneously, compared with solely increasing the rotation speed or solely increasing the fuel. However, the experimental results in this work are inconsistent with the above conclusions. Even if the startup scheme of simultaneous heating and speeding-up is adopted in phase 1, overpressure will occur at the compressor inlet, and the experimental system will be forced to vent and relieve the pressure, which will threaten the safety of the buffer tank on the one hand and cause the loss and waste of the circulating CO2 inventory on the other. In addition, different heating rates and speedup rates in the three phases have distinct effects on the compressor inlet pressure under various startup conditions. The above problems have not been effectively evaluated by experiments and simulations to date. Therefore, we hope to explore the co-ordinated relationship between the compressor and heater of the experimental system under diverse conditions through a dynamic simulation and, finally, keep the system working in a safe zone during startup.
3. System Dynamic Modeling
In this work, we use MATLAB programming coupled with the NIST-REFPROP physical property database to build a dynamic simulation model for the sCO2 closed Brayton cycle. The models of the heat exchanger, compressor, turbine, valve, and buffer tank are based on the vendor data, and the connection relationship is based on the interactive characteristics of these components. The reliability of the model is validated by comparing it with experimental data for each component. Figure 3 depicts the system model, in which the system’s connecting pipeline is considered as several buffer volumes on the flow path, and the red line in the figure indicates the high-pressure section and the blue line indicates the low-pressure section. Furthermore, we apply the assumptions for the control volume that its interior conditions are equal to the outlet condition.
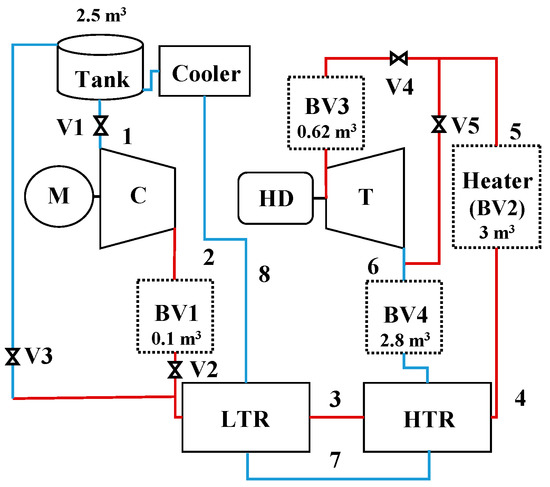
Figure 3.
System model diagram.
3.1. Heat-Exchanger Modeling
The heat-exchanger models include the heater, HTR, LTR, and CL, all of which are based on the conservation of mass and energy to establish a one-dimensional sub-model with variable physical properties for sCO2, as shown in Figure 4. In addition, the model’s assumptions are as follows:
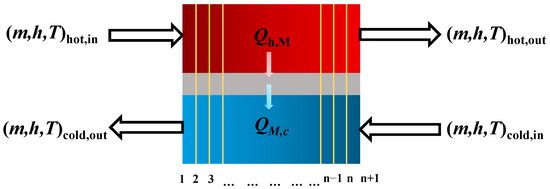
Figure 4.
One-dimensional segmentation model with variable physical properties.
- (1)
- Axial thermal conductivity and ambient heat dissipation are ignored;
- (2)
- The specific heat, density, and thermal conductivity of the metal wall are constants;
- (3)
- There is a fully developed turbulent flow without entrance and exit effects;
- (4)
- There is uniform distribution of flow in each channel.
The HTR and LTR are PCHEs in straight-channel forms, and the CL is of the microtube type. The heater’s internal combustion is not the focus of this study, so it is simplified by a lumped parameter model. The enthalpy-based method is used to calculate the conservation equation of the hot side, the cold side, and the wall in the enthalpy space. The Gnielinski correlation [30] and Petukhov correlation [31] are used for heat transfer and pressure drop on the CO2 side, respectively, and the Chu [32] correlation is used for heat transfer on the water side.
The mass conservation equation is as follows:
The energy conservation equations for the hot side, cold side and the metal wall are as follows:
The pressure drop calculation is as follows:
The calculation convergence criteria are as follows:
After establishing the dynamic model of the heat exchanger, 40 nodes are selected for the HTR and LTR, respectively, and 80 nodes are selected for the CL to capture the nonlinear physical property with sufficient resolution, comprehensively considering the computing time and accuracy. Subsequently, by specifying the same working conditions, we compare our steady-state simulation results with the experimental and simulation data of the recuperator from Clementoni [33], Carstens [34], and Hu [9]. As shown in Table 6, the outlet temperature is used to verify the dynamic model, and the errors are less than two percent, within the allowable range. Furthermore, the dynamic simulation model is verified using the CFD calculation results of Ma’s laminated semicircular channel PCHE [35]. The geometric parameters and inlet conditions in the literature are used as the input values of the dynamic model of the recuperator. According to the Hesselgreaves [36] heat-transfer correlation for a semicircular channel in the entrance region, the temperature response after the hot-side inlet temperature steps down by 40 °C is compared with literature data. Figure 5 depicts the changing trend of outlet temperatures on the hot and cold sides. Both hot- and cold-side simulation data keep within the ±1% error range. It can be seen that the simulation value of the cold-side outlet agrees well with the literature data, and the dynamic change of the hot-side outlet temperature is consistent with the trend of the literature data. The error of the hot-side outlet temperature mainly comes from the 0.5 °C error of the initial value. Therefore, the steady and dynamic performance of the model of the recuperator and cooler in this work are validated in terms of accuracy and reliability. Hence, based on the heat-exchanger model, the HTR, LTR, and CL of the experimental system are modeled to obtain their steady-state temperature distribution under the designed conditions, as shown in Figure 6.
Table 6.
Steady-state validation of the heat-exchanger model.
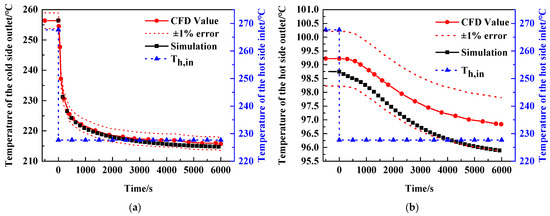
Figure 5.
Dynamic validation of the heat-exchanger model: (a) temperature change at the cold-side outlet; (b) temperature change at the hot-side outlet.
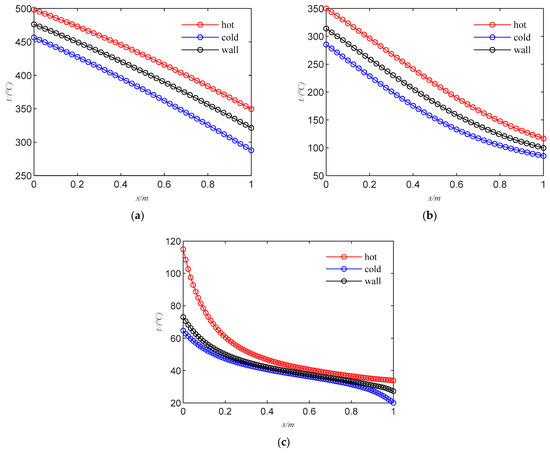
Figure 6.
Steady-state temperature profile inside the heat exchanger under the designed conditions: (a) HTR (nearly linear distribution); (b) LTR (nonlinear distribution); (c) CL (strong nonlinear distribution).
3.2. Turbomachinery Modeling
The dynamic performance of the compressor and turbine significantly affects the transient response of the system, so the accuracy and reliability of their modeling methods are crucial. The response time of the compressor and turbine is much shorter than that of the heat exchanger in the cycle, so the quasi-static model is usually used to model the compressor and turbine. In most of the literature, a two-dimensional, dimensionless performance curve for modeling is used to reduce the calculation time. The modeling methods in the available literature are summarized in Table 7.
Table 7.
Modeling of the turbomachinery in available research.
The flow coefficient and head coefficient are commonly used to model compressor performance. For a sCO2 compressor, the ideal isentropic enthalpy rise and efficiency under different working conditions are determined by varied inlet conditions, inlet flow rates, and rotating speeds. Dyreby [38] found that, in the traditional method, the flow coefficient and the head coefficient are used to nondimensionalize the ideal enthalpy rise and efficiency of the compressor at different speeds and flows without considering the influence of the inlet state deviating from the design condition and having many independent variables, so he developed a new empirical correlation between the flow coefficient and head coefficient and obtained the relationship between the modified head coefficient and the modified flow coefficient with a fourth-order polynomial. The performance chart data were derived from Barber Nichols, and the method is verified by compressor test data under distinct inlet conditions provided by SNL. He believed that the flow through a low-reaction turbine was mainly affected by the inlet conditions, outlet pressure, blade shape, and nozzle design and was less affected by the rotating speed. Therefore, the flow through the turbine was predicted by the fluid inlet density, effective nozzle area, and spouting velocity, and the velocity ratio and efficiency relationship were fitted by a fourth-order polynomial. In this work, we adopt the modeling method of compressors under variable working conditions established by Dyreby. The data come from the experimental test and numerical simulation of the compressor [28], and the compressor model is assumed to be adiabatic and the kinetic energy effect is ignored. The performance map under the designed inlet condition of the compressor is shown in Figure 7. Therefore, the following correction formula is obtained:
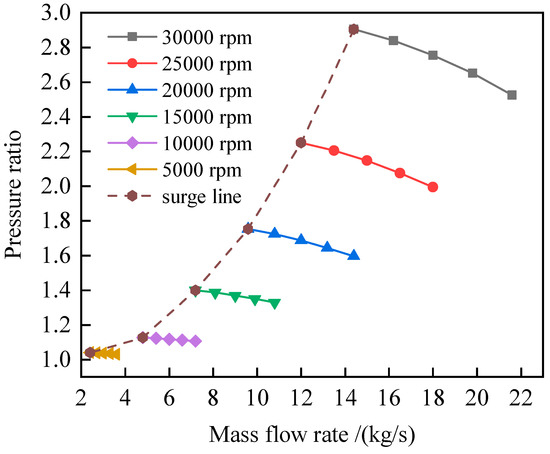
Figure 7.
Compressor performance map (under the designed inlet condition).
3.3. Valve Modeling
The flow equation of the regulating valve is given as:
where CV is the valve flow coefficient, y is the valve opening, is the density of the working fluid, is the reference density, and ΔP is the pressure difference across the valve.
3.4. Buffer-Tank and Buffer-Volume Modeling
In the modeling of the buffer tank and buffer volume, the calculation method of Trinh [39] is adopted for calculating the pressure and temperature in the tank with updated enthalpy and density. The heat loss is not considered here for the buffer tank due to the insulation layer in the experimental system.
3.5. System Model Validation
After the benchmarking of the sub-model, the overall system model has been verified with the experimental transient results. The test data in Figure 2 will not be able to be employed for validation because, on the one hand, the inlet falls into the subcritical zone and enters the two-phase zone, and the physical property function is unable to accurately calculate the relevant physical property; on the other hand, there are multiple venting operations, and the amount of venting cannot be adequately estimated. Hence, the system dynamic model is verified based on the results of the other two experimental tests: the test of increased compressor speed and the test of increased heating power, as shown in Figure 8.
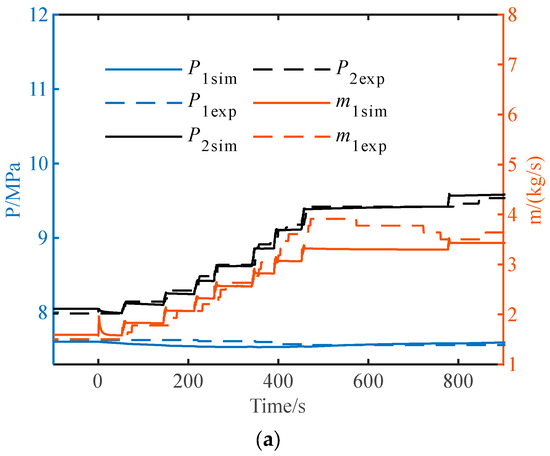
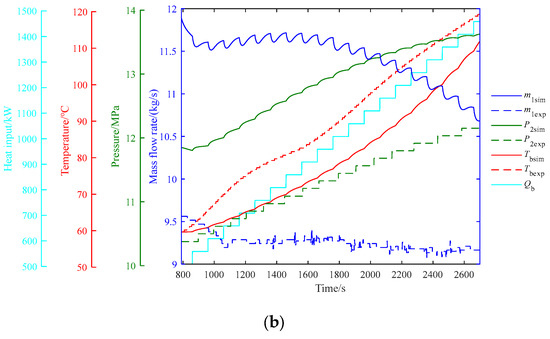
Figure 8.
System model verification: (a) the test of increased compressor speed; (b) the test of increased heating power with constant compressor speed.
It is shown that some of the calculation data deviate from the experimental results to some extent, which can be explained as follows: In the first case, we follow the speed variation of the compressor in the experiment to calculate the transient response, and the error is relatively small, with a maximum error of less than 15%. In the second case, in order to estimate the heating power change, we assumed a 50 kW step variation with a 100 s time interval. The overall trend of each parameter in the second case is consistent with the experimental results, with the error primarily due to the inability to accurately estimate the actual test conditions, which include CO2 leakage, heating power variation, and the flow-rate change of the cooling water. Because temperature control is typically not tight enough and inventory leakage occurs during the experiment, the Compressor Inlet Temperature (CIT) exceeds the setting point of 35 °C, resulting in lower compressor inlet density than the simulation result with the CIT kept at 35 °C. As a result, the simulation values of the mass flow rate m1 and the pressure P2 are greater than the corresponding experimental values. Additionally, the lumped parameter model for the heater also does not evaluate the actual change of the heat resource well, leading to a simulation value of the temperature T1 that is less than the corresponding experimental value. Thus, the system model is validated to a considerable extent.
4. Simulation Result and Discussion
In the following section, we will discuss the simulation results of the dynamic model for the system’s startup from the cold state through different phases. The goal is to assess the impact of various startup methods on the system from the cold state to the pre-start stage of the turbine within the actual limit of components. The process is divided into five phases, as follows:
- (1)
- Phase 1: The speed of the compressor and the heating power are increased at the same time, and the applicability of this method in the initial stage is tested. The speed range of the compressor is between 10,000 rpm and 20,000 rpm. While the heat input of the heater is increased with a variety of linear ramp rates, the compressor speed is elevated with a step variation at different intervals over time.
- (2)
- Phase 2: The compressor speed reaches the upper limit of 20,000 rpm, and then the heating is kept at the same rate of power change. The impact of various buffer tank temperatures and compressor bypass valve openings on the system is analyzed.
- (3)
- Phase 3: The heating rate remains unchanged, and the influence of various CO2 venting conditions and discharge amounts is examined.
- (4)
- Phase 4: The system reaches the target working condition, with a TIT of 250 °C and a compressor speed of 20,000 rpm, and the whole startup process is evaluated.
- (5)
- Phase 5: The system is shut down to the warm-hold condition when there is a temperature gradient in each part of the system, and the effectiveness of the startup scheme of simultaneous heating-up and speeding-up is tested.
4.1. Phase 1
At this stage, the effects of different variations of the compressor speed and heating rates on the density and pressure of the buffer tank are compared. The parameters of different cases are shown in Table 8, and the results are shown in Figure 9. Due to the consideration of compressor safety and the limitation of dry gas sealing performance, the maximum speed of the compressor during startup is 20,000 rpm (less than the rated speed of 30,000 rpm), so the speed increase is 10,000 rpm. After the compressor speed reaches 20,000 rpm, the simulations stop. The temperature of the buffer tank throughout the whole process is maintained at 35 °C under the PID control of the cooling water. Case 1 has the smallest speed change variation, while Case 3 has the highest; Case 4 has the smallest speed increase interval, and Case 5 has the largest heating rate. It can be seen from the results that, under the same heating rate, with the increase of the speed-up variation and the decrease of the speed-up time interval, the overall change in the buffer tank’s density and pressure decrease, but the local disturbances of density and pressure both increase, which is not in favor of a smooth startup at the initial stage. Moreover, under the same speed-up change, a high heating rate causes more significant changes in the buffer tank’s density and pressure than a low heating rate does, which is consistent with the experimental result. In addition, it can be seen from Cases 1 and 5 that when the speed-up change is too small or the heating rate is too high, the heater and compressor do not match to a certain extent, resulting in a rapid increase in density and pressure, which is not beneficial to the stability of the system.
Table 8.
Parameters of different cases in phase 1.
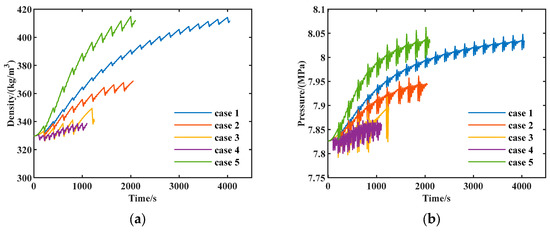
Figure 9.
Comparison of different heating rates and speed-up rates: (a) buffer tank density comparison; (b) buffer tank pressure comparison.
Therefore, the smooth transition of density and pressure in the buffer tank at the initial stage of startup requires a relatively large speed-up variation and a relatively small heating rate, so the range of the speed adjustment that can be used is limited, and the matching relationship between the compressor and heater needs to be thoroughly taken into consideration to co-ordinate the motor power change and the fuel combustion. Hence, considering the balance between the range of parameter changes and the duration of effective control, Case 3 is selected as the baseline for the next phase.
4.2. Phase 2
Due to the limited speed regulation range shown in phase 1, the density and pressure of the buffer tank will inevitably change faster after the speed is increased to 20,000 rpm, which means that the scheme of simultaneous heating and speeding-up can only play a role in restraining the large changes in the parameters of the buffer tank at the initial stage of startup. However, what is more important is how to keep the system startup smooth after losing this mode so as to avoid the parameters exceeding the limit.
As shown in Figure 10, during the next 1000 s, the density and pressure changes of the buffer tank are compared under diverse buffer tank temperatures and compressor bypass valve openings as heating continues. The parameters of different cases are shown in Table 9. Under the condition that the rotating speed of the compressor remains unchanged and the heating rate of the heater continues to increase, the temperature of the buffer tank is controlled to remain at the set value by changing the mass flow rate of the cooling water. When the set temperature is increased to 38 °C in Case 2 and decreased to 33 °C in Case 1, the temperature of the buffer tank at the initial instant is adjusted, which makes the density suddenly increase to 380 kg/m3 and drop to 350 kg/m3 in the initial 300 s, respectively, but it recovers to 370 kg/m3 in 300 s and then keeps the same slope change with the baseline. As for the pressure, the pressure in Case 2 rises rapidly to 8.33 MPa, and the pressure in Case 1 drops rapidly to 7.53 MPa in the initial 300 s. After 300 s, all cases show a stable change. It can be seen that the pressure in the buffer tank during startup is strongly related to the temperature; i.e., the temperature change directly leads to the pressure change. In terms of the temperature change in the buffer tank, it has no significant impact on the overall density change, and the opening of the compressor bypass valve has not either, but it would reduce the fluctuation of the density and pressure. As a result, the temperature in the tank can be appropriately altered during system startup to lower the pressure in the tank and prevent it from getting too high. In other words, the overpressure risk in the tank during the preceding experiment was caused by losing temperature control.
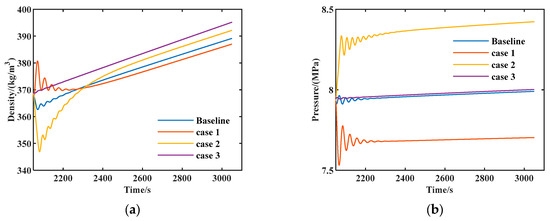
Figure 10.
Comparison of various control temperatures and valve openings: (a) buffer tank density comparison; (b) buffer tank pressure comparison.
Table 9.
Parameters of different cases in phase 2.
4.3. Phase 3
The density in the buffer tank keeps rising with the continuous heating of phases 1 and 2. First, there is no storage tank for the experimental system to manage its working fluid inventory. Second, as the system moves from a cold to a hot state, the hot section becomes thinner and the cold section becomes denser. Therefore, the system’s total demand for CO2 is reduced, and the rest of the inventory accumulates in the buffer tank, causing its density to increase. Therefore, it is necessary to discharge the working medium to lower the tank’s density and maintain proper pressure at the compressor inlet. In off-design condition control, inventory control is typically an efficient method for realizing CO2 mass management. Carstens [34] proposed a method that uses inventory control coupled with low temperature control. First, the inlet temperature of the compressor was raised to a range where the density was relatively insensitive to pressure changes. It was believed that 34 °C was the best inlet temperature before the introduction of inventory control, and the cycle net efficiency was 39% at 50% load as a result. During the simulation, the CIT is kept at 35 °C, which is not in the temperature range that needed to be adjusted, so the venting operation is conducted directly. In phase 3, we compare the impact of diverse venting conditions and emission mass, with the results shown in Figure 11 and the comparison of cases shown in Table 10. Since the surge margin in the initial process is less than 10 percent, the opening of the compressor bypass valve is first raised to 50 percent in advance to prevent the compressor from surging during the venting process.
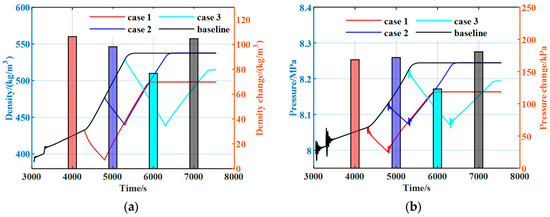
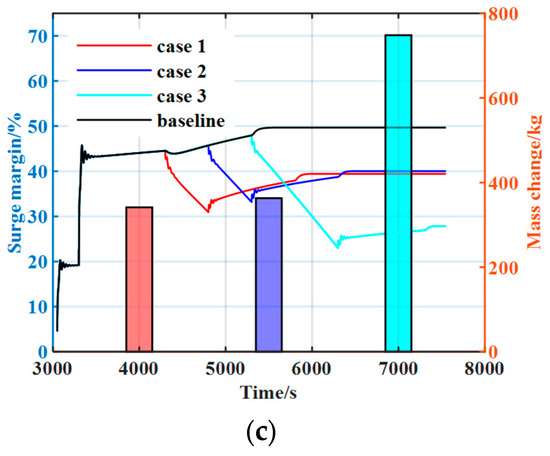
Figure 11.
Comparison of CO2 venting conditions and discharge amount: (a) buffer tank density comparison; (b) buffer tank pressure comparison; (c) system mass change and compressor surge margin change.
Table 10.
Parameters of different cases in phase 3.
The baseline condition is one in which there is no venting in the entire process. The venting time in Case 2 is the same as that in Case 1, and the temperature continues to rise after the venting. The density change in Case 2 is 98 kg/m3, which is less than 106 kg/m3 in Case 1, while the pressure change in Case 2 is 172 kPa, which is greater than 168 kPa in Case 1. Compared with Cases 1, 2, and baseline, as the system continues to rise in temperature after the same venting time under various venting conditions, a small pressure change in the tank causes a greater density change. This is because the CO2 in the buffer tank is in the region near the pseudocritical line of the pressure–density diagram at the end of venting, such as in Figure 3. Cich [24] found that the loop required mass can vary by three times when loop filling from 6.9 MPa to 8.3 MPa with a constant temperature, which agrees with the above simulation conclusion. The venting time of Case 3 is twice as long as that of Cases 1 and 2. At the same time, the density of the venting condition in Case 3 is the highest, and the density in the buffer tank in Case 3 is close to that of Case 2 at the end of the venting. However, as the temperature continues to rise, the density and pressure changes in Case 3 are 77 kg/m3 and 123 kPa, respectively, which are significantly less than those of Case 1 and Case 2. This is due to the fact that Case 3 has the largest venting mass and the smallest system circulation flow; additionally, the same amount of heat from the heater is absorbed with a small flow, and the whole system is heat-soaked to promote further heat transfer from the recuperator. Cich [24] also recommended maintaining a constant small flow when the combustion temperature of the heater rose in the Sunshot experiment. Therefore, the overall system was heat-soaked, especially the recuperator and pipes. However, if a large flow rate was maintained, too much heat would be taken away.
To summarize, Case 3 should be chosen to stabilize the buffer tank’s parameter changes because venting in the high-density region lasts relatively long to promote the heat utilization of the system and is relatively far away from the pseudocritical region, as opposed to Cases 1 and 2. At the same time, as shown in Figure 11c, Case 3 is also limited by the reduction of the surge margin. The surge margin of Cases 1 and 2 is reduced to nearly 30% at the end of the venting, while the surge margin of Case 3 is close to 20%, which means that the increase in venting is at the expense of the surge margin. In addition, the component-interacted relationship of a closed cycle and the special thermal properties of a near-critical work zone cause oscillatory behavior for the pressure in the buffer tank at the start of venting or at the beginning of a continued temperature rise.
4.4. Phase 4
At this phase, the heater’s heating continues, and the TIT is finally raised to 261 °C, which is close to the target working condition. The changes in system parameters during the entire process are shown in Figure 12. For Figure 12a, there are two heating rates of 6 kW/min and 24 kW/min in the whole process. In the early 2000 s, the heating supply and compressor acceleration occur at the same time. In this stage, the heating is kept at a small rate to stabilize the temperature and density changes of all parts of the system from the cold state, so the system can smoothly complete the initial conversion and the warm-up process. When the temperature continues to rise to 3000 s, we gradually increase the opening of the compressor bypass valve to 50% to expand the surge margin and co-ordinate with the system to enter the next stage. After 4300 s, we apply a large heating rate to speed up the heat exchange of each part. At 5000 s, as the density in the buffer tank increases to nearly 550 kg/m3, the first venting is conducted for 1000 s, with 749 kg of CO2 discharged, while the heating rate remains unchanged at this stage. During the first venting, the recuperator of the system can become heat-soaked due to the reduction of circulating flow. For Figure 12b, the positive heat regenerative effect is starting to be established in the recuperators. The TIT continues to rise to 150 °C at a rapid rate after the first venting. At this stage, the temperature gradient of each part of the system increases. After that, the second venting lasts 500 s, as the final CO2 storage in the system is 2065 kg. Then, it continues to rise to the target working condition at a high heating rate, and the temperature gradient of each part of the system is significantly alleviated, the temperature distribution of each part tends to be uniform, and the final heating power is 1430 kW. During the whole startup process, the temperature of the buffer tank is maintained at 35 °C, the pressure of the buffer tank is not close to the safe limit, and the compressor also does not cross the surge line.
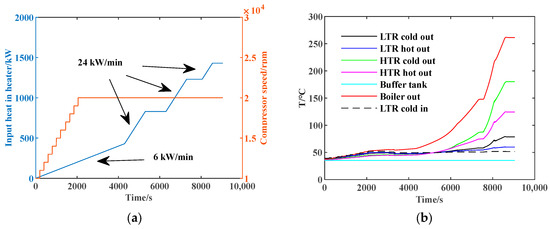
Figure 12.
Change of system parameters during the process of startup from a cold state to the target working condition: (a) changes in heating rate and speed; (b) system temperature change; (c) system mass flow change; (d) variation of system CO2 mass.
In conclusion, the startup scheme of simultaneous heating and speeding-up is only effective at the initial stage of system startup. As the heating rate increases, the effect of speed on density compensation and stability is gradually weakened. Therefore, it is more important to control the density and pressure of the buffer tank after losing the speed control range. We deal with this issue by venting twice. At the same time, it is observed that the first promotes the establishment of the heat regenerative effect, and the second improves the uniformity of the temperature distribution in each part. However, the twice-venting is large in amount, resulting in a waste of the working medium, and the discharge is also limited by the compressor surge margin. Therefore, if the system starts with a suitable initial fill mass, it may reduce the working-medium venting, make better use of the heating capacity, and slow down the parameter change.
4.5. Phase 5
In this phase, the system is cooled down to 159 °C from the target working condition in phase 4, and the compressor slows down to 13,000 rpm. There is still a temperature gradient in the system’s heat exchanger at this time. In the relatively warmer state, the applicability of the startup scheme of simultaneous heating and speeding-up is tested. The case parameters are shown in Table 11. The baseline is the same as Case 3 in phase 1. The heating rate change in Cases 1 and 2 is two and four times that of the baseline, respectively, while the heating rate change in Case 3 is the same as that in Case 2, but the speed change interval is increased to 300 s.
Table 11.
Parameters of different cases in phase 5.
The results are shown in Figure 13. In the base line and Case 1, the pressure and density in the buffer tank gradually decrease, Case 2 basically remains stable, and Case 3 gradually increases, while Case 3 has the largest speed-up interval and speed control range. Only Case 3 can be restarted to the target working condition within the speed regulation range of the compressor, and the density change in the buffer tank is more stable than phase 4 as well, and this result is consistent with the experiment data. An interesting finding is that, when the system starts from a cold state, the influence of an increased heating rate dominates the variation in the density and pressure of the buffer tank, but when the system starts from a warm state, the influence of an increased compressor speed dominates, with the same variation in heating rate and speed. This can be explained by the influence of the differences in system states, including compressor performance and the system’s heat regeneration. It is important to note that the tank’s outlet condition change is affected by the operation performance of the compressor, and the tank’s inlet condition change is affected by the system’s heat regeneration. Hence, the variation in the compressor mass flow rate is larger under the same speed variation due to a higher density in the warm state. The tank’s inlet enthalpy, additionally, decreases during a warm hold state when the heat regeneration is built up in the system, rather than increasing as it does in a cold state, thus alleviating the influence of increasing heat supply during the system startup. Therefore, the control range of the compressor speed increases, so the startup scheme of simultaneously heating and speeding up can maintain the smooth change of the parameters in the buffer tank over a wider range of startup from the warm state. Consequently, this approach is more suited for use when the temperature gradient is maintained across the entire system.
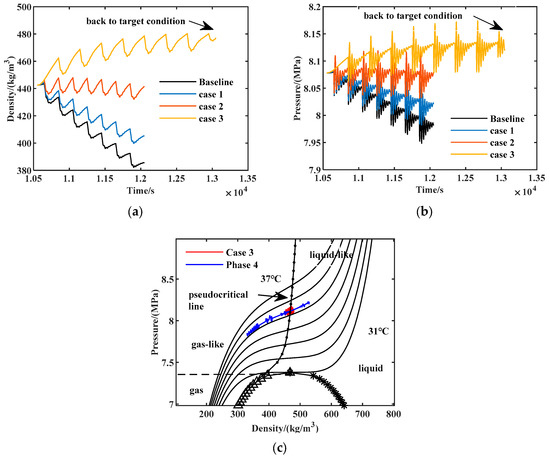
Figure 13.
Comparison of various heating rates and speed-up rates when the system restarts from a warm state: (a) buffer tank density comparison; (b) buffer tank pressure comparison; (c) buffer tank pressure–density diagram.
5. Conclusions
A compressor–heater joint startup test is performed on the MWe-scale sCO2 experimental system. Pressure variation in the buffer tank cannot be kept within the experiment’s safe operating zone by the startup scheme of simultaneously heating and speeding up. Therefore, the matching relationship between the speeding-up rate and the heating rate under various conditions is investigated, and the startup scheme is optimized by means of a dynamic simulation, from which the following conclusions can be drawn:
- (a)
- During the experiment of system startup under the two schemes, i.e., simultaneous heating and speeding-up and heating with a constant speed, the maximum TIT and compressor speed reach 309 °C and 17,500 rpm, respectively, and the compressor inlet state changes from a gaseous state to a supercritical state during the test, while venting is conducted in all startup phases due to the risk of overpressure in the buffer tank.
- (b)
- By simulating the system’s transition from a cold state to the desired operating condition with the TIT of 250 °C and the compressor speed of 20,000 rpm, the transition stage within the practical constraints of the components is completed smoothly, and 60% of the rated mass flow rate and 67% of the rated compressor speed are reached at last. The system has experienced two venting operations: the first helps the system build up heat regeneration, while the second reduces the temperature gradient and improves the temperature uniformity, and the system’s final mass under target conditions is 2065 kg. Additionally, the buffer tank’s temperature variation significantly affects the tank’s pressure change, but it has less impact on the density changes. Therefore, temperature control is one of the key measures to avoid the occurrence of overpressure in the buffer tank during startup.
- (c)
- During the simulation, when the startup scheme of simultaneously heating and speeding up is utilized from a warm state with a maximum temperature of 159 °C and a compressor speed of 13,000 rpm and the temperature gradient is kept in the system, it is more effective at slowing down the pressure and density changes in the buffer tank and has a wider control range.
Author Contributions
Conceptualization, S.Q.; software, S.Q.; validation, S.Q.; writing—original draft preparation, S.Q.; funding acquisition, S.L.; supervision, S.L.; writing—review and editing, S.L. and Z.L.; resources, Y.Z. and X.G.; data curation, J.J. and Z.S. All authors have read and agreed to the published version of the manuscript.
Funding
This research was funded by the National Natural Science Foundation of China (Young Scientistic Program) (52106279); Special project of clean energy leading science and technology, Chinese Academy of Sciences (Grant No. XDA21010201); National Natural Science Foundation of China (NSFC) project (Grant No. 52076206); Lianyungang Science & Technology project (CX2211); and CAS Project for Young Scientists in Basic Research (Grant No. YSBR-043).
Institutional Review Board Statement
Not applicable.
Informed Consent Statement
Informed consent was obtained from all subjects involved in the study.
Data Availability Statement
Not applicable.
Conflicts of Interest
The authors declare no conflict of interest.
Nomenclature
| sCO2 | supercritical carbon dioxide |
| PCHE | Printed Circuit Heat Exchanger |
| DCS | Distributed Control System |
| MCT | Micro-tube |
| TIT | Turbine Inlet Temperature, °C |
| CIT | Compressor Inlet Temperature, °C |
| T–C | Turbine–Compressor |
| LTR | Low-temperature recuperator |
| HTR | High-temperature recuperator |
| CL | Cooler |
| HD | Hydraulic dynamometer |
| n | Rotational speed, rpm |
| m1 | Compressor inlet mass flow rate, kg/s |
| P1 | Compressor inlet pressure, MPa |
| P2 | Compressor outlet pressure, MPa |
| T1 | Compressor inlet temperature, °C |
| ρ | Density, kg/m3 |
| f | Friction coefficient |
| ϕ | Flow coefficient |
| φ | Head coefficient |
References
- Ahn, Y.; Bae, S.J.; Kim, M.; Cho, S.K.; Baik, S.; Lee, J.I.; Cha, J.E. Review of Supercritical CO2 Power Cycle Technology and Current Status of Research and Development. Nucl. Eng. Technol. 2015, 47, 647–661. [Google Scholar] [CrossRef]
- Díaz-Reinoso, B.; Moure, A.; Domínguez, H.; Parajó, J.C. Supercritical CO2 Extraction and Purification of Compounds with Antioxidant Activity. J. Agric. Food Chem. 2006, 54, 2441–2469. [Google Scholar] [CrossRef]
- Zeyghami, M.; Khalili, F. Performance Improvement of Dry Cooled Advanced Concentrating Solar Power Plants Using Daytime Radiative Cooling. Energy Convers. Manag. 2015, 106, 10–20. [Google Scholar] [CrossRef]
- Dostal, V.; Driscoll, M.J.; Hejzlar, P. A Supercritical Carbon Dioxide Cycle for next Generation Nuclear Reactors. Ph.D. Thesis, Massachusetts Institute of Technology, Cambridge, MA, USA, 2004. [Google Scholar]
- Sakalis, G.N. Design and Partial Load Operation Optimization of Integrated Ship Energy System Based on Supercritical CO2 Waste Heat Recovery Cycle. Sustain. Energy Technol. Assess. 2022, 51, 101965. [Google Scholar] [CrossRef]
- Song, J.; Li, X.; Ren, X.; Gu, C. Performance Improvement of a Preheating Supercritical CO2 (S-CO2) Cycle Based System for Engine Waste Heat Recovery. Energy Convers. Manag. 2018, 161, 225–233. [Google Scholar] [CrossRef]
- Xu, J.; Sun, E.; Li, M.; Liu, H.; Zhu, B. Key Issues and Solution Strategies for Supercritical Carbon Dioxide Coal Fired Power Plant. Energy 2018, 157, 227–246. [Google Scholar] [CrossRef]
- Wang, R.; Wang, X.; Shu, G.; Tian, H.; Cai, J.; Bian, X.; Li, X.; Qin, Z.; Shi, L. Comparison of Different Load-Following Control Strategies of a sCO2 Brayton Cycle under Full Load Range. Energy 2022, 246, 123378. [Google Scholar] [CrossRef]
- Hu, H.; Guo, C.; Cai, H.; Jiang, Y.; Liang, S.; Guo, Y. Dynamic Characteristics of the Recuperator Thermal Performance in a S–CO2 Brayton Cycle. Energy 2021, 214, 119017. [Google Scholar] [CrossRef]
- Talesh Bahrami, H.R.; Aminian, E.; Saffari, H. Energy Transfer Enhancement inside an Annulus Using Gradient Porous Ribs and Nanofluids. J. Energy Resour. Technol. 2020, 142, 122102. [Google Scholar] [CrossRef]
- Aminian, E.; Saffari, H. Experimental Analysis of Dropwise Condensation Heat Transfer on a Finned Tube: Impact of Pitch Size. Proc. Inst. Mech. Eng. Part A J. Power Energy 2022, 236, 752–759. [Google Scholar] [CrossRef]
- Min, L.; Liu, M.; Xi, D.; He, M.; Liu, X.; Huang, Y. Study of Supercritical CO2 Physical Property Calculation Models. Front. Energy Res. 2022, 10, 835311. [Google Scholar] [CrossRef]
- Barik, D.; Saeed, M.A.; Ramachandran, T. Experimental and Computational Analysis of Aluminum-Coated Dimple and Plain Tubes in Solar Water Heater System. Energies 2022, 16, 295. [Google Scholar] [CrossRef]
- Marchionni, M.; Usman, M.; Chai, L.; Tassou, S.A. Inventory Control Assessment for Small Scale SCO2 Heat to Power Conversion Systems. Energy 2023, 267, 126537. [Google Scholar] [CrossRef]
- Deng, T.; Li, X.; Wang, Q.; Ma, T. Dynamic Modelling and Transient Characteristics of Supercritical CO2 Recompression Brayton Cycle. Energy 2019, 180, 292–302. [Google Scholar] [CrossRef]
- Liese, E.; Albright, J.; Zitney, S.A. Startup, Shutdown, and Load-Following Simulations of a 10 MWe Supercritical CO2 Recompression Closed Brayton Cycle. Appl. Energy 2020, 277, 115628. [Google Scholar] [CrossRef]
- Luu, M.T.; Milani, D.; McNaughton, R.; Abbas, A. Dynamic Modelling and Start-up Operation of a Solar-Assisted Recompression Supercritical CO2 Brayton Power Cycle. Appl. Energy 2017, 199, 247–263. [Google Scholar] [CrossRef]
- Marchionni, M.; Chai, L.; Bianchi, G.; Tassou, S.A. Numerical Modelling and Transient Analysis of a Printed Circuit Heat Exchanger Used as Recuperator for Supercritical CO2 Heat to Power Conversion Systems. Appl. Therm. Eng. 2019, 161, 114190. [Google Scholar] [CrossRef]
- Wang, X.; Cai, J.; Lin, Z.; Tian, H.; Shu, G.; Wang, R.; Bian, X.; Shi, L. Dynamic Simulation Study of the Start-up and Shutdown Processes for a Recompression CO2 Brayton Cycle. Energy 2022, 259, 124928. [Google Scholar] [CrossRef]
- Herrera, M.H. Dynamic Modeling for the 10 MWe sCO2 Test Facility Program. In Proceedings of the 7th International Supercritical CO2 Power Cycles Symposium, San Antonio, TX, USA, 21–24 February 2022. [Google Scholar]
- Wright, S.A.; Conboy, T.M.; Rochau, G.E. Break-Even Power Transients for Two Simple Recuperated S-CO2 Brayton Cycle Test Configurations; Sandia National Laboratories (SNL-NM): Albuquerque, NM, USA, 2011. [Google Scholar]
- Conboy, T.; Pasch, J.; Fleming, D. Control of a Supercritical CO2 Recompression Brayton Cycle Demonstration Loop. J. Eng. Gas Turbines Power 2013, 135, 111701. [Google Scholar] [CrossRef]
- Clementoni, E.M.; Cox, T.L.; Sprague, C.P. Startup and Operation of a Supercritical Carbon Dioxide Brayton Cycle. J. Eng. Gas Turbines Power 2014, 136, 071701. [Google Scholar] [CrossRef]
- Cich, S.D.; Moore, J.J.; Day Towler, M.; Mortzheim, J.; Hofer, D. Loop Filling and Start up with a Closed Loop sCO2 Brayton Cycle. In Turbo Expo: Power for Land, Sea, and Air; American Society of Mechanical Engineers: Phoenix, AZ, USA, 2019; Volume 58721, p. V009T38A006. [Google Scholar]
- Cich, S.D.; Moore, J.J.; Towler, M.D.; Mortzheim, J. Loop Transient Performance with a Closed Loop sCO2 Brayton Cycle. In Turbo Expo: Power for Land, Sea, and Air; American Society of Mechanical Engineers: Charlotte, NC, USA, 2021; Volume 85048, p. V010T30A003. [Google Scholar]
- Smith, J. Supercritical CO2 Controls Strategies for a Fixed-Speed Recompression Closed Brayton Cycle. In Proceedings of the 7th International Supercritical CO2 Power Cycles Symposium, San Antonio, TX, USA, 21–24 February 2022. [Google Scholar]
- Hu, H.; Liang, S.; Jiang, Y.; Guo, C.; Guo, Y.; Zhu, Y.; Cai, H. Thermodynamic and Exergy Analysis of 2 MW S-CO2 Brayton Cycle under Full/Partial Load Operating Conditions. Energy Convers. Manag. 2020, 211, 112786. [Google Scholar] [CrossRef]
- Zhu, Y.; Jiang, Y.; Liang, S. Experimental research progress of supercritical carbon dioxide Brayton cycle compressor. Therm. Power Gener. 2020, 49, 11–20. [Google Scholar]
- Wang, R.; Li, X.; Qin, Z.; Cai, J.; Bian, X.; Wang, X.; Tian, H.; Shu, G. Control Strategy for Actual Constraints during the Start–Stop Process of a Supercritical CO2 Brayton Cycle. Appl. Therm. Eng. 2023, 226, 120289. [Google Scholar] [CrossRef]
- Gnielinski, V. New Equations for Heat and Mass Transfer in Turbulent Pipe and Channel Flow. Int. Chem. Eng. 1976, 16, 359–368. [Google Scholar]
- Petukhov, B.S. Heat Transfer and Friction in Turbulent Pipe Flow with Variable Physical Properties. In Advances in Heat Transfer; Elsevier: Amsterdam, The Netherlands, 1970; Volume 6, pp. 503–564. [Google Scholar]
- Chu, W.; Li, X.; Ma, T.; Chen, Y.; Wang, Q. Experimental Investigation on SCO2-Water Heat Transfer Characteristics in a Printed Circuit Heat Exchanger with Straight Channels. Int. J. Heat Mass Transf. 2017, 113, 184–194. [Google Scholar] [CrossRef]
- Clementoni, E.M.; Cox, T.L.; King, M.A. Response of a Compact Recuperator to Thermal Transients in a Supercritical Carbon Dioxide Brayton Cycle. In Turbo Expo: Power for Land, Sea, and Air; American Society of Mechanical Engineers: Charlotte, NC, USA, 2017; Volume 50961, p. V009T38A002. [Google Scholar]
- Carstens, N. Control Strategies for Supercritical Carbon Dioxide Power Conversion Systems. Ph.D. Thesis, Massachusetts Institute of Technology, Cambridge, MA, USA, 2007. [Google Scholar]
- Ma, T.; Li, M.-J.; Xu, J.-L.; Cao, F. Thermodynamic Analysis and Performance Prediction on Dynamic Response Characteristic of PCHE in 1000 MW S-CO2 Coal Fired Power Plant. Energy 2019, 175, 123–138. [Google Scholar] [CrossRef]
- Hesselgreaves, J.E.; Law, R.; Reay, D. Compact Heat Exchangers: Selection, Design and Operation; Elsevier Science: Oxford, UK, 2001. [Google Scholar]
- Olumayegun, O.; Wang, M. Dynamic Modelling and Control of Supercritical CO2 Power Cycle Using Waste Heat from Industrial Processes. Fuel 2019, 249, 89–102. [Google Scholar] [CrossRef]
- Dyreby, J.; Klein, S.; Nellis, G.; Reindl, D. Design Considerations for Supercritical Carbon Dioxide Brayton Cycles with Recompression. J. Eng. Gas Turbines Power 2014, 136, 101701. [Google Scholar] [CrossRef]
- Trinh, T.Q. Dynamic Response of the Supercritical CO2 Brayton Recompression Cycle to Various System Transients. Ph.D. Thesis, Massachusetts Institute of Technology, Cambridge, MA, USA, 2009. [Google Scholar]
- Wright, S.A.; Davidson, C.S.; Husa, C. Off-Design Performance Modeling Results for a Supercritical CO2 Waste Heat Recovery Power System. In Proceedings of the 6th International Supercritical CO2 Power Cycles Symposium, Pittsburgh, PA, USA, 27–29 March 2018. [Google Scholar]
Disclaimer/Publisher’s Note: The statements, opinions and data contained in all publications are solely those of the individual author(s) and contributor(s) and not of MDPI and/or the editor(s). MDPI and/or the editor(s) disclaim responsibility for any injury to people or property resulting from any ideas, methods, instructions or products referred to in the content. |
© 2023 by the authors. Licensee MDPI, Basel, Switzerland. This article is an open access article distributed under the terms and conditions of the Creative Commons Attribution (CC BY) license (https://creativecommons.org/licenses/by/4.0/).