Article

Study on Interface Mechanical Properties of Graphene/Copper Matrix Composites

College of Science, Xi’an University of Architecture and Technology, Xi’an 710055, China
*
Author to whom correspondence should be addressed.
Appl. Sci. 2023, 13(6), 3559; https://doi.org/10.3390/app13063559
Submission received: 19 February 2023 / Revised: 8 March 2023 / Accepted: 8 March 2023 / Published: 10 March 2023

Abstract

:
Graphene/copper matrix composites have a wide range of application prospects, but the mechanical properties of the interface have been one of the key problems restricting their wide application. In this paper, the mechanical behaviors at the interface of graphene/copper matrix composites, such as pulling up, pulling out, and cohesion, and the effects of temperature and graphene content on them were studied by the molecular dynamics method. The results show that the pull-up force and cohesiveness show two stages in the whole process. The pulling force increases rapidly and then decreases to 0 slowly. The pull-out force shows three stages: it rises rapidly at first, then fluctuates continuously, and finally drops to 0. The mechanical properties of the interface deteriorated with the increase in temperature. When the temperature increased from 0 K to 1100 K, the interface normal strength, shear strength, and cohesion strength of the interface decreased by 26.3%, 32.9%, and 24.8%, respectively. In addition, with the increase in graphene content, the normal strength of the interface increases, the shear strength decreases, and the cohesion strength almost stays the same. When the graphene content increases from 6.71 at% to 11.75 at%, the normal strength increases by 6.8%, while the shear strength decreases by 37.4%. The influence mechanism of temperature and content is explained from the aspects of the influence of atomic thermal motion and the hindering effect of graphene on the dislocation motion of the copper matrix. The relevant results have certain reference values for the engineering application and theoretical research of graphene/copper composites.

1. Introduction

With its excellent thermal and electrical properties, copper has been widely used in communication engineering [1], mechanical manufacturing [2], and electronic devices [3]. However, with the improvement of actual production requirements, such problems as insufficient strength and poor frictional performance have gradually become prominent [4,5]. Introducing other reinforcing phases into the copper matrix to prepare copper matrix composites is a feasible strategy to solve these problems [6].
Graphene is a kind of sp2 hybrid-connected carbon atoms tightly packed into a single two-dimensional honeycomb material with excellent mechanical and electrical properties, elastic modulus and tensile strength up to 1.1 TPa and 125 GPa [7,8,9,10], and a resistivity of 10−6 Ω·cm [11,12]. The preparation of composite materials using graphene as a reinforcement system can not only retain the excellent properties of graphene and the matrix itself, but also effectively improve the material defects and improve the properties of composite materials [13,14]. In recent years, it has become an ideal reinforcement for strengthening metal materials such as copper. Hwang et al. [15] dispersed the RGO sheets evenly in the copper matrix through a molecular-level mixing process. The agglomeration of RGO was effectively prevented, and the adhesion between RGO and Cu was improved. The results showed that the performance of the composite was greatly improved, and the yield strength of 2.5 vol% RGO/Cu nanocomposite was 1.8 times that of pure cooper. Hua et al. [16,17] systematically studied the shear and frictional properties of graphene/copper matrix composites by molecular dynamics method. The results showed that the shear strength of the composites increased with the increase in the volume fraction of graphene. In addition, the size of the defect diameter in graphene also has a direct effect on the strength of the composite. In terms of frictional properties, graphene can improve the surface morphology of materials, making the surface smoother, and reducing the friction coefficient of 64.4–72.9% under different pressing depths. Zhang et al. [18] revealed the self-lubricating behavior and friction process inside the composite materials through the molecular dynamics method. Van der Waals gap will be formed between the matrix and graphene sheets, which will reduce the sliding resistance and show the effect of lubrication. Bian [19] simulated the friction behavior of silicon needle on the surface of bare copper- and graphene-coated composites using molecular dynamics method, and concluded that the friction behavior mainly occurred between silicon needle and graphene film. Shi et al. [20] has theoretically studied the bonding, stripping, and folding behavior of graphene on different surfaces of single-crystal copper. The results show that the number of graphene layers on the copper surface can be distinguished by a simple spelling test. Further studies of graphene folding/unfolding on Cu surfaces have shown that Cu(111) is beneficial for monolayer graphene growth. Other researchers [21,22] have also prepared graphene/copper matrix composites through different methods, and the results all show that graphene can enhance the mechanical properties of the composites to varying degrees, such as compressive strength and hardness.
Although there have been many studies on graphene/copper composites, there are still many problems in the interface properties, such as the influence of extreme environments such as high temperature and high loading rates on the mechanical properties of the interface. In this paper, the pull-out, pull-out, and cohesion of graphene/copper composites were studied by the molecular dynamics method. The effects of temperature and graphene content on the mechanical properties of the interface were analyzed, and the strengthening mechanism was studied and discussed.

2. Calculation Model and Method

2.1. Computational Model

In order to study the normal, tangential, and cohesion properties of the interface of graphene/copper composites, pull-out, pull-out, and cohesion simulation models were established according to the literature [23], as shown in Figure 1a–c. The red region is the copper matrix and the blue region is the graphene in the figure. The size of the pull-out and pull-out simulation model was 5.0 nm × 5.0 nm × 4.2 nm, and contained 8578 atoms. The cohesive force model was 5.0 nm × 5.0 nm × 3.0 nm and contained 4793 atoms.
For the pull-up model (Figure 1a) that studies the normal properties of the interface, periodic boundary conditions are applied in the X and Y directions, and free boundary conditions are applied in the Z direction. During the simulation, 3 layers of copper atoms at the upper and lower ends were fixed, and the energy minimization and relaxation were carried out under the NVT system. After the system was stabilized, the upper fixed layer atoms were pulled up along the Z direction at the speed of 0.1 Å/ps until the graphene–copper interface was separated and damaged, and then the graphene content was changed to study the effect of graphene content on mechanical properties.
For the pull-out model (Figure 1b) that studies the tangential performance of the interface, periodic boundary conditions are applied in the Y and Z directions, while free boundary conditions are applied in the X direction. During the simulation, 3 layers of copper atoms at the upper and lower ends were also fixed, and the energy minimization and relaxation were carried out under the NVT system. After the system was stabilized, the graphene was pulled out along the X direction at the rate of 0.1 Å/ps until it was completely pulled out from the copper matrix. Then, the simulation process was repeated by changing the graphene content and studying the influence of the graphene content on the interfacial shear properties.
Rigid separation simulation (Figure 1c) was used to study the interface cohesion properties of composite materials. The lower copper atoms were fixed, and energy minimization and relaxation were carried out under the NVT system. The effect of graphene content on properties was studied.
In order to avoid the errors caused by the initial stress and dislocation caused by the unreasonable setting of model parameters, the corresponding simulation box size of the model in this paper is an integer multiple of the diameter of the composite atom, and the insertion position of graphene is an integer multiple of the copper lattice constant (0.3607 nm) [24].
Among them, the size of the perfect graphene sheet is 5.0 nm × 5.0 nm, and the anisotropy indices are [100], [010], and [001] in the XYZ direction. Among them, the size of the perfect graphene sheet is 5.0 nm × 5.0 nm, and the anisotropy indices are [100], [010], and [001] in the XYZ direction.

2.2. Calculation Method

In this paper, molecular dynamics software (Lammps) [25] was used for simulation calculation, and the calculation results were post-processed by Ovito [26].
In the model, the EAM potential [27] is used between Cu-Cu atoms, which has been proven to be a suitable description of the interaction between metal atoms. The equation of its potential function is as follows:
E E A M = i F ( ρ i ) + 1 2 i j ( i j ) ϕ i j ( r i j ) ρ i = i j f ( r i j )
where rij represents the distance between atom i and atom j, F is the embedding energy, is the electron density, and is the pair potential between atoms.
C-Cu interatomic L-J potential [28] is adopted, and its specific expression is as follows:
E L J = 4 ε [ ( σ r ) 12 ( σ r ) 6 ]
where ε is the energy scale parameter, take 0.019996 eV, σ is zero potential distance, take 0.3225 nm [24].
The potential function used between C-C atoms is AIREBO potential [29], which is the best and most widely used potential function to express C-C interaction in graphene and GO at present. Its specific expression is as follows:
E = 1 2 i j i [ E i j R E B O + E i j L J + k i , j l i , j , k E k i j l T O R S I O N ] E i j R E B O = i j ( > i ) [ V R ( r i j ) b i j V A ( r i j ) ] E i j L J = 4 ε i j [ ( σ i j r i j ) 12 ( σ i j r i j ) 6 ]
where rij represents the distance between atom i and atom j, VR(r)represents the repulsion between two atoms, and bij is a bond order function that mainly reflects covalent bonding between atoms. VA(r) represents the attraction between two atoms, σ is zero potential distance, ε is the energy scale parameter.

2.3. Model and Method Verification

In order to verify the correctness of the above model and method, referring to the existing studies [30,31], The model of pure copper (2.8952 nm × 2.8952 nm × 7.238 nm) and graphene/copper composite (6.506 nm × 5.061 nm × 5.061 nm) with the same size as the literature was established and the molecular dynamics simulation was carried out under the same conditions. Subsequently, the results of the simulation were plotted as tensile stress–strain curves, as shown in Figure 2.
According to the curve shown in Figure 2, the curve in the straight line stage in the image is fitted, and the ultimate strain and elastic modulus of the pure copper and composite materials of the corresponding size are obtained and summarized with the literature data in Table 1.
In order to ensure the accuracy of the model and simulation methods, in addition to keeping the model size and simulation conditions consistent with those in the literature, this section also simulated the mechanical properties of pure copper and graphene/copper matrix composites, respectively. As can be seen from Figure 1 and Table 1, the mechanical properties of graphene/copper matrix composites are significantly better than that of pure copper. In Table 1, ”Textual data” is the data we obtain through modeling calculations, ”Literature data” is the calculated results of authors in references, and “Error” refers to the percentage difference between the above two data, which is used to describe the size of the difference. It is obvious from the table that both copper and the modulus of composite materials are tested with very close data (ultimate strain and modulus of elasticity). Especially for composite materials, the error of both data is less than 3%. Generally speaking, when the error is less than 5%, the error can be considered to be minimal or no error. Therefore, the molecular dynamics method used in this paper has been verified.
As the most important reinforcement in the graphene/copper matrix composites, it is necessary to verify the graphene tensile, so the graphene tensile simulation was conducted in both directions. The stress–strain curve of the perfect graphene is shown in Figure 3.
According to the curve shown in Figure 3, the curve at the stage of 0–0.04 tensile strain was fitted, and the average value was taken to show that the elastic modulus of defect-free graphene was about 1.082 TPa, which was very close to the 1.05 TPa [32] calculated by first principles and 1.0 TPa [33] measured by nanoindentation test.
Through the above simulation verification of copper, graphene, and graphene/copper matrix composites, the data obtained are basically consistent with previous data, and the simulation method has been well verified.

3. Calculation Results and Discussion

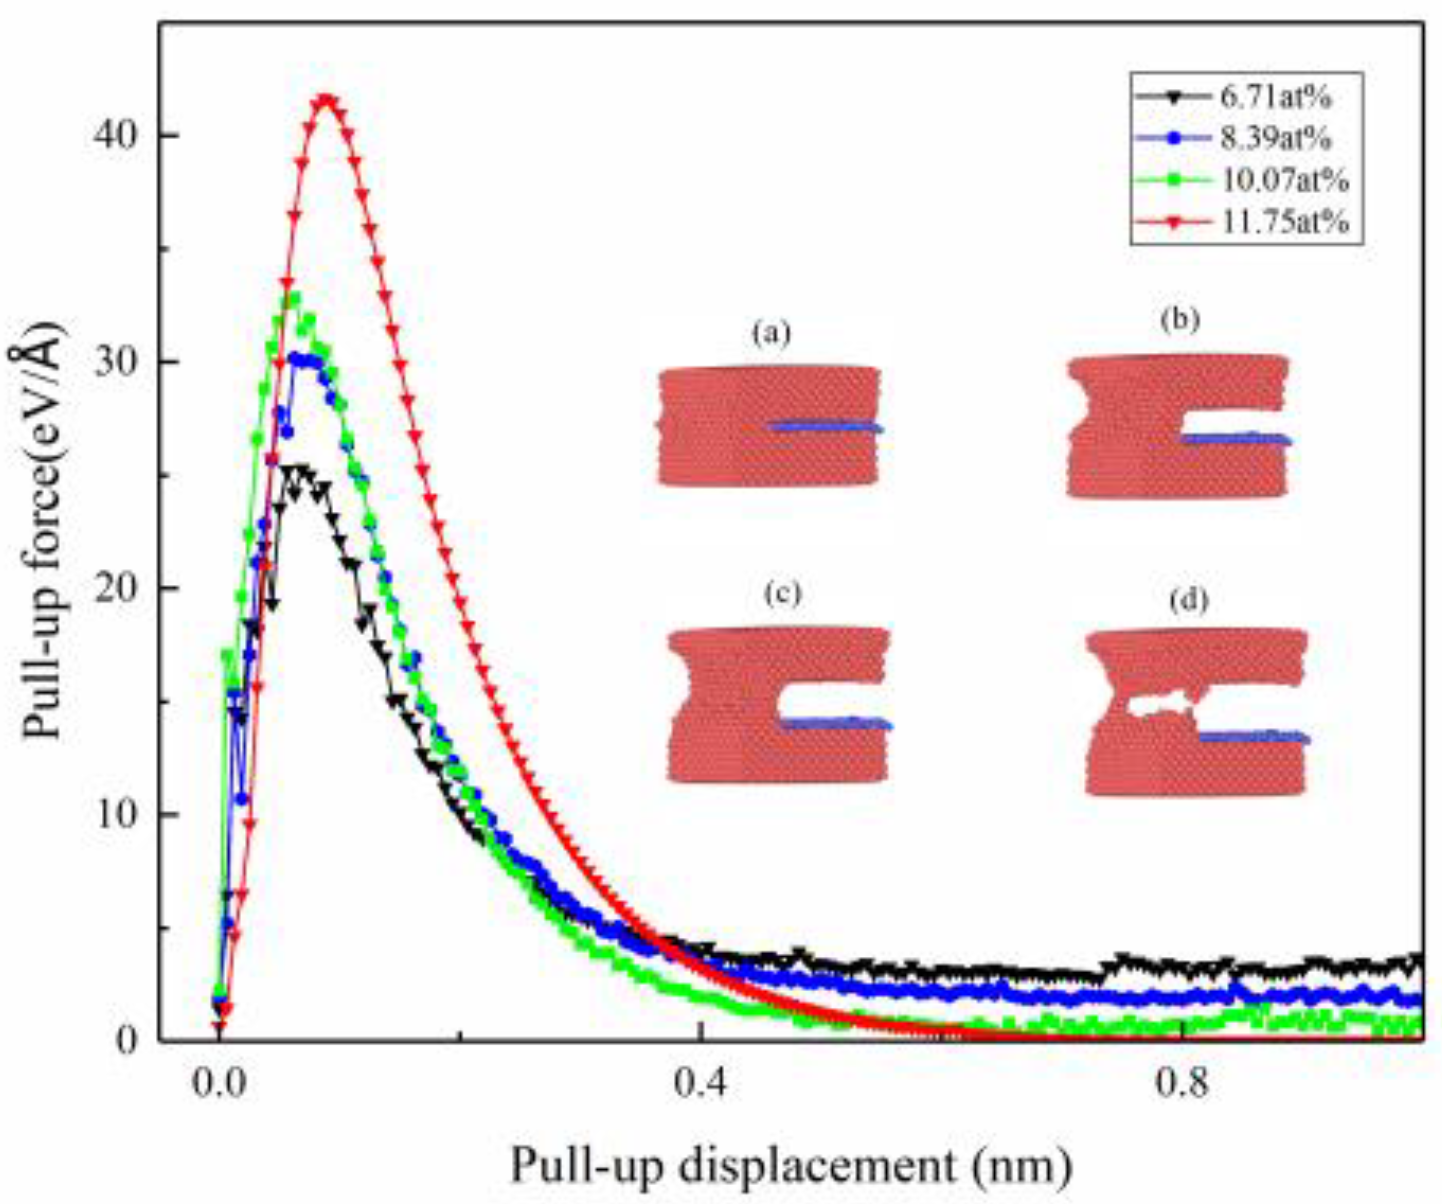
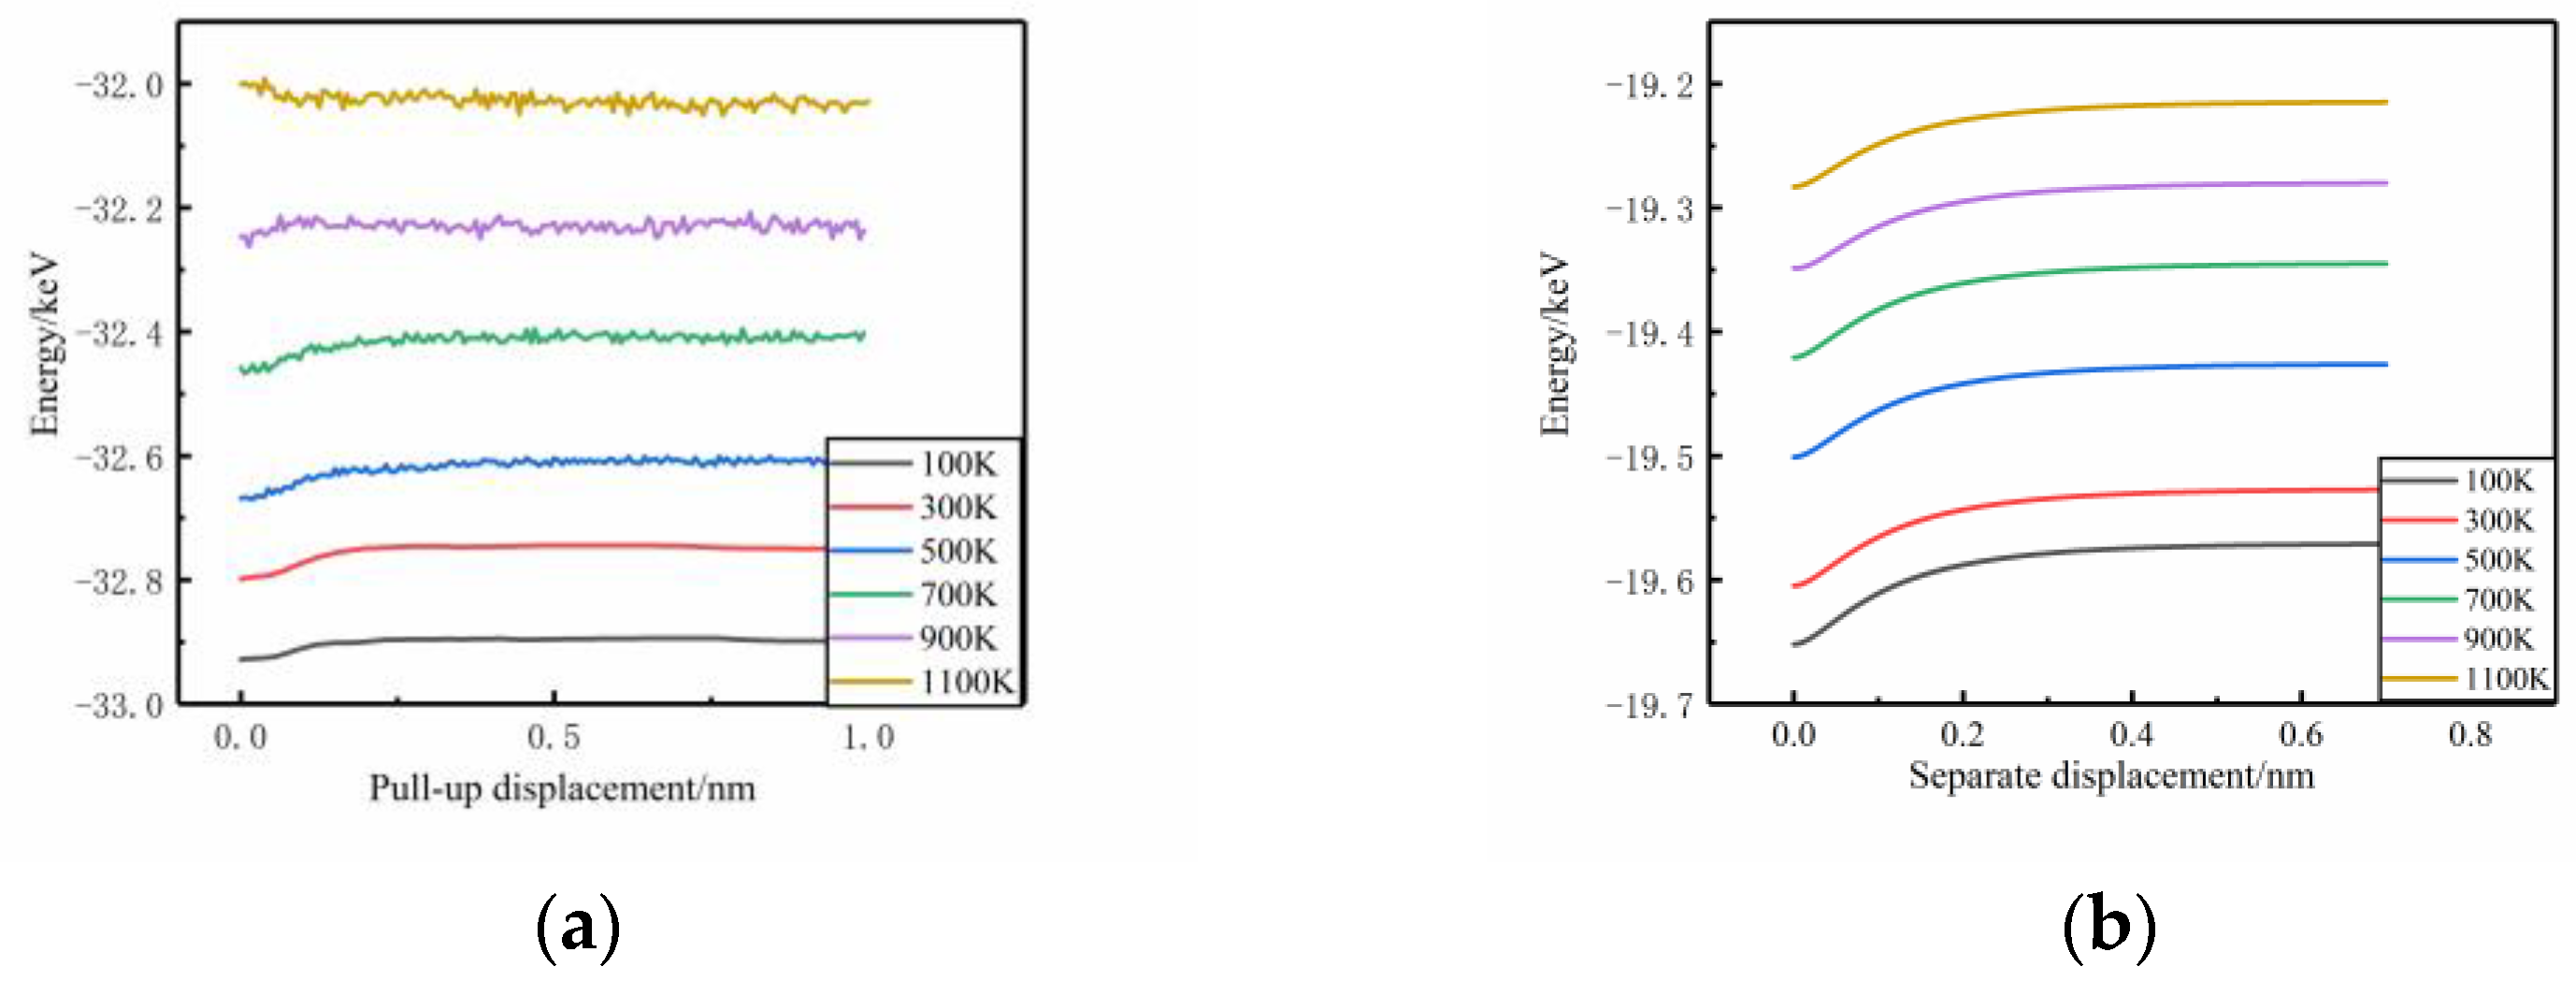
3.1. Mechanical Behavior Analysis of Interface Pull-Up

According to the model and method described above, the mechanical behavior of the pull-up of the graphene–copper interface at temperatures of 100 K, 300 K, 500 K, 700 K, 900 K, and 1100 K was simulated, respectively, and the relationship between the pull-up force and pull-up displacement of the interface was obtained, as shown in Figure 4.
As can be seen from the figure, the pull-up force at different temperatures first increased and then decreased with the increase in pull-up displacement. The whole process can be divided into two stages: the pull-up force rapidly increases with the increase in the displacement of the upper copper atom from the graphene layer. In the descending stage, the pulling force decreases rapidly to a lower state and then slowly to 0. This is because when the pull-up displacement is small, the interatomic van der Waals forces have to be overcome for interfacial separation, resulting in a rapid increase in pull-up forces. When the pull-up displacement further increases, the van der Waals forces between copper and carbon atoms begin to decrease, leading to a decrease in the pull-up force until it reaches 0.
In addition, the maximum pull-up force and maximum pull-up displacement are negatively correlated with temperature. The maximum pull-up force decreases less in the temperature range of 100 K–700 K, while the maximum pull-up force decreases more in the temperature range of 700–1100 K.
The peak value of pulling force at different temperatures was selected to calculate the interface failure stress, as shown in Formula (4).
σ = F S = F max w l
where σ is failure stress, Pa; the Fmax is the maximum pulling force shown in Figure 4, N; w and l are the width and length of the contact surface between graphene and copper, respectively, m.
According to Formula (4), the interface pull-up failure stress at different temperatures can be obtained. That is, the normal strength changes with temperature, as shown in Figure 5.
As can be seen from Figure 5, the normal strength gradually decreases with the increase in temperature. The rate of decline is low in the temperature range of 0–700 K, and the rate and range of decline increase significantly in the temperature range of 700–1100 K. The normal strength decreases to the lowest at 1100 K, which is 1.87 GPa, only 73.7% of that at 100 K. The displacement of the maximum pulling force also decreases with the increase in temperature, and the maximum pulling force at 1100 K corresponds to the minimum displacement, indicating that the interface is easier to separate at high temperatures.
In order to further study the effect of graphene content on the mechanical properties of the interface, the graphene content was controlled by adjusting the X-direction dimension to change the embedding depth. The mechanical properties of pull-up were studied at 300 K when the ratio of the graphene lamellar area to the cross-sectional area of the copper matrix in the same direction was 62.5%, 75%, 87.5%, and 100%, as shown in Figure 6a–d, corresponding to graphene content of 6.71 at%, 8.39 at%, 10.07 at%, and 11.75 at%, respectively. The pull-out force–displacement curves under different graphene contents were obtained, as shown in Figure 7.
As can be seen from Figure 7, the maximum pull-up force and maximum pull-up displacement both increased significantly with the increase in graphene content. Compared with the maximum pull-up force (25.28 eV/Å)) at 6.71 at% content. The maximum pulling force of 8.39 at%, 10.07 at%, and 11.75 at% increased by 19.4%, 29.84%, and 61.82%, respectively, while the increase in carbon atoms was only 12.5%, 25%, and 37.5%. Therefore, the increase in graphene content had a significant effect on the interface strength.
For the intact graphene lamella (11.75 at%), the pulling force eventually decreased to zero, while there was some residual force at all other concentrations, and the lower the graphene content, the greater the residual force.The four illustrations in Figure 7shows the configuration diagram when the pull-up displacement is 0.0075 nm, 0.75 nm, 1.125 nm, and 1.5 nm at 8.39 at% content. It can be seen from the figure that when the graphene layer is completely separated from the upper copper matrix, there is still an interaction between the copper atoms on the left side, leading to the appearance of “residual force”. Moreover, the smaller the amount of graphene, the more copper atoms interacting on the left, and the greater the “residual force.”
Figure 8 shows the relationship between the maximum pulling force, interface normal strength, and graphene content. It can be seen from the figure that the maximum pulling force and normal strength increase with the increase in graphene content, but the graphene content has a significant effect on the maximum pulling force and a small effect on the interface strength. When the graphene content is 11.75 at%, the maximum pulling force and normal strength are the largest. They are 41.71% and 6.8% higher than 6.71 at%, respectively. This is because with the increase in graphene content, more carbon atoms interact with the copper matrix, resulting in an increase in van der Waals force, which leads to an increase in pulling force, but the increase in pulling force is larger than that of carbon atoms. The interface’s normal strength is the pulling force per unit area. The increase in graphene content will cause an increase in the interface area, but the high content of graphene still shows different amplitude enhancement of the strength.

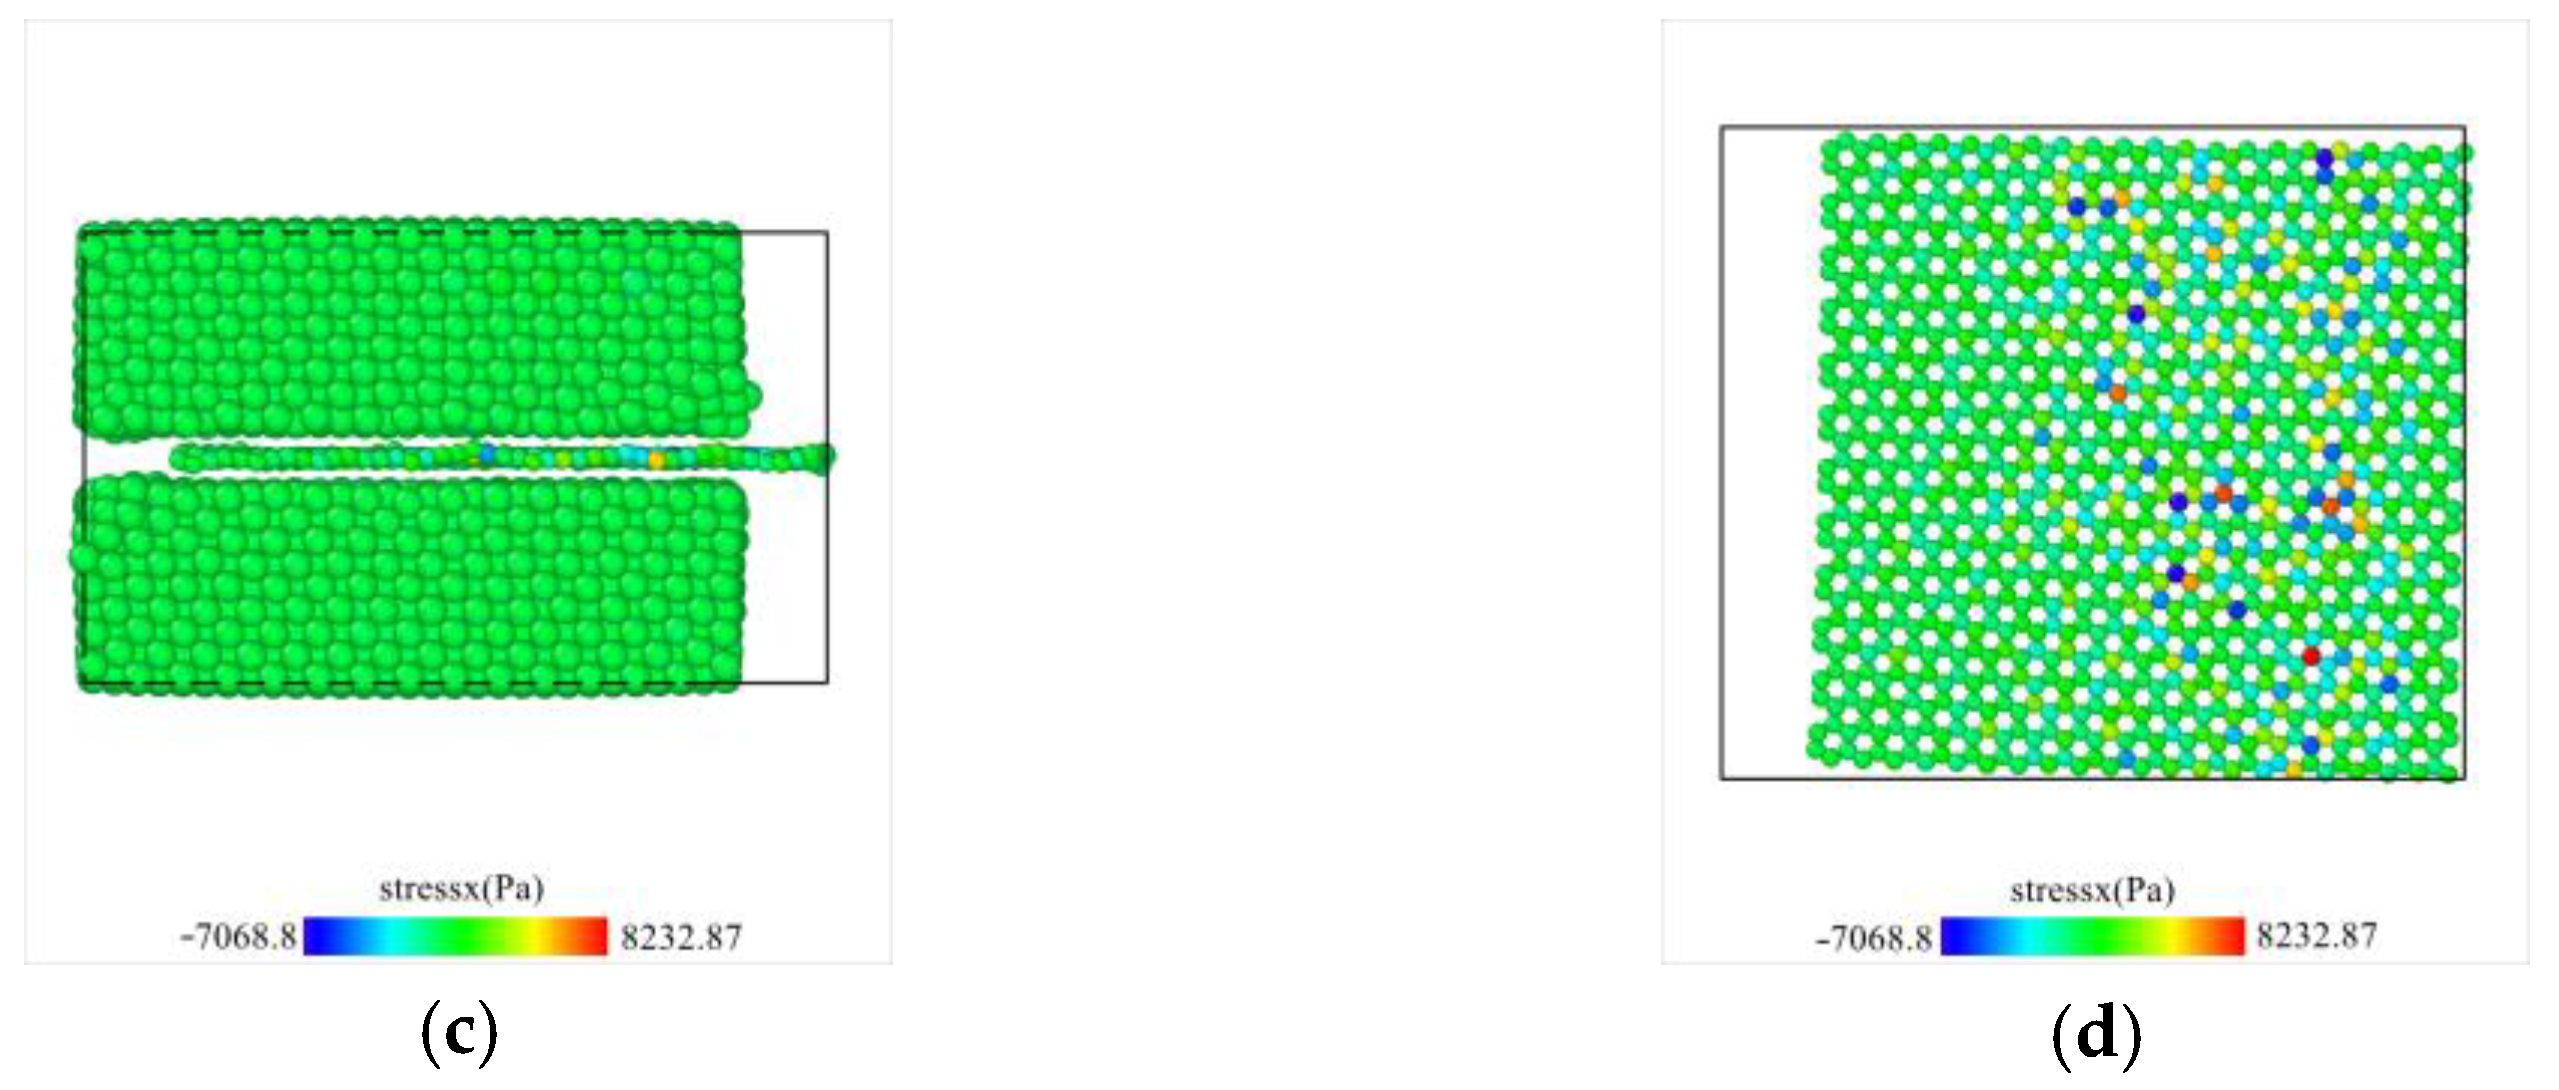
3.2. Mechanical Behavior Analysis of Interface Pulling Out

The pull-out simulation of the model in Figure 1b was carried out to obtain the relationship curves of side pull-out output–displacement at different temperatures, as shown in Figure 9.
As can be seen from the figure, the pull-out output curves at different temperatures all showed a trend of first increasing, then continuously fluctuating, and finally decreasing to 0, corresponding to the unpull-out stage, partial pull-out stage, and complete pull-out stage, respectively. In the non-pull-out stage, the interaction between the interfaces is similar to the static friction form, and the pull-out displacement is nearly 0, while the pull-out force continues to increase. When the pulling force exceeds the “static friction force”, the graphene and copper matrix slide relatively, and the interaction is similar to the form of dynamic friction, and with the change of graphene and copper atoms’ relative position, the pulling force shows a vibration pattern. When the graphene layer is completely pulled out, the distance between graphene and copper atoms continues to increase, and the interaction force decreases until it reaches 0.
With the increase in temperature, the average pull-out force in some pull-out stages showed a downward trend and showed a significant decline between 900 K and 1100 K, which was analyzed to be due to the fact that 1100 K was close to the melting point of copper, at which time the crystal structure of copper would change greatly, and the pull-out force showed a significant downward trend.
In general, the interface shear strength is defined as the ratio of the maximum tangential pulling force to the contact area [34]. However, considering the strong fluctuation of the pulling force during the pulling process, large errors may be generated if calculated by this method. In addition, since the system energy increment in the pull-out process is the work performed by the pull-out force, the interfacial shear strength can be obtained by the following formula:
E p u l l o u t = Δ E = E 2 E 1 E p u l l o u t = x = 0 x = l A τ i dx = x = 0 x = l 2 S τ i dx = w τ i l 2 τ p u l l o u t = E p u l l o u t w l 2
where Epull-out is the work performed by the pull-out force, J; E1 is the system energy at the initial pull-out state, J; E2 is the system energy at the end of the pull-out state, J; τpull-out is the interfacial shear strength, Pa; w and l are the width and length of the contact surface between graphene and copper, m.
According to Formula (5), the interfacial shear strength at different temperatures can be obtained, and then the relationship between average pull-out force, interfacial shear strength, and temperature in the partial pull-out stage can be obtained, as shown in Figure 10. As can be seen from the figure, the average pulling force and interface shear strength are negatively correlated with temperature. The shear strength and pulling force at 1100 K are 71.8 MPa and 1.58 eV/Å, respectively, only 67.1% and 66.9% of those at 100 K. In the range of 100–700 K, the average pull-out force and interfacial shear strength decreased by 11.44% and 11.65%, respectively, while in the range of 700–1100 K, the average pull-out force and interfacial shear strength decreased by 24.22% and 24.29%, respectively.
By changing the graphene content in the composite material and conducting the pull-out simulation at 300 K, the pull-out output–displacement relationship curves under different graphene content can be obtained, as shown in Figure 11.
As can be seen from the figure, graphene content has little effect on the overall trend of the pull-out outdoor–displacement curve and the maximum pull-out output. According to the analysis, the side pull-out force can be regarded as the friction force on the interface under the interaction between graphene carbon atoms and copper atoms. In this paper, the graphene content is defined as the relative size of the contact area between graphene lamella and copper matrix, while the friction force is independent of the contact area. Therefore, when the graphene content changes, the pull-out force is not significantly affected. The maximum pull-out displacement is directly dependent on the size of the graphene lamellar in the pull-out direction. Therefore, the maximum displacement ratio shown in the figure is 0.625:0.75:0.875:1, which is consistent with the ratio of the four graphene lamellar dimensions in the X direction.
The interfacial shear strength under different graphene content is shown in Figure 12.
It can be seen from the figure that the interfacial shear strength is negatively correlated with the change in graphene content. The interfacial shear strength of 6.71 at%−11.75 at% decreases by 13.1%, 25.1%, and 37.4%, respectively, which is basically consistent with the increase in graphene area. When the length of graphene in the X direction increases, more work will be performed by the pull-out; that is, Epull-out is proportional to l. According to Formula (5), the interfacial shear strength τpull-out is inversely proportional to the square of the length (l2). Therefore, when the graphene content increases, that is, the length l increases, the interfacial shear strength will decrease accordingly.

3.3. Analysis of Interface Cohesion

According to the cohesion model mentioned above, the cohesive force–displacement relationship curves of the graphene–copper interface at different temperatures can be obtained, as shown in Figure 13.
As can be seen from the figure, the cohesion–displacement curve at each temperature can be divided into two distinct stages: rising and falling. The cohesion in the lifting stage increases rapidly with the increase in the lifting displacement and reaches the maximum value when the lifting displacement is about 0.04 nm. Subsequently, the curve enters a descending stage, in which the cohesion decreases rapidly at first, then gradually slows down with the increase in pulling displacement, and finally drops to zero when the interface separation displacement reaches about 0.72 nm.
In addition, the maximum cohesion decreases with the increase in temperature. When the temperature is 100 K, the maximum cohesion is 49.38 eV/A. When the temperature rises to 1100 K, the maximum cohesion is only 41.56 eV/Å.
According to Formula (4), the interfacial bonding strength–temperature relationship with intact monolayer graphene can be obtained, as shown in Figure 14.
As can be seen from the figure, the interface cohesiveness decreases with the increase in temperature, but the rate of decline is different in different temperature ranges. Among them, the interface cohesiveness decreases rapidly below 500 K, and remains basically unchanged between 500 K and 900 K, while the interface strength continues to decline between 900 K and 1100 K, reaching the lowest point at 1100 K.
In order to study the effect of graphene content on interface cohesion strength, four kinds of composite material models with different graphene content of 62.5%, 75%, 87.5%, and the whole sheet of graphene were established, respectively. The corresponding graphene atomic content fractions were 12.02 at%, 15.02 at%, 18.03 at%, and 21.03 at%, as shown in Figure 15.
The interface cohesion properties of the above models were simulated respectively at 300 K, and the cohesive force–displacement curves under different graphene contents were obtained, as shown in Figure 16.
As can be seen from the figure, the curve trend is basically the same under different contents, but the composites with high graphene content have greater interfacial cohesion, including the maximum cohesion of 46.50 eV/Å when the whole sheet of graphene (21.03 at%) is included. The maximum cohesion of 18.03 at%, 15.02 at%, and 12.02 at% was 40.14 eV/Å, 33.90 eV/Å A, and 28.1 eV/Å, respectively, which decreased by about 14.7%, 27.1%, and 39.6% compared with the whole graphene. This is because with the decrease in graphene content, the contact area between graphene and copper matrix also decreases, and the number of interacting atoms decreases, resulting in a decrease in maximum cohesion.
Figure 17 shows the relationship between maximum cohesion and cohesion strength, and graphene content. It can be seen from the figure that maximum cohesion increases almost linearly with the increase in graphene content. The cohesion strength was almost unaffected by the content. The maximum cohesivity of the model with intact single-layer graphene interlayers increased by 39.6% compared to 12.02 at%, which was consistent with the increase in graphene content, while the change in cohesion strength was only 3.4%, indicating that graphene content had little effect on cohesion strength.
According to the analysis, with the increase in the graphene content, the number of carbon atoms interacting with the copper matrix generates more van der Waals forces, thus increasing the maximum cohesion. However, when the maximum cohesion increases, the contact area also increases, resulting in the cohesive strength remaining basically unchanged.

3.4. Influence Mechanism Analysis

From the above analysis, it can be seen that temperature has a significant effect on the three interface behaviors, while the graphene content only has an effect on the normal interface behavior during pulling up. Now, the influence mechanism of temperature and graphene content on the interface behavior is analyzed.

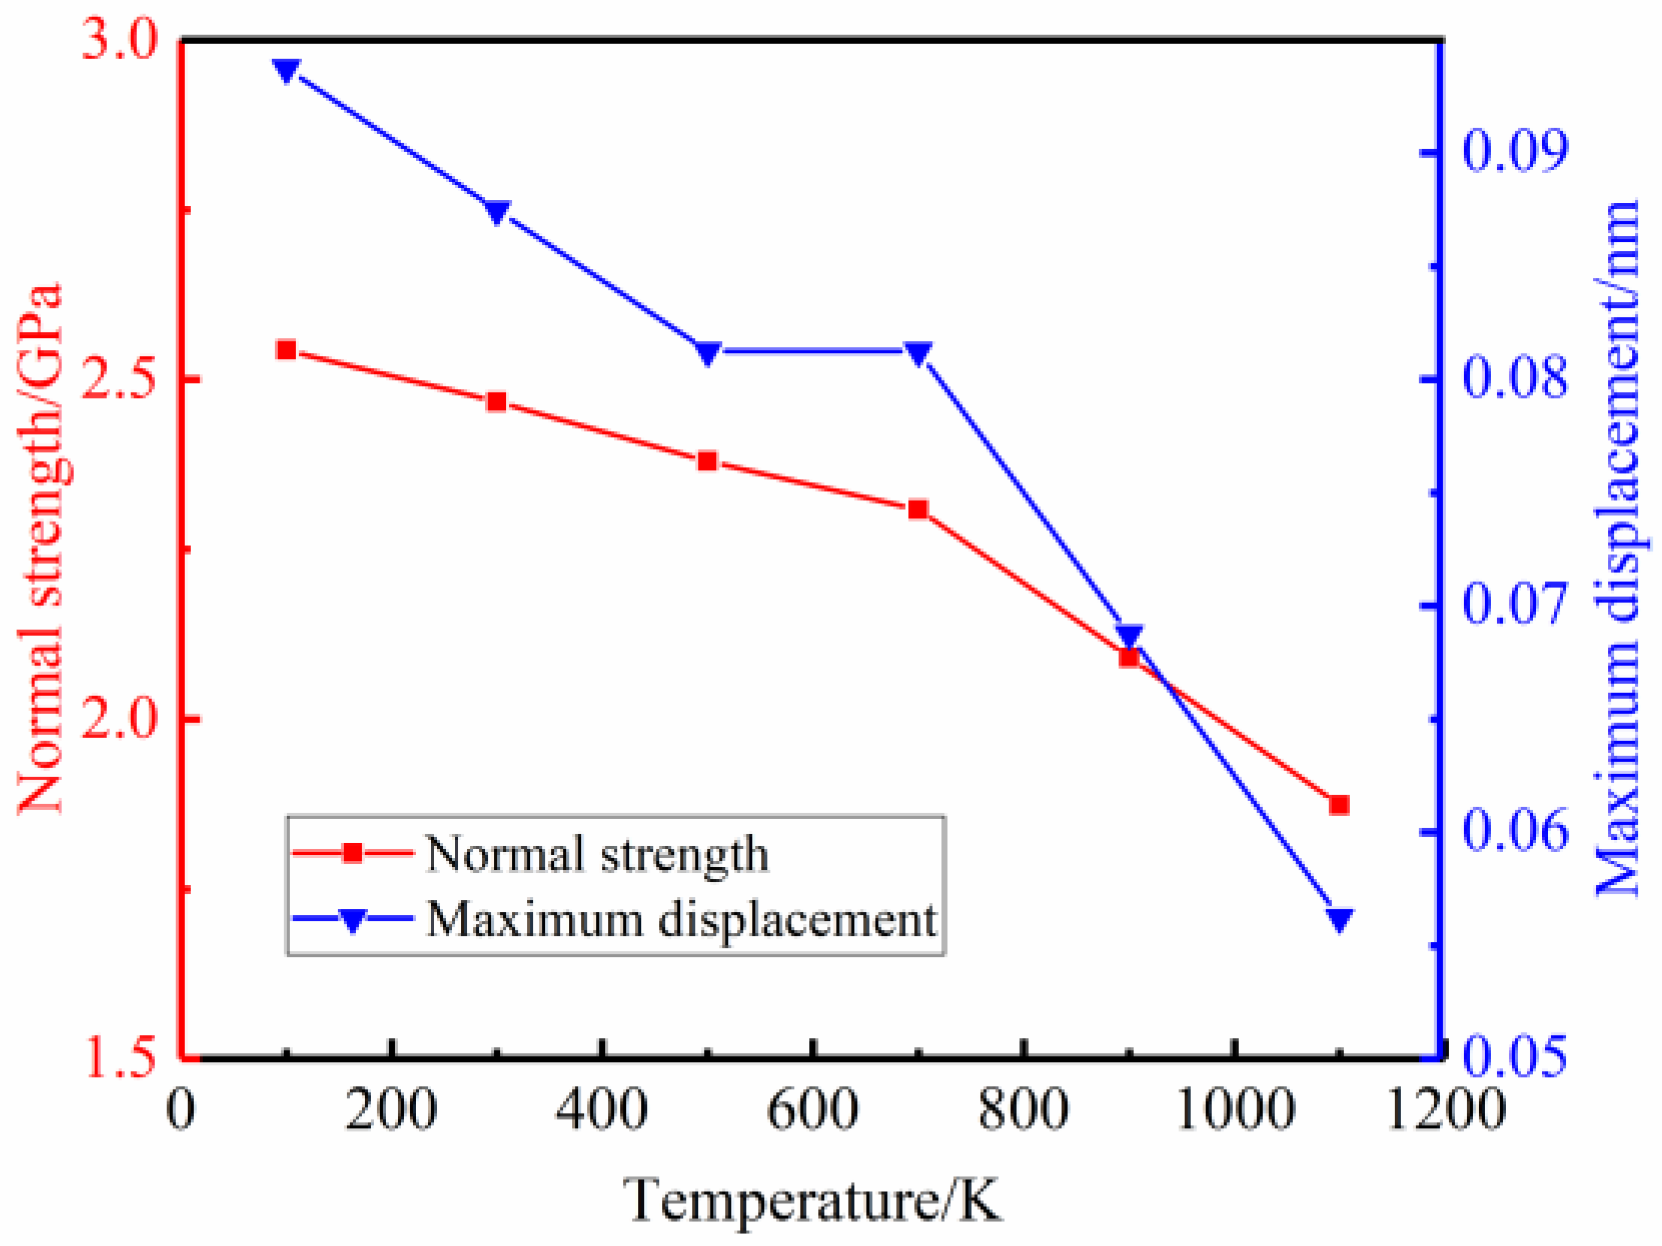
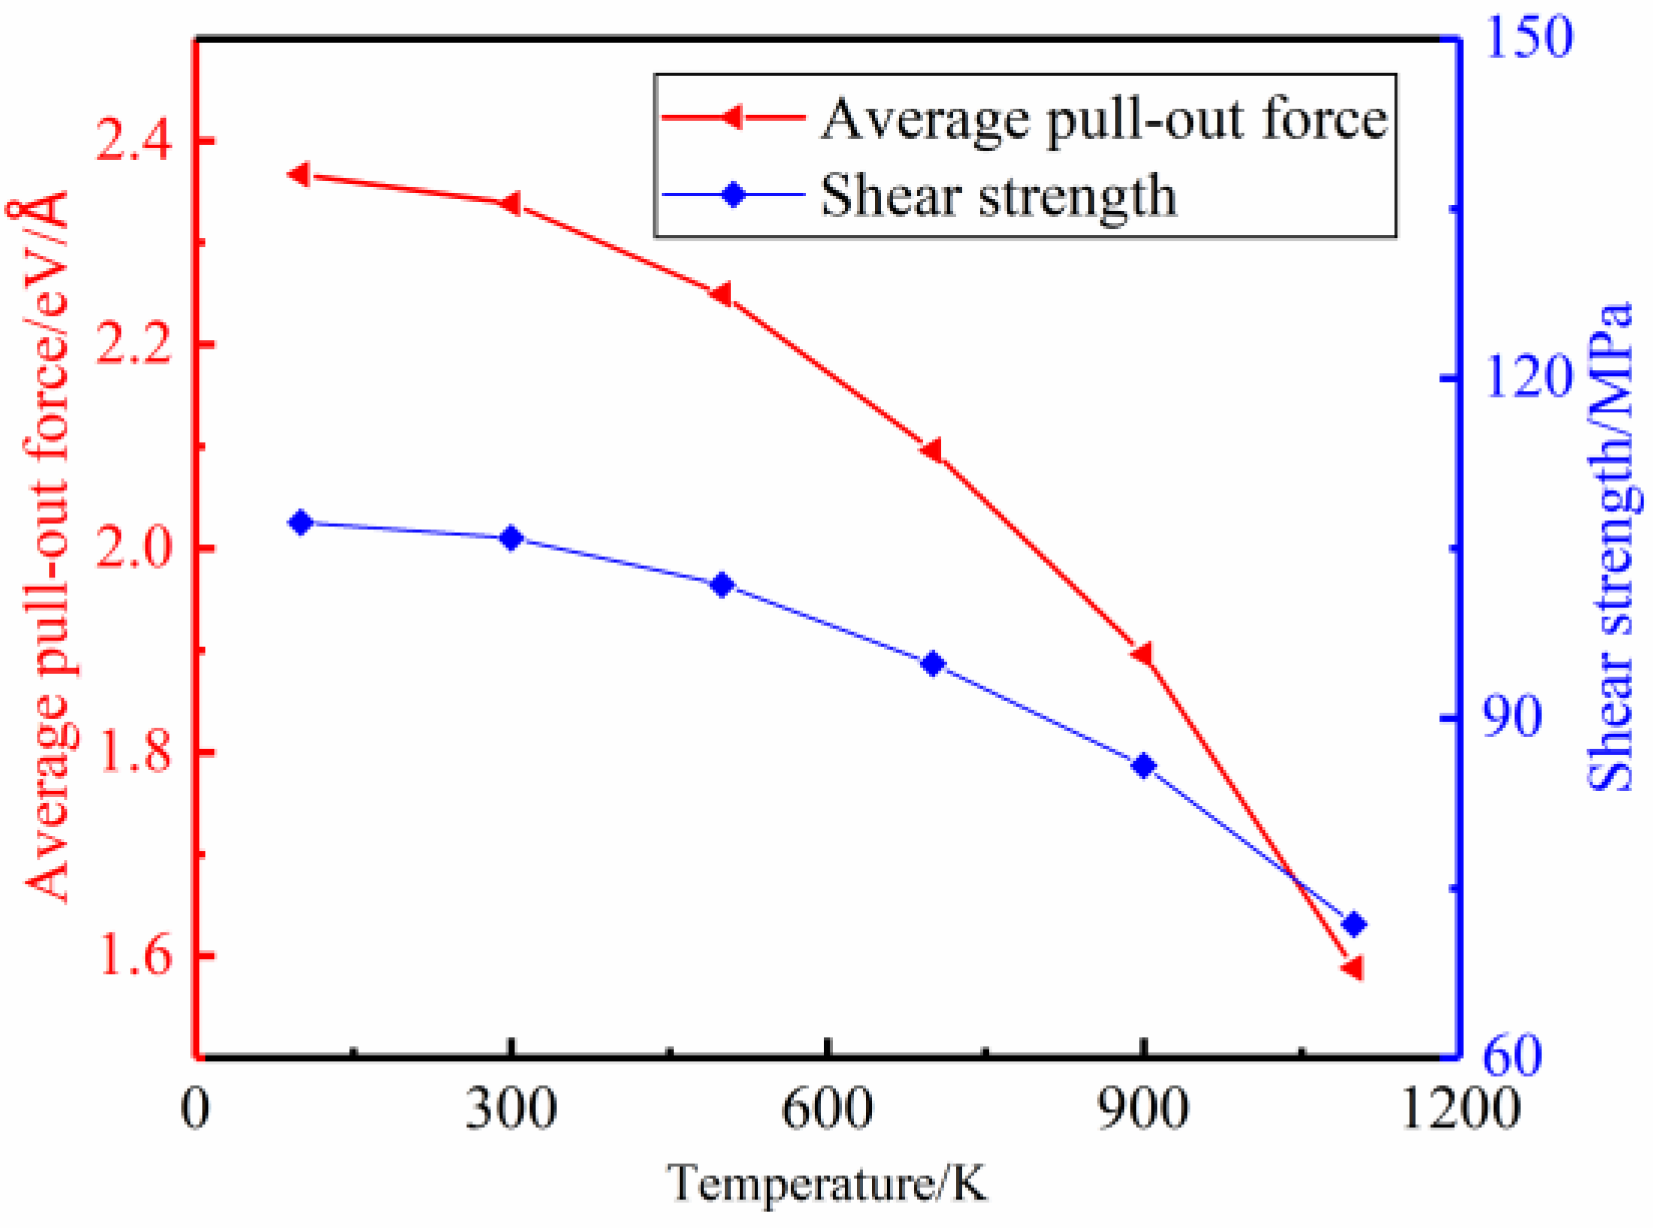
3.4.1. Temperature Effect

In order to analyze the mechanism of the influence of temperature on the interface, the pull-out model was taken as an example. Figure 18a–d shows the interface topography of the pull-out process at different temperatures. It can be seen from the figure that at a low temperature (100–300 K), the separation of copper matrix and graphene lamellar is almost rigid, the atomic arrangement of the copper matrix is regular, and the fold of graphene lamellar is small. The vacancy will be formed in the copper matrix (Figure 18a,b). As the temperature increases (700–1100 K), the lattice distortion in the copper matrix becomes more severe, and the atomic arrangement becomes more irregular. With the removal of the graphene lamella, the copper atoms will gradually fill the vacancy formed by the removal of the graphene lamella. At 1100 K, after the removal of the graphene lamella, all the copper atoms will fill the vacancy simultaneously. The tendency of copper atoms to be removed by adhesion increases.
It can be concluded from the above analysis that temperature will directly affect the atomic thermal motion of the pull-out system, thus leading to changes in the energy of the system. Figure 19 shows the curve of the energy of the system with temperature under different temperatures. The trend of the energy of a representative copper atom changing with temperature during the pull-out process is shown in the red diagonal line. The total energy of the system increases with the increase in the energy of a single atom. Meanwhile, the energy oscillation trend of the system becomes more obvious with the increase in temperature, indicating that the thermal motion of atoms is intensified [35]. The increase in energy and the intensification of atomic thermal motion will reduce the stability of the system and lead to a decrease in interface strength.
On the other hand, the melting point of copper is about 1300 K, while the melting point of graphene is above 3000 K. Therefore, when the temperature reaches 1100 K, the physical properties of the copper matrix have been greatly changed, but graphene is almost unaffected (Figure 18d). At this time, when the graphene is pulled out, some of the softened copper will fill into the graphene vacancy. The softening of the copper matrix will seriously affect the properties of the interface, resulting in the inability to form a suitable interface and significantly reduced strength.
For cohesion and pull-out mechanical behavior, the energy of the system also increases with the increase in temperature (Figure 20). As can be seen from the figure, in pull-out simulation, the energy of the system increases with the increase in temperature, while the energy fluctuates more violently, indicating that the stability of the system decreases with the increase in temperature, which explains the phenomenon that the normal strength decreases with the increase in temperature. In cohesion simulation, the curve fluctuation was significantly less affected by temperature than that in pull-out and pull-out simulation. The analysis showed that only copper atoms existed at the bottom of the graphene sheet in the cohesion model, while the separation of the graphene sheet from the bottom copper matrix in the simulation had little impact on the copper matrix itself, so the energy fluctuation was small. However, the total energy of the system increases with the increase in temperature, and the stability of the system decreases significantly, resulting in a decrease in cohesion strength.

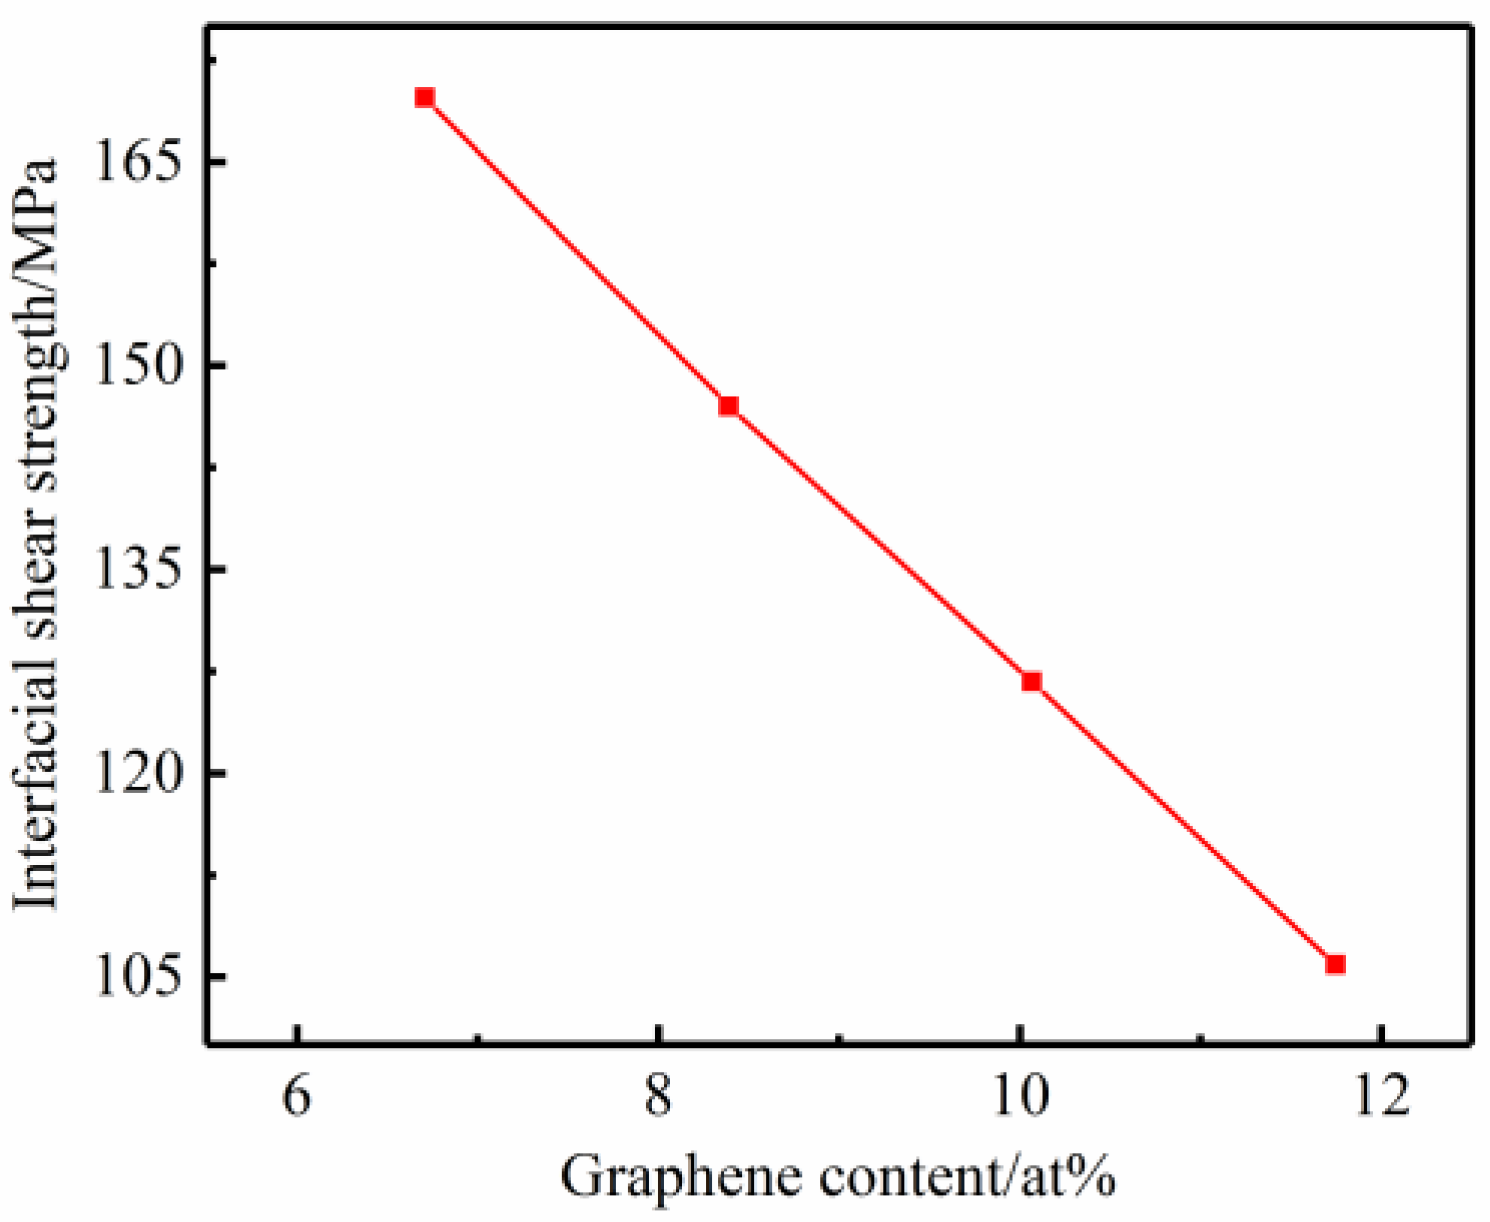
3.4.2. Graphene Content Effect

According to the analysis and research above, the content of graphene had a significant effect on the normal strength but had little effect on the tangential strength and cohesion strength. This phenomenon can be analyzed from the two aspects of the graphene sheet’s strengthening on the copper matrix and its force in the copper matrix.
Figure 21 shows the distribution of dislocation and dislocation lines inside the copper matrix at the lifting displacement of 0.7 nm for 6.71 at% and the intact monolayer graphene lamellar. In Figure 21a,c, green is a single-crystal copper atom with FCC structure, the red atom is the copper atom on the defect atomic plane, and the red line is the dislocation line, as shown in Figure 21b,d.
As can be seen from Figure 21a,b, when the graphene content is 6.71 at%, there are more dislocation lines inside the composite in the process of pulling up, and they are distributed in the upper and lower copper matrix and the copper atoms in the middle part without graphene. However, when the middle interlayer is complete monocular graphene (Figure 21c,d), the dislocation lines in the composite are few and mainly distributed in the copper matrix above the graphene. This is because, for metal crystals, the dislocation will reduce their mechanical strength. However, with the addition of graphene, dislocation motion in the copper matrix will be hindered and restricted, which is equivalent to metal grain refinement [36]. When dislocation is limited, the perfect interface is easier to form in the composite, and the binding between copper atoms and graphene matrix is stronger, thus improving its normal strength. In addition, with the increase in graphene content, a larger interface will be formed in the matrix, and the obstruction and restriction of dislocation movement in the matrix will be enhanced, resulting in higher interface strength.
For pull-out, Figure 22 shows the stress distribution in the unpull-out stage and the partial pull-out stage (pull-out displacement 0.625 nm), Figure 22a,c show the overall stress distribution, and Figure 22b,d show the corresponding stress distribution on the graphene sheet. As can be seen from the figure, for the graphene lamellar, the stress on the right side near the pull-out end is greater, while the stress on the left side away from the pull-out end is smaller.
Figure 23 is a schematic diagram of load transfer at the interface during the pulling-out process. It can be seen from the diagram that during the pulling-out process, the unpulled part of the graphene sheet will be subjected to the combined attractive and repulsive forces of nearby copper atoms, and the resultant force is almost zero. However, the carbon atoms in the pull-out state or near the pull-out state are only attracted by the copper atoms on both sides of the upper and lower sides, which hinders the pull-out process. Therefore, it can be considered that only carbon atoms in the pull-out critical state contribute to the pull-out force, so the number of carbon atoms in the critical state will determine the pull-out force, which is consistent with the results of DUAN et al. [35], who showed that the pull-out force is related to the width of graphene but not to its length. Similar to the rule in this paper that the pull-out force is not affected by the graphene content, the definition of interfacial shear strength shows that when the pull-out force is unchanged, the interfacial shear strength is negatively correlated with the contact area, so increasing the graphene content will lead to a decrease in the interfacial shear strength.
Based on the above analysis, it can be seen that the graphene content will affect the normal strength because the graphene sheet will hinder the dislocation expansion of the copper matrix. The pull-out force was only affected by the number of carbon atoms at the pull-out critical state. Therefore, the maximum pull-out force remained unchanged in this simulation, but the increase in graphene content resulted in an increase in the contact area and a decrease in interfacial shear strength. In the cohesive strength simulation, the cohesion and contact area increased simultaneously, and the cohesive strength was almost unaffected by the graphene content.

4. Conclusions

By controlling the simulated temperature and the content of graphene in the composites, the influence of two factors on the interface properties was studied, and the mechanism was analyzed. The main conclusions were drawn as follows:
(1)
During the simulation process, the pulling force increased first and then decreased. The normal strength and pulling force decreased with the increase in temperature. The influence of graphene content on the normal strength was obvious, and the normal strength of 6.71 at% decreased by 6.8% compared with that of the composite containing intact single graphene;
(2)
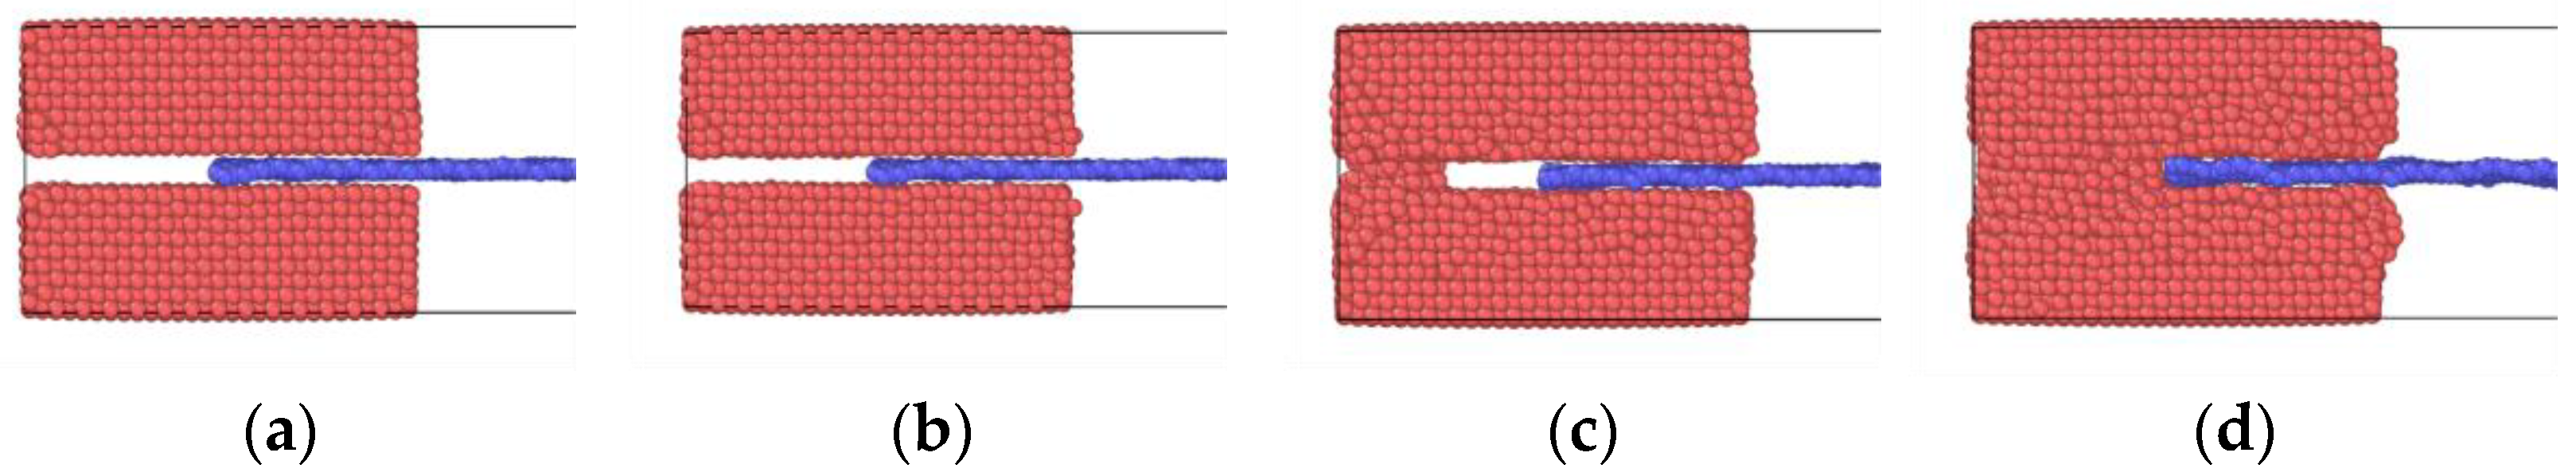
During the pull-out process, the pull-out force first increased rapidly, then fluctuated continuously, and finally decreased to zero. The pull-out force and interfacial shear strength decreased with the increase in temperature and had a large decreasing trend between 700 K and 1100 K. The graphene content had little effect on the pull-out force but a significant effect on the interfacial shear strength;
(3)
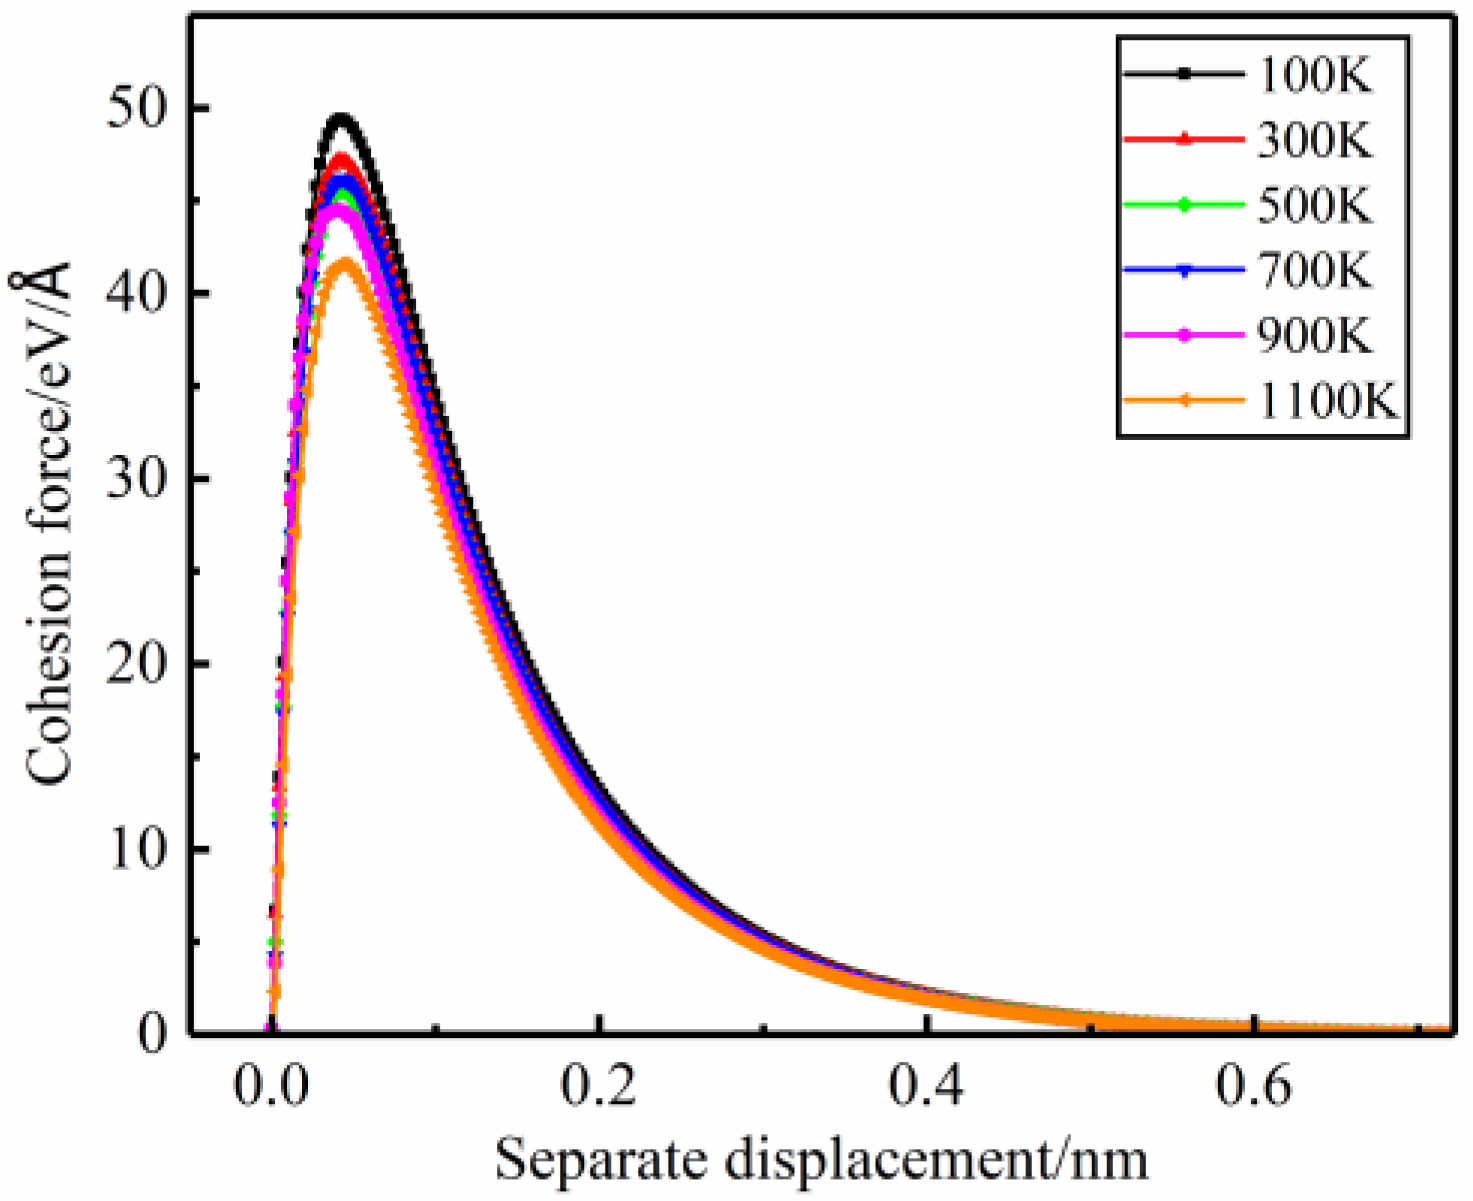
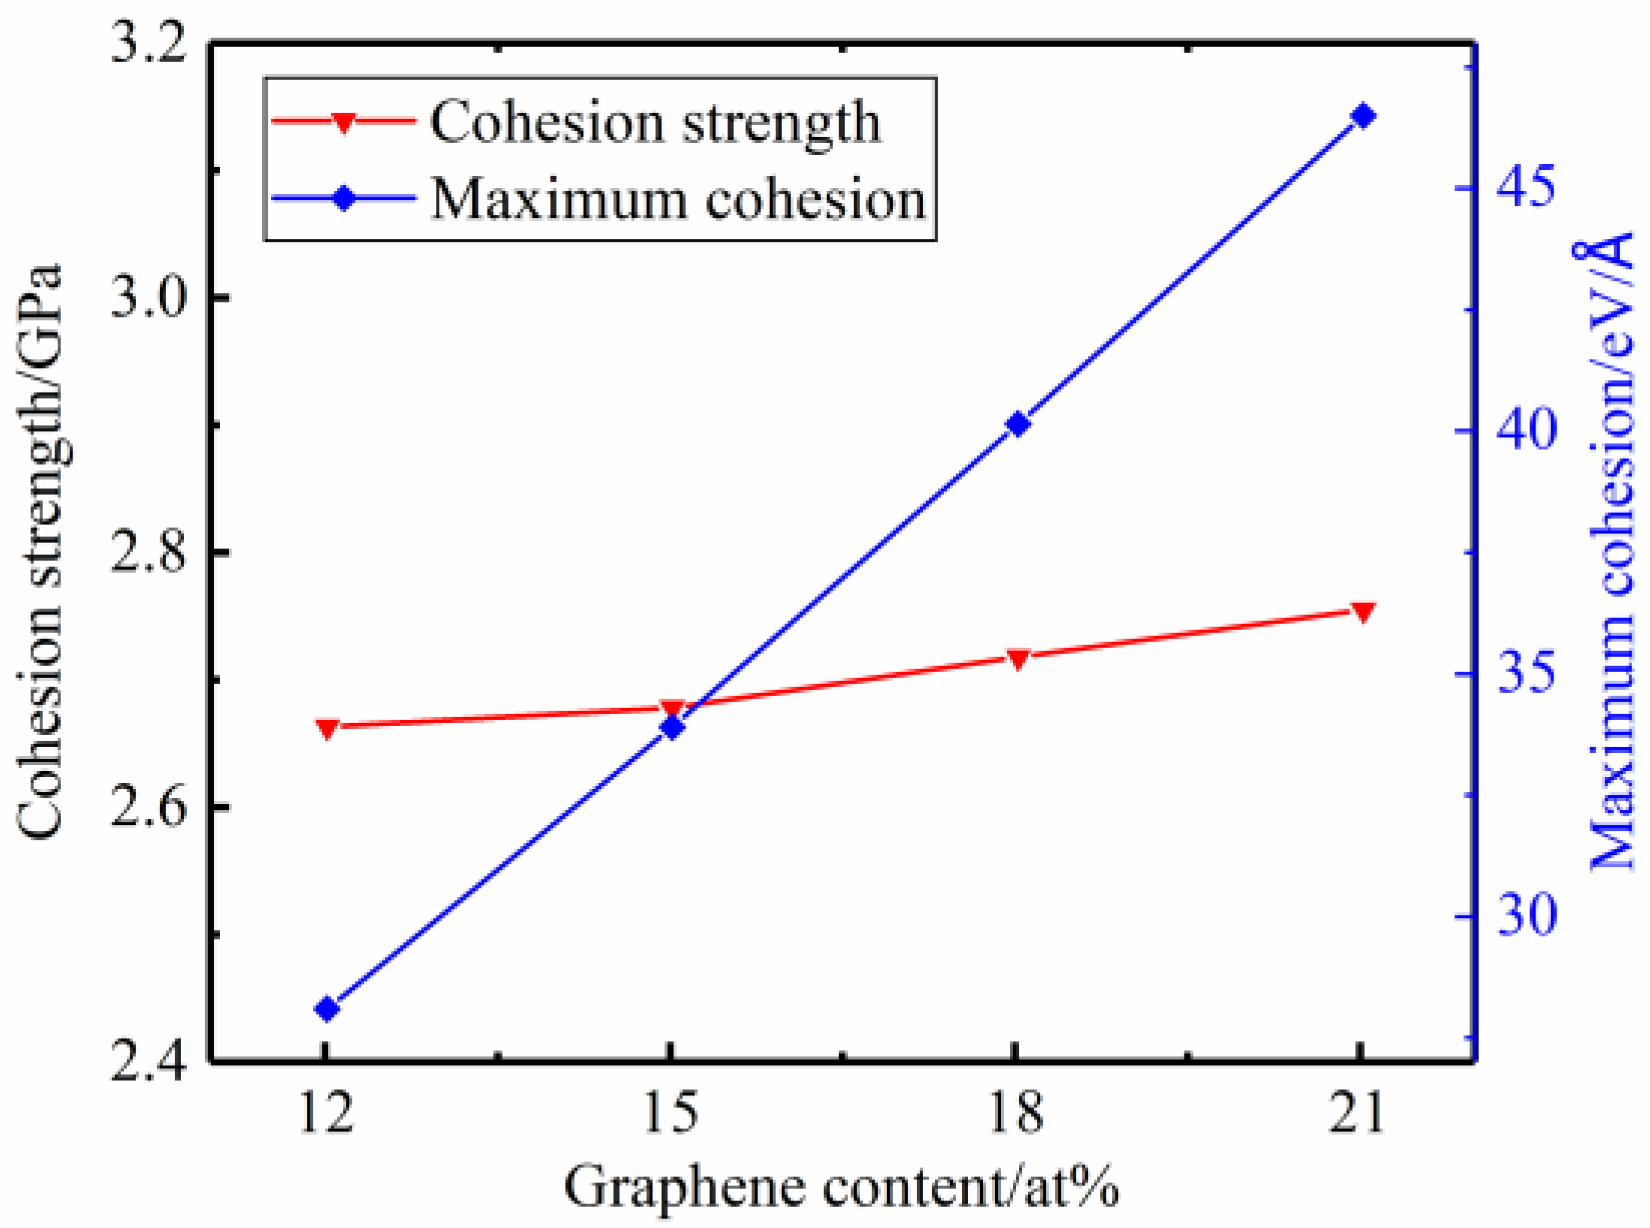
The interface cohesion increased rapidly with the simulation and then decreased to 0. The maximum cohesion and cohesion strength decreased with the increase in temperature, and the cohesion strength was almost not affected by the graphene content;
(4)
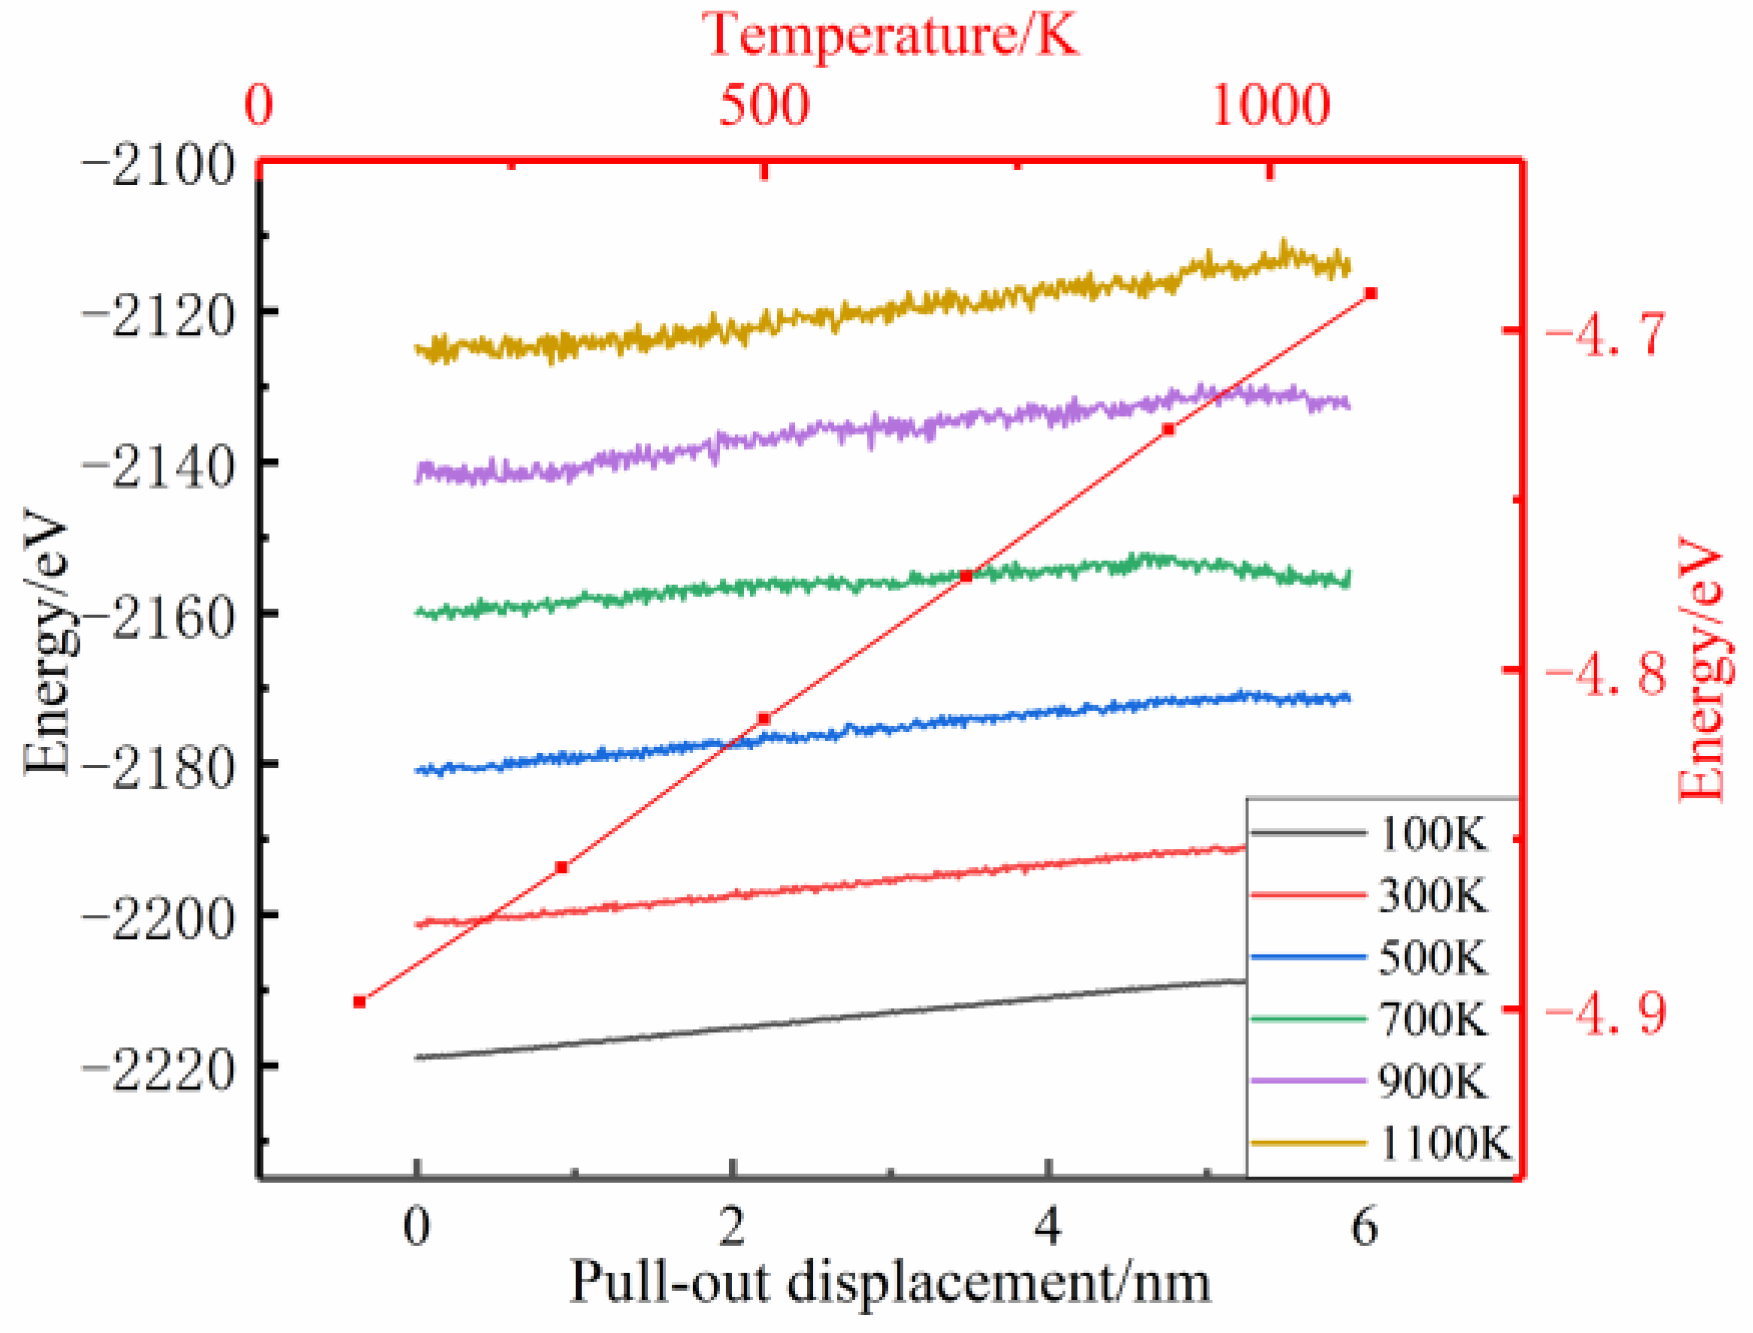
The analysis of the effect of temperature and graphene content shows that temperature will affect atomic activity. The increase in temperature leads to a decrease in the attraction between carbon atoms and copper atoms and the softening of the copper matrix, which reduces the interface strength. The presence of graphene sheets will hinder the dislocation expansion of the copper matrix, so the normal strength increases with the increase in graphene content, and the pull-out force is only affected by the number of carbon atoms at the critical pull-out surface, so the maximum pull-out force remains basically unchanged.

Author Contributions

Y.L. analyzed the data and wrote this manuscript. D.L. and Q.L. provided valuable suggestions on the experiments and manuscript. D.L., Y.L. and Q.L. modified the manuscript in detail. All authors have read and agreed to the published version of the manuscript.

Funding

This research was funded by the National Science Foundation of China (grant no. 51878547, 51641809), the Chinese Postdoctoral Science (grant no. 2018M633478) and Special scientific research project of Shaanxi Provincial Education Department (grant no. 21JK0711).

Institutional Review Board Statement

Not applicable.

Informed Consent Statement

Not applicable.

Data Availability Statement

Not applicable.

Conflicts of Interest

The authors declare no conflict of interest.

References

  1. Berman, D.; Deshmukh, S.A.; Sankaranarayanan, S.K.R.S.; Erdemir, A.; Sumant, A.V. Macroscale superlubricity enabled by gra-phene nanoscroll formation. Science 2015, 348, 6239. [Google Scholar] [CrossRef] [PubMed] [Green Version]
  2. Novoselov, K.S.; Geim, A.K.; Morozov, S.V.; Jiang, D.; Zhang, Y.; Dubonos, S.V.; Grigorieva, I.V.; Firsov, A.A. Electric field effect in atomically thin carbon films. Science 2004, 306, 666–669. [Google Scholar] [CrossRef] [PubMed] [Green Version]
  3. Balandin, A.A.; Ghosh, S.; Bao, W.; Calizo, I.; Teweldebrhan, D.; Miao, F.; Lau, C.N. Superior Thermal Conductivity of Single-Layer Graphene. Nano Lett. 2008, 8, 902–907. [Google Scholar] [CrossRef]
  4. Tonks, D.L.; Alexanderl, D.J.; Sheffield, S.A.; Zurek, A.K.; Thissell, W.R. Spallation strength of single crystal and polycrys-talline copper. J. Phys. IV 2000, 10, 787–792. [Google Scholar]
  5. Zhai, W.; Lu, W.; Chen, Y.; Liu, X.; Zhou, L.; Lin, D. Gas-atomized copper-based particles encapsulated in graphene oxide for high wear-resistant composites. Compos. Part B Eng. 2019, 157, 131–139. [Google Scholar] [CrossRef]
  6. Zhang, P.C.; Jie, J.C.; Gao, Y.; Li, H.; Cao, Z.Q.; Wang, T.M. Preparation and properties of TiB2 particles reinforced Cu-Cr matrix composite. Mater. Sci. Eng. Struct. Mater. Propert. Misrostruct. Process. 2015, 642, 398–405. [Google Scholar] [CrossRef]
  7. Xue, Z.; Wang, L.; Zhao, P.; Xu, S.; Qi, J.; Fei, W. Microstructures and tensile behavior of carbon nanotubes reinforced Cu matrix composites with molecular-level dispersion. Mater. Des. 2012, 34, 298–301. [Google Scholar] [CrossRef]
  8. Hua, J.; Zhang, Y.; Wu, X. Vibration analysis of defective graphene based on the molecular structural mechanics method. Int. J. Comput. Mater. Sci. Eng. 2016, 5, 16500020. [Google Scholar] [CrossRef]
  9. Wang, C.; Lan, L.; Liu, Y.; Tan, H. Multiple component correlation model for elastic modulus of single layer graphene sheets. Phys. E Low-Dimens. Syst. Nanostruct. 2013, 56, 372–376. [Google Scholar] [CrossRef]
  10. Ren, Y.; Cao, G. Effect of geometrical defects on the tensile properties of graphene. Carbon 2016, 103, 125–133. [Google Scholar] [CrossRef] [Green Version]
  11. Cui, J.; Song, Z.; Xin, L.; Zhao, S.; Yan, Y.; Liu, G. Exfoliation of graphite to few-layer graphene in aqueous media with vinylimidazole-based polymer as high-performance stabilizer. Carbon 2016, 99, 249–260. [Google Scholar] [CrossRef]
  12. Wang, H.; Xie, G.Y.; Fang, M.; Ying, Z.; Tong, Y.; Zeng, Y. Electrical and mechanical properties of antistatic PVC films con-taining multi-layer graphene. Compos. Part B 2015, 79, 444–450. [Google Scholar] [CrossRef]
  13. Yao, W.; Fan, L.; Liu, G. Advance in Properties of Graphene and Graphene/Metal Layered Composite After Irradiation Damage. Rare Metal Mater. Eng. 2019, 48, 3130–3135. [Google Scholar]
  14. Cha, S.I.; Kim, K.T.; Arshad, S.N.; Mo, C.B.; Hong, S.H. Extraordinary Strengthening Effect of Carbon Nanotubes in Metal-Matrix Nanocomposites Processed by Molecular-Level Mixing. Adv. Mater. 2005, 17, 1377–1381. [Google Scholar] [CrossRef] [PubMed]
  15. Hwang, J.; Yoon, T.; Jin, S.H.; Lee, J.; Kim, T.-S.; Hong, S.H.; Jeon, S. Enhanced Mechanical Properties of Graphene/Copper Nanocomposites Using a Molecular-Level Mixing Process. Adv. Mater. 2013, 25, 6724–6729. [Google Scholar] [CrossRef] [PubMed]
  16. Hua, J.; Song, C.; Duan, Z.R.; Xiao, P. Molecular dynamics simulation of shear properties of graphene/copper compo-sites. J. Compos. Mater. 2018, 35, 632–639. [Google Scholar]
  17. Hua, J.; Ren, X.L.; Zhao, D. Friction properties of graphene-coated copper substrates based on molecular dynamics. Chin. J. Appl. Mech. 2021, 38, 1485–1492. [Google Scholar]
  18. Zhang, J.; Xu, Q.; Gao, L.; Ma, T.B.; Qiu, M.; Hu, Y.Z.; Wang, H.; Luo, J.B. A molecular dynamics study of lubricating mechanism of graphene nanoflakes embedded in Cu-based nanocomposite. Appl. Surf. Sci. 2020, 511, 145620.1–145620.9. [Google Scholar] [CrossRef]
  19. Bian, J.J.; Nicola, L. On the lubrication of rough copper surfaces with graphene. Tribol. Int. 2021, 156, 106837. [Google Scholar] [CrossRef]
  20. Shi, X.; Yin, Q.; Wei, Y. A theoretical analysis of the surface dependent binding, peeling and folding of graphene on single crystal copper. Carbon 2012, 50, 3055–3063. [Google Scholar] [CrossRef] [Green Version]
  21. Jiang, R.; Zhou, X.; Fang, Q.; Liu, Z. Copper–graphene bulk composites with homogeneous graphene dispersion and enhanced mechanical properties. Mater. Sci. Eng. A 2016, 654, 124–130. [Google Scholar] [CrossRef]
  22. Sadowski, P.; Kowalczyk-Gajewska, K.; Stupkiewicz, S. Classical estimates of the effective thermoelastic properties of copper–graphene composites. Compos. Part B Eng. 2015, 80, 278–290. [Google Scholar] [CrossRef]
  23. Ji, B.; Gao, H. Mechanical properties of nanostructure of biological materials. J. Mech. Phys. Solids 2004, 52, 1963–1990. [Google Scholar] [CrossRef]
  24. Liu, X.; Wang, F.; Wang, W.; Wu, H. Interfacial strengthening and self-healing effect in graphene-copper nanolayered composites under shear deformation. Carbon 2016, 107, 680–688. [Google Scholar] [CrossRef]
  25. Plimptoni, S. Fast Parallel Algorithms for Short-Range Molecular Dynamics. J. Comput. Phys. 1995, 117, 1–19. [Google Scholar] [CrossRef] [Green Version]
  26. Stukowski, A. Visualization and analysis of atomistic simulation data with OVITO—The Open Visualization Tool. Model. Simul. Mater. Sci. Eng. 2010, 18, 15012. [Google Scholar] [CrossRef]
  27. Foiles, S.M.; Baskes, M.I.; Daw, M.S. Erratum: Embedded-atom-method functions for the fcc metals Cu, Ag, Au, Ni, Pd, Pt, and their alloys. Phys. Rev. B Condens. Matter. 1986, 33, 7983–7991. [Google Scholar] [CrossRef]
  28. Muller, S.E.; Nair, A.K. Dislocation Nucleation in Nickel-Graphene Nanocomposites under Mode I Loading. Jom 2016, 68, 1909–1914. [Google Scholar] [CrossRef]
  29. Stuart, S.J.; Tutein, A.B.; Harrison, J.A. A reactive potential for hydrocarbons with intermolecular interactions. J. Chem. Phys. 2000, 112, 6472–6486. [Google Scholar] [CrossRef] [Green Version]
  30. Duan, Z.R. Study on the Mechanical Properties of Tensile and Indentation of Graphene/Cu Nanocomposites; Xi’an University of Architecture and Technology: Xi’an, China, 2017. (In Chinese) [Google Scholar]
  31. Yao, W.P. Molecular Dynamics-Based Tensile Mechanical Behavior of Metal Nanowires; Xi’an University of Technology: Xi’an, China, 2018. (In Chinese) [Google Scholar]
  32. Gregory, V.L.; Christian, V.A.; Vic, V.D.; Paul, G. Ab initio study of the elastic properties of single-walled carbon nanotubes and graphene. Chem. Phys. Lett. 2000, 326, 181–185. [Google Scholar]
  33. Lee, C.; Wei, X.; Kysar, J.W.; Hone, J. Measurement of the elastic properties and intrinsic strength of monolayer graphene. Science 2008, 321, 385–388. [Google Scholar] [CrossRef] [PubMed]
  34. Lv, C.; Xue, Q.; Xia, D.; Ma, M.; Xie, J.; Chen, H. Effect of Chemisorption on the Interfacial Bonding Characteristics of Graphene Polymer Composites. J. Phys. Chem. C 2010, 114, 6588–6594. [Google Scholar] [CrossRef]
  35. Duan, K.; Zhu, F.; Tang, K.; He, L.; Chen, Y.; Liu, S. Effects of chirality and number of graphene layers on the mechanical properties of graphene-embedded copper nanocomposites. Comput. Mater. Sci. 2016, 117, 294–299. [Google Scholar] [CrossRef]
  36. Nam, D.H.; Cha, S.I.; Lim, B.K.; Park, H.M.; Han, D.S.; Hong, S.H. Synergistic strengthening by load transfer mechanism and grain refinement of CNT/Al–Cu composites. Carbon 2012, 50, 2417–2423. [Google Scholar] [CrossRef]
Figure 1. Schematic diagram of simulation method (a) Pull-up model (b) Pull-out model (c) Interface cohesion model.
Applsci 13 03559 g001
Figure 2. Tensile stress–strain curves of copper (Cu) and graphene–copper composites (Cu/Gr).
Applsci 13 03559 g002
Figure 3. Tensile stress–strain curves of pristine graphene.
Applsci 13 03559 g003
Figure 4. Pull-up force–displacement curves at different temperatures.
Applsci 13 03559 g004
Figure 5. Maximum pull-out force–displacement/strength–temperature curves.
Applsci 13 03559 g005
Figure 6. Models of different graphene content (a) 6.71 at% content (b) 8.39 at% content (c) 10.07 at% content (d) 11.75 at% content.
Applsci 13 03559 g006
Figure 7. Pull-up force–displacement curves of different graphene content and topography of different heights. (a) 0.0075 nm (b) 0.75 nm (c) 1.125 nm (d) 1.5 nm.
Applsci 13 03559 g007
Figure 8. Maximum pull-up force/normal strength–graphene content relationship curves.
Applsci 13 03559 g008
Figure 9. Pull-out force–displacement curves of tangential pull-out at different temperatures.
Applsci 13 03559 g009
Figure 10. Interfacial shear strength/average pull-out force–temperature curves.
Applsci 13 03559 g010
Figure 11. Pull-out force–displacement relation curves of different graphene contents.
Applsci 13 03559 g011
Figure 12. Interfacial shear strength–graphene content curve.
Applsci 13 03559 g012
Figure 13. Cohesion–displacement curves at different temperatures.
Applsci 13 03559 g013
Figure 14. Cohesive strength–temperature curve.
Applsci 13 03559 g014
Figure 15. Models of different graphene contents: (a) 12.02 at% content; (b) 15.02 at% content; (c) 18.03 at% content; (d) 21.03 at% content.
Applsci 13 03559 g015
Figure 16. Cohesion–displacement curves at different graphene contents.
Applsci 13 03559 g016
Figure 17. Maximum cohesion/normal strength–graphene content relationship curves.
Applsci 13 03559 g017
Figure 18. Morphology of pull-out interface at different temperatures: (a) 100 K pull-out model; (b) 300 K pull-out model; (c) 700 K pull-out model; (d) 1100 K pull-out model.
Applsci 13 03559 g018
Figure 19. Energy curves of the system and individual copper atoms.
Applsci 13 03559 g019
Figure 20. Pull-up and cohesion simulation system energy. (a) Pull-up model; (b) cohesion simulation.
Applsci 13 03559 g020
Figure 21. Dislocations and dislocation lines under different contents: (a) 6.71 at% internal dislocation; (b) 6.71 at% dislocation line; (c) complete monolayer internal dislocation; (d) complete monolayer dislocation line.
Applsci 13 03559 g021
Figure 22. Stress distribution at different pull-out displacements. (a) global model at 0.0125 nm; (b) graphene stress at 0.0125 nm; (c) global model at 0.625 nm; (d) graphene stress at 0.625 nm.
Applsci 13 03559 g022aApplsci 13 03559 g022b
Figure 23. Load transfer diagram.
Applsci 13 03559 g023
Table 1. Model and method validation data.
Pure CopperGraphene/Copper Composites
ParameterUltimate StrainModulus of Elasticity/GPaUltimate StrainModulus of Elasticity/GPa
Textual data0.085887.650.13215.88
Literature data0.082584.0490.127210.2
Error4.1%4.3%2.6%2.7%
Disclaimer/Publisher’s Note: The statements, opinions and data contained in all publications are solely those of the individual author(s) and contributor(s) and not of MDPI and/or the editor(s). MDPI and/or the editor(s) disclaim responsibility for any injury to people or property resulting from any ideas, methods, instructions or products referred to in the content.

