Abstract
Roundabouts are a common traffic infrastructure, which are supposed to facilitate safe and smooth traffic flow. Electric bikes as a common traffic tool in a lot of cities in China play an important role in relieving traffic congestion due to the rapid increase of motor vehicles on roads. However, compared with cyclists, e-bikers are more vulnerable because of their higher speed when colliding with motor vehicles. In this research, the spatial-temporal distribution characteristics of conflicts between motor vehicles and electric bikes (e-bikes) at signalized roundabouts are explored. First, the time distance method was used to identify conflicts, and the time to collision (TTC) was selected as the discrimination index we proposed for two representative conflict types. On conflict heat maps and conflict distribution during one signal cycle, we found a series of spatial-temporal conflict distribution regularities. Spatially, the proposed two representative types of conflicts were mainly distributed at exit areas and near the outermost circulatory lanes. Conflict Type 1 was mainly distributed around the outermost motor vehicle lanes, and Type 2 was mainly distributed inside the outermost vehicle lanes and behind the second stop line. In time span, both types of conflicts showed rapid increase before reaching a peak at 30 percentile green time and then decreasing gradually after that peak. Type 1 presented a sharp increasing range during 0–10 percentile green time, while the sharp increasing range for Type 2 presented during the 10–20 percentile. The conclusions developed by this article could provide a theoretical basis for improving traffic safety at roundabouts.
1. Introduction
Roundabouts are circular intersections where road traffic only flows in one direction around a central island. As a special type of intersection, roundabouts are widely used in urban traffic because of their unique counterclockwise driving rules, which can transform conflict points into interweaving points [1]. Compared to signalized intersections, a roundabout has smoother traffic flow characteristics [2]. However, due to the rapid increase of vehicles and the use of electric bikes (e-bikes) becoming increasingly popular in urban areas, the operation efficiency of the roundabout is gradually decreasing and has even become a “bottleneck” in urban roads [3,4,5,6]. Nowadays, a lot of measures such as optimizing road geometry design and signalization have been carried out to improve the traffic safety at roundabout management [7,8,9,10,11]. Many of those techniques mainly benefit the motor vehicles at the expense of non-motorized vehicles’ traffic space. Then, the e-bikes with higher speeds have to drive in the ring mixed with motor vehicles, which leads to frequent conflict between motor vehicles and e-bikes. The safety of e-bikes in roundabouts is an increasingly obvious problem. Recently, researchers are showing an increasing interest in traffic characteristics and management at roundabouts and the safety problems of e-bikes at roundabouts.
1.1. Roundabout Management
The continuous evolution of automotive technologies has a profound impact on improving safety and mobility [12]. Some progress benefited by connected and autonomous vehicles also was made for roundabout safety management. Mohebifard, using a two-dimensional point-mass model, introduced a methodology to optimize the trajectories of connected automated vehicles at a roundabout. The trajectory optimization was formulated as an optimization problem that included collision avoidance and path constraints to minimize the total travel time and collision probability of vehicles. The results showed that the travel times, average delays, and collision probability were reduced based on trajectory optimization [13]. Martin-Gasulla developed and tested a Roundabout Manager that acts as a central controller and manages conflicts within the roundabout. In this research, seven strategies were proposed to coordinate CAV trajectories. The results showed that, under any of the strategies proposed, the system guarantees higher throughput with a lower average control delay compared to conventional vehicles’ operation [14]. Wang proposed a roundabout control strategy for connected and autonomous vehicles, which entailed developing a roundabout flow control model to optimize merge-in flows, a merge-in decision model to generate vehicle passing sequence from the optimal flows, and a virtual platoon control model to achieve safe and stable vehicle operations in a circular roundabout platoon to enhance round-about performance while ensuring vehicle safety [2].
Mascio explored the results of first applying jointed plain concrete pavement on an Italian roundabout. This demonstrated that the construction of concrete pavement in an urban roundabout will better manage and slow down fast vehicular flows, increase traffic fluidity in an important junction trafficked by heavy vehicles, and reduce or avoid queues at roundabouts [15]. Sakshaug combined quantitative and qualitative methods in traffic conflict, interaction, and behavioral studies to find out how interactions and conflicts differ between the two roundabout designs and extensively explained that either separating cycle crossings or integrating cyclists with motorists is the safest roundabout design for cyclists [16]. Jensen discussed safe roundabout design problems based on the conversions of intersections to 255 single-lane roundabouts in Denmark and found that the diameter and height of the central island will lead to different safety levels for single-lane roundabouts. Diameters of 20–40 m are safer for cyclists compared with smaller or larger central islands. When the middle of the central islands is elevated 2 m or more above the circulating lane, it is safer for cyclists than roundabouts with lower central islands [17]. Pilko forwarded a multi-criteria and simultaneous multi-objective optimization (MOO) model to optimize geometry, traffic efficiency (TE), and traffic safety (TS) of unsignalized single-lane roundabouts. In this model, they took the main roundabout geometry elements and demand flow rate as design parameters and regarded acceptable levels of TE and TS as optimization objectives and constraints. Preliminary results suggest that the proposed model can optimize the geometry, TE, and TS of urban single-lane roundabouts [18].
1.2. Safety Problems of E-Bikes
Current research on e-bikes’ safety mainly focuses on the mechanism and factors that result in accidents. Papoutsi conducted a survey on e-bike cyclists who were hospitalized due to traffic accidents in one year, based on the analysis of the surveyed cyclists’ personal characteristics, the cause of the accident, and the degree of seriousness of the injury; it was found that 76% of the injured were men, and the average age of the injured was 47.5 years old. Traffic accidents were mainly caused by high-speed driving, improper operation, and lack of concentration. Due to Switzerland’s more strict implementation of the helmet-wearing policy and smaller number of e-bikes than China’s, the cyclists’ degree of injury in China is higher [19]. Wang used the Structural Equation Model to identify and quantify the factors that influence the risky riding behaviors of e-bikes riders. In this research, the four scales of riding confidence, safety attitude, risk perception, and risky riding behavior were extracted to explore the intrinsic causal relationships among the variables that affect risky e-bike riding behavior. Safety attitude was found to be significantly associated with risky riding behaviors [20]. Tijana Ivanišević analyzed the lateral distance parameters of vehicles when overtaking an e-bike and found that there are statistically significant differences in the lateral distance when overtaking an e-bike regarding helmet use, vehicle categories, and speeds of the e-bike. A faster speed of an e-bike led to a shorter lateral distance when overtaking it, and SUV drivers had the shortest lateral distance when overtaking e-bikes [21]. Compared with traditional bicycles, the higher speed and weight of an e-bike was more likely to result in an accident, and it was proposed that electric bikes attract plenty of people who lack riding experience, which has further intensified the traffic safety problems. Based on the data analysis of three local intersections in Norway, it was found that women were at a higher risk of electric bike accidents than men [22]. It was also found that the traffic violation rate of e-bikes is higher than that of traditional bicycles [23]. The average conflict rate for e-bikes was 2.5 times as that for bicycles [24]. The bike type, dividing strip type, bike lane width, temporary on-street parking, and whether or not it is a working day all have a significant effect on cyclists’ behaviors of occupying motor vehicle lanes [25].
1.3. Traffic Characteristics at Roundabouts
In addition, factors such as the personality and gender of cyclists, the waiting position, the bike’s body weight, and traffic volume all have a significant impact on the cyclist’s preferred waiting time and the risk of violations. Compared with the bicycle cyclist, the e-bike cyclist has a more sensitive perception for each risk factor [26]. Based on the survey of the non-motorized cyclists’ traffic behavior at intersections, it is concluded that bicycles and electric bicycles with more probability to violate traffic rules cause a greater interference with motor vehicles. It is supposed that the behavior of running a red light has been tacitly approved as a normal phenomenon in people’s consciousness leading to most violations being red-light running [27]. Factors that cause e-bike traffic accidents mainly include age, gender, car proportion, illegal behavior, and other factors [28]. Among them, illegal behavior can be divided into red-light running, drunk riding, carrying adults riding, and other factors [29].
Based on the analysis of roundabouts in Australia and New Zealand, it was found that about 4 out of 5 of the e-bike accidents at roundabouts are caused by the motor vehicle driver failing to give way to the cyclist because sometimes the driver didn’t notice the cyclists or misjudged their speed. As a result, it is proposed that measures to limit the motor vehicles’ speed in roundabouts and increase the visibility of non-motorized lanes should be conducted [30]. In an investigation of 294 small and mini-sized single-lane roundabouts in Switzerland, average weekday motorized traffic was identified as a major factor in explaining bicycle accident occurrence at roundabouts; it was found that the radius of the central island, the location of the roundabout (intown vs. out of town), and the number of legs were significantly related to bicycle accident occurrence [31]. In a survey of roundabouts in Lund, Sweden, each roundabout was classified into two types, with or without independent non-motorized vehicle lanes. The survey results showed that roundabouts with independent non-motorized vehicle lanes have a lower accident rate. It is concluded that roundabouts with non-motorized lanes are safer [16]. A statistical analysis of accident data on 255 single-lane roundabouts in Denmark showed that the diameter of the center island of a roundabout and the bicycle facilities both have a great impact on the safety of cyclists. Regardless of the speed limit, when the center island diameter is 20–40 m or there is a separate bicycle lane, single-lane roundabouts are always safer than cross intersections [17].
In summary, previous work has investigated the impacts of innovative technologies [32] and the safety issue of conflict-point based autonomous intersection management systems [33]. But this paper focuses on a more recent transportation issues on motor vehicle and e-bikes at roundabout. The above conclusions on bicycle accident mechanisms and the influencing factors of electric are mainly focused on single-lane roundabouts, conventional cross-shaped intersections, and human-powered bicycles. While research on e-bikes at roundabouts is limited, some relevant research on roundabouts mostly considers e-bikes and human-powered bicycles as a whole. Therefore, research exclusively for e-bike safety at roundabouts will be discussed in this paper. Based on traffic conflict technology, this paper explored the conflicts distribution between motor vehicles and e-bikes at roundabouts from the dimension of space and time. It then finds out the mechanism of conflict distribution at roundabouts, which could be expected to improve e-bikes’ safety at roundabouts.
2. Materials and Methods
2.1. Data Collection
Depending on the central island shape and the signal control way, roundabouts can be categorized as different types and different traffic rules for vehicles and e-bikes could be different at different roundabouts [34]. In China, conventional roundabouts with heavy e-bike traffic flow and more frequent conflict are usually characterized as large radius, multi-lanes, circle central island, and four-way cross signalized intersections. For these conventional roundabouts, the two-step left turn is the most used control mode. Therefore, this research targeted the conventional roundabout with a circle central island, four-way cross shape, and two-step left turn signalized intersection as shown in Figure 1.
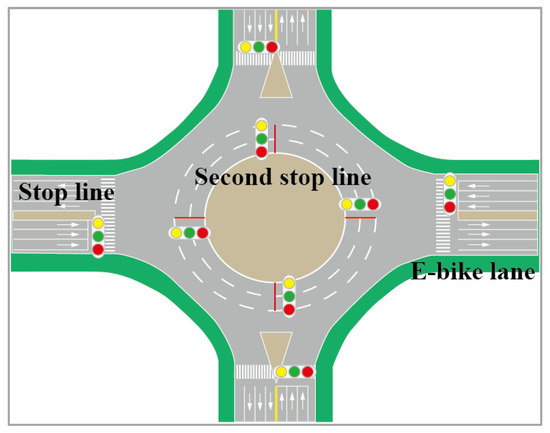
Figure 1.
The conventional roundabout.
To reduce the physical effects of conflicts between vehicles and e-bikes, we selected three roundabouts with similar physical characteristics in Xi’an and Xianyang. The physical specifics of each roundabout are shown in Table 1. Aerial photographs are shown in Figure 2.

Table 1.
Summary of detailed information about roundabouts.
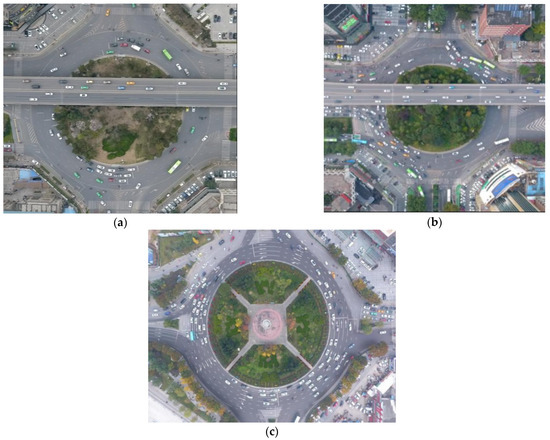
Figure 2.
Aerial view of selected roundabouts. (a) Zhuque; (b) Hanguang; (c) Chenyangzhai.
To determine the minimum sample size, pre-surveys during peak and flat hours were separately conducted from October 14 to 18, 2019. In total, 149 min of video data were collected. After data processing, the standard deviation of the conflicts per unit time (5 min) at the three roundabouts was 6.81. According to Equation (1), the minimum sample size was figured out.
N is the minimum sample size, S is standard deviation, and K is constant; when the confidence level is 95%, K is 1.96. E is the margin error value; when K is 1.96, E is 1.43.
According to Equation (1), we obtained the minimum sample size of 88. The required investigation time was at least 7.33 h. Under the condition of good weather with clear vision, we conducted a formal survey from 28 October to 8 November 2019 (10 working days in total). A total of 9.5 h of video data were obtained.
2.2. Data Processing
Traffic conflict is defined as an event involving two or more road users in which the action of one causes the other to make an evasive maneuver [35]. In this research, the conflict between e-bikes and motorized vehicles in the roundabout is defined as motor vehicles or electric bicycles making a maneuver of braking, turning, deceleration, etc. to avoid crashing at the interweaving area or outer circulatory exit lanes at a roundabout. The interweaving area or outer circulatory exit lanes in the area division at a roundabout shown in Figure 3.
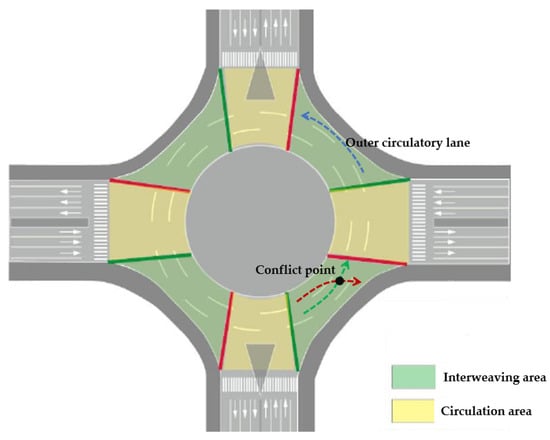
Figure 3.
Area division of circulatory lanes in a roundabout.
How to identify the conflicts between motor vehicles and e-bikes is important for conflict data extracting. The existing methods for identifying traffic conflicts mainly include three methods [36]:
- (a)
- Space Distance Method: Use the distance between both conflict parties as an indicator to judge the severity of the conflict. When the distance between the two is small, the probability of spatial conflict between the two is greater, and the corresponding conflict severity is higher and vice versa.
- (b)
- Energy Method: If a vehicle still maintains its existing trajectory, a collision will occur when the trajectory coincides at a certain moment; the degree of conflict is measured by the amount of energy generated at the time of collision. The greater the energy generated by a conflict between vehicles, the greater the severity of the conflict between the two, and, in the same way, the less energy generated by a conflict between vehicles, the less severe the conflict between two people.
- (c)
- Time Distance Method: The time is calculated based on the actual distance between the two conflict parties and the speed of them. When the time is bigger than the conflict threshold, it is considered that no conflict occurs.
The Space Distance method will cause a large error in the case of low speed, and the Energy Method will be related with the model of vehicles. The Time Distance Method is based on the speed and distance when the two vehicles collide, which is a more scientific way to determine the traffic conflict and is mostly used at intersections. Therefore, in this paper, we selected the Time Distance Method to identify conflicts between motor vehicles and e-bikes.
As a conflict indicator of Time Distance Method, TTC (time-to-collision, referring to the time it takes for two vehicles to keep moving on a track until collision occurs without any braking or avoidance behavior at a certain moment before the collision) is selected as the conflict discriminant indicator. Its calculation formula is given by Equation (2):
where d1 and d2 are the distance of the two vehicles from the conflict point (m), and v1 and v2 are the original moving speeds of the two vehicles (m/s). In this paper, we used Tracker (a video analysis and modeling tool) to extract the trajectory data of vehicles and e-bikes at roundabouts; the average filtering algorithm was used to smooth the trajectory [37]. The specific steps are shown in Figure 4.
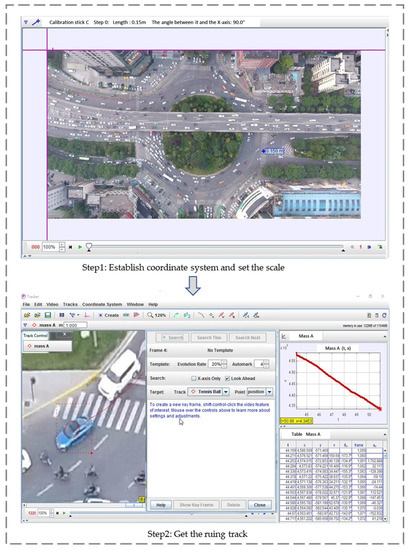
Figure 4.
Trajectory extraction steps.
The trajectory smoothing process was performed by the average filtering algorithm. The comparison between vehicle trajectory and speed before and after processing is shown in Figure 5 and Figure 6. The trajectory before processing was depicted in a yellow line, and the trajectory after processing was in a red line.
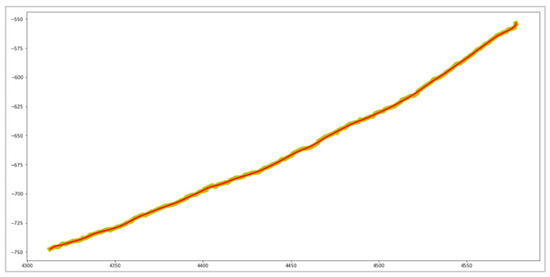
Figure 5.
Smoothing process of trajectory.
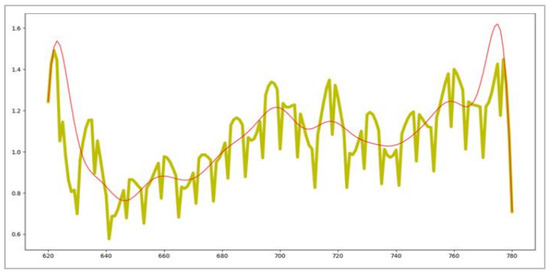
Figure 6.
Smoothing process of speed.
Part of the extracted trajectory data is shown in Table 2.
Table 2.
Trajectory information.
The conflict identify formulations are shown in Equation (3). The risk-avoidance behavior occurred when vehicle and e-bike may collide, that is to say at least one of them would stop, increase or decrease their speed, or change the original trajectory. When the absolute value of acceleration is greater than 4 m/s2 or the direction of movement changes greater than 30 degrees, it is regarded as a risk-avoidance behavior [37].
where La and Lb are the body length of the vehicle and the e-bike (m). Va and Vb in Equation (3) are the speed of vehicle and e-bike (m/s).
According to the obtained trajectory data and conflict identification, 1045 potential conflicts are identified. Part of the conflicts data information is shown in Table 3.
Table 3.
Conflict data information.
2.3. Conflict Type Classification
The types of conflict that may exist were sorted by the weaving of different turning movement trajectories [38]. The following Figure 7 shows the movement trajectories of vehicles and e-bikes at the Chenyangzhai roundabout.
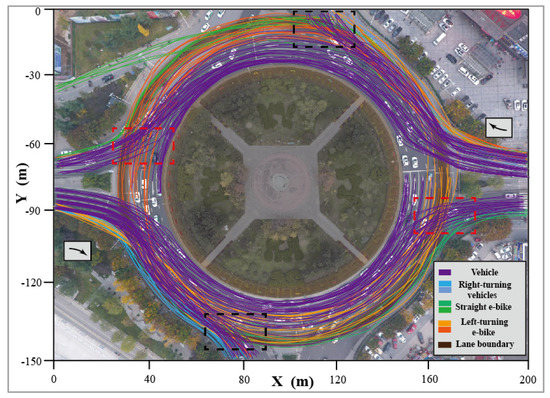
Figure 7.
The trajectory of vehicles and e-bikes during a green light period at Chenyangzhai.
From the statistics of different turning movement trajectories, we summarized the results as follows:
- (1)
- The conflicts between vehicles and e-bikes mainly occurred at exit areas, which accounted for 86.2% of the total conflicts at this roundabout. Those conflicts could be classified into two types: The first is the conflicts between the vehicles driving toward exits with a right-turn movement and the entering e-bike that needed to go straight or turn left, as shown in the black dashed box in Figure 7; The second is the conflicts between vehicles who intend to go straight or turn left released during the previous cycle and the left-turning e-bikes, as shown in the red dashed box in Figure 7. The two types of conflicts between vehicles and e-bikes total 103 times, which means a large possibility of collision.
- (2)
- Apart from the two conflict types mentioned above, conflicts caused by the behavior of lane changing at interweaving areas and the circulation area account for 4.5%, and those that are due to the abnormal behavior of e-bikes (such as the left-turning e-bikes not following the traffic lights and crossing directly through the second stop line) account for 9.3%.
2.4. Conflict Severity Classification
The type of conflict that may occur in trajectory interweaving areas was determined with the analysis of the trajectory of vehicles and e-bikes. However, the trajectory analysis was based on the spatial view that could occur synchronously, and among the data of conflict discrimination results, some of the small traffic disturbances were included too. Therefore, firstly it is necessary to further classify the conflict data into different severity scales.
In this paper, the 85% percentile cumulative curve analysis method was used to classify the severity of the conflicts and divide them into serious conflicts or general conflicts [39] and then eliminate the small traffic disturbances counted in the conflict data before. The cumulative frequency histograms are shown in Figure 8 and Figure 9.
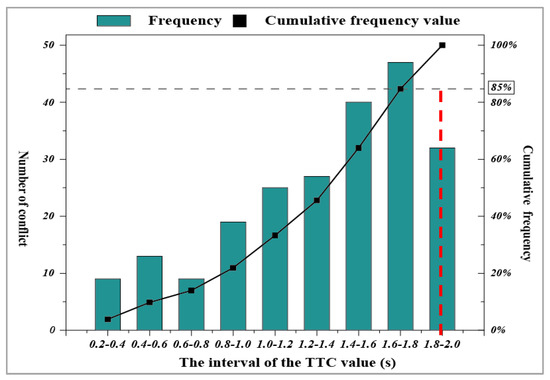
Figure 8.
Cumulative frequency distribution of serious conflicts.
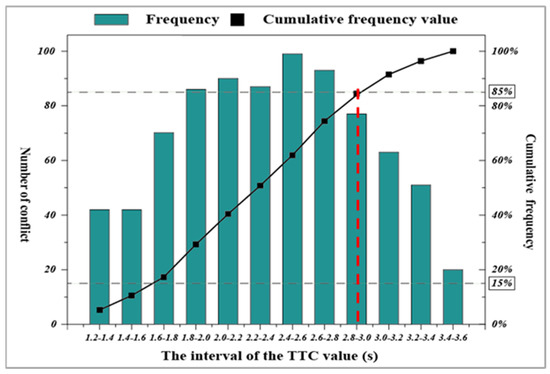
Figure 9.
Cumulative frequency distribution of general conflicts.
Through the video observation by professionals, the judgment of serious conflicts was based on obvious braking, large turns, sudden deceleration, etc. of motor vehicles or e-bikes, and general conflicts are judged based on their slight braking, small turns, slow deceleration, etc. If inconsistent results of judgment came forth, a further discussion was carried out to get the number of serious conflicts and general conflicts finally determined.
Thus, Serious Conflict could be defined as when motor vehicles or e-bikes make obvious braking, large turns, sudden deceleration, etc. to avoid a potential collision. General conflict could be defined as when motor vehicles or e-bikes make slight braking, small turns, slow deceleration, etc. to avoid a potential collision.
Based on the conflict cumulative frequency distribution shown in Figure 8 and Figure 9, a 85% percentile cumulative frequency value was used to determine the boundary of serious and non-serious conflicts. From Figure 8 and Figure 9, we could obtain the threshold of Serious Conflict is 1.7 s, and the threshold of General Conflict is 2.9 s. Traffic Disturbance could be defined when TTC is larger than 2.9 s. The severity of conflict classification result is shown in Table 4.
Table 4.
Classification of conflict severity thresholds.
Based on the classification criteria in Table 4, the total conflict between vehicle and e-bikes at three roundabouts was 871 (the traffic disturbance data could be eliminated from previous conflicts data). Serious Conflict was 168 times, accounting for 19.3%. General Conflict was 703 times, accounting for 80.7%.
The 871 conflicts were classified into four types in Table 5. The conflict times and ratios of 4 conflict types were marked in Figure 10.
Table 5.
Conflict Types at Roundabouts.
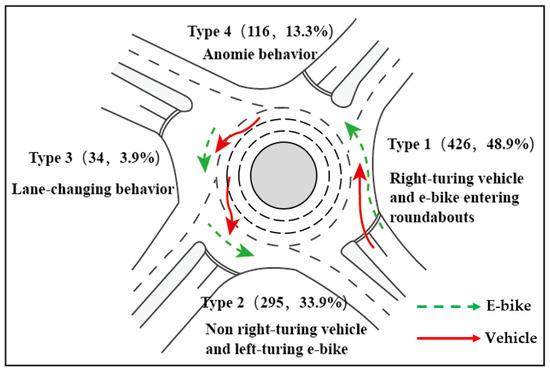
Figure 10.
Conflict times and ratios of 4 conflict types.
As shown in Figure 9, the number of Conflict Type 1 was 426, accounting for 48.9%, Type 2 was 295, accounting for 33.9%, Type 3 was 34, accounting for 3.9%, and Conflict Type 4 was 116, accounting for 13.3%, which was conflicts that occurred under anomie behaviors that could be eliminated by traffic management. Therefore, this research mainly targeted Conflict Type 1 and Type 2.
3. Results
Conflicts space distribution revealed the positions where conflicts occurred while conflicts distribution trends within one signal cycle could show the stage changing characteristics. Therefore, in this research we analyzed the conflicts between vehicles and e-bikes at the roundabouts from the perspective of space and time, respectively. In this section, the space and time distribution characteristics of the conflicts between vehicles and e-bikes at roundabout are clearly presented.
3.1. Conflicts Spatial Distribution Characteristics
To analyze the conflict distribution characteristics between vehicles and e-bikes at roundabouts, we imported the obtained 871 conflicts at three roundabouts into ArcGis, then drew heat maps of general and serious conflict at 3 roundabouts, respectively, as shown in Figure 11. In those conflict heat maps, Label 1 represents Conflict Type 1, Label 2 represents Conflict Type 2.
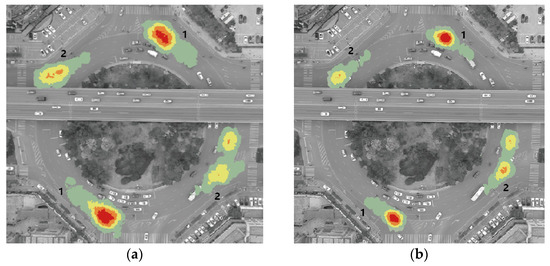
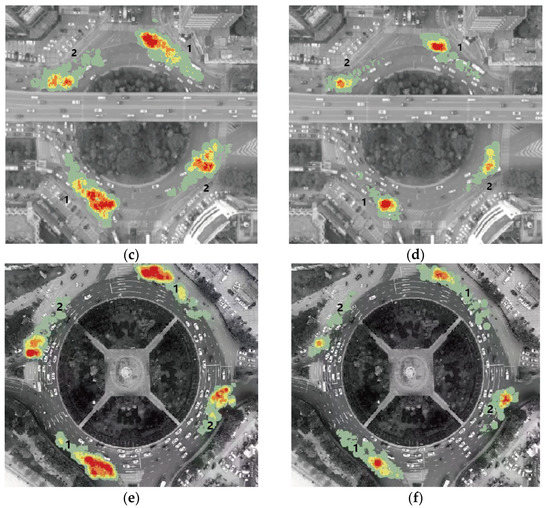
Figure 11.
Conflict distribution heat maps. (a) Distribution of general conflicts (Zhuque); (b) Distribution of serious conflicts (Zhuque); (c) Distribution of general conflicts (Han-guang); (d) Distribution of serious conflicts (Han-guang); (e) Distribution of general conflicts (Chen-yangzhai); (f) Distribution of serious conflicts (Chen-yangzhai).
3.1.1. Distribution Characteristics of General Conflicts and Serious Conflicts
According to Figure 11, the distribution characteristics of general conflicts and serious conflicts at roundabouts could be summarized as follows:
- (1)
- Compared with serious conflicts, general conflicts distribution area is larger on the heat map, and the location of conflict points are more discrete. The distribution of serious conflicts is relatively concentrated with a smaller area on the heat map.
- (2)
- The location where general conflicts and serious conflicts are located are mainly concentrated around the edge of the outermost circulatory lanes, but the general conflict areas are closer to the innermost lanes than serious conflicts areas. The serious conflicts areas are concentrated on the edge of the outermost circulatory lanes.
- (3)
- In the interweaving area, the number of general conflicts is larger than serious conflicts, and most of the serious conflicts are in the areas close to the circulation areas. This illustrates that the conflicts are mainly concentrated on the exit road and around the outer circulatory lanes.
3.1.2. Distribution Characteristics of Two Proposed Conflict Types
For Conflicts Type 1:
- (1)
- On each conflict heat map of each roundabout, it is found that the area of Conflict Type 1 is larger than Conflict Type 2. Due to e-bikes mainly occupying the two outer vehicle lanes when driving around the roundabout, Conflict Type 1 mainly concentrated on the outermost circulatory lanes. Therefore, when vehicles turn right to exit, conflicts with e-bikes will occur there.
- (2)
- In the interweaving area also could be seen conflicts, which mainly occur on the outer vehicle lanes. When vehicles and e-bikes were driving into the roundabout, both of them failed to follow the guidance as e-bikes’ moving trajectories are chaotic without regulations which made right-turning vehicles occur in conflicts with e-bikes before they leave the roundabout.
For conflicts of Type 2:
- (1)
- The area of Conflict Type 2 is smaller than Conflict Type 1 and mainly concentrated inside of the outermost lane and behind the second stop line. In this situation, left-turn e-bikes are most likely to occur in conflicts with vehicles, because left-turn movement will require the longest detour distance. Considering the efficiency, e-bikes may tend to violate the traffic regulations to choose the shortest vehicle lanes rather than the outermost e-bike lane. Under this situation of mixed traffic of vehicles and e-bikes, conflicts occur when vehicles leave the roundabout.
- (2)
- The first reason why Conflict Type 2 occurs less than Conflict Type 1 is that left-turn e-bikes are less than go-straight e-bikes; the second is that left-turn e-bikes need to wait twice when they in the roundabout. As the conflict concentrated area is closer to the secondary stop line and e-bikes are in a state of deceleration, the conflicts in those areas are more discrete than conflicts of Type 1.
- (3)
- Among these three roundabouts, the severity of Conflict Type 2 at Chenyangzhai is most serious. This is due to the largest left-turn e-bikes volume and the layout form of the second stop line. The layout form of the second stop line in Chenyangzhai is a parallel layout, which means both inner and outer lanes’ stop lines are on a line, and the conflict area is farther away from the stop line position. There are fewer vehicles that would like to slow down, so conflicts are more likely to occur. While the layout of the second stop line at Hanguang and Zhuque roundabout is stepped type (the stop line of the inner lanes is in front and the outer stop line is behind), the vehicles on the outer lane (the main subject that conflicts with e-bikes) will be easier to decelerate and stop when passing through the conflict area.
- (4)
- Conflict Type 2 could also be seen in the weaving area, and the happen mechanism is the same as Conflict Type 1.
3.2. Conflicts Temporal Distribution Characteristics
This research extracted the conflicts data that occurred in one green light period of a signal cycle. The general conflicts and serious conflicts distribution trend lines with time changing was plotted in Figure 12. The distribution of Conflict Type 1 and Conflict Type 2 at three roundabouts are shown, respectively.
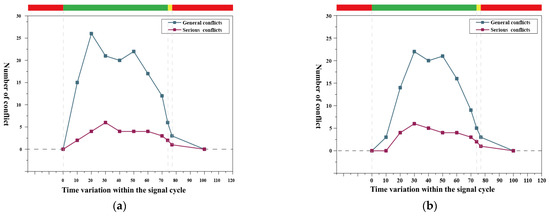
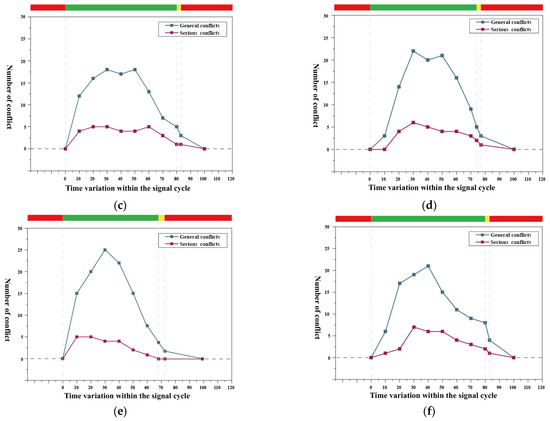
Figure 12.
The distribution of two conflict types during one signal cycle period. (a) Distribution of Conflict Type 1 (Zhuque); (b) Distribution of Conflict Type 2 (Zhuque); (c) Distribution of Conflict Type 1 (Hanguang); (d) Distribution of Conflict Type 2 (Hanguang); (e) Distribution of Conflict Type 1 (Chenyangzhai); (f) Distribution of Conflict Type 2 (Chenyangzhai).
It can be obviously seen that the changing trend of conflicts at three roundabouts all show increasing first and then decreasing. The number of general conflicts increases rapidly at the beginning period of the green time, reaches a peak at the 2nd and 4th ten-second interval and then decreases gradually. The peak of serious conflicts shared a similar period with general conflicts, but the increase and decrease rate is slower than general conflicts which is mainly due to the number of serious conflicts being smaller and more scattered than general conflicts.
To address a general look of the conflict distribution characteristics between vehicles and e-bikes in roundabouts with time changing, in this paper we also analyzed the integrated conflicts data of three roundabouts. The 10% green time length was selected as the interval to study the overall conflicts distribution characteristics. The distribution of Conflict Type 1 is plotted in Figure 13.
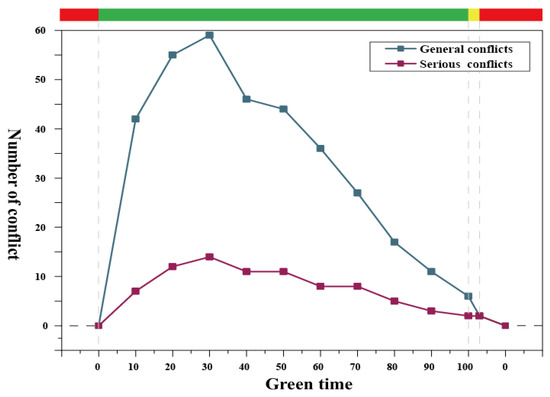
Figure 13.
Overall conflicts distribution of Type 1.
As shown in Figure 12, the distribution characteristics of Conflict Type 1 during one green time could be summarized as follows:
- (1)
- The number of conflicts reached a peak at the 30th percentile green time period, and then gradually decreased to zero when it reached the red light period. During the 0–10th percentile green interval, the conflicts increased most rapidly which is mainly due to the fact that, at the green time beginning point, both right-turning vehicles that need to exit the roundabout and the e-bikes that need to continue go ahead were released together. A large number of vehicles and e-bikes entered the roundabout at the same time and formed interweaving. Before right-turning vehicles exited, as their trajectories are different with the e-bikes and the right-turning vehicles traffic flow is large, plenty of conflicts occurred at the early green time.
- (2)
- With green time moving, vehicle and e-bike traffic flow turns from sharp increasing to flat, and then the conflict growth trend goes down.
- (3)
- During yellow lights, a few conflicts, which were mainly due to some cyclists and drivers wanting to squeeze through before the red light, still exist.
- (4)
- The decreasing speed of general conflicts is faster than that of serious conflicts. This is because the number of serious conflicts is smaller, and the distribution of serious conflicts is flat and scattered, while the general conflicts show a trend of sudden increase and slow decrease.
In the same way, the overall conflict distribution of Type 2 is plotted in Figure 14.
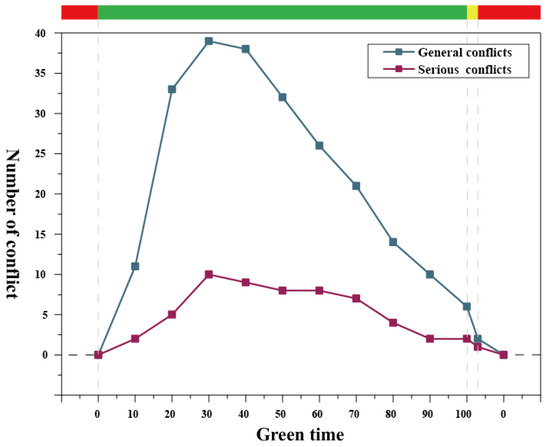
Figure 14.
Overall conflict distribution of Type 2.
The distribution characteristics of Conflict Type 2 during one green time period could be summarized as follows:
- (1)
- The changing trend of conflicts is the same as that of Conflict Type 1. It reached a peak at the 30th percentile green time period, and then decreased gradually. However, for Conflict Type 2, left-turning e-bikes were the main object that conflicted with vehicles, and left-turning will take more time to arrive at the conflicts area. These e-bikes may also collide with the right-turning vehicles who have occurred Conflict Type 1. Thus, conflicts in the first 10th percentile green time period are fewer than Type 1.
- (2)
- When left-turning e-bikes enter the conflicts area, vehicles with the same direction also arrive at this area, but vehicle need to exit the roundabout. Then large numbers of conflicts occur at this area. A rapid growth of conflicts occurred during the 10–20th percentile green time period.
- (3)
- The conflicts occurred at the first 10th percentile green time period mainly caused by those e-bike conflicts with left-turning vehicles that were released in the last signal cycle. Being similar with Conflict Type 1, the trend of general conflicts also showed a sharp increase and a relative gentle decrease. In contrast, Conflict Type 2 increased slowly in the first 10 percentile. For both conflict types, the serious conflicts are flatter and more scattered than general conflicts.
- (4)
- During yellow light time, there are still a small number of Conflict Type 2 that occurred, and the occurrence mechanism is the same as with Conflict Type 1.
4. Discussion and Conclusions
Conflicts between vehicles and e-bikes at roundabouts are usually various. In this paper, the two most representative conflicts, Type 1 and Type 2, were discussed. Conflicts spatial distribution shows that Type 1 is mainly concentrated around the exit and the outermost circulatory lanes, while Type 2 is mainly concentrated at the interior of the outermost circulatory lanes and after the second stop line. Conflict distribution within one signal cycle show that conflicts increase rapidly before reaching a peak and then decrease gradually after that peak with the green time moving. Both types of conflicts reach a peak at 30 percentile green time, but the range of rapid increasing is different. Compared with conventional conflict types [40], many roundabouts in China are carried out with signal control and a second stop line, which will lead to the occurrence of Conflict Type 2, which is also different from other countries in terms of conflict types.
A safety assessments study of 50 urban roundabouts from Rome, Italy developed and validated a Safety Index (SI) for evaluating urban roundabouts and provided a Safety Index for a quantitative safety assessment of both roundabouts and roundabout approaches based on the presence of risk factors [41]. A report from Australia and New Zealand found that four-fifths of the conflicts at roundabouts were caused by drivers failing to give way to cyclists, suggesting that, in many cases, drivers did not realize the presence of the cyclists or misjudged their speed [30]. The conflict occurrence in this paper was mainly caused by the unclear road rights and unreasonable channelization, which is similar. Therefore, exclusive and colored e-bike lanes are necessary to further improve the e-bike’s visibility and clarify its road rights. This will reduce the occurrence of conflict.
This paper mainly analyzed the conflict distribution characteristics between vehicle and e-bike at roundabouts. Though the data of actual accidents was not obtained, the relationship between conflict and accidents was very related. By analyzing the two kinds of data, we can further excavate and avoid safety problems by setting up some traffic control devices at roundabouts. This could include designing advanced warning signs, perceptual measures, or delineation treatments in serious conflict areas to warn vehicles and e-bikes of the high risk of potential conflicts [42], which would be an interesting topic worthy of further study.
The conclusions developed by this article could provide a theoretical basis for formulating improvement measures for roundabouts. Still there are several questions that need to be further explored. Because of the physical attributes, we only analyzed the defined roundabout types in our research. The conflicts between vehicles and e-bikes under different central island radii and control modes at roundabouts still need further study.
Author Contributions
Conceptualization, R.L. and G.L.; methodology, R.L. and G.L.; formal analysis, Y.C. and D.Z.; resources, B.W.; data curation, D.Z., writing—original draft preparation, R.L., G.L. and D.Z.; writing—review and editing, G.L. and R.L.; supervision, G.L. All authors have read and agreed to the published version of the manuscript.
Funding
This research was supported by the General Program of the National Natural Science Foundation of China (No. 52172338), National Natural Science Foundation of China (No. 52002033).
Institutional Review Board Statement
Not applicable.
Informed Consent Statement
Not applicable.
Data Availability Statement
The data presented in this study are available on request from the first author.
Conflicts of Interest
The authors declare no conflict of interest.
References
- Campbell, D.; Jurisich, I.; Dunn, R. Improved Multi-Lane Roundabout Designs for Urban Areas. In Highway Safety; NZ Transport Agency: Wellington, New Zealand, 2012. [Google Scholar]
- Wang, C.; Wang, Y.; Peeta, S. Cooperative Roundabout Control Strategy for Connected and Autonomous Vehicles. Appl. Sci. 2022, 12, 12678. [Google Scholar] [CrossRef]
- Gross, F.; Lyon, C.; Persaud, B.; Srinivasan, R. Safety effectiveness of converting signalized intersections to roundabouts. Accid. Anal. Prev. 2013, 50, 234–241. [Google Scholar] [CrossRef] [PubMed]
- Cherry, C.; Cervero, R. Use characteristics and mode choice behavior of electric bike users in China. Transp. Policy 2007, 14, 247–257. [Google Scholar] [CrossRef]
- Fishman, E.; Cherry, C. E-bikes in the Mainstream: Reviewing a Decade of Research. Transp. Res. 2016, 36, 72–91. [Google Scholar] [CrossRef]
- Rose, G. E-bikes and urban transportation: Emerging issues and unresolved questions. Transportation 2012, 39, 81–96. [Google Scholar] [CrossRef]
- Simović, S.; Ivanišević, T.; Trifunović, A.; Čičević, S.; Taranović, D. What Affects the E-Bicycle Speed Perception in the Era of Eco-Sustainable Mobility: A Driving Simulator Study. Sustainability 2021, 13, 5252. [Google Scholar] [CrossRef]
- Dozza, M.; Francesco, G.; Piccinini, B.; Werneke, J. Using naturalistic data to assess e-cyclist behavior. Trans. Res. Part F 2016, 41, 217–226. [Google Scholar] [CrossRef]
- Schepers, J.P.; Fishman, E.; Hertog, P.; KleinWolt, K.; Schwab, A.L. The safety of electrically assisted bicycles compared to classic bicycles. Accid. Anal. Prev. 2014, 73, 174–180. [Google Scholar] [CrossRef]
- Li, M.; Zhou, X.; Liu, J.; Ma, W.; Li, X. Topological modeling and analysis of urban rail transit safety risk relationship. J. Intell. Manag. Decis. 2022, 1, 108–117. [Google Scholar] [CrossRef]
- Li, M.; Wang, Y.; Jia, L.; Cui, Y. Risk propagation analysis of urban rail transit based on network model. Alex. Eng. J. 2020, 59, 1319–1331. [Google Scholar] [CrossRef]
- Harding, J.; Powell, G.; Yoon, R.; Fikentscher, J.; Doyle, C.; Sade, D.; Lukuc, M.; Simons, J.; Wang, J. Vehicle-to-Vehicle Communications: Readiness of V2V Technology for Application; National Highway Traffic Safety Administration: Washington, DC, USA, 2014; p. 327.
- Mohebifard, R.; Hajbabaie, A. Connected automated vehicle control in single lane roundabouts. Transp. Res. Part C Emerg. Technol. 2021, 131, 103308. [Google Scholar] [CrossRef]
- Martin-Gasulla, M.; Elefteriadou, L. Traffic management with autonomous and connected vehicles at single-lane roundabouts. Transp. Res. Part C Emerg. Technol. 2021, 125, 102964. [Google Scholar] [CrossRef]
- Di Mascio, P.; Loprencipe, G.; Moretti, L.; Corazza, M.V.; Vivaldi, S.; Vincenti, G. Design of the First Italian Roundabout with Jointed Plain Concrete Pavement. Appl. Sci. 2018, 8, 283. [Google Scholar] [CrossRef]
- Sakshaug, L.; Laureshyn, A.; Svensson, Å.; Hydén, C. Cyclists in roundabouts—Different design solutions. Accid. Anal. Prev. 2010, 42, 1338–1351. [Google Scholar] [CrossRef]
- Jensen, S.U. Safe roundabouts for cyclists. Accid. Anal. Prev. 2017, 105, 30–37. [Google Scholar] [CrossRef]
- Pilko, H.; Mandžuka, S.; Barić, D. Urban single-lane roundabouts: A new analytical approach using multi-criteria and simultaneous multi-objective optimization of geometry design, efficiency and safety. Transp. Res. Part C Emerg. Technol. 2017, 80, 257–271. [Google Scholar] [CrossRef]
- Papoutsi, S.; Martinolli, L.; Braun, C.T.; Exadaktylos, A.K. E-Bike Injuries: Experience from an Urban Emergency Department—A Retrospective Study from Switzerland. Emerg. Med. Int. 2014, 2014, 1–5. [Google Scholar] [CrossRef]
- Wang, T.; Xie, S.; Ye, X.; Yan, X.; Chen, J.; Li, W. Analyzing E-Bikers’ Risky Riding Behaviors, Safety Attitudes, Risk Perception, and Riding Confidence with the Structural Equation Model. Int. J. Environ. Res. Public Health 2020, 17, 4763. [Google Scholar] [CrossRef]
- Ivanišević, T.; Trifunović, A.; Čičević, S.; Pešić, D.; Simović, S.; Zunjic, A.; Duplakova, D.; Duplak, J.; Manojlovic, U. Analysis and Determination of the Lateral Distance Parameters of Vehicles When Overtaking an Electric Bicycle from the Point of View of Road Safety. Appl. Sci. 2023, 13, 1621. [Google Scholar] [CrossRef]
- Fyhri, A.; Johansson, O.; Bjornskau, T. Gender differences in accident risk with e-bikes—Survey data from Norway. Accid. Anal. Prev. 2019, 132, 105248. [Google Scholar] [CrossRef] [PubMed]
- Langford, B.; Chen, J.; Cherry, C. Risky riding: Naturalistic methods comparing safety behavior from conventional bicycle riders and electric bike riders. Accid. Anal. Prev. 2015, 82, 220–226. [Google Scholar] [CrossRef]
- Bai, L.; Liu, P.; Chen, Y.; Zhang, X.; Wang, W. Comparative analysis of the safety effects of electric bikes at signalized intersections. Transp. Res. Part D 2013, 20, 48–54. [Google Scholar] [CrossRef]
- Zhang, L.; Zhang, S.; Zhou, B.; Huang, Y.; Zhao, D.; Jiao, S. Exploring Unobserved Heterogeneity in Cyclists’ Occupying Motorized Vehicle Lane Behaviors at Different Bike Facility Configurations. Int. J. Environ. Res. Public Health 2022, 19, 792. [Google Scholar] [CrossRef] [PubMed]
- Yang, X.; Huan, M.; Abdel-Aty, M.; Peng, Y.; Gao, Z. A hazard-based duration model for analyzing crossing behavior of cyclists and electric bike riders at signalized intersections. Accid. Anal. Prev. 2015, 74, 33–41. [Google Scholar] [CrossRef]
- Wu, C.; Yao, L.; Zhang, K. The red-light running behavior of electric bike riders and cyclists at urban intersections in China: An observational study. Accid. Anal. Prev. 2012, 49, 186–192. [Google Scholar] [CrossRef] [PubMed]
- Hu, F.; Lv, D.; Zhu, J.; Fang, J. Related risk factors for injury severity of e-bike and bicycle crashes in Hefei. Traffic Inj. Prev. 2014, 15, 319–323. [Google Scholar] [CrossRef]
- Qian, Y.; Sun, Q.; Fei, G.; Li, X.; Stallones, L.; Xiang, H.; Zhang, X. Riding behavior and electric bike traffic crashes: A Chinese case-control study. Traffic Inj. Prev. 2019, 21, 24–28. [Google Scholar] [CrossRef]
- Wilke, A.; Lieswyn, J.; Munro, C. Assessment of the Effectiveness of on-Road Bicycle Lanes at Roundabouts in Australia and New Zealand. 2014. Available online: https://www.onlinepublications.austroads.com.au/items/AP-R461-14 (accessed on 1 February 2023).
- Daria, H.; Hess, M.; Jordan, D.; Bleisch, S. Investigating Roundabout Properties and Bicycle Accident Occurrence at Swiss Roundabouts: A Logistic Regression Approach. Int. J. Geo-Inf. 2019, 8, 94–105. [Google Scholar]
- Kang, D.; Hu, F.; Levin, M.W. Impact of automated vehicles on traffic assignment, mode split, and parking behavior. Transp. Res Part D Transp. Environ. 2022, 104, 103–200. [Google Scholar] [CrossRef]
- Kang, D.; Li, Z.; Levin, M.W. Evasion planning for autonomous intersection control based on an optimized conflict point control formulation. J. of Transp. Saf. Security. 2022, 14, 2074–2110. [Google Scholar] [CrossRef]
- Guan, X. Driving Behavior Characteristics and Model of the Signalized Roundabout Based on Vehicle Trajectory. Ph.D. Thesis, Chongqing Jiaotong University, Chongqing, China, 2017. [Google Scholar]
- Hauer, E.; Ng, J.; Lovell, J. Estimation of safety at signalized intersections. Transp. Res. Rec. 1988, 1185, 48–61. [Google Scholar]
- Guo, Y. Signal Intersection Safety Evaluation Technology Based on Traffic Conflict Theory. Ph.D. Thesis, Northeast University, Nanjing, China, 2016. [Google Scholar]
- Wang, J. Halcon and OpenCV-based traffic automatic conflicting detecting method and data transaction. J. Tongji Univ. (Nat. Sci.) 2010, 38, 238–244. [Google Scholar]
- Ouyang, P.; Wu, J.; Xu, C.; Bai, L.; Li, X. Traffic safety analysis of inter-tunnel weaving section with conflict prediction models. J. Transp. Saf. Secur. 2020, 8, 1–25. [Google Scholar] [CrossRef]
- Cheng, W.; Zhu, M.; Tong, S. Safety evaluation of signal phasing display at intersection. J. Highw. Transp. Res. Dev. 2004, 21, 113–116. [Google Scholar]
- Daniels, S.; Brijs, T.; Nuyts, E.; Wets, G. Externality of risk and crash severity at roundabouts. Accid. Anal. Prev. 2010, 42, 1966–1973. [Google Scholar] [CrossRef] [PubMed]
- Rella Riccardi, M.; Grazia Augeri, M.; Galante, F.; Mauriello, F.; Nicolosi, V.; Montella, A. Safety Index for evaluation of urban roundabouts. Accid. Anal. Prev. 2022, 178, 106858. [Google Scholar] [CrossRef] [PubMed]
- Galante, F.; Mauriello, F.; Pernetti, M.; Riccardi, M.R.; Montella, A. Effects of Traffic Control Devices on Rural Curve Lateral Position. Transp. Res. Rec. J. Transp. Res. Board 2022, 2676, 162–180. [Google Scholar] [CrossRef]


Disclaimer/Publisher’s Note: The statements, opinions and data contained in all publications are solely those of the individual author(s) and contributor(s) and not of MDPI and/or the editor(s). MDPI and/or the editor(s) disclaim responsibility for any injury to people or property resulting from any ideas, methods, instructions or products referred to in the content. |
© 2023 by the authors. Licensee MDPI, Basel, Switzerland. This article is an open access article distributed under the terms and conditions of the Creative Commons Attribution (CC BY) license (https://creativecommons.org/licenses/by/4.0/).