Abstract
Rivers are a source of life. However, these past years, the sustainability of rivers around the world has been threatened by urbanization, industrialization, and rapid development. These activities put pressure on waterway systems and rivers, leading to the emergence of riverine litter. The lack of understanding of the migration of litter in rivers can affect the decision-making efficiency of policymakers when it comes to riverine litter management. Therefore, the primary objective of this study is to evaluate the travel time for different densities of Floatable Litter (FL) in rivers influenced by river flow velocity. The density of the selected FL was manually determined by assessing litter characteristics of mass, volume, and size. The Sg. Berkelah river in Pahang, Malaysia was used as the simulation medium for the sampling of FL travel time utilizing the extrapolation of the Time of Travel (ToT) approach. The ToT technique utilizes a 30 m distance. The sampling was done under three different river flow velocity conditions. In this study, a correlation analysis between these two variables was carried out and evaluated. The results revealed that magazine papers possess the fastest FL travel time, with T = 43.93 s when v = 0.230 m/s, while cloth possesses the slowest FL travel time, with T = 204.90 s when v = 0.167 m/s. The travel time of FL is not influenced by low-class density, p < 1000 kg/m3, but by other factors that have a stronger influence on the travel time of horizontally migrated litter. This study provides a basic understanding and overview of FL migrating characteristics in rivers for further reference by local authorities for litter monitoring and also future riverine litter studies.
1. Introduction
Rivers are the source of life and provide 0.49% of the total 1.2% of available surface freshwater [1]. Rivers supply a large portion of water for human usage and generally function as the main socio-economic contributors and water resources in any human civilization. Rivers are also the home of endangered wildlife and important biodiversity. According to [2], river ecosystems support a disproportionately large fraction of biodiversity, while acting also as significant corridors for the movement of plants, animals, and nutrients, even though rivers occupy less than 1% of Earth’s surface.
However, in the past years, the sustainability of rivers around the world has been threatened by urbanization, industrialization, and rapid development. High rates of population growth indirectly contribute to more anthropogenic activities such as illegal dumping, ineffective waste management, and littering in public places or directly into rivers and waterways. These continuous activities place pressure on waterway systems and rivers, leading to the emergence of riverine litter.
Riverine litter is the solid waste that is disposed of in the river, i.e., the riverbed and riverbanks [3]. Riverine trash pollution is a growing environmental concern around the world because it has the potential to harm aquatic species’ survival, river ecosystems’ optimal functioning, and local economies [4].
The study of quantifying and estimating the abundance and composition of riverine floatable litter (FL) getting into the ocean is quite popular. However, the transport of litter in rivers is rarely studied. Moreover, the specification of litter characteristics that will likely affect the migration of litter is not given much attention. Litter characteristics such as mass, shape, and density influence litter movements [5]. The physical characteristics of litter affect the extent of litter transportation and distribution patterns in aquatic environments. The density factor is directly related to buoyancy which will determine the persistence of litter in the river by affecting either litter’s migration rate or its sinking to the river bottom. Assessing the migration behavior and transport pathway of riverine litter is important as it fills the ‘knowledge gap’ between marine litter and riverine litter studies by understanding the migration of FL in rivers before it gets into the ocean.
The dynamics of litter migration behavior in rivers are caused by many factors linked together. However, there are still few studies on the factors, either individually or collectively. For instance, flow rate determines the fluxes of pollutants in rivers [6,7,8], and flow velocity is a component in determining flow rate where the higher river flow rate results in higher flow velocity. However, the effect of a river flow velocity as a factor influencing the litter flux and its migration is still understudied.
An extrapolated methodology for the study of riverine litter is outlined and can easily be adapted as it does not cost much. However, there are no significant guidelines for understanding the migration of riverine litter (i.e., how long the litter remains in the river before getting into the ocean, its flow velocity), which is essential to assist further study on the fate of land-based sources of riverine litter. Therefore, the purpose of this study is to evaluate the travel time for different densities of floatable litter and the relationship between them. There are several benefits of evaluating and understanding the travel time of FL with different densities, e.g., it can provide for comprehensive litter monitoring and effective litter capture in rivers.
2. Materials and Methods
2.1. Research Design Framework
Figure 1 illustrates the research design framework for achieving the objectives of this study. The methods are organized following the objectives of the effectiveness of data collection and time-saving.
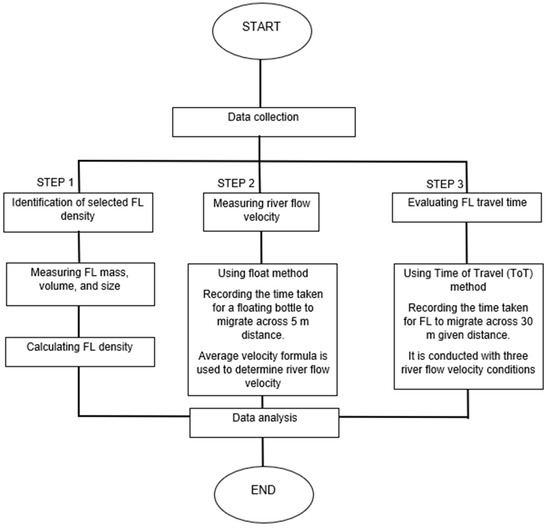
Figure 1.
Research design framework.
From Figure 1, Step 1 of data collection was identifying the characteristics of FL by measuring FL mass, volume, and size. Then, FL density was calculated using the data collected from the parameters measured. Step 2 was determining river flow velocity using the float method [9] to acquire river flow velocities representing three different conditions. Step 3 was evaluating FL travel time using the Time of Travel (ToT) method [10,11] for the three conditions of river flow velocity.
2.2. Selection of Objects Representing FL
The 20 objects selected for the FL were referred to as the top 10 common riverine litter found in previous riverine litter studies—Sg. Batu, Kuala Lumpur [3]; Adour River, Southwest France [12]; Tiber River, Western Mediterranean Sea [13]; and Llobregat River, Barcelona [14]. The study of riverine litter at Sg. Batu, Kuala Lumpur is the main reference used before considering the items listed from other studies. Table 1 shows the list of 20 selected objects representing FL.

Table 1.
The information of the 20 selected objects representing the common FL found in rivers.
2.3. Measuring Physical Characteristics of Floatable Litter: Mass, Volume, Size, and Density
2.3.1. Mass, Volume, and Size of Floatable Litter (FL)
The mass of the selected FL was measured using the electronic mass balance. The standard unit was recorded in grams (g) but later converted to kilograms (kg) to comply with the density standard unit, kilogram per cubic meter (kg/m3).
The volume of selected FL was measured using the basic volume formula (for geometrical objects) and water displacement method (for non-geometrical objects). This is because the FL were in various shapes, which were categorized into geometric shapes and non-geometric shapes. For geometric-shaped FL, the volume was determined using the basic volume formula as in Equation (1):
Volume, V = Length, L × Width, W × Height, H
Specifically, the rectangular-shaped formula was used, as most of the geometric-shaped FL are rectangular. The volume of objects with a cylindrical shape (i.e., aluminum can) was determined directly from the stated volume on the product label. For non-geometric-shaped FL, the volume was determined using the water displacement method as in Figure 2.
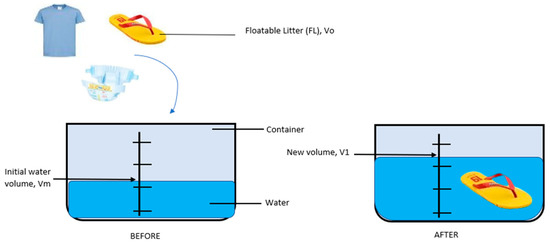
Figure 2.
Water displacement method. Source: Author.
The volume of non-geometric FL was calculated using Equation (2):
where Vo is the volume of the object, V1 is the new water volume after the object is immersed, and Vm is the initial water volume.
Vo = V1 − Vm
For non-geometric-shaped FL that floats in water, a 10 g weightage—a sinker—was tied to a thread and attached to the FL to make the FL sink and become fully immersed. The initial water volume, Vm, was recorded. Next, the sinker and FL which were tied together were lowered gently into the container to avoid splashing. The new water volume, V1, was recorded. The volume of FL was determined using Equation (3):
where Vw is the volume of weightage. For FL with known volume (i.e., mineral bottle, aluminum can, glass bottle, body wash bottle, sanitizer bottle), the volume was recorded directly.
Vo = V1 − Vm − Vw
The size of each selected FL was measured in at least two dimensions (height × width) only to give a picture of the FL size. The FL height and width were measured using a measuring tape in cm.
2.3.2. Density of Floatable Litter (FL)
The density of an object is the mass of the object divided by its volume. The density of each FL was calculated using Equation (4) after the mass and volume of FL were measured as per Section 2.3.1.
where ρ is density (kg/m3), m is the mass of objects (kg), and V is the volume of objects (m3).
Density, ρ = m/V
2.4. Measuring River Flow Velocity
The river chosen for the simulation medium was Sg. Berkelah, Pahang as shown in Figure 3. It is about 31–35 km away from Kuantan City in the direction of Maran. The part of Sg. Berkelah used for field testing is located in Hulu Lepar, Malaysia Gambang; 41.6 km west of the nearest estuary, 5.38 km south of the Sg. Berkelah Waterfall landmark. The coordinates are 3.705124 N, 102.980644 E. Figure 3A–C is pictures showing the location of Sg. Berkelah and the selected river section.
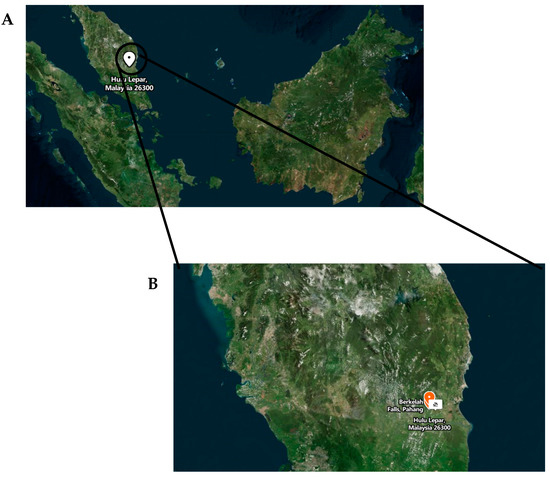
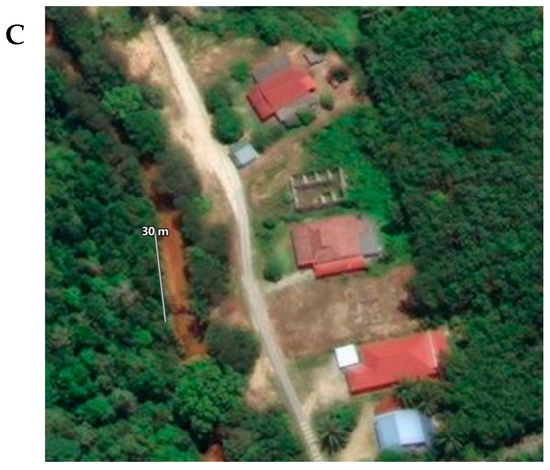
Figure 3.
The pictures to show the location of Sg. Berkelah. (A) Map of Malaysia. (B) Location of selected Sg. Berkelah river section. (C) The picture of the exact river section of Sg. Berkelah. Source: Google Map.
River flow velocity is the measure of the speed of river water flows. The method used is extrapolated from the float method suggested by [9]. The float method is a simple method for measuring the flow rate of a river with an open channel and is suitable for rivers with small to large water flow and calm waters. River flow velocity was determined using the general formula of velocity, which the formula is part of the float method equation. The parameters are measured to calculate flow velocity using the general velocity formula as in Equation (5).
where v is river flow velocity (m/s), Δs is the distance between two points (m), Δt is the time taken for the float bottle to travel between 2 points (s), and correction factor = 0.85.
Flow velocity, v = (Δs/Δt) × correction factor
Firstly, for a 5 m float distance, m was measured and two points were marked along the channel. The minimum float distance required is 3 m. The average width and depth of the river were measured for information on the river’s physical characteristics. River depth was measured at three points across the channel’s cross-section; which are at the west riverbank, middle of the river, and east riverbank. Then, the average of the depths was calculated. River depth was recorded for Condition A, B, and C of river flow velocity. This is by assuming that river widths are the same along the river section. Figure 4 shows the selected river section of Sg. Berkelah has a straight riverbank.
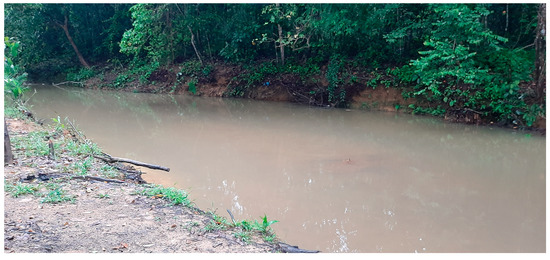
Figure 4.
River section of Sg. Berkelah, Pahang was used as the simulation medium. Source: Author.
A bottle was used as the float bottle. The bottle was partially filled with water. The floating bottle was tossed from upstream at Point A of the river channel and the timer started. When the bottle reached Point B downstream, the timer was stopped. The floating bottle was tossed in the middle of the river channel. The floating bottle tossing process was repeated three times and the average of the time taken, s, was calculated. This float method was conducted in three river flow conditions—Condition A, Condition B, and Condition C—and the tossing of the float bottle was at the same place for all conditions, which was at the middle of the river channel. The river flow velocity was calculated using Equation (5) after all data required were measured.
Three conditions for measurements were made, which were: (1) Three hours after rainfall on the day of heavy rainfall (three days straight rain) (Condition A); (2) Three hours after rainfall on the day of light rainfall (Condition B); (3) A sunny day (Condition C). Wind and turbulence conditions for each condition were observed.
2.5. Evaluating Floatable Litter Travel Time Using the Time of Travel (ToT) Method
The Time of Travel (ToT) method is extrapolated from the study by [10,11]. The concept of the ToT method is using the tracer technique to measure the flow velocity and diffusion of a river, in which the dye concentration downstream is plotted against time. The factors/input accounted for are the source of RL, input time, approximate pollutant quantity, and major abstractions [11]. Balas et al. applied the ToT method to calibrate the riverine litter propagation (RLP) model, by determining the ToT of their plastic tracer.
The Time of Travel (ToT) method was used in this study to understand the migration of each FL for its travel time in the river before it gets into the ocean. Extrapolating from [10], instead of applying the dosing site concept for the tracer technique as in study [11], each litter is considered as the tracer. The migration pattern of FL is not covered. The distance for ToT monitoring—reach length—at the river was 1 km. The reach lengths must be in the range of not greater than 10 km and not less than 1 km (Inverarity et al., 1988). However, the accessible reach length of the selected river is less than 1 km. Thus, the distance used for ToT monitoring was 30 m as suggested by [15].
FL migrating simulation was conducted using Sg. Berkelah as the simulation medium. Then, the travel time for FL to migrate across the 30 m given distance was recorded using the ToT method. Two observers were needed; one observer stood at the top of the reach length (Point A) and the second observer stood at the bottom of the reach length (Point B). The FL was uniformly distributed evenly across the width of the river at the top of the reach length; the timer started when it crossed the upstream point. As soon as the FL crossed the bottom reach point, the timer was stopped. All FL was trapped back at the bottom point. The ToT monitoring process was repeated three times and the average of the time taken, s, was calculated. This ToT method was conducted in the three river flow conditions—Condition A, Condition B, and Condition C—after conducting the float method for determining river flow velocity. The tossing of FL was at the same place for all conditions; in the middle of the river channel. Figure 5 is an assist diagram for the FL travel time using the ToT determination method.
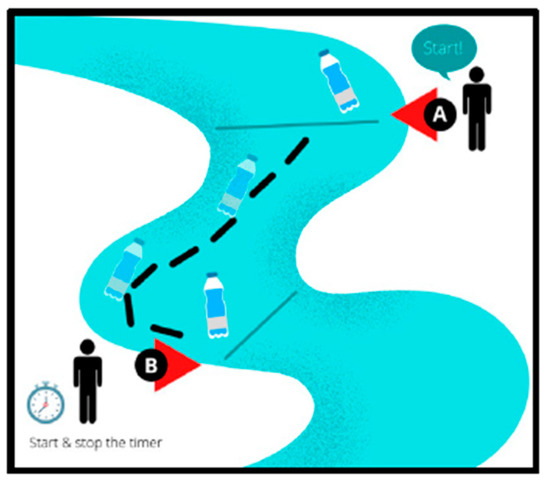
Figure 5.
Time of Travel (ToT) Method. Point A is the starting point for FL being tossed and the timer starts. Point B is where the timer stops when FL passed the point. Source: Author.
The application of both the river float method and the Time of Travel (ToT) method is almost similar, despite the distance used.
2.6. Data Analysis
Statistical data analysis was carried out using Statistical Package for the IBM Social Sciences (SPSS) Version 23, manufactured by IBM Corporation, New York, NY, USA. The product license and access to this software were sourced from the Department of Environmental Science, Faculty of Forestry and Environment, UPM.
Normality, Descriptive Analysis, Kruskal Wallis, and Spearman correlation tests were used in this study to understand the results further.
Descriptive Analysis was conducted to describe the characteristics of the FL density and travel time data, respectively. The information obtained includes the mean, standard deviation, and minimum and maximum value of the data collected. It also shows the distribution of the data, which helps to detect typos and outliers as well as to identify similarities among variables, thus providing ideas for further statistical analyses. Descriptive analysis is not conducted for river flow velocity data because the data was measured purposely as an independent variable of this study. Moreover, there were only three data sources of river flow velocity; thus, not much data analysis can be conducted.
Normality testing was conducted for FL density and FL travel time data to determine the data distribution. Results show that both FL density and FL travel time data were not normally distributed. This brings us to the non-parametric tests which are the Kruskal-Wallis test and Spearman correlation test.
Kruskal Wallis test was conducted to compare and determine whether there is a statistically significant difference in the FL travel time data set between different conditions of river flow velocity. Statistically significant differences in the FL travel data set shows that the data set is reliable when there is a difference in FL travel time with the different river flow velocity.
The Spearman correlation test was conducted to understand the association between FL density and its travel time in the river. The value coefficient, rs, or ρ explained the strength and direction of the association between these two continuous variables.
3. Results and Discussion
3.1. Analysis of Floatable Litter Characteristics
The objects selected are all floatable but are made up of different types of material. The FL physical characteristic parameters measured in this study are mass, volume, size, and density as shown in Table 2.

Table 2.
Physical characteristic parameters of floatable litter.
From Table 2, the biggest mass value, m = 0.277 kg, is a wood board (FL15) while the smallest mass value, m = 0.001 kg, is that of a cigarette butt (FL12). Mass is the measure of the amount of matter in an object. Mass is proportional to density; thus, the mass of FL is considered to be among the main physical characteristics of FL that affect its migration in rivers.
For volume, the biggest volume is that of the cardboard box (FL10) with V = 0.003033 m3 while the smallest volume is V = 0.000006 m3 for the cigarette butt (FL12). Relating the volume and size of FL, FL10 is the largest while FL12 is the smallest FL. Volume is the amount of space taken up by a three-dimensional object. In another word, the volume represents the size of an object. Thus, FL10 and FL12 have the largest and smallest volume, respectively. However, for cloth (FL9), the volume is low, V = 0.000090 m3, even though it is large in two-dimensional size, 57.0 × 46.2 cm. For the parcel bag (FL18) the volume is only V = 0.000045 m3 while its size is 26.0 × 23.0 cm. This shows that the volume of an FL is lower despite its two-dimensional size when it is thin. The volume of FL is measured as one of the important FL characteristics because the volume is inversely proportional to density. volume change directly influence the density value.
The biggest FL in size is 10.8 × 10.8 × 26.0 cm, a cardboard box (FL10), while the smallest size is 3.5 × 0.8 cm, that of the cigarette butt (FL12). According to [16,17], the size factor does affect its migration behavior. However, in this study, the size factor is not considered in studying FL travel time but, rather, as additional information in identifying each FL.
Next is FL density. The range of FL density is 4.76–1154 kg/m3. Among all FL, cloth (FL9) has the highest density, ρ = 1154.44 kg/m3, while the FL with the lowest density is food polystyrene (FL5), ρ = 4.76 kg/m3. Explaining the concept of FL density, the density of an object is the mass of an object divided by its volume. Density is proportional to mass but inversely proportional to volume. In other words, density increases with mass if the volume is constant. An object has a higher density when it is heavier and more compact. Comparing the mass and volume of a 1.5 L mineral bottle (FL1) and 0.5 L mineral bottle (FL2), the mass and volume of FL1 are higher (m = 0.028 kg, V = 0.0015 m3) than FL2 (m = 0.015 kg, V = 0.0005 m3). Meanwhile, the density of FL1 is lower, ρ = 18.96 kg/m3, than FL2, ρ = 30.94 kg/m3. Taking the ratio of mass-to-volume, the ratio of FL1 is smaller than FL2, being 1:53 and 1:33, respectively. Thus, FL1 density is lower than FL2. Another example is the wood board (FL15) (m = 0.277 kg, V = 0.000388 m3), which has the biggest mass but the second highest density. Instead, cloth (FL9) (m = 0.104 kg, V = 0.00009 m3) has the highest density with its fourth rank position in mass value. This is due to the smaller mass-to-volume ratio of FL15, which is 1:0.0014 compared to FL9 which is 1:0.0008.
From Figure 6, the density of FL is classified into a range to see the distribution of FL density. A total of 13 out of 20 (65%) FL have a density in the range of 4.76–173.33 kg/m3 which is under 200 kg/m3. Meanwhile, 9 out of 13 (69%) of the FL with a density under 200 kg/m3 are plastic. Only sanitizer bottles (FL19) and parcel bags (FL18) are of a plastic type that has a density of more than 200 kg/m3, alongside other types of materials. However, most FL is classified as low-density which is <1000 kg/m3. Except for cloth (FL9) which is classified as high-density. The density classification is referred to [18], where density is classified into three classes based on average water density: (i) low density (<1000 kg/m3); (ii) intermediate density (1000–1100 kg/m3); and high density (>1000 kg/m3).
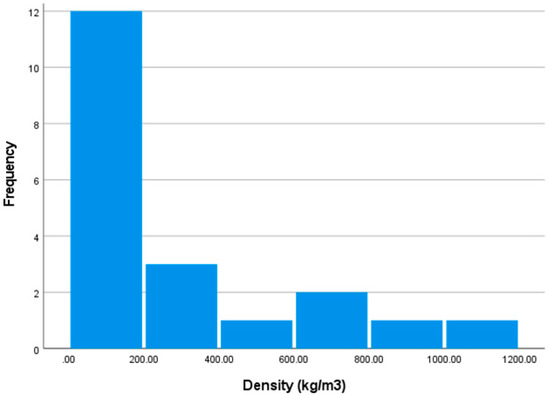
Figure 6.
The distribution of FL density according to the given class.
From Figure 6, the majority of FL selected in this study is plastic based. The most plastic type has a low-density class. They are less dense than metal, but they can have a similar density to wood. Plastic molecules are in a polymer structure which can be exceedingly lengthy and branching, making them difficult to ‘fit’ together. As a result, they are not as dense as metals, since they are not as tightly packed. Hence, the selected FL which is plastic is commonly found in rivers, as suggested by previous studies. In addition, this floating litter is commonly found in the ocean, where plastic is the major constituent of floatable marine litter composition.
3.2. River Flow Velocity as The Medium of Field-Testing
The velocity of a river refers to the speed at which water flows through its course. River flow velocity influences the migration of FL in rivers. River width and depth were measured for information on the river’s physical characteristics. Assuming the river width is constant, the average width is 12.192 m. Three river depths were measured across the river for each condition. The depths are inclining from the west to east riverbank. The upstream of the river is north. The depth values are presented in Table 3 with other values of the required parameters in determining river flow velocity using the float method.

Table 3.
Parameters required for river flow velocity measurement.
The highest value of river flow velocity, v = 0.297 m/s during Condition A, was measured three hours after rainfall on the day of heavy rainfall (three days straight rain). The second highest is v = 0.167 m/s during Condition B, which was measured three hours after rainfall on a day of light rainfall, while the lowest flow velocity is v = 0.144 m/s during Condition C, which was a sunny day. The different values of river flow velocity depend on the amount of precipitation in the Sg. Berkelah area during each condition. Condition A has the highest river flow velocity because the amount of precipitation can be the highest during that condition, which is three days of heavy rainfall. Meanwhile, for Condition B, the precipitation is expected to be less due to the light rainfall. There was no rain occurring during the sunny days of Condition C; thus, the river flow velocity is the lowest.
3.3. The Floatable Litter Travel Time with Different River Flow Velocity
The collected data of FL travel time for different river flow velocities have been analyzed. The results of each FL travel time in three conditions of different river flow velocities have been presented in Table 4. The travel times A, B, and C are represented, respectively. Figure 7 shows a summary of the graphical presentation of travel time for each FL with different densities during three different conditions of river flow velocities.

Table 4.
The list of FL travel times during each condition.
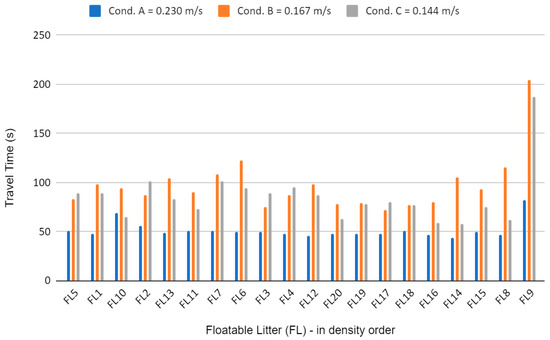
Figure 7.
The travel time for different densities of FL for three river flow velocity conditions.
The collected data contained a high variation for the travel time in all conditions. The distributions of FL travel time were statistically significant differences between Condition—A, B, and C, H (3) = 37.365, ρ < 0.001. This shows that the different values of flow velocity result in the different value data sets for FL travel time. The higher river flow velocity results in a shorter FL travel time. Flow rate determines the fluxes of pollutants in rivers [6,7,8], while river flow rate affects river flow velocity [1].
In Condition A, the travel time for each FL is almost the same except for the cloth (FL9) and the cardboard box (FL10). The travel time of FL9 is the longest, T = 82.00 s, as it has the highest density, ρ = 1154.44 kg/m3, while FL10’s travel time is the second longest despite its low density. Size can be the factor influencing its travel time, as FL10 is the biggest, and most of its area is floating and exposed high up to the atmosphere. The higher the FL area exposed to the atmosphere is, the higher the wind resistance that will act upon the FL. Thus, more wind resistance causes the FL movement to be slower and results in longer travel time. According to [19], the exposed area of litter affects the transportation process.
In Condition B, FL travel time varies and is mostly longer compared to FL travel in Condition C except for the 0.5 mineral bottle (FL2), body wash bottle (FL3), and slipper (FL17). Turbulence can be the factor causing longer travel time for most of the FL. Turbulence occurs due to the alternating rock densities along a riverbed, where the water will speed up in places with less resistant rocks and slow down over the more resistant rocks. The flow regime at various points along the river is also influenced by the river’s cross-sectional shape. The river depth of Sg. Berkelah as the field-testing medium declines along the cross-section. There were many turbulence points observed during Condition B. Moreover, turbulence can also cause the dispersion of FL, which results in longer travel time once it is displaced from the straight path, even though all FL were tossed from the same point. Turbulent flow causes a change in fluid direction and magnitude [20]. The travel time of FL2, FL3, and FL17 is longer in Condition B than their travel time in Condition C. The wind factor can be the reason for the FL moving faster and further when the wind and river flow in the same direction. According to [21], wind factors can cause floating litter (i.e., air-filled containers such as PET bottles or low-density expanded polystyrene (EPS)) to move faster and further and have a higher tendency to accumulate at the riverside and coastal areas.
In Condition C, all FL travel times are longer than Condition A except for the cardboard box (FL10). The FL travel time of Condition C is compared to Condition A because the different patterns of FL travel time can be observed significantly between these two conditions, where the travel time increases with the increase in river flow velocity. However, the increase in the FL density value does not determine the increase in FL travel time specifically. The FL travel time is highly distributed with the increase in density value. For FL10, its travel time is shorter, T = 65.28 s, than in Condition A, T = 69.00 s. Wind factors can influence the travel time of FL10 to be the shortest during Condition C compared to other conditions because FL10 was seen to be dispersed quite far from the displacement between Point A and Point B due to the sudden occurrence of turbulence.
The travel time of the crisp packet (FL6) with density ρ = 91.400 kg/m3 is longer than many other FLs with a higher density range, ρ = 92.400–91.620 kg/m3, in all conditions. The FL6 travel time, T = 122.01 s, is the second longest after the FL9 travel time, T = 204.90 s, during Condition B. Another factor that can affect the travel time of an FL despite its density is the entrance of river water into FL, especially for FL with an opening (i.e., the mouth of a bottle) and cavity. The FL term used in this study defines the solid waste being disposed into the river. Thus, most of the FL is expected to have openings because they are waste. Other than a crisp packet (FL6), the aluminum can (FL7) and cardboard box (FL10) are a few examples of FL with the possibility of water entrance. The water entrance will directly increase the FL density because the mass of FL has increased while the FL volume is constant. From the velocity formula, mass is directly proportional to density when the volume is constant. Overall, some regularities were not met (e.g., higher river flow velocity causes faster time taken for FL to migrate) due to uncontrolled conditions occurring during the on-field simulation. Moreover, most of these uncontrolled conditions are not considered to be within the scope of the present study.
In summary, magazine paper (FL14) travels the fastest both in Condition A and C which are T = 43.93 s (mean ± SD; 51.478 ± 8.870) and T = 57.65 s (mean ± SD; 85.30 ± 27.46), respectively. In Condition B, the fastest FL traveled was slipper (FL17), T = 71.95 (mean ± SD; 97.56 ± 6.44). FL9 travels the slowest in all conditions, A, B, and C, which are T = 82.00 s, T = 204.90, and T = 186.75 s, respectively. Overall, the fastest FL traveled is magazine paper (FL14) with T = 43.93 s (mean ± SD; 51.478 ± 8.870) during Condition A (V = 0.230 m/s). The slowest an FL traveled is cloth (FL9), for which T = 204.90 s (mean ± SD; 97.557 ± 28.816) during Condition B (V = 0.196 m/s).
Table 5 shows the descriptive statistic for each FL in the different conditions of river flow velocity.

Table 5.
Descriptive statistics for the FL travel time in Condition A, B, and C.
3.4. Relationship between Floatable Litter Density and Travel Time
Figure 8 shows the scatterplot of FL travel time against FL density in three different river flow velocity conditions. The pattern of the change in FL density toward the change in travel time is observed.
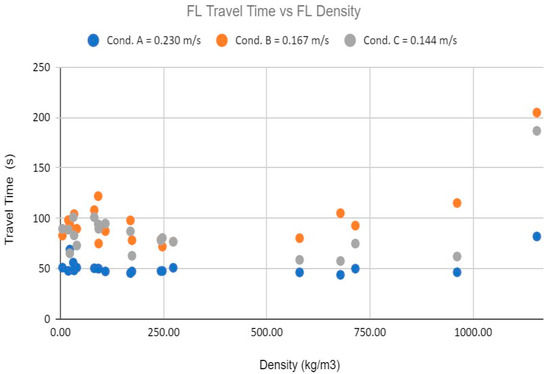
Figure 8.
FL travel time vs. FL density in all conditions.
Preliminary analysis showed the relationship to be monotonic, as assessed by visual inspection of a scatter plot. A Spearman’s rank-order correlation analysis result shows there was no statistically significant correlation between the travel time and density of floatable litter (FL): rs = 0.098, ρ = 0.457. From the scatter plot, no distinguishable pattern of a relationship between density and travel time is observed for FL with ρ < 750 kg/m3 in all conditions. However, a pattern starts to form when FL density ρ > 750 kg/m3 where the FL travel time increases with density. This shows that FL travel time might change with FL density value—negatively correlated—when the density value is in the intermediate- to high-density class, ρ > 1000 kg/m3. FL travel time is not influenced by the density factor when the FL has low-class density, ρ < 1000 kg/m3. Moreover, according to [20], the horizontal transport of FL with a high density in rivers is dominant due to the higher current strength or turbulence in rivers. It causes the FL to remain buoyant and tend to transport horizontally rather than vertically.
The correlation analysis result shows there is no relationship between the density factor and the travel time of FL. The negative correlation explains if there is any possibility for density to be affecting FL travel time, the higher FL density might result in a shorter travel time of FL migrating in rivers. The insignificant correlation between these variables might be caused by or influenced more by other factors. The overall findings from this FL travel time during different river flow velocity conditions were based on the real situation, where there are many other factors—both the litter’s physical characteristics and environmental parameters—influencing the migration of FL through the migrating simulation, as explained in Section 3.3.
In summary, the different density of FL does not explain the change in FL travel time because density value has more influence on the vertical transport of FL than horizontal transport of FL in rivers. While the majority of FL migration across the simulation distance is in horizontal transport mode. However, there seems to be a trade-off between vertical and horizontal transport of litter in which, during the low influence of vertical transport, the FL migration behavior is more influenced by horizontal transport. The density factor has no significant effect on FL horizontal transport; instead, other factors (e.g., wind, shape, turbulence) can influence the FL travel time more. Moreover, the density values of FL evaluated are very low which causes the tendency for horizontal transport to happen more.
4. Discussion
The measurement of mass, volume, and size of FL is crucial to obtain the FL density value. The relationship between these parameters explains the density values. For example, FL2 has a higher density compared to FL1, while FL2 has a smaller mass and volume compared to FL1. This is because an FL with a high mass value is not necessarily going to be high-density, especially when it has a small mass-to-volume ratio. The relationship between density, mass, and volume shows how density measures the mass-to-volume ratio of an FL, with a higher ratio indicating more density [22]. The density value is higher when the fraction value is larger. The fraction is larger when the first number (the numerator) is greater than the second number (the denominator).
This shows that knowing the density of FL will explain the FL migration in rivers more compared to only considering the FL size and mass separately. Density value is important in identifying a variety of substances and objects [22]. Density offers a convenient means of obtaining the mass of an FL from its volume and vice versa. Moreover, for floatable objects, the small difference in density value affects the submergence level of objects in the river and their buoyancy.
The majority of FL selected in this study are plastic. This is because about 80% of riverine and marine litter is plastic [23,24]. Polyethylene is the world’s most common plastic. Polyethylene plastic is categorized into high-density (HDPE), low-density (LDPE), and linear low-density plastic. HDPE and LDPE plastics are more common. The average density of HDPE and LDPE plastics are 941–965 kg/m3 and 910–925 kg/m3, respectively; both categories are in the low-density class, <1000 kg/m3
Moreover, the lower density of litter results in a lower sedimentation rate compared to litter with a higher density that tends to sink more easily. The low sedimentation rate of litter causes it to be transported further with a higher possibility to get into the marine environment. Thus, plastic-type FL is transported further in rivers and ends up in the ocean due to its low sedimentation rate. Examples of common plastic-type FL found in the ocean are foam, plastic bags, cups, bottles, and packing materials [25].
The river flow velocity for each condition is different when they are measured in different weather conditions (i.e., the number of hours after precipitation and no precipitation). According to [26], it explains that higher precipitation is expected to cause higher average river flow velocity in some areas. While river flow velocity increases as the volume of water increase through the input of river water from streams and tributaries [27].
The significant difference between FL travel time in each condition shows that the different values of flow velocity result in the different value data sets of FL travel time. The higher river flow velocity results in a shorter FL travel time. Flow rate determines the fluxes of pollutants in rivers [6,7,8]. River flow rate affects river flow velocity [27].
There is no influence from density on the travel time of FL; this is because the density factor affects the vertical transport of FL more than horizontal transport in rivers. However, there seems to be a trade-off between vertical and horizontal transport of litter in which, during the low influence of vertical transport, the FL migration behavior is more influenced by horizontal transport. The density factor has no significant effect on FL horizontal transport; instead, other factors (e.g., wind, shape, turbulence) can influence the FL travel time more. Moreover, the density values of FL evaluated are very low which causes a tendency for horizontal transport to happen more. According to [4], density is one of the litter characteristics that play a key role in vertical transport. However, in this study, the density factor seems to have a weak influence on both transportation modes due to the low-density class of FL, ρ < 1000 kg/m3.
5. Conclusions
This study was carried out to assess the travel time for different densities of floatable litter influenced by river flow velocity. This study provides basic information on FL migration behavior through the evaluation of FL travel time in rivers. This research also discovered two other main aspects: (i) the evaluated density of selected objects representing common FL found in rivers; and (ii) the identified correlation between FL density and its travel time.
The knowledge in identifying the effect of FL density on its travel time as an approach to understanding the FL migration behavior is very useful for future reference and studies of factors influencing litter transport and migration in rivers. Reliable data of FL travel time with different densities were crucial for planning and environmental assessment for river management. In addition, it is beneficial in outlining a methodology for riverine litter study that is low-cost, and simple in a short time. Therefore, the fulfilments of the two main specific research objectives have been systematically concluded below for a better understanding of the output.
Based on the first objective of this study, the travel time for FL with different densities influenced by river flow rate conditions was determined. The obtained results revealed that cloth has the highest density, ρ = 1154.44 kg/m3, while FL with the lowest density is food polystyrene, ρ = 4.76 kg/m3. A total of 65% of the FL density is less than 200 kg/m3, whereas 69% of it is plastic-type litter. The result shows that FL commonly found in rivers is plastic-type with mostly similar density values. The density of an FL highly depends on its mass-to-volume ratio. Thus, information on FL density is important instead of considering its mass, volume, and size separately. Moreover, density plays a key role in determining both the floating and sinking of an FL which later affects its migration and resident time in the river.
River flow velocity was determined manually by using the general velocity equation and extrapolation of the float method as suggested by [11]. The measurement recorded the highest river flow velocity as Condition A, v = 0.230 m/s, followed by Condition B, v = 0.167 m/s, and Condition C, v = 0.144 m/s. The river flow velocity measured was higher when there was precipitation in the area of Sg. Berkelah, Pahang. Thus, the values of flow velocity comply with the suggestion of previous studies about factors affecting river flow velocity, which is that the more water is added into rivers via tributaries and streams, the higher the flow velocity will be.
As the outcome of the third research objective, the relationship between FL density and its travel time has been identified. The correlation between FL density and its travel time is not significant. The change in FL density does not influence the change in FL travel time in rivers. However, travel time might be influenced by FL with intermediate- to high-density, ρ > 1000 kg/m3. In conclusion, density is not a factor affecting the travel time of horizontally migrated litter, but only for vertical transport of litter. Furthermore, FL tends to migrate horizontally because it floats on the river water. The travel time of FL is not influenced by its low density, ρ < 1000 kg/m3, but by other factors that give more influence on FL travel time than the density factor. The factors could be the effect of wind resistance on the high-floating litter in the water; the effect of wind force on the FL migrating downstream causing it to move faster and further; turbulent flow in the river; water entrance into FL which increases its density; and that density factor is more significant toward vertical transport of FL.
Recommendations for Future Research
The study of understanding FL migration behavior and transportation is still less than that among other approaches to riverine litter study. Therefore, this study has been conducted by evaluating FL travel time with density factor as one of the litter characteristics affecting its travel time in rivers. However, this study approach is only a minor part of the transport and accumulation study. Hence, it leads to several recommendations as listed below for future research as the extensions of this study:
- The study of other litter characteristics (e.g., shape, exposed area, type of material) and environmental parameters (e.g., wind speed, turbulence, precipitation) which are the drivers for FL migration should be considered. The linking of all individual studies will give a clearer understanding of FL migration and transportation in rivers.
- Since this study is considered a part of litter flux assessment, the future study of FL migration and transportation should consider quantifying the number of items per given time as well as litter diffusion transported in rivers. These two approaches make up litter flux. The assessment of litter flux is important in creating a clear environmental framework for the process of FL getting into the ocean as a whole.
Disclaimer: The river section selected is at Sg. Berkelah for the simulation medium mainly due to safety factors, because its average water level is less than 1 m, even during high river discharge. River morphological (e.g., shape, direction, the cross-section of river channel) and meteorological (e.g., wind speed, precipitation) factors were assumed as constant. Moreover, the purpose of conducting the simulation through the environmental field testing is an initiative for replacing the simulation in the lab. Access to the laboratory was impossible due to the global COVID-19 pandemic lockdown in 2020. Thus, the determination of river flow velocity using the extrapolated float method in the river was only conducted as a medium to acquire the river flow velocity values as the factor considered in studying its influence on the FL migration in the river and to get a varied data set of FL travel time. The measuring of river flow velocity under different conditions on different days and conditions is to diversify the data value. Hence, other parameter values related to the different conditions were not recorded as they are not within the scope of our study.
Author Contributions
Methodology, N.F.N.A.; Software, M.B.; Validation, L.A.M. and M.B.; Formal analysis, M.B.; Investigation, L.A.M.; Resources, L.A.M. and S.Y.K.; Data curation, N.F.N.A., N.A.A. and A.N.R.; Writing—original draft, N.F.N.A. and M.B.; Writing—review & editing, M.B., S.Y.K. and W.I.A.W.T.; Funding acquisition, M.B., W.I.A.W.T. and A.B.P. All authors have read and agreed to the published version of the manuscript.
Funding
This study is supported by Fundamental Research Grant Scheme (FRGS/1/2019/WAB05/UPM/02/9).
Institutional Review Board Statement
Not applicable.
Informed Consent Statement
Not applicable.
Data Availability Statement
Not applicable.
Acknowledgments
The authors gratefully acknowledge the KDEB Waste Management Berhad for their valuable input throughout this study.
Conflicts of Interest
The authors declare no conflict of interest.
References
- United States Geological Survey (USGS). Available online: https://www.usgs.gov/special-topic/water-science-school/science/freshwater-lakes-and-rivers-and-water-cycle?qt-science_center_objects=0#qt-science_center_objects (accessed on 23 November 2020).
- Pharr, L. Birds and Rivers: The Importance of a River Ecosystem. Benton Soil & Water Conservation District. 2020. Available online: https://bentonswcd.org/birds-and-rivers-the-importance-of-a-river-ecosystem/ (accessed on 26 December 2021).
- Malik, N.K.A.; Manaf, L.A. Potential recyclable materials derived from riverine litter at log boom Sungai Batu in Kuala Lumpur. J. Mater. Cycles Waste Manag. 2017, 20, 1063–1072. [Google Scholar] [CrossRef]
- Emmerik, T.; Schwarz, A. Plastic debris in rivers. WIREs Water 2019, 7, e1398. [Google Scholar] [CrossRef]
- Meijer LJ, J.; van Emmerik, T.; van der Ent, R.; Schmidt, C.; Lebreton, L. More than 1000 rivers account for 80% of global riverine plastic emissions into the ocean. Sci. Adv. 2021, 7, eaaz5803. [Google Scholar] [CrossRef] [PubMed]
- Borah, D.K.; Bera, M. Watershed-scale Hydrologic and Nonpoint-Source Pollution Models: Review of Applications. Trans. ASAE 2004, 47, 789–803. [Google Scholar] [CrossRef]
- Lebreton LC, M.; van der Zwet, J.; Damsteeg, J.-W.; Slat, B.; Andrady, A.; Reisser, J. River plastic emissions to the world’s oceans. Nat. Commun. 2017, 8, 15611. [Google Scholar] [CrossRef] [PubMed]
- Nizzetto, L.; Bussi, G.; Futter, M.N.; Butterfield, D.; Whitehead, P.G. A theoretical assessment of microplastic transport in river catchments and their retention by soils and river sediments. Environ. Sci. Process. Impacts 2016, 18, 1050–1059. [Google Scholar] [CrossRef] [PubMed]
- Arizona. Measuring the Flow of a Stream. The Float Method. 2018. Available online: https://www.youtube.com/watch?v=W1lUdxE5BGU (accessed on 1 August 2021).
- Balas, C.E.; Williams, A.T.; Simmons, S.L.; Ergin, A. A Statistical Riverine Litter Propagation Model. Mar. Pollut. Bull. 2001, 42, 1169–1176. [Google Scholar] [CrossRef] [PubMed]
- Simmons, S.L. Sources, Pathways and Sinks of Litter within Riverine and Marine Environments; University of South Wales: Newport, UK, 1993. [Google Scholar]
- Bruge, A.; Barreau, C.; Carlot, J.; Collin, H.; Moreno, C.; Maison, P. Monitoring litter inputs from the Adour River (Southwest France) to the marine environment. J. Mar. Sci. Eng. 2018, 6, 24. [Google Scholar] [CrossRef]
- Crosti, R.; Arcangeli, A.; Campana, I.; Paraboschi, M.; González-Fernández, D. “Down to the river”: Amount, composition, and economic sector of litter entering the marine compartment, through the Tiber river in the Western Mediterranean Sea. Rend. Lincei Sci. Fis. Nat. 2018, 29, 859–866. [Google Scholar] [CrossRef]
- Schirinzi, G.F.; Köck-Schulmeyer, M.; Cabrera, M.; González-Fernández, D.; Hanke, G.; Farré, M.; Barceló, D. Riverine anthropogenic litter load to the Mediterranean Sea near the metropolitan area of Barcelona, Spain. Sci. Total Environ. 2020, 714, 136807. [Google Scholar] [CrossRef] [PubMed]
- Rech, S.; Macaya-Caquilpán, V.; Pantoja, J.F.; Rivadeneira, M.M.; Jofre Madariaga, D.; Thiel, M. Rivers as a source of marine litter—A study from the SE Pacific. Mar. Pollut. Bull. 2014, 82, 66–75. [Google Scholar] [CrossRef] [PubMed]
- Chubarenko, I.; Bagaev, A.; Zobkov, M.; Esiukova, E. On some physical and dynamical properties of microplastic particles in marine environment. Mar. Pollut. Bull. 2016, 108, 105–112. [Google Scholar] [CrossRef] [PubMed]
- Kowalski, N.; Reichardt, A.M.; Waniek, J.J. Sinking rates of microplastics and potential implications of their alteration by physical, biological, and chemical factors. Mar. Pollut. Bull. 2016, 109, 310–319. [Google Scholar] [CrossRef] [PubMed]
- Hidalgo-Ruz, V.; Gutow, L.; Thompson, R.C.; Thiel, M. Microplastics in the Marine Environment: A Review of the Methods Used for Identification and Quantification. Environ. Sci. Technol. 2012, 46, 3060–3075. [Google Scholar] [CrossRef] [PubMed]
- Schwarz, A.E.; Ligthart, T.N.; Boukris, E.; van Harmelen, T. Sources, transport, and accumulation of different types of plastic litter in aquatic environments: A review study. Mar. Pollut. Bull. 2019, 143, 92–100. [Google Scholar] [CrossRef] [PubMed]
- Augustyn, A.; The Editors of Encyclopedia Britannica. Turbulent Flow. Physics. In Encyclopædia Britannica. 2016. Available online: https://www.britannica.com/science/turbulent-flow (accessed on 12 January 2022).
- Ivar do Sul, J.A.; Costa, M.F.; Silva-Cavalcanti, J.S.; Araújo MC, B. Plastic debris retention and exportation by a mangrove forest patch. Mar. Pollut. Bull. 2014, 78, 252–257. [Google Scholar] [CrossRef] [PubMed]
- Ather, S.H. How Are Density, Mass & Volume Related? Sciencing. 2019. Available online: https://sciencing.com/density-mass-volume-related-6399069.html (accessed on 13 September 2021).
- Healthy Land and Water Litter in Our Waterways Archives. 2010. Available online: https://hlw.org.au/download-topic/waterways/litter-in-our-waterways/ (accessed on 26 February 2021).
- Parker, L. Plastic Gets to the Oceans through over 1000 Rivers; Environment. Available online: https://www.nationalgeographic.com/environment/article/plastic-gets-to-oceans-through-over-1000-rivers (accessed on 30 April 2021).
- Constantino, E.; Martins, I.; Salazar Sierra, J.M.; Bessa, F. Abundance and composition of floating marine macro litter on the eastern sector of the Mediterranean Sea. Mar. Pollut. Bull. 2019, 138, 260–265. [Google Scholar] [CrossRef] [PubMed]
- US EPA. Climate Change Indicators: Streamflow. US EPA. Available online: https://www.epa.gov/climate-indicators/climate-change-indicators-streamflow (accessed on 1 July 2016).
- Ames, H. Factors Affecting a River’s Velocity. Sciencing. 2018. Available online: https://sciencing.com/factors-affecting-rivers-velocity-8223150.html (accessed on 12 July 2021).
Disclaimer/Publisher’s Note: The statements, opinions and data contained in all publications are solely those of the individual author(s) and contributor(s) and not of MDPI and/or the editor(s). MDPI and/or the editor(s) disclaim responsibility for any injury to people or property resulting from any ideas, methods, instructions or products referred to in the content. |
© 2023 by the authors. Licensee MDPI, Basel, Switzerland. This article is an open access article distributed under the terms and conditions of the Creative Commons Attribution (CC BY) license (https://creativecommons.org/licenses/by/4.0/).


