Article

Association of Ground Reaction Force Measurements in Runners with Symptomatic Iliotibial Band Friction Syndrome: A Cross-Sectional Study

by
José Roberto de Souza Júnior
1,2,
Molly M. Bradach
1,†,
Logan W. Gaudette
1,† and
Adam S. Tenforde
1,*
1
Spaulding National Running Center, Department of Physical Medicine and Rehabilitation, Harvard Medical School, Spaulding Rehabilitation Hospital, Boston, MA 02138, USA
2
Graduate Program of Sciences and Technologies in Health, University of Brasilia, Brasilia 72220-275, DF, Brazil
*
Author to whom correspondence should be addressed.
These authors contributed equally to this work.
Appl. Sci. 2023, 13(6), 3441; https://doi.org/10.3390/app13063441
Submission received: 30 January 2023 / Revised: 1 March 2023 / Accepted: 2 March 2023 / Published: 8 March 2023
(This article belongs to the Special Issue Running Biomechanics: From Commuting to Elite)

Abstract

:
Iliotibial band syndrome (ITBS) is a common running related injury. While previous studies have evaluated the relationship between biomechanical variables and ITBS, most have found limited evidence, particularly with measures related to ground reaction force (GRF). The purpose of this study was to use a classification and regression tree (CART) analysis to determine whether the combination of GRF measures would be strongly associated in runners with ITBS. A cross-sectional study was performed at an outpatient center focused on running injuries. A convenience sample of 52 runners with ITBS, assessed between September 2012 and July 2022, were evaluated for eligibility, from which, 30 rearfoot strike runners with ITBS and no secondary running-related injuries were selected. Injured runners were matched to 30 healthy controls from a normative database. Each ran on an instrumented treadmill at a self-selected speed. GRF variables were calculated, including peak GRFs, loading rates, and impulses. CART analysis was performed to identify interactions between GRF data and runners with ITBS. An ROC curve was executed, to determine the accuracy of the model. Posterior GRF impulse (PGRFI), anterior GRF (AGRFI), peak anterior GRF (PAGRF), and vertical stiffness at initial loading (VSIL) all emerged as variables associated with ITBS in the CART analysis. The model was able to correctly identify 25 (83.3%) runners with ITBS and 25 (83.3%) controls. The area under the ROC curve (accuracy) was 0.87 (95% CI, 0.77–0.96; SE, 0.04; p < 0.001). In conclusion, interactions between GRF variables were associated with ITBS in runners. The best classification included interactions between PGRFI, AGRFI, AGRFP, and VSIL, using specific cut-off values. Loading rates were not independently associated with ITBS.

1. Introduction

Running as a form of exercise has increased in popularity in the United States over the past 50 years [1]. In addition to its ease of access and low cost of participation, running has been shown to have positive effects on mental health [2], and participation has been shown to reduce cardiovascular, cancer, and all-cause mortality [3,4]. Unfortunately, runners also experience a high rate of injury, approaching 79% within a six-month period [5], with separate work suggesting novice runners are at a higher risk of injury compared to experienced runners [6,7].
The most common running-related injuries (RRIs) include medial tibial stress syndrome, patellar tendinopathy, plantar fasciitis, patellofemoral pain syndrome, and iliotibial band syndrome [8,9]. While many studies have attempted to identify risk factors for general and specific RRIs, evidence is often inconsistent or limited [10,11]. Previous injury appears to be the most consistent risk factor for future RRI [11,12,13]. Three previous reviews report the knee as the main site in the lower limbs affected by RRIs (incidence rate ranging from 7.2 to 50%) [6,9,12]. One of the primary knee injuries observed in runners is iliotibial band syndrome (ITBS) [9]. The iliotibial band (ITB) is composed of fibrous tissue that runs from the iliac crest to the lateral proximal tibia. The ITB is believed to play a role in providing lateral support and storing elastic energy during forward motion [14]. ITBS is often thought to be the result of friction of the iliotibial band against the lateral femoral epicondyle [15], although this theory for symptom onset is disputed [16]. It is suggested that this condition has a particularly high occurrence rate in runners, as the friction acting on the iliotibial band is most prominent at a knee flexion angle of approximately 30°, which is similar to the average knee flexion angle of runners at foot strike (21.4° ± 4.3°) [17].
A prior report identified a 10.5% prevalence of ITBS in runners, which suggests the value of identifying potential risk factors for this injury [8]. While some training factors, such as higher weekly mileage, have been shown to be associated with ITBS [18,19], systematic reviews have concluded that there was limited or inconsistent evidence for specific biomechanical variables associated with this form of injury [20,21]. One recent systematic review concluded limited evidence supports an association of ITBS with higher peak femur external rotation, ITB strain, and ITB strain rate [20]. Conflicting evidence exists to determine the relationship between ITBS and peak hip adduction angle, knee flexion angle at touchdown, peak knee adduction angle, and peak internal rotation angle [20].
The association between ground reaction force data (GRF) and RRIs has been characterized in recent systematic reviews. Limited evidence supports higher loading rates in male novice runners as a risk factor associated with ITBS, whereas moderate evidence of no significant differences in load rates was identified for female recreational runners [10]. Additionally, strong evidence suggests that vertical impact peak is not related to any RRIs, while inconsistent evidence was found for peak braking force [10]. In relation to specific injuries, moderate evidence was found for higher loading rates in runners with plantar fasciitis, and lower braking impulse in runners with patellofemoral pain [20].
Since the friction of the ITB against the lateral femoral epicondyle may primarily occur at the beginning of the stance phase [17], it has been suggested that load rates (rate of increase in the GRF in the early time of foot-ground contact) contribute to this injury. The relationship between GRF data and ITBS has been previously studied; one investigation found no differences for vertical, posterior, and mediolateral loading rates [22]. Other reports found inconclusive evidence for other aspects of GRF, including differences in peak GRF for runners with ITBS compared with healthy controls [18,19,21,23]. One limitation of previous studies was the analysis performed, which did not assess interactions of aspects of GRF that could classify injury status.
Due to the complex nature of sports injuries [24,25], different statistical approaches may be necessary to capture the association between GRF data and ITBS. Identifying modifiable factors associated with ITBS is essential considering the prevalence, rates of incomplete recovery [26], and other secondary conditions that may occur due to the lack of running. Identifying specific biomechanical aspects presented in runners with ITBS may help in further understanding this condition, and assist clinicians in developing target interventions (e.g., gait retraining) to modify symptoms in this population. The objective of this study was to identify biomechanical measures associated with runners with ITBS using a classification and regression tree (CART) analysis related to GRF variables. Our hypothesis was that a subset of GRF variables would correctly classify runners with ITBS, using a statistical method capable of capturing the non-linear interaction among biomechanical variables.

2. Materials and Methods

This cross-sectional study followed STROBE guidelines (Strengthening the Reporting of Observational Studies in Epidemiology) [27] and was performed using healthy and injured runners from an outpatient center. The data on injured runners was collected as part of a standard of care assessment, performed to evaluate injured runners. The control population was derived from runners without current RRI, that were part of a larger database of healthy runners, and were matched based on key variables of age, gender, self-selected running speed, and foot strike pattern. The study received Institutional Review Board approval at Mass General Brigham, including a waiver of informed consent to use data collected on ITBS patients that was collected as standard of care (protocol code 2017P000481–17 July 2017). Subjects in the healthy group provided IRB-approved written informed consent (protocol code 2012P002373—12 March 2012). Runners with ITBS were identified by reviewing all charts of patients receiving treatment and verified by a physician who specializes in sports medicine (AST).

2.1. Participants

Runners with ITBS were identified using a convenience sample of injured runners who sought treatment for RRI between September 2012 and July 2022. More than 800 runners were assessed during this period at the center. An extensive chart review, through our internal system, was performed, to identify all runners with ITBS according to the eligibility criteria. The ITBS group comprised rearfoot strike runners, 18 years or older, that were diagnosed with ITBS and confirmed by chart review by senior author (AST). The diagnosis of ITBS was made using the following definition: Presence of lateral knee pain and tenderness just above the lateral joint line [18]. Excluded from this group were athletes that presented other injuries, had history of surgery in the lower limbs in the 6 months prior to the evaluation, or those who were classified as non-rearfoot strike. Participants with bilateral symptoms were included, however, only the more symptomatic knee (identified by higher numeric pain rating scale) was used for data analysis. The control cohort consisted of rearfoot strike runners, 18 years or older, with no RRIs or history of surgery in the lower limb in the 6 months prior to the evaluation. After the chart review, the first author (JRSJ) identified control participants according to the eligibility criteria. For analysis, a random leg was selected, and counterbalancing was performed across the control participants to match the ITBS group. An equal number of healthy controls and patients with ITBS were included. Chart review and inclusion of the participants occurred between August and September of 2022.

2.2. Outcomes

The main outcome was the presence or absence of ITBS in association with each GRF measure of interest. The following GRF data were included in the model. (I) Ground reaction force impulses, in body weights*second (BW*s): vertical (VGRFI), anterior (AGRFI), posterior (PGRFI), medial (MGRFI), and lateral (LGRFI). (II) Peak instantaneous loading rates, in BW/s: vertical (VILR), posterior (PILR), medial (MILR), and lateral (LILR). (III) Ground reaction force peaks, in BW: vertical (VGRFP), anterior (AGRFP, posterior (PGRFP), medial (MGRFP), and lateral (LGRFP). (IV) Vertical stiffness at initial loading (VSIL), in kN/m.

2.3. Data Collection

Anthropometric data were collected during the initial assessment through a clinical evaluation. The ground reaction force aspects were collected on an instrumented treadmill, with two embedded force plates which sampled at 1500 Hz (AMTI, Watertown, MA, USA). The treadmill presented two belts (31.75 cm wide), separated longitudinally by a 7 mm gap. The force plates comprised 6-axis force platforms, with 8800 N vertical capacity. Participants were instructed to run at a self-selected running speed, determined by gradually adjusting the speed until he or she reached a comfortable training pace, defined as normal for an easy training run. A short warm-up (2–3 min) was provided, and then 10 strides of data were collected on each leg for analysis. All runners completed the running trial using conventional/cushioned shoes.

2.4. Data Analysis

Ground reaction force data was filtered at a cut-off frequency of 50 Hz, using a fourth-order Butterworth, low-pass filter. A custom program, written in MATLAB (MathWorks, Natick, Massachusetts, USA), was used to process these data. Detailed information about data processing has been published elsewhere [22,28,29]. First, a point of interest (POI) was defined as the first point above 75% of a subject’s body weight (BW), with a vertical ground reaction force slope less than 15 BW/s. These values were chosen to ensure that vertical load rates were calculated over appreciable vertical GRF changes, until the end of the loading phase [28]. The VILR (BW/s) was defined as the peak vertical loading rate between any two successive points, from 20–100% of the force at the POI. These values were chosen to ensure that the VILR was taken from the most linear portion of the rise in vertical forces during the early stance. PILR was calculated over the first 15% of stance, and medial/lateral loading rates were identified using the initial 25% of stance [22]. These values were chosen to ensure that these variables were captured as early in stance as possible. Ground reaction force peaks were calculated as the peak force across the stance phase [22]. Ground reaction force impulses were determined as the time integral of the ground reaction force over stance. Vertical stiffness at initial loading (VSIL) was measured over 20–80% of the POI, using the peak vertical force divided by the vertical change in center of mass (kN/m) [22]. The vertical displacement of the center of mass was determined from the double integration of the vertical force curve [30].

2.5. Statistical Analysis

Statistical analyses were performed using IBM SPSS v. 25 (Statistical Package for Social Sciences). Quantitative data were described as mean and standard deviation. Qualitative data were described as frequencies and percentages. A chi-square test, independent t test, and a Mann–Whitney U test were performed, to compare participant characteristics. Effect sizes were reported using Cohen’s d (d). Values of d = 0.2 were defined as small, d = 0.5 as medium, and d = 0.8 as large.
The interactions among ground reaction force aspects were presented using a classification and regression tree (CART) analysis. The predictors and their respective cut-off values that best classify the participants, regarding the presence and absence of ITBS, were selected by CART [31]. The model begins with the total sample (node 0), and is divided into two groups (sub-nodes) according to the best predictor and specific cut-off values. The best predictor and cut-off value represents the split that maximises the between groups sum-of-squares (or, equivalently, minimises the within-group error sum-of-squares) [32]. This process is applied recursively until the subgroups reach a minimum size or no further improvement can be made [32]. In the end, a tree representing the non-linear relationship among predictors (with specific cut-off values), that best classifies the participants according to the presence and absence of ITBS, is obtained. A 10-fold cross-validation was used to avoid overfitting. A receiver operating characteristic (ROC) curve was created to verify the accuracy of the model, and prevalence ratios (PR) with 95% confidence intervals were calculated for each terminal node, to investigate the strength of associations. This method was used in previous studies with runners [33], cyclists [34], and soccer players [35]. Risk profiles were defined as nodes with a PR greater than 1, or a higher proportion of participants with ITBS. Protective profiles were defined as nodes with a PR lower than 1, or a higher proportion of participants without ITBS. A significance level of p < 0.05 was used for all analyses.

3. Results

3.1. Recruitment and General Data
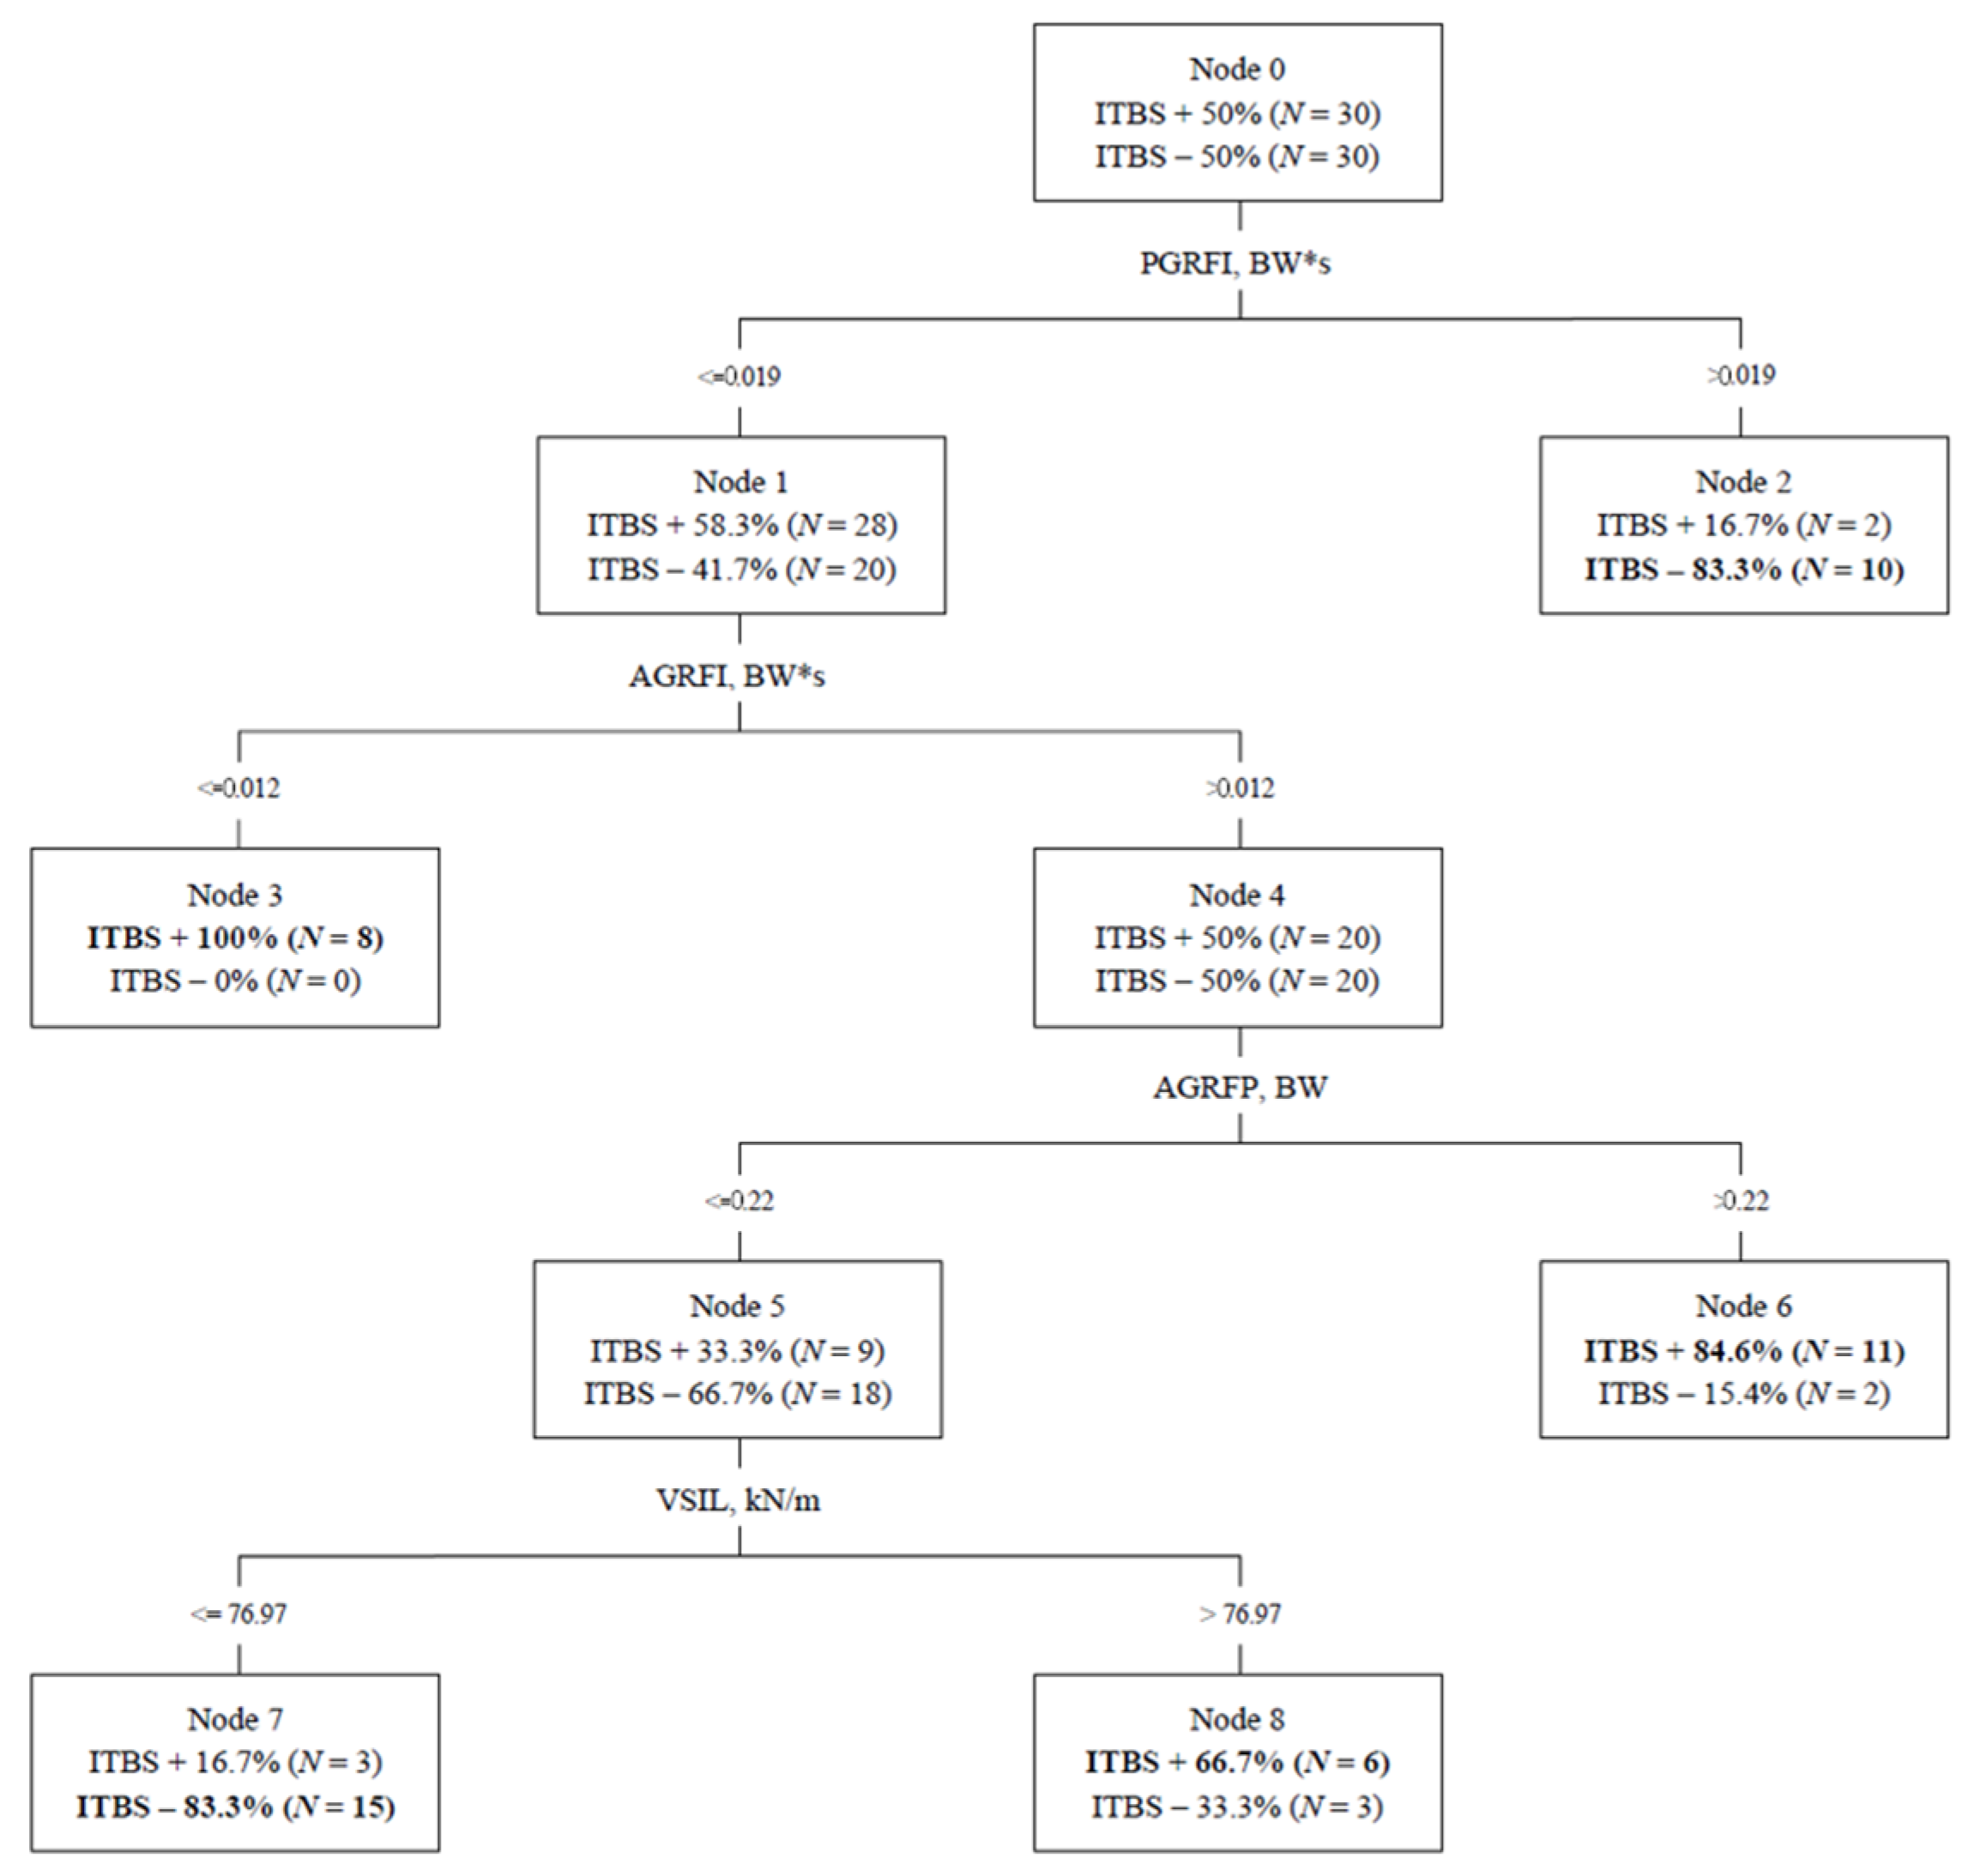
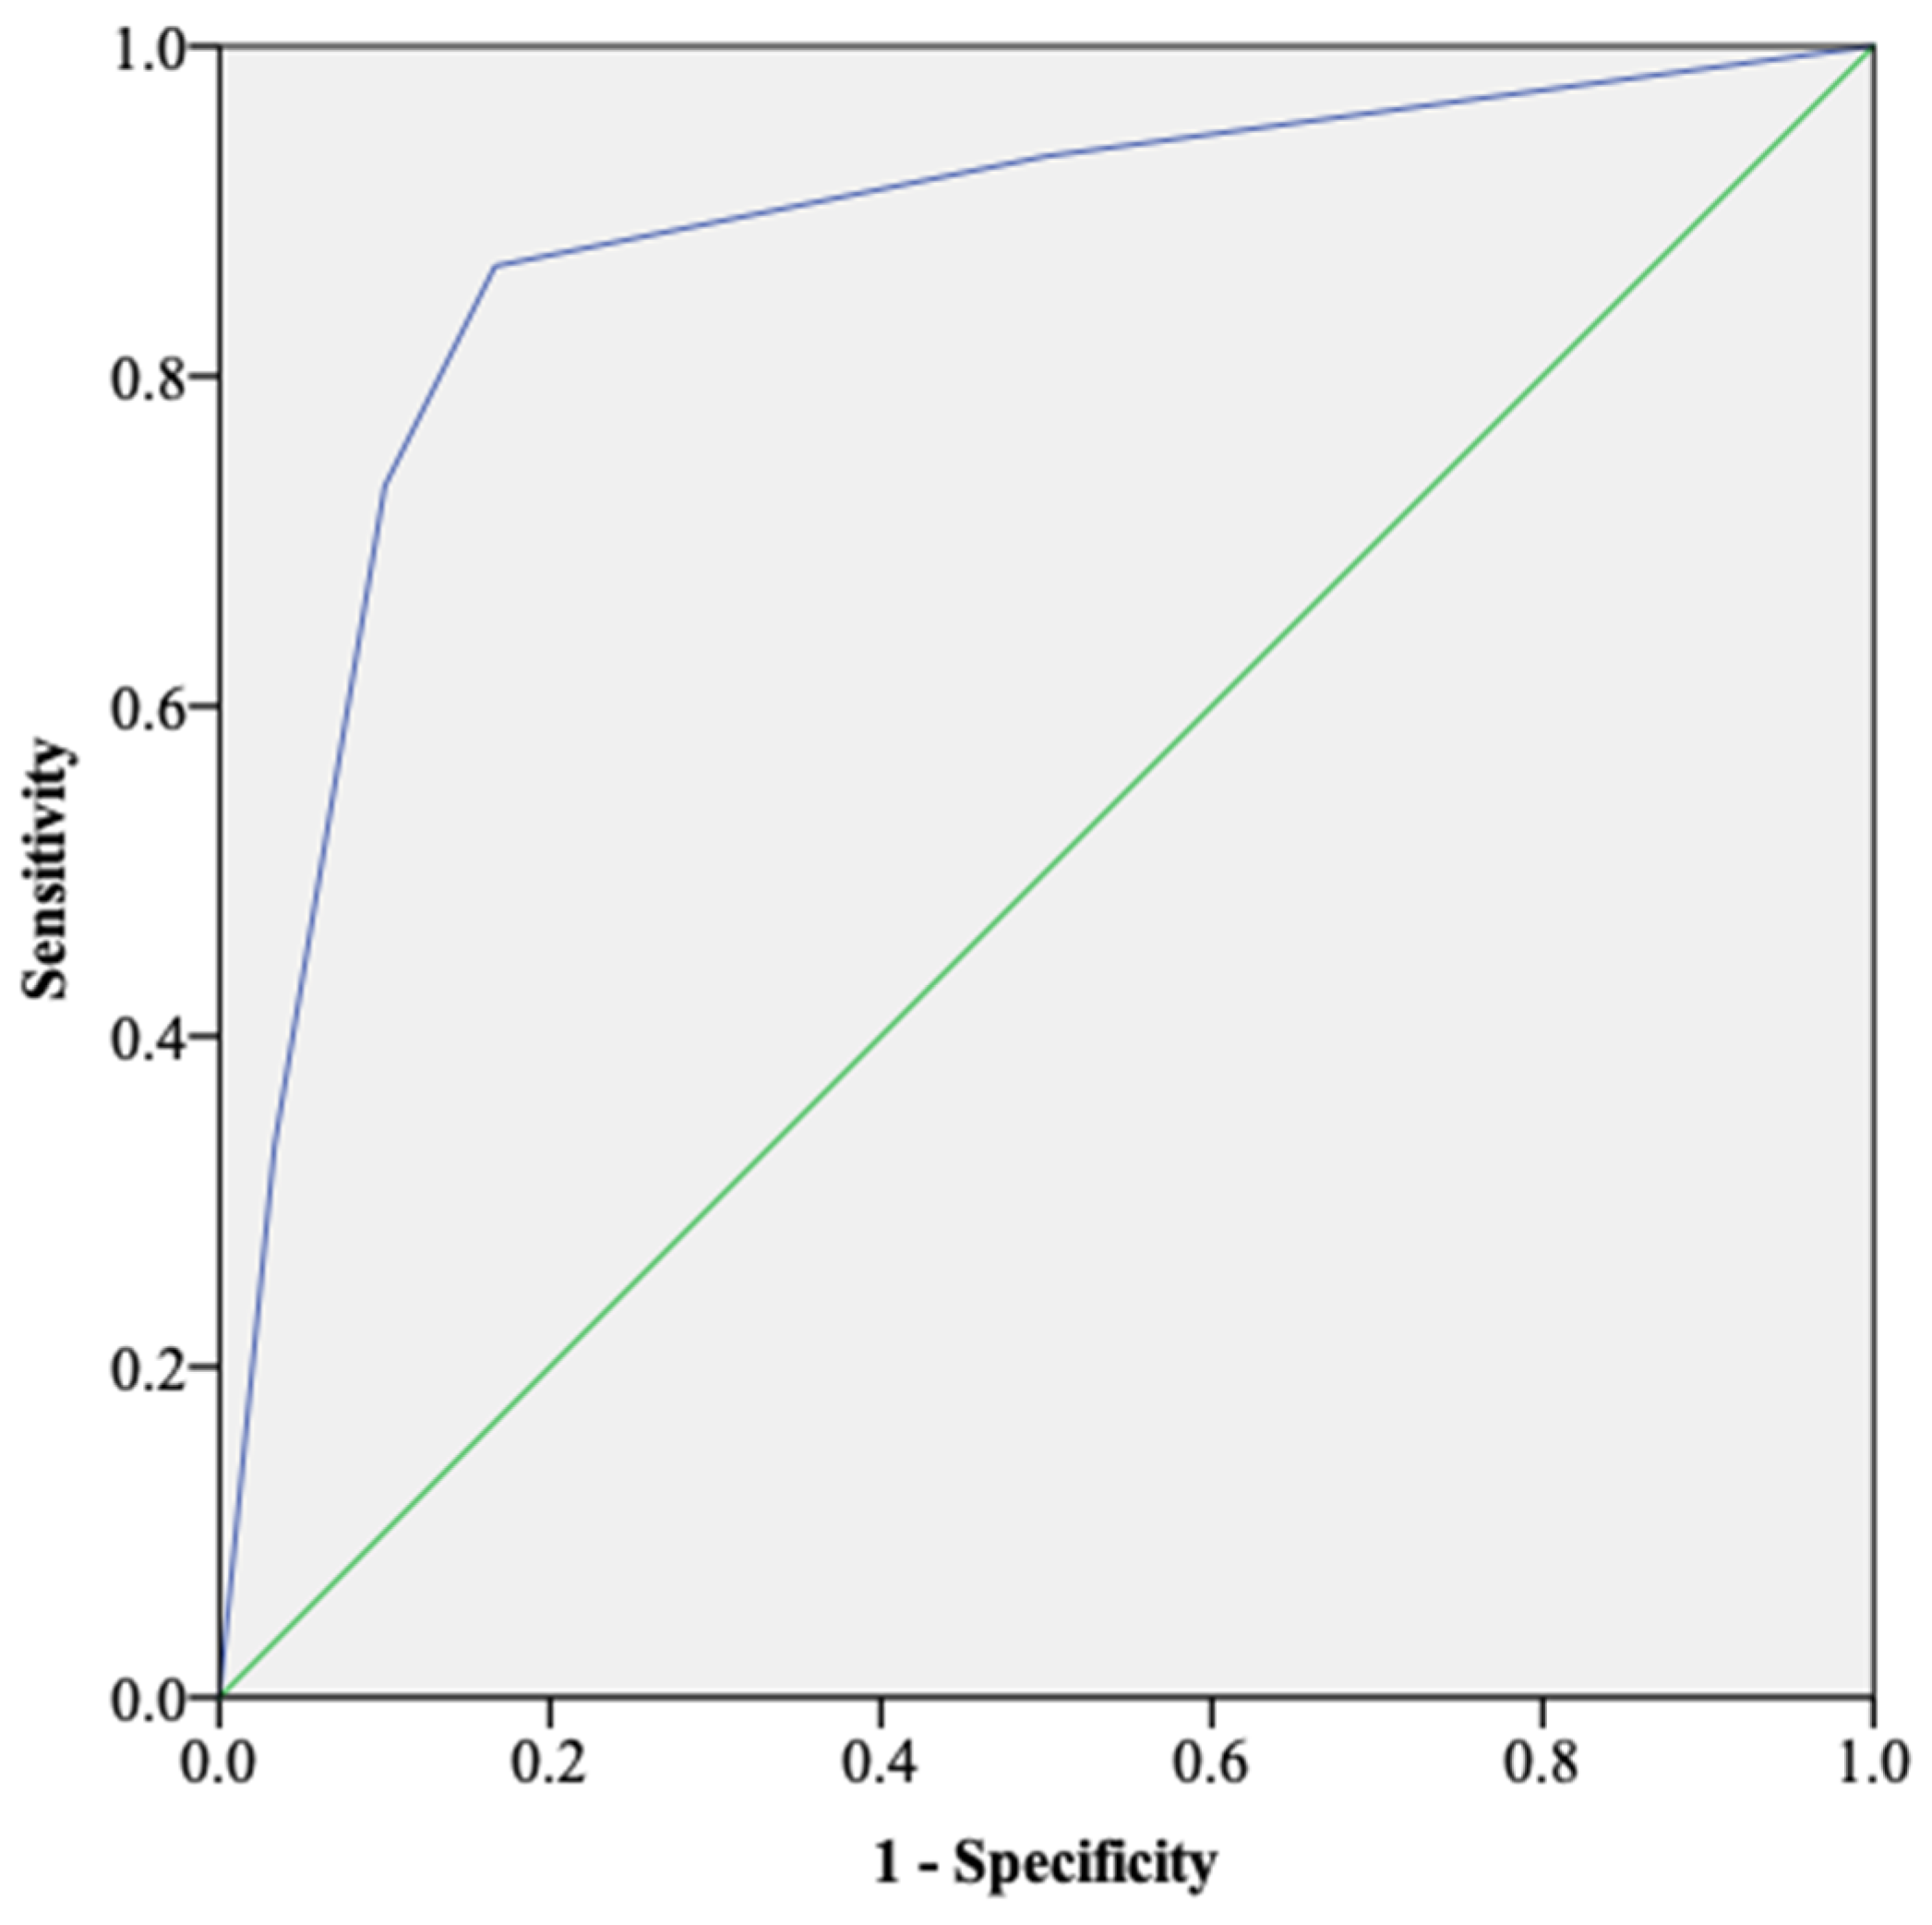
Initial chart review identified 52 runners with ITBS. Twelve were excluded due to other injuries, while 10 were excluded due to a non-rearfoot strike pattern. The resulting 30 runners with ITBS were matched to 30 healthy controls, from a population of healthy runners in a large study (more than 200 runners assessed) performed at the same institution. Descriptive data for group characteristics are presented in Table 1. The runners with ITBS have similar sex, age, height, weight, body mass index, and self-selected speed (all p > 0.05/d < 0.30) to the selected healthy runners.
Runners with ITBS had lower measured posterior GRF impulse compared to healthy participants (p = 0.049), with medium effect size measured for this comparison (d = 0.50). No statistical differences were found for the other variables (all p > 0.05). In addition, small effect sizes were found for all variables, with the exception of lateral impulse (d = 0.63) (Table 2).

3.2. CART Model

The CART analysis showed that PGRFI, AGRFI, AGRFP, and VSIL were associated with runners with ITBS. The first variable selected was PGRFI, with a cut-off value of 0.019 BW*s. Those with PGRFI greater than 0.019 BW*s had a lower chance of being in the ITBS group (node 2: protective profile—proportion of participants with ITBS = 16.7%; proportion of participants without ITBS = 83.3%). In runners with PGRFI less than or equal to 0.019 BW*s, the AGRFI entered the model with 0.012 BW*s as the cut-off. Those with PGRFI less than or equal to 0.019 BW*s and AGRFI less than or equal to 0.012 BW*s had a higher chance of being in the ITBS group (node 3: risk profile—proportion of participants with ITBS = 100%; proportion of participants without ITBS = 0%). In runners with AGRFI higher than 0.012 BW*s, the AGRFP entered the model with 0.22 BW as the cut-off. Those with PGRFI less than or equal to 0.019 BW*s, AGRFI higher than 0.012 BW*s, and AGRFP higher than 0.22 BW had a higher chance of being in the ITBS group (node 6: risk profile—proportion of participants with ITBS = 84.6%; proportion of participants without ITBS = 15.4%). In runners with AGRFP less than or equal to 0.22 BW, the VSIL entered the model with 76.97 kN/m as the cut-off. Those with PGRFI less than or equal to 0.019 BW*s, AGRFI higher than 0.012 BW*s, AGRFP less than or equal to 0.22 BW, and VSIL less than or equal to 76.97 kN/m had a lower chance of being in the ITBS group (node 7: protective profile—proportion of participants with ITBS = 16.7%; proportion of participants without ITBS = 83.3%), while those with VSIL higher than 76.97 kN/m had a higher chance of being in the ITBS group (node 8: risk profile—proportion of participants with ITBS = 66.7%; proportion of participants without ITBS = 33.3%) (Figure 1).
The resulting model, using PGRFI, AGRFI, AGRFP, and VSIL cut-offs to define nodes, correctly classified 25 runners with ITBS and 25 runners without ITBS, with a total correct classification of 83.3%. The area under the ROC curve (accuracy) was 0.87 (95% CI, 0.77–0.96; SE, 0.04; p < 0.001) (Figure 2).
Table 3 shows the risk (nodes 3, 6, and 8) or protective (nodes 2 and 7) profiles with their respective prevalence ratios and confidence intervals. A statistically different proportion of runners with and without ITBS were found for nodes 2, 6, and 7 (p < 0.05).

4. Discussion

The purpose of this study was to identify biomechanical measures related to GRF associated with ITBS in runners. Our main hypothesis was that a subset of aspects of GRFs would correctly classify participants with ITBS, was confirmed. Patterns of interaction involving PGRFI, AGRFI, AGRFP, and VSIL identified runners with and without ITBS. The model presented good performance, with a total correct classification of 83.3%, and good accuracy, with an area under the ROC curve of 0.87. Using a non-linear model that accounts for interactions between GRF variables may help to explain why prior research has found inconsistent results of GRF in runners with ITBS.
Prior work did not find differences in loading rates or vertical stiffness using a partially overlapping population of runners with ITBS [22]. Two studies did not find differences in antero-posterior peak forces [19,21]. In addition, inconclusive results were found for vertical and braking forces; one study showed higher vertical and peak braking forces [23], while the other showed only lower peak braking forces [18]. Unfortunately, no studies have presented data on GRF impulse values.
To our knowledge, this study is the first study to assess the interactions between biomechanical factors related to GRF and ITBS in runners using a complex approach. A single study has used a CART analysis to identify profiles that classified runners with Achilles tendinopathy, using aspects of the hip and foot, including range of motion and strength measures [33]. Other studies with CART, identified interactions between clinical aspects and anterior knee pain in mountain bikers [34], re-injury of the anterior cruciate ligament in soccer players [35], and persistent shoulder pain in non-athletes [31].
Interactions between anteroposterior forces and vertical stiffness were associated with ITBS occurrence. Each of these factors were associated with RRIs and patellofemoral pain [18,22,23,36]. It can be suggested that interactions between anteroposterior forces and vertical stiffness may be more relevant for some injuries than others. In addition, loading rates or mediolateral forces were not associated with ITBS when analyzed individually or through a complex approach [18,22,23]. These findings suggest that these aspects do not play a role in this condition.
Despite the correct classification and accuracy of the model, the small differences in runners with and without ITBS, and the low cut-off points, may limit the relevance of our findings in application to clinical practice of managing runners with this condition. In general, small effect sizes were found when comparing the variables between participants with and without ITBS, and from the fifteen aspects assessed, only four entered the model. These findings may suggest that GRFs may not be a primary consideration in the management of ITBS. In a clinical perspective, differences in muscle strength (hip external rotators) [37], muscle activation (tensor fasciae latae) [38], ITB length [37], and kinematics (hip adduction and internal rotation, knee adduction and flexion angle at touchdown) [20] should also be considered in evaluating runners with ITBS.
Some limitations of the current study are important to recognize. The population described was limited to runners with a rearfoot strike pattern. A difference in GRF based on footstrike patterns has been previously described [39], therefore, our results may not be appropriate to apply to non-rearfoot strike runners. A high correlation between the variables is present given each is derived from GRF measures, however, this may not be a problem for CART, given the statistical approach and that multicollinearity may be acceptable due to the exploratory nature of the paper. The results must be interpreted with caution, and causal relationships cannot be inferred due to the design of the analysis. A power analysis was not performed, since all ITBS participants that met eligibility criteria were included. Notably, previous studies that used CART did not perform a power analysis, including a recent study in Achilles tendinopathy in runners, that had a total sample of 51 participants [33]. Additionally, kinematic aspects were not defined a priori as part of this investigation, and were not considered for these analyses.

5. Conclusions

In conclusion, interactions between ground reaction force data were associated with ITBS in runners. A correct classification can be made through interactions between posterior ground reaction force impulse, anterior ground reaction force impulse, anterior ground reaction force peak, and vertical stiffness, using specific cut-off values. The CART analysis correctly classified 83.3% of runners with ITBS, and 83.3% of runners without ITBS. The area under the ROC curve (accuracy) was 0.87, indicating that the model’s classification was not due to chance. The relevant GRF aspects found in our study add to the existing work evaluating GRF variables in runners with ITBS. For clinicians, we recommend an individual assessment of runners with ITBS that comprises GRF data (when possible) along with considering other aspects, such as peak hip adduction, peak hip internal rotation, knee flexion angle at touchdown, hip muscle activity and strength, training factors, and individual aspects such as anthropometric/life-style characteristics.

Author Contributions

Conceptualization, J.R.d.S.J. and A.S.T.; methodology, J.R.d.S.J., formal analysis, J.R.d.S.J.; resources, A.S.T.; data curation, J.R.d.S.J., M.M.B. and L.W.G.; writing—original draft preparation, J.R.d.S.J., M.M.B. and L.W.G.; writing—review and editing, J.R.d.S.J., M.M.B., L.W.G. and A.S.T.; visualization, J.R.d.S.J. All authors have read and agreed to the published version of the manuscript.

Funding

J.R.d.S.J is a Fulbright visiting research student funded by the Fulbright Commission in Brazil. The published research received no external funding.

Institutional Review Board Statement

The study was conducted in accordance with the Declaration of Helsinki and approved by the Institutional Review Board at Mass General Brigham (protocol 2017P000481—17 July 2017; protocol 2012P002373—12 March 2012).

Informed Consent Statement

A waiver of informed consent to use data collected on ITBS patients that were collected as standard of care was obtained at Mass General Brigham. Participants comprising the healthy runner cohort each provided written informed consent.

Data Availability Statement

The data presented in this study are available on reasonable request from the corresponding author.

Acknowledgments

We are grateful to healthy running participants who volunteered for the study and injured runners who elected to receive care at our institution. We would like to acknowledge the physical therapists and others who assisted in collection of biomechanical variables as part of delivering care for injured runners at the Spaulding National Running Center.

Conflicts of Interest

The authors declare no conflict of interest.

References

  1. Vitti, A.; Nikolaidis, P.T.; Villiger, E.; Onywera, V.; Knechtle, B. The “New York City Marathon”: Participation and performance trends of 1.2M runners during half-century. Res. Sport. Med. 2019, 28, 121–137. [Google Scholar] [CrossRef] [PubMed]
  2. Oswald, F.; Campbell, J.; Williamson, C.; Richards, J.; Kelly, P. A Scoping Review of the Relationship between Running and Mental Health. Int. J. Environ. Res. Public Health 2020, 17, 8059. [Google Scholar] [CrossRef] [PubMed]
  3. Schnohr, P.; Marott, J.L.; Lange, P.; Jensen, G.B. Longevity in Male and Female Joggers: The Copenhagen City Heart Study. Am. J. Epidemiol. 2013, 177, 683–689. [Google Scholar] [CrossRef] [PubMed] [Green Version]
  4. Pedisic, Z.; Shrestha, N.; Kovalchik, S.; Stamatakis, E.; Liangruenrom, N.; Grgic, J.; Titze, S.; Biddle, S.J.; Bauman, A.E.; Oja, P. Is running associated with a lower risk of all-cause, cardiovascular and cancer mortality, and is the more the better? A systematic review and meta-analysis. Br. J. Sport. Med. 2019, 54, 898–905. [Google Scholar] [CrossRef] [PubMed]
  5. Lun, V.; Meeuwisse, W.H.; Stergiou, P.; Stefanyshyn, D. Relation between running injury and static lower limb alignment in recreational runners. Br. J. Sport. Med. 2004, 38, 576–580. [Google Scholar] [CrossRef] [Green Version]
  6. Kemler, E.; Blokland, D.; Backx, F.; Huisstede, B. Differences in injury risk and characteristics of injuries between novice and experienced runners over a 4-year period. Phys. Sportsmed. 2018, 46, 485–491. [Google Scholar] [CrossRef] [Green Version]
  7. Videbæk, S.; Bueno, A.M.; Nielsen, R.O.; Rasmussen, S. Incidence of Running-Related Injuries Per 1000 h of running in Different Types of Runners: A Systematic Review and Meta-Analysis. Sport. Med. 2015, 45, 1017–1026. [Google Scholar] [CrossRef] [Green Version]
  8. Lopes, A.D.; Hespanhol, L.C.; Yeung, S.S.; Costa, L.O.P. What are the Main Running-Related Musculoskeletal Injuries? Sport. Med. 2012, 42, 891–905. [Google Scholar] [CrossRef]
  9. Taunton, J.E.; Ryan, M.B.; Clement, D.B.; McKenzie, D.C.; Lloyd-Smith, D.R.; Zumbo, B.D. A retrospective case-control analysis of 2002 running injuries. Br. J. Sport. Med. 2002, 36, 95–101. [Google Scholar] [CrossRef] [Green Version]
  10. Ceyssens, L.; Vanelderen, R.; Barton, C.; Malliaras, P.; Dingenen, B. Biomechanical Risk Factors Associated with Running-Related Injuries: A Systematic Review. Sport. Med. 2019, 49, 1095–1115. [Google Scholar] [CrossRef] [Green Version]
  11. van der Worp, M.P.; ten Haaf, D.S.M.; van Cingel, R.; de Wijer, A.; Nijhuis-van der Sanden, M.W.; Staal, J.B. Injuries in runners; a systematic review on risk factors and sex differences. PLoS ONE 2015, 10, e0114937. [Google Scholar] [CrossRef] [PubMed]
  12. Van Gent, R.N.; Siem, D.; van Middelkoop, M.; van Os, A.G.; Bierma-Zeinstra, S.M.A.; Koes, B.W. Incidence and determinants of lower extremity running injuries in long distance runners: A systematic review. Br. J. Sport. Med. 2007, 41, 469–480. [Google Scholar] [CrossRef] [PubMed] [Green Version]
  13. Saragiotto, B.T.; Yamato, T.P.; Hespanhol Junior, L.C.; Rainbow, M.J.; Davis, I.S.; Lopes, A.D. What are the main risk factors for running-related injuries? Sport. Med. 2014, 44, 1153–1163. [Google Scholar] [CrossRef]
  14. Hutchinson, L.A.; Lichtwark, G.A.; Willy, R.W.; Kelly, L.A. The Iliotibial Band: A Complex Structure with Versatile Functions. Sport. Med. 2022, 52, 995–1008. [Google Scholar] [CrossRef] [PubMed]
  15. Strauss, E.J.; Kim, S.; Calcei, J.G.; Park, D. Iliotibial band syndrome: Evaluation and management. JAAOS 2011, 19, 728–736. [Google Scholar] [CrossRef] [PubMed]
  16. Fairclough, J.; Hayashi, K.; Toumi, H.; Lyons, K.; Bydder, G.; Phillips, N.; Best, T.M.; Benjamin, M. Is iliotibial band syndrome really a friction syndrome? J. Sci. Med. Sport 2007, 10, 74–76. [Google Scholar] [CrossRef]
  17. Orchard, J.W.; Fricker, P.A.; Abud, A.T.; Mason, B.R. Biomechanics of iliotibial band friction syndrome in runners. Am. J. Sport. Med. 1996, 24, 375–379. [Google Scholar] [CrossRef]
  18. Messier, S.P.; Edwards, D.G.; Martin, D.F.; Lowery, R.B.; Cannon, D.W.; James, M.K.; Curl, W.W.; Read, H.M., Jr.; Hunter, D.M. Etiology of iliotibial band friction syndrome in distance runners. Med. Sci. Sport. Exerc. 1995, 27, 951–960. [Google Scholar] [CrossRef]
  19. Fredericson, M.; Wolf, C. Iliotibial band syndrome in runners: Innovations in treatment. Sport. Med. 2005, 35, 451–459. [Google Scholar] [CrossRef]
  20. Willwacher, S.; Kurz, M.; Robbin, J.; Thelen, M.; Hamill, J.; Kelly, L.; Mai, P. Running-Related Biomechanical Risk Factors for Overuse Injuries in Distance Runners: A Systematic Review Considering Injury Specificity and the Potentials for Future Research. Sport. Med. 2022, 52, 1863–1877. [Google Scholar] [CrossRef]
  21. van der Worp, M.P.; van der Horst, N.; de Wijer, A.; Backx, F.J.; Nijhuis-van der Sanden, M.W. Iliotibial band syndrome in runners: A systematic review. Sport. Med. 2012, 42, 969–992. [Google Scholar] [CrossRef]
  22. Johnson, C.D.; Tenforde, A.S.; Outerleys, J.; Reilly, J.; Davis, I.S. Impact-Related Ground Reaction Forces Are More Strongly Associated with Some Running Injuries Than Others. Am. J. Sport. Med. 2020, 48, 3072–3080. [Google Scholar] [CrossRef]
  23. Suárez, L.B.; Rueda, O.J.; Collazo, G.C.; Veiga, F.S.; Navarro, C.E. Kinematics of recreational runners with iliotibial band injury. J. Hum. Sport Exerc. 2018, 13, 698–709. [Google Scholar]
  24. Bittencourt, N.F.N.; Meeuwisse, W.H.; Mendonça, L.D.; Nettel-Aguirre, A.; Ocarino, J.M.; Fonseca, S.T. Complex systems approach for sports injuries: Moving from risk factor identification to injury pattern recognition-narrative review and new concept. Br. J. Sport. Med. 2016, 50, 1309–1314. [Google Scholar] [CrossRef] [PubMed] [Green Version]
  25. Fonseca, S.T.; Souza, T.R.; Verhagen, E.; van Emmerik, R.; Bittencourt, N.F.N.; Mendonça, L.D.M.; Andrade, A.G.P.; Resende, R.A.; Ocarino, J.M. Sports Injury Forecasting and Complexity: A Synergetic Approach. Sport. Med. 2020, 50, 1757–1770. [Google Scholar] [CrossRef] [PubMed]
  26. Beals, C.; Flanigan, D. A Review of Treatments for Iliotibial Band Syndrome in the Athletic Population. J. Sport. Med. 2013, 2013, 367169. [Google Scholar] [CrossRef] [Green Version]
  27. von Elm, E.; Altman, D.G.; Egger, M.; Pocock, S.J.; Gøtzsche, P.C.; Vandenbroucke, J.P.; STROBE Initiative. The Strengthening the Reporting of Observational Studies in Epidemiology (STROBE) statement: Guidelines for reporting observational studies. PLoS Med. 2007, 4, e296. [Google Scholar] [CrossRef] [Green Version]
  28. Futrell, E.E.; Jamison, S.T.; Tenforde, A.S.; Davis, I.S. Relationships between Habitual Cadence, Footstrike, and Vertical Load Rates in Runners. Med. Sci. Sport. Exerc. 2018, 50, 1837–1841. [Google Scholar] [CrossRef]
  29. Hollander, K.; Johnson, C.D.; Outerleys, J.; Davis, I.S. Multifactorial Determinants of Running Injury Locations in 550 Injured Recreational Runners. Med. Sci. Sport. Exerc. 2020, 53, 102–107. [Google Scholar] [CrossRef]
  30. Cavagna, G.A. Force platforms as ergometers. J. Appl. Physiol. 1985, 39, 174–179. [Google Scholar] [CrossRef]
  31. Chester, R.; Khondoker, M.; Shepstone, L.; Lewis, J.S.; Jerosch-Herold, C. Self-efficacy and risk of persistent shoulder pain: Results of a Classification and Regression Tree (CART) analysis. Br. J. Sport. Med. 2019, 53, 825–834. [Google Scholar] [CrossRef] [PubMed] [Green Version]
  32. Lemon, S.C.; Roy, J.; Clark, M.A.; Friedmann, P.D.; Rakowski, W. Classification and regression tree analysis in public health: Methodological review and comparison with logistic regression. Ann. Behav. Med. 2003, 26, 172–181. [Google Scholar] [CrossRef] [PubMed]
  33. Ferreira, V.M.L.M.; Oliveira, R.R.; Nazareno, T.S.; Freitas, L.V.; Mendonça, L.D. Interaction of foot and hip factors identifies Achilles tendinopathy occurrence in recreational runners. Phys. Ther. Sport 2020, 45, 111–119. [Google Scholar] [CrossRef] [PubMed]
  34. Branco, G.R.; Resende, R.A.; Bittencourt, N.F.N.; Mendonça, L.D. Interaction of hip and foot factors associated with anterior knee pain in mountain bikers. Phys. Ther. Sport 2022, 55, 139–145. [Google Scholar] [CrossRef]
  35. Fältström, A.; Kvist, J.; Bittencourt, N.F.N.; Mendonça, L.D.; Hägglund, M. Clinical Risk Profile for a Second Anterior Cruciate Ligament Injury in Female Soccer Players After Anterior Cruciate Ligament Reconstruction. Am. J. Sport. Med. 2021, 49, 1421–1430. [Google Scholar] [CrossRef]
  36. Napier, C.; MacLean, C.L.; Maurer, J.; Taunton, J.E.; Hunt, M.A. Kinetic risk factors of running-related injuries in female recreational runners. Scand. J. Med. Sci. Sport. 2018, 28, 2164–2172. [Google Scholar] [CrossRef]
  37. Noehren, B.; Schmitz, A.; Hempel, R.; Westlake, C.; Black, W. Assessment of strength, flexibility, and running mechanics in men with iliotibial band syndrome. J. Orthop. Sport. Phys. Ther. 2014, 44, 217–222. [Google Scholar] [CrossRef] [Green Version]
  38. Baker, R.L.; Souza, R.B.; Rauh, M.J.; Fredericson, M.; Rosenthal, M.D. Differences in Knee and Hip Adduction and Hip Muscle Activation in Runners with and without Iliotibial Band Syndrome. PMR 2018, 10, 1032–1039. [Google Scholar] [CrossRef]
  39. Almeida, M.O.; Davis, I.S.; Lopes, A.D. Biomechanical Differences of Foot-Strike Patterns During Running: A Systematic Review with Meta-analysis. J. Orthop. Sport. Phys Ther. 2015, 45, 738–755. [Google Scholar] [CrossRef] [Green Version]
Figure 1. Classification and regression tree model for iliotibial band syndrome. ITBS, iliotibial band syndrome; PGRFI, posterior ground reaction force impulse; AGRFI, anterior ground reaction force impulse; AGRFP, anterior ground reaction force peak; VSIL, vertical stiffness at initial loading. Classification profiles for runners with ITBS. Node 3: PGRFI <= 0.019 BW*s, AGRFI <= 0.012 BW*s. Node 6: PGRFI <= 0.019 BW*s, AGRFI > 0.012 BW*s, AGRFP > 0.22 BW. Node 8: PGRFI <= 0.019 BW*s, AGRFI > 0.012 BW*s, AGRFP <= 0.22 BW, VSIL > 76.97 kN/m. Classification profiles for runners without ITBS. Node 2: PGRFI > 0.019 BW*s. Node 7: PGRFI <= 0.019 BW*s, AGRFI > 0.012 BW*s, AGRFP <= 0.22 BW, VSIL < 76.97 kN/m.
Applsci 13 03441 g001
Figure 2. ROC curve for ITBS in runners. The area under the ROC curve was 0.87 (p < 0.001). ROC, receiver operation characteristic.
Applsci 13 03441 g002
Table 1. General data in running cohort with and without ITBS (n = 60).
VariablesTotal
(N = 60)
ITBS+
(N = 30)
ITBS−
(N = 30)
Mean Difference
(95% CI)
pd
Sex
F
M
34 (56.7%)
26 (43.3%)
15 (50%)
15 (50%)
11 (36.7%)
19 (63.3%)
-0.297-
Age, years33.63 (11.19)35.20 (11.49)32.07 (10.85)3.13 (−2.64 to 8.90)0.1780.28
Height, m1.69 (0.10)1.70 (0.10)1.67 (0.10)0.03 (−0.02 to 0.08)0.3000.30
Weight, kg67.81 (12.84)66.15 (12.07)69.48 (13.56)−3.33 (−9.96 to 3.31)0.3200.26
Body mass index, kg/m222.95 (2.62)22.56 (2.27)23.35 (2.92)−0.79 (−2.14 to 0.55)0.4870.30
Self-selected speed, m/s2.52 (0.25)2.53 (0.33)2.51 (0.15)0.02 (−0.11 to 0.14)0.8470.08
Values are expressed as mean (SD). ITBS, iliotibial band syndrome, CI, confidence interval. Effect size of d = 0.2 was defined as small; d = 0.5 as medium; and d = 0.8 as large.
Table 2. Average ground reaction force data in running cohort with and without ITBS (n = 60).
VariablesTotal
(N = 60)
ITBS+
(N = 30)
ITBS−
(N = 30)
Mean Difference
(95% CI)
pd
Ground Reaction Force Impulses,
BW*s
Vertical0.36 (0.02)0.36 (0.01)0.36 (0.02)0 (−0.009 to 0.013)0.836-
Anterior0.015 (0.002)0.014 (0.002)0.015 (0.001)−0.001 (−0.001 to 0.001)0.3030.50
Posterior0.017 (0.002)0.016 (0.002)0.017 (0.002)−0.001 (−0.002 to −0.001)0.049 *0.50
Medial0.009 (0.004)0.009 (0.004)0.009 (0.003)0 (−0.002 to 0.002)0.858-
Lateral0.002 (0.001)0.002 (0.002)0.001 (0.001)0.001 (−0.001 to 0.001)0.0860.63
Instantaneous Loading Rates Peaks, BW/s
Vertical67.78 (21.72)70.35 (19.35)65.20 (23.91)5.15 (−6.08 to 16.39)0.3630.20
Posterior9.81 (3.27)9.51 (2.95)10.11 (3.59)−0.60 (−2.29 to 1.10)0.3590.18
Medial7.86 (3.64)7.59 (3.37)8.12 (3.93)−0.53 (−2.42 to 1.36)0.7560.14
Lateral8.24 (4.20)8.34 (3.76)8.14 (4.66)0.20 (−1.98 to 2.39)0.5640.05
Ground Reaction Force Peaks, BW
Vertical2.26 (0.20)2.25 (0.21)2.27 (0.20)−0.02 (−0.13 to 0.08)0.6580.10
Anterior0.19 (0.03)0.19 (0.04)0.20 (0.03)−0.01 (−0.02 to 0.01)0.6270.28
Posterior0.25 (0.05)0.24 (0.05)0.26 (0.05)−0.02 (−0.04 to 0.01)0.1680.40
Medial0.09 (0.03)0.09 (0.02)0.10 (0.03)−0.01 (−0.02 to 0.01)0.7790.39
Lateral0.05 (0.03)0.06 (0.03)0.05 (0.04)0.01 (−0.01 to 0.02)0.3520.28
Vertical Stiffness at Initial Loading, kN/m69.49 (22.13)71.95 (21.86)67.02 (22.49)4.93 (−6.53 to 16.39)0.2370.22
Values are expressed as mean (SD). ITBS, iliotibial band syndrome, CI, confidence interval. * Statistically significant (p < 0.05). Effect size of d = 0.2 was defined as small; d = 0.5 as medium; and d = 0.8 as large.
Table 3. Risk and protective profiles for ITBS (n = 60).
Risk ProfilesPR (95% CI)
Node 3
Posterior Ground Reaction Force Impulse <= 0.019 BW*s
Anterior Ground Reaction Force Impulse <= 0.012 BW*s
-
Node 6
Posterior Ground Reaction Force Impulse <= 0.019 BW*s
Anterior Ground Reaction Force Impulse > 0.012 BW*s
Anterior Ground Reaction Force Peak > 0.22 BW
8.10 (1.61 to 40.76) *
Node 8
Posterior Ground Reaction Force Impulse <= 0.019 BW*s
Anterior Ground Reaction Force Impulse > 0.012 BW*s
Anterior Ground Reaction Force Peak <= 0.22 BW
Vertical Stiffness at Initial Loading > 76.97 kN/m
2.25 (0.50 to 9.99)
Protective Profiles
Node 2
Posterior Ground Reaction Force Impulse > 0.019 BW*s
0.14 (0.02 to 0.72) *
Node 7
Posterior Ground Reaction Force Impulse <= 0.019 BW*s
Anterior Ground Reaction Force Impulse > 0.012 BW*s
Anterior Ground Reaction Force Peak <= 0.22 BW
Vertical Stiffness at Initial Loading <= 76.97 kN/m
0.11 (0.02 to 0.44) *
PR, prevalence ratio; CI, confidence interval. * Statistically significant (p < 0.05). For node 3, PR was not possible to calculate since all runners were classified with ITBS.
Disclaimer/Publisher’s Note: The statements, opinions and data contained in all publications are solely those of the individual author(s) and contributor(s) and not of MDPI and/or the editor(s). MDPI and/or the editor(s) disclaim responsibility for any injury to people or property resulting from any ideas, methods, instructions or products referred to in the content.

