1. Introduction
A pleasant online shopping experience depends on factors such as convenience, comfort, product findability. Some of these constituents of success rely on researchers conducting usage analysis of an e-commerce application in order to improve its design [
1], with these factors ranging from good typography, product photography and elegant and clean checkout forms, to personalized website structure [
2]. Others, such as managing information overload, finding interesting, and related or alternative products in e-commerce sites, depend on good retrieval and recommendation methods [
3]
As a response to this last need, recommender systems (RS) have become fundamental tools for conducting effective e-commerce. They provide customers with personalized recommendations in searching for additional products. RS collect and model past user transactions, and potentially other features such as location, demographic profiles and other people’s preferences. Several models for RS of that conventional type have been proposed and proved their efficacy. Some examples are content-based [
4] and collaborative filtering [
5] systems. These research methods make use of the long-term user profiles that are logged every time customers visit an e-commerce site.
However, these conventional RS methods have some important limitations. Firstly, in many e-commerce applications, long-term user models are simply not viable for several reasons: new users visiting for the first-time, or not being required to have user IDs, or choosing not to login for privacy or transaction speediness reasons will disrupt the functioning of these models. However, there are more drawbacks. Focusing on a community’s long-term preferences ignores short-term transactional patterns, interest, and temporal shifts. This generally degrades ability to understand the intrinsic nature of a user’s behavior in her/his current ongoing session.
To address these issues, session-based recommender systems (SBRS) have emerged. In the context of e-commerce, a session can be seen as a single episode that includes visiting several web pages and viewing items, ending potentially with multiple purchased items in one shopping transaction. The same idea can equally serve other domains such as in linear TV programming [
6], next point of interest assessments (POI), or movie and next song recommendations. SBRS solely rely on session-specific information and the user’s most recent activities. The most recent interactions the user has had with the web application, or other sorts of information that may be acquired or inferred during a session, should thus be the basis for successful suggestions. These details may include, for example, how a user arrived at the website, how long they stayed on previous pages, short-term community popularity patterns [
7], browsing patterns [
8] or the ability to predict a customer’s intent in real time [
9]. A simpler SBRS strategy is to merely utilize the currently available item and community-observed patterns, i.e., suggestions in the form of “people who viewed/bought this item also viewed/bought this item”. However, more advanced session-based methods should consider all of the user’s previous session activities in addition to the most recent item they have viewed. A thorough study of a current session may be performed by considering the possibility that additional action categories, such as searching, clicking, and cart viewing, were also included in these earlier acts.
The context we described above defines how to recommend in these scenarios. Another important consideration is to inquire what the main tasks are within these scenarios, in other words what can be recommended. The next-item or the next-basket recommendations are candidate tasks, depending on whether the recommended items are for the current running session or for the next one, respectively, if session boundaries are defined. The following events or actions should be recommended if there are not any obvious session boundaries, as in music listening apps (recommend the next movie to be watched).
Another important task in e-commerce is to establish a model of how customers behave, and to predict during a session whether the user has real purchase intent or to determine the cart abandonment probability in real time. If these events could be predicted effectively, then conversion rates would be improved if marketing would be applied and incentives would be offered. Examples of such stimuli are coupons, price discounts that are valid for a short period, and other incentives. In fact, various recommendation tasks can run complementarily to preference assessments.
Flexible recommendation systems (FRES)
https://www.fres-project.gr/, accessed on 20 February 2023, refer to a three-year research project that was funded to investigate the effectiveness of several methods and algorithms for SBRS in e-commerce, retail and web services. Several datasets and settings were used to test the effectiveness and the robustness of various SBRS methods in various tasks, namely in establishing next-item, next-basket and purchase intent [
10]. Additionally, a testing component was integrated into an e-commerce site to allow evaluation in a realistic environment. Additionally, several recommenders have been tested in mobile applications. Another aim was also to study the efficiency and other practical parameters, such as the training parameters, processing, and maintenance costs of different SBRS methods.
At the beginning of the project, we studied the concept of modeling anonymous sequential interactions in e-commerce and reviewed relevant prior work. Afterwards, we implemented and tested various forms of SBRS methods. Several types of recurrent neural networks (RNN/LSTM) were created, and their models were evaluated alongside those of other session-based recommenders that utilize various embedding techniques to represent items (Item2Vec, Doc2Vec). Furthermore, we proposed a framework to enable the hybrid application of text and product views sequences. Additionally, the core LSTM model was extended by adding an embedding layer before the LSTM layer. Finally, we used various reranking methods to improve the results of the basic recommenders using item categories.
To investigate reports claiming that recommendation methods using relatively simple statistical co-occurrence analysis are quite effective, we also developed a graph-based model for item recommendations. This method exemplifies a balance between the data processing and management requirements and the effectiveness of the recommendations produced.
Another challenge we examined during the project was the prediction of the shopping intent of e-commerce users using only the short-term browsing pattern of a user. LSTMs have been used recently in the e-commerce domain to improve recommendations; however, they have been barely used to predict a user’s buying intention. In that regard, our study contributes to a better understanding of the LSTM approach for predicting the purchase intent. More precisely, we examined whether the e-commerce scenarios in which RNN-LSTM could provide better results in comparison to more conventional ML techniques, which have been considered as the SotA for the purchase intent task.
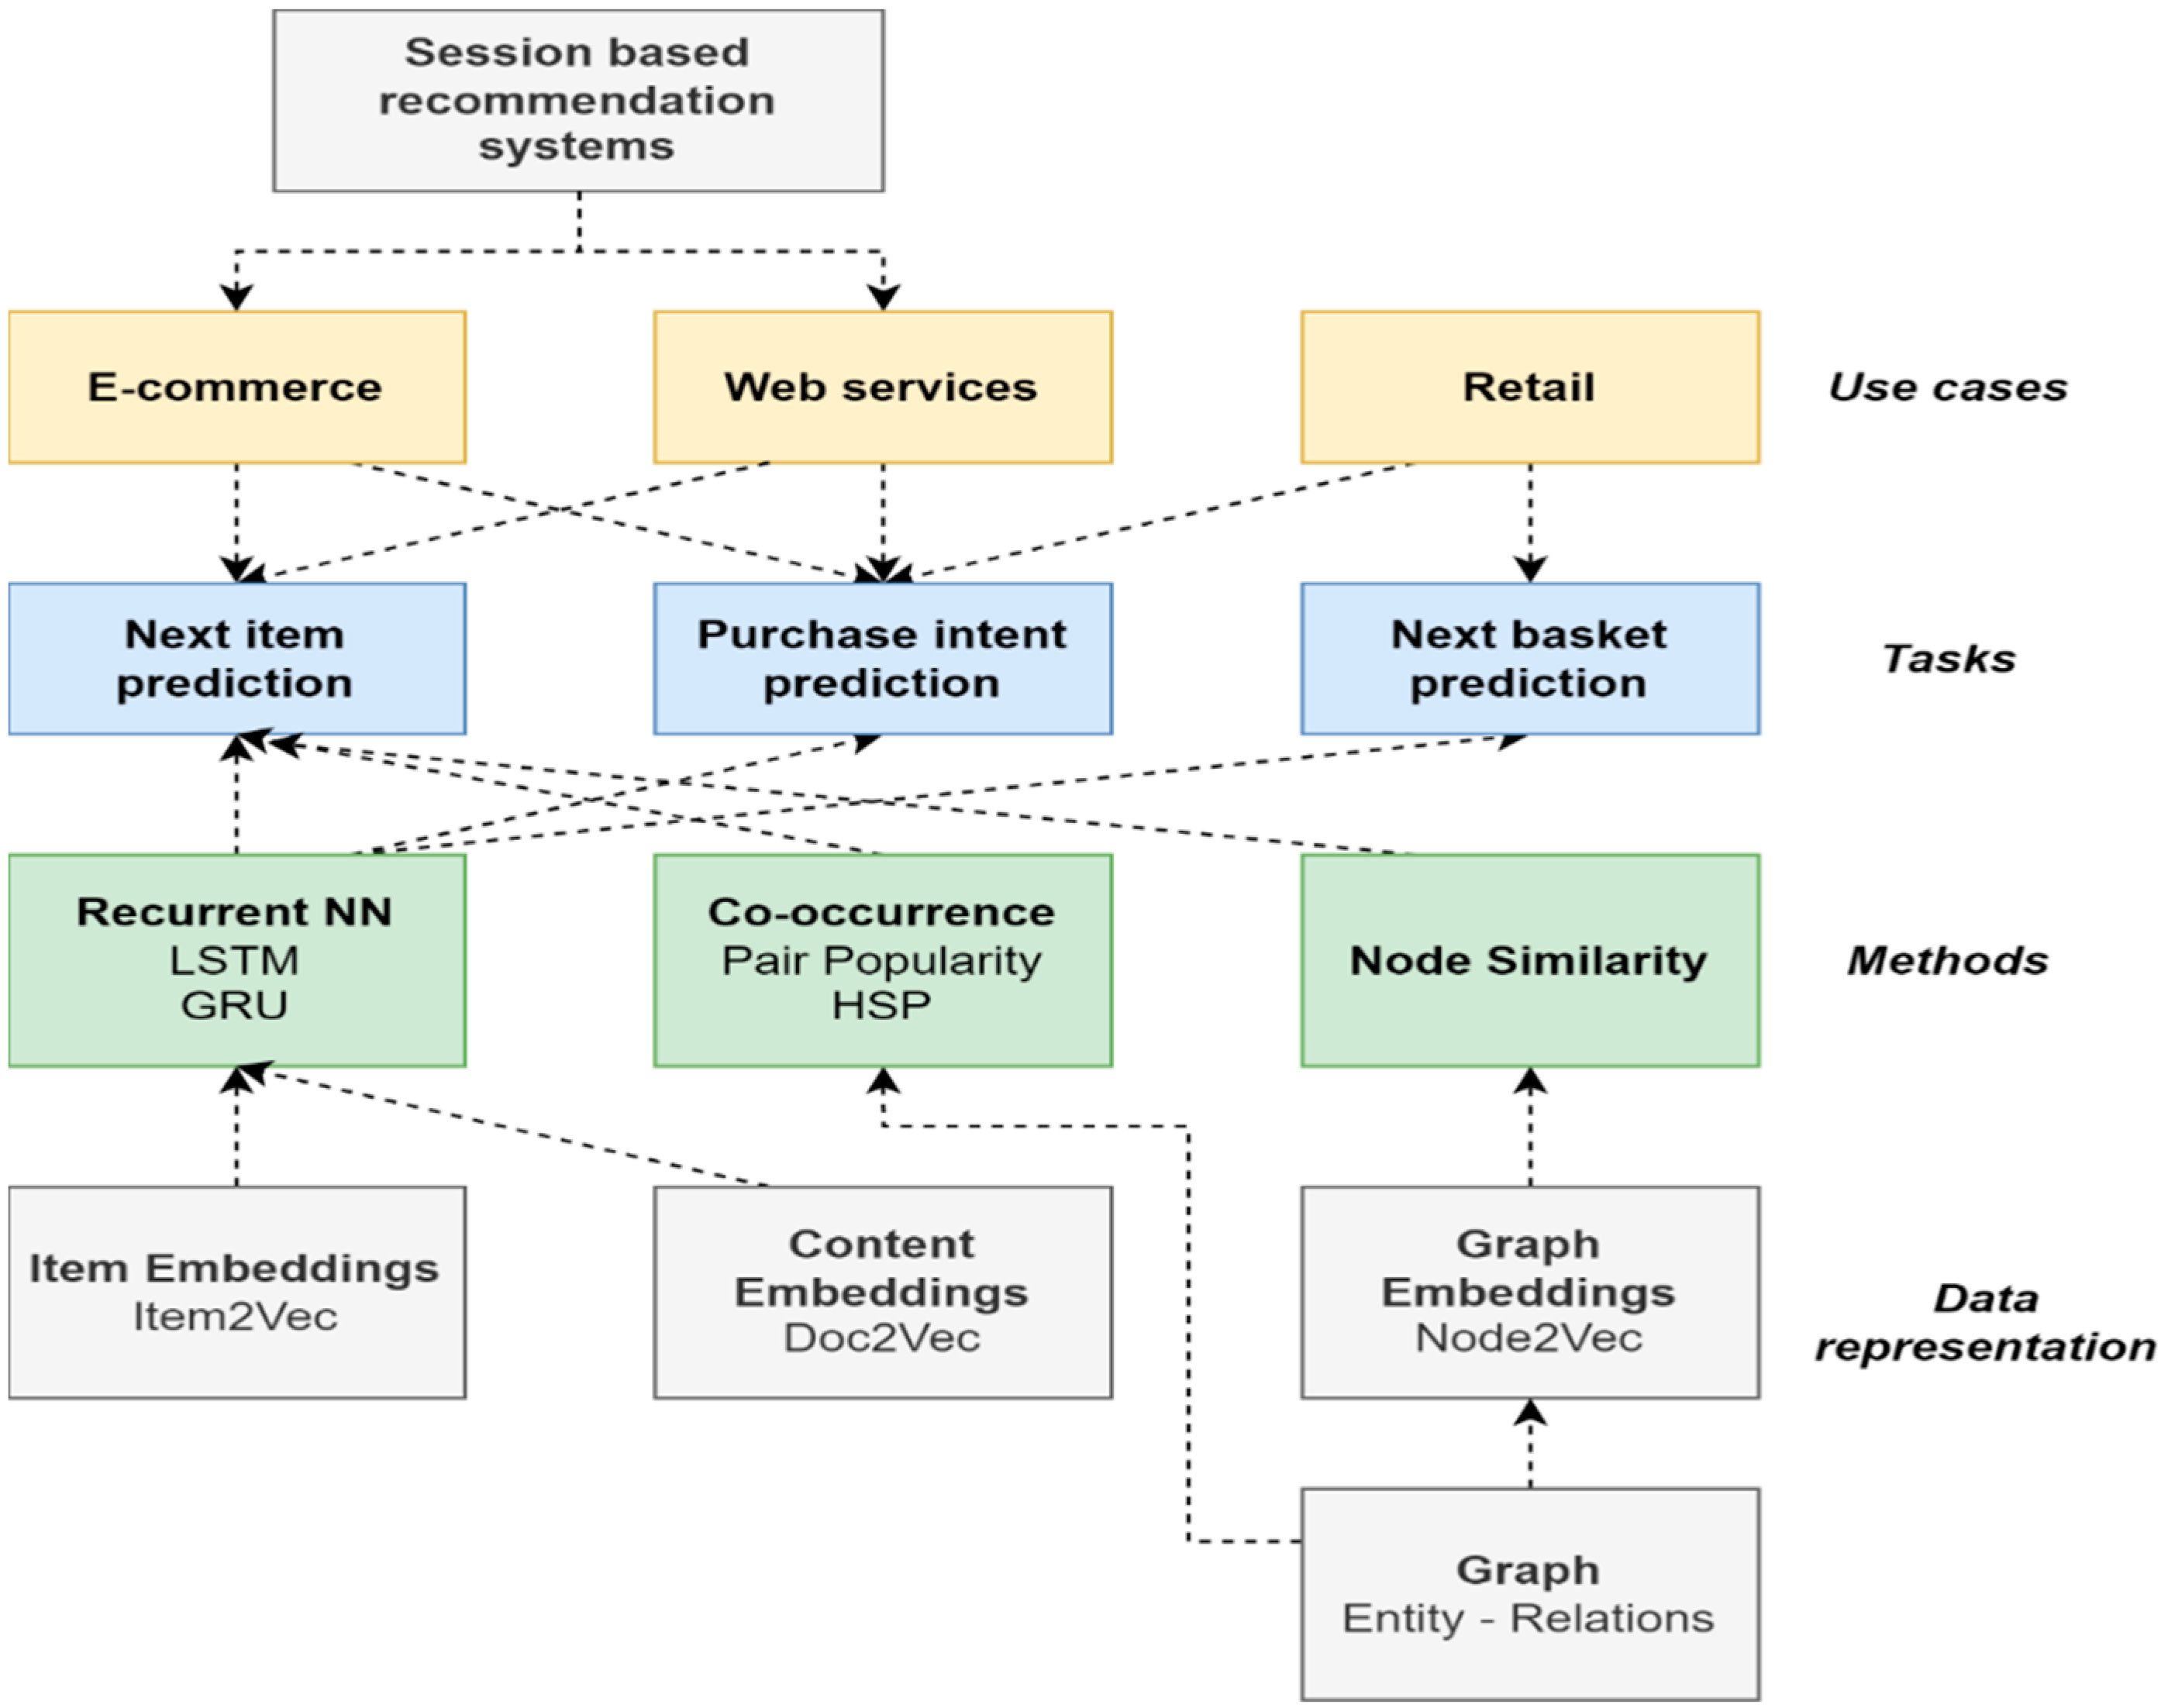
This paper presents the main results of the FRES project. The methodology of our approach is outlined in
Figure 1. The major challenges and problems of SBRS that are addressed by our research work are the following:
The development of a flexible SBRS system that is based on a common set of principles and methods to address the variety of problems in session-based recommendation systems and physical retail shops. These problems/tasks are next-item recommendation, purchase intent prediction and next-basket recommendation.
The performance of a comparative study of SotA methods from different domains, including neural networks and graph methods.
The identification of a set of efficient and general methods for representing the history of user activity such as session data and basket data history.
The paper is structured as follows:
Section 1 discusses earlier work. We go through the tasks and the methods we propose to solve them with in
Section 2. The numerous datasets we produced to assess our techniques are shown in
Section 3. We provide a description of the experiments, as well as a report and discussion of the findings, in
Section 4. In
Section 5, we summarize the results, point out challenges and issue a plan for the advancement of SBRS in the future.
2. Methods and Literature Review
In this section, we present the tasks that are addressed in this paper and the tools and methodologies that were used to tackle problems and challenges related to these tasks. For all these methods, we discuss major relevant literature that shows how each method has been developed and what the current state of the art. In particular,
Section 2.1 describes the task of predicting the next item and the last item in a session using the prior user behavior within this session.
Section 2.2 discusses graph representations methods for recommendation systems.
Section 2.3 discusses the task of purchase intent, which seeks to explicitly determine whether the intent of the user in the current session is to purchase some product or not.
Section 2.4 describes the evaluation metrics used in the subsequent experiments.
Section 2.5 presents the SBRS methods that we employed in various practical scenarios.
2.1. Next-Item, Last-Item Tasks
Early recommendation methods used simple pattern mining techniques. These techniques are easy to implement and lead to interpretable models. However, the mining process is usually computationally demanding. Furthermore, several parameters of an algorithm should be fine-tuned, and this might be difficult. Moreover, in some application domains, frequent item sequences do not lead to better recommendations than when using much computationally simpler co-occurrence patterns [
11].
After these first experiments, more complex approaches based on context trees [
12], [
13] reinforcement learning [
14], and Markov decision processes [
15] were developed. The number of prior interactions (i.e., history window) that should be taken into account while estimating the following interaction was a parameter used in these recommender models.
Word2Vec/Doc2Vec methods were developed for use in linguistic tasks, but they can also be applied in recommender methods for CF [
16]. Word2Vec is a two-layer neural network which is trained to represent words as vectors in such a way that words that share common contexts in the training corpus are located in close proximity to one another in the space. These representation vectors are known as embeddings. There are two varieties of Word2Vec called CBOW and skip-gram, with the second one being the most common approach. Skip-gram predicts the context of a word,
given
as the input. Doc2Vec is based on Word2Vec with the aim of creating vector representations of documents rather than single words. Doc2Vec creates paragraph vectors by training a neural network to predict the probability distribution of words in a paragraph given a randomly selected word from it.
Word2Vec can be generalized to represent items with vectors based on their context (i.e., other items in the same session or basket) in a very similar fashion to its means of assigning vector representations to words. It can infer item–item relationships even in the absence of user ID information. The item-to-item recommender system (Item2Vec) is initially trained using the item sequences from prior anonymous user sessions. Then, when the system is actually applied, it accepts the currently selected item as input and produces a group of related things based on the input. In fact, when compared to SVD and other sequence-based CF approaches, this method yields results that are competitive [
17,
18].
Deep neural networks have recently been suggested for recommender systems. In particular, recurrent neural networks (RNN) have been very effective models for session data of user interactions. Recurrent neural networks are extensions of feedforward networks with additional internal memory. They are created by adding a feedback loop from the output back to the input of the network. As a result, the current output depends on both the input and the previous output. The fundamental benefit of RNNs over other approaches for recommendation is that they can naturally and incrementally model series of user interactions. After creating a predictive model, RNNs offer more effective recommendations than other sequence-based conventional techniques [
19,
20].
2.2. Graph-Based Methods
The use of graph databases (GDBs) is a new approach for data modeling [
21]. A graph database represents data entities as nodes and their relationships as directed connections between nodes. Neo4j is an open source graph database tool that supports semi-structured hierarchically organized data [
22,
23]. The graph using this method is used to represent sequences of items in a session using node relationships. Thus, it becomes another way to represent item sequences.
Neo4j was used for creating various recommendation systems, making recommendations of friends, movies, and objects, and also in the field of e-commerce. Konno [
24] developed a recommendation system based on data-driven rules. They applied a two-layer approach to retail business transaction data for business information query and reasoning. Another graph-based and rule-based recommendation system approach was described by [
25]. Delianidi [
26] presented another graph-based recommender using Neo4j in which emphasis was given to efficiency. In this work, nodes and relationships between the nodes were defined using session training data. The system finds all pairs of co-occurring items in the current session by running cypher queries. Then, the similarity between the items of the pair can be calculated using these co-occurrence frequencies.
2.3. Purchase Intent Task
In all likelihood, the first techniques tested to determine whether or not a user session in an e-commerce application is likely to end with a purchase were multilayer perceptron classifiers and simple Bayes classifiers [
27]. Suchacka [
28] used data from an online bookstore to evaluate SVM using a variety of factors (23), with a similar goal of classifying user sessions as either browsing-only or purchasing-related. The most effective SVM classifier showed high performance. It achieved a likelihood of predicting a purchasing session of about 95% and an overall prediction accuracy of 99%.
Association rules and a k-nearest neighbor (k-NN) classifier were used by [
29] to enhance their study and estimate the likelihood of a purchase. To predict purchase likelihood for two client groups—traditional consumers (accuracy 90%) and more diverse–novel customers—they employed basic association rule mining and other behavioral knowledge (accuracy 88%).
The hidden Markov model (HMM) is another method that was tested. In fact, there are many web usage mining research efforts that have considered HMM to predict user behavior in several settings and for different tasks. Examples of its uses include deciding if a web search session was successful or not, establishing recommender systems [
13], or making suggestion for the next point of interest in tourism websites. Ding [
2] presented a research study that was more related to our work; however, it primarily made use of HMM to understand customer intent in real-time in order to make web page adaption.
Using user activity data, participants in the RecSys2015 competition attempted to estimate the assortment of goods that would be purchased during a session. The state-of-the-art (SotA) solution for this issue remains the two-stage classifier provided by the competition winners [
30]. While the second classifier predicts the things that will be purchased, the first classifier predicts whether at least one item will be purchased during the session or not. In this work, the session and click dates, click counts for individual things, and other category features of the sessions and objects were employed.
Recurrent neural networks (RNN) were utilized by [
31] to capture event dependencies and connections for user sessions of arbitrary length, both within and across datasets. Results from the RecSys15 challenge indicate that their solution performed admirably well. The key benefit of their approach is that it needs reduced domain- or dataset-specific feature engineering.
Another RNN-LSTM-based system for analyzing online shopping behavior was present-ed by [
9]. It had two parallel-operating components. The first predicted consumers’ tendency to shop; however, this module employed machine learning classifiers such as random forest, support vector machines, and multilayer perceptron. RNN-LSTM is only used in the second module, which predicts the likelihood that users would leave a website without buying anything. In relation to the SotA, their purchasing intent module performed much worse. The accuracy of the second module, which predicted website desertion after a short window of three-user action, was almost 75%.
A full connected long short-term network (FC-LSTM) for modeling the interactions between customers was tested by [
32]. The same network models the nonlinear sequence correlations and cumulative effects between customer’s browsing behavior. However, to attain better predictions, they use more features from user profiles, including purchase history and demographics.
2.4. Evaluation Metrics
One of the most common evaluation metrics used was the mean reciprocal rank (MRR). Its calculation formula is:
where
is the number of queries we are considering, and rank is the position of the correct answer
among the returned values, with
= 1 if x is the first item in the recommendation list. When there is no correct answer within the recommendation list, then we set
and the reciprocal rank
equals zero. In our case, the MRR varies between 0.017 and 0.03 depending on the number of responses we return.
Another evaluation metric used in our experiments is the F1 score @ k, which equals the F1 score of the recommendation list containing k items. The F1 score is the harmonic mean between the precision and the recall, defined as
where
,
, and
= true positives,
= false positives and
= false negatives.
2.5. Tested SBRS Methods and Practical Scenarios
2.5.1. Content-Based SBRS Using Doc2Vec Embeddings
This approach is similar to traditional content-based systems in that it suggests products that are pertinent to previous “liked” things by the user [
4]. The similarity is calculated on basis of the text content or other attributes of the items liked by the user. Note that the term “liked” can take several interpretations depending on the domain, application, or other context. In the context of SBRS, the items visited in the current ongoing session provide input content to the recommender.
In our project, we created a vector for each product item using the title, color, and extended description. A fixed dimension vector for every item was produced using the Doc2Vec model. We created an n-dimensional vector for each item after training the Doc2Vec model using the textual descriptions of the products. Following multiple experiments, vector sizes of 500 for the next-item dataset and 100 for the last-basket dataset were chosen. In this method, the similarities to all other things are computed for each viewed item during an ongoing session to suggest the next item. The cosine similarity measure gave slightly better results in all the datasets we tested.
2.5.2. Item-Based SBRS Using Item2Vec Embeddings
This approach is a Word2Vec technique transfer to the SBRS problem. To learn distributed representations of words, the Word2Vec approach was first used in natural language processing.
Item2Vec provides embeddings to things in a manner that is very similar to providing embeddings to words [
16]. The underlying idea is that it can be used in the sense of collaborative filtering to provide recommendations, despite user IDs not being available. The Item2Vec method uses item views like Word2Vec to process the sequence of words; in this process, the word sequences match to the users’ sessions while they browse an online store (sentences). Our technique utilizes Word2Vec’s skip-gram variety of Word2Vec. As such, the underlying assumption is that, given a sequence of previously visited items in an ongoing session, the task is to predict the next item(s).
We tested several embeddings by increasing the sizes of vector dimensions, but the best sizes were 30 for the next-item task/dataset and 100 for the next-basket task/dataset. L2 norm achieves better results when measuring the similarity between items in the first dataset, whereas cosine similarity produced better results in the second dataset.
2.5.3. SBRS Methodology Using Embeddings
When implementing recommendation methods relying solely on the ongoing session, there are several decisions that should be considered on how to execute such operation. For example, how many previous actions of the ongoing session should be accounted for in the prediction? Or, how the previous actions will be summarized of the ongoing session to represent the behavior so far? The following list outlines all these steps and the parameters that are typically involved.
Obtain the embeddings of the most recent n items a user has visited in their current session (or purchased in previous n baskets in the next-basket task). This parameter affects how well these recommenders function.
Use these embeddings to calculate the average vector, u.
Calculate the L2 norm or the cosine similarity between the vector u and each of the other dataset items’ embeddings
The user’s recommendations are the top k most similar items.
We conducted several experiments in our project to assess how these criteria might affect the results. In order to obtain the vector u, we averaged the embeddings of either the last n items the user viewed during a current session or all of the products they purchased in the previous n baskets. We conducted a number of tests and found that the “temporal locality principle” typically holds. Results are improved when only the most recent items are taken into account; in other words, recent behavior greatly outperforms activity from the session’s very beginning in terms of predicting the next action. In general, all SBRS approaches perform better when a smaller memory of the user activities is taken, as we shall demonstrate later.
2.5.4. Hybrid Methods
Systems aggregating both collaborative filtering and content-based methods are called hybrid recommenders [
33]. In our research, we explored if the two embedding techniques we created could be used together to operate a hybrid usage of text and item sequences. In particular, our system combines the browsing patterns of all sessions, together with the model that is developed based on item’s text, using the Item2Vec and the Doc2Vec methods, respectively.
The two methods produce their predictions inside their vector space. The vectors generated by the Item2Vec method are located in one vector space, whereas those generated by the Doc2Vec method are found in the other. Both techniques estimate item similarity using the cosine similarity. The range of cosine similarity is [0, 1]. Therefore the closer the value is to 1, the stronger the similarity and prediction will be. Given that cosine similarity has a range of [0, 1], the stronger the similarity and pre-diction is, the closer the result will be to 1. In our hybrid approach, we compute the combined prediction using v = [1-CosineSimilarity]. The values’ range is still [0, 1] in this instance, but the prediction is now greater the closer a value is to 0.
For each of the two methods, we multiplied the value of v with the rank of the item in the recommendations list. The product indicates the confidence each method gives the recommendation. Finally, we combined the Item2Vec and Doc2Vec confidences to calculate the final prediction value.
2.5.5. Graph-Based SBRS
In our project we implemented two SBRS methods using Neo4j. The first method, called pair popularity, models in the graph all item co-occurrences found anywhere in the same session. Having recorded the item P viewed by the user at session step t, the method recommends a list of items for step t+1 based on how often the items co-appeared with P in the training sessions. Later, we proposed the hierarchical sequence popularity (HSP) recommendation method. This method uses a hierarchical representation of item sequences in user sessions to further improve the results and produces significantly better results. To recommend an item, we looked at its frequency of appearance as well as the history of sequences of length 1 or 2 in which this item participated during the training sessions. In the absence of history (i.e., in the first step of a session), items were recommended based on their popularity. Both recommendation approaches can be applied to a wide variety of e-shops regardless of the type of items. The item recommendations that the methods offer can be used as an essential component to automate and improve the identification of related items for the online customer.
The main advantage of graph-based recommenders is that they quite are effective, but at the same time are efficient when considering the complete operation cycle of SBRS (data gathering, modeling, processing, analysis, filtering). Graph-based SBRS, due to their underlying architecture, can incrementally collect data from an e-commerce website from all ongoing user sessions. Moreover, these data are immediately available to the recommendation algorithm because no training phase is required. Finally, it is easy to integrate new business rules and constraints on demand, something that is more difficult to inherently implement using ML methods.
Generally, scalability is a critical issue that should be very carefully considered, especially when building SBRS for big data. If a method is very effective, but it requires a substantial amount of training time exceeding the periodic time in which the recommender prediction model should be updated (every day or every week), it is not applicable.
2.5.6. SBRS Methodology Using LSTMs
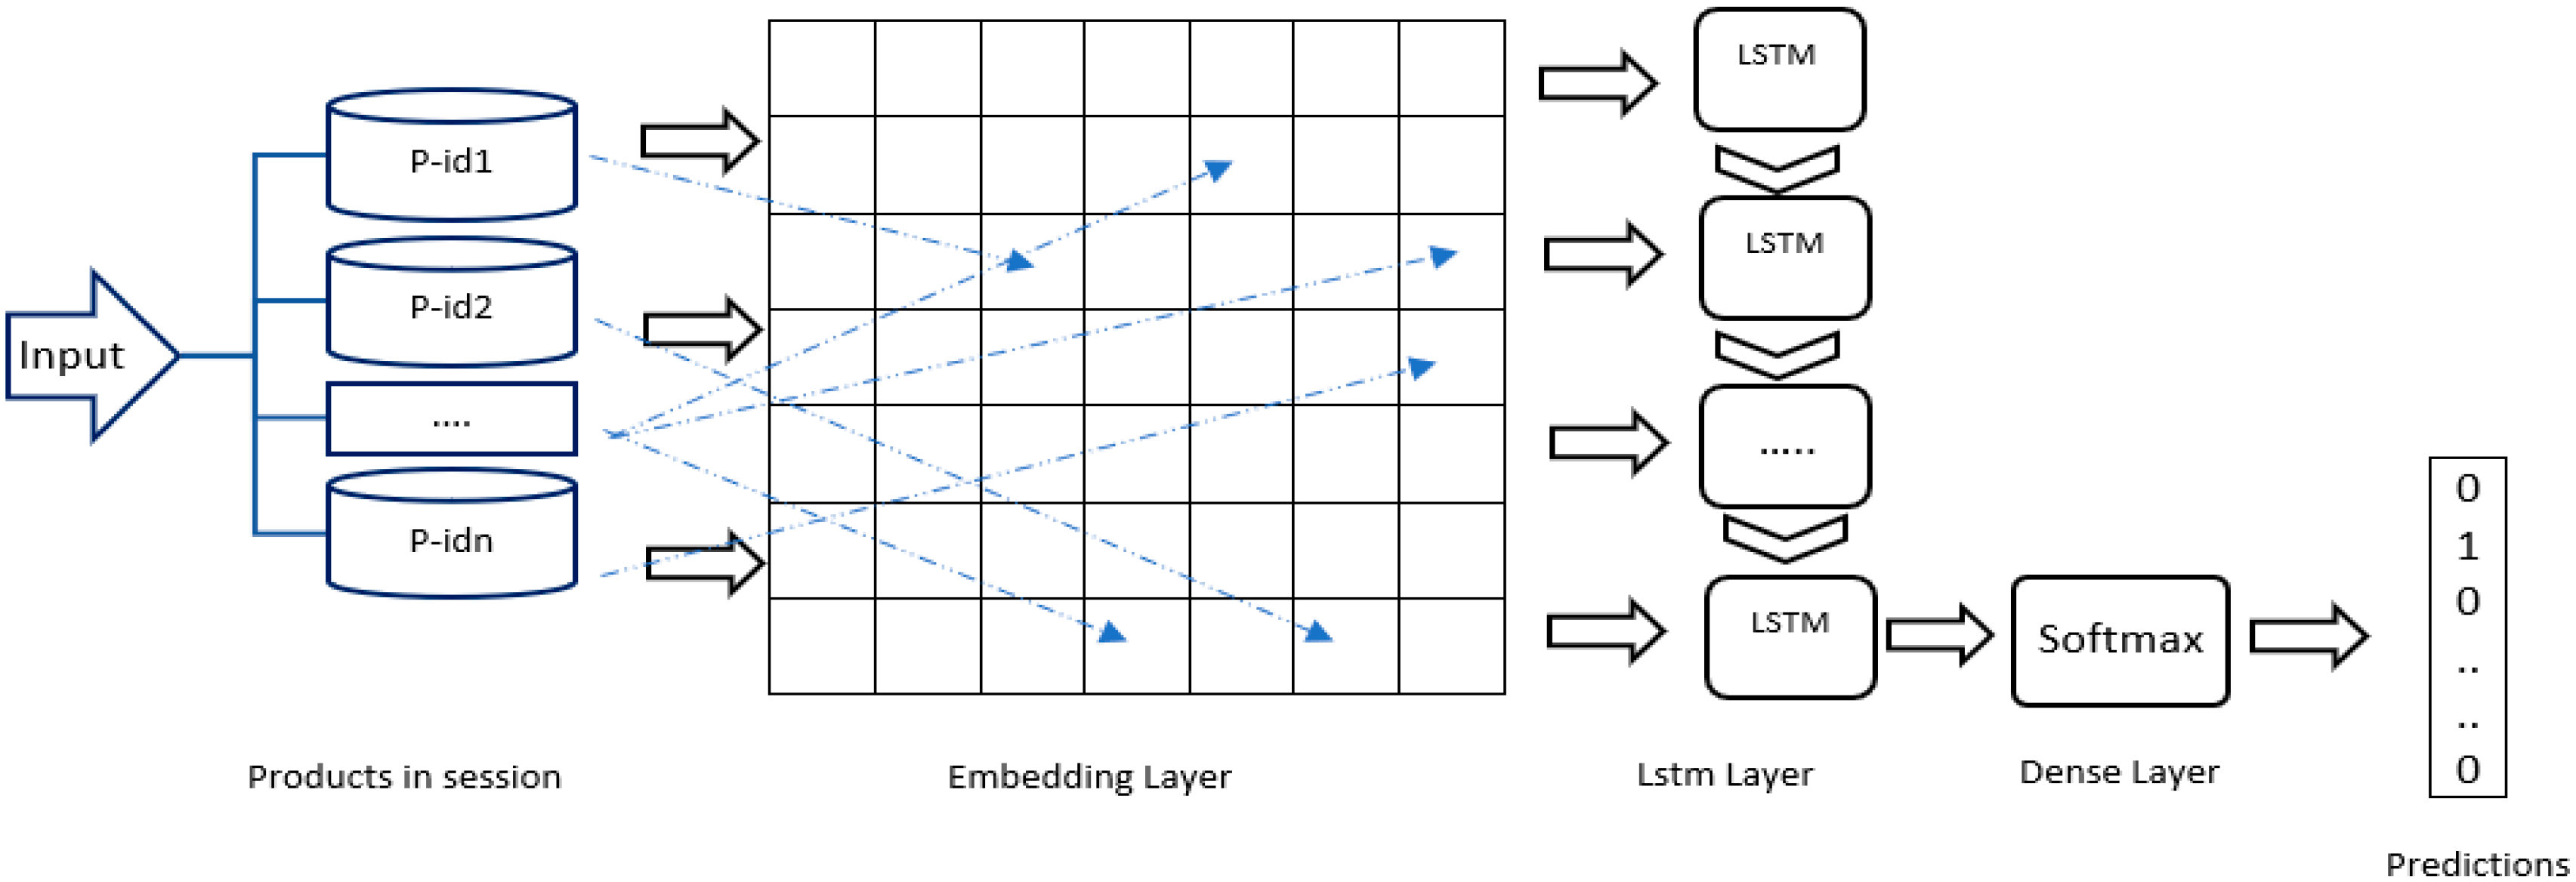
In a typical architecture of an LSTM recommender, the recently visited item(s) of the ongoing user’s session are the input. The output is the next item to be recommended using the system’s one-hot encoding. Compared to all the other methods, this one has actually produced strong results. At the conclusion of the model’s 20-epoch training process, we obtained the best score by utilizing 200 hidden units for the LSTM layer and a Softmax layer with a size of 1097 units for categorical cross-entropy loss.
Figure 2 shows the architecture of this recommender.
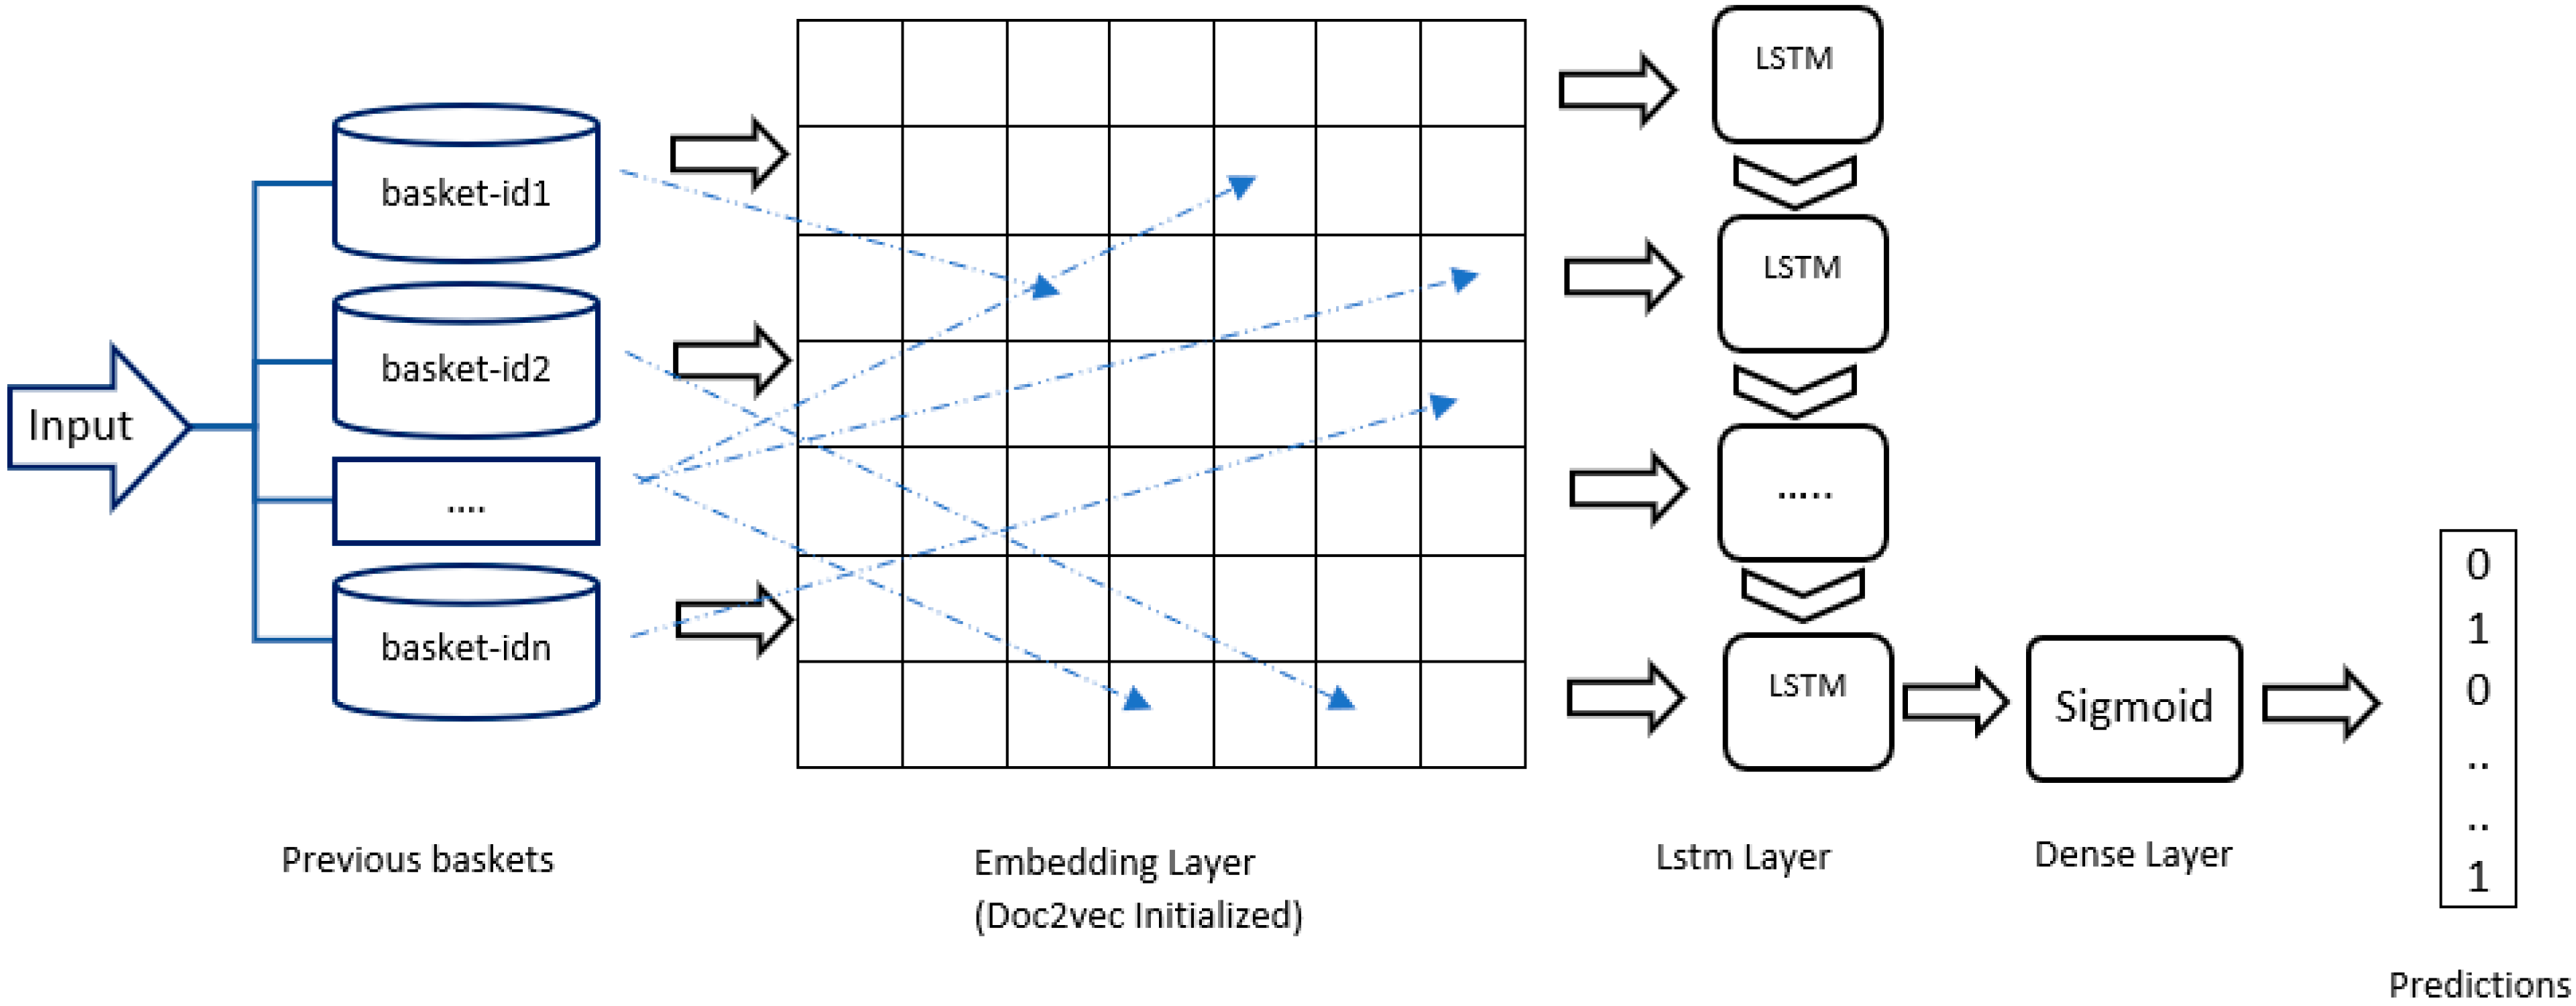
For the last-basket job, the user’s previous baskets provided the input. The average Doc2Vec vector of the items inside each basket was used to represent each basket. We received a sorted list of all the probabilities for each item as the result. The best F1@2 score for the model’s hyperparameters was obtained using 300 LSTM units, 100-dimensional Doc2Vec vectors, and 100 epochs.
An additional embedding layer was added to the LSTM recommenders to improve their performance (
Figure 3). In particular, we expanded the approach by using the vectors we trained with Doc2Vec as the initializing weights of the LSTM. As compared to our basic LSTM approach and our hybrid technique (which combines Item2Vec and Doc2Vec), this expansion provided an overall improvement in MRR of up to 10% and up to 100%, respectively.
2.5.7. SBRS and the Purchase Intent Task
Our method for predicting purchase intent modeled all user actions as a sequence like in our recommenders. However, it differed in that we applied extra features. Specifically, one such feature was the time (in seconds) the user spent in each action. We also used four other features (season, day, working hours, origin). These extra features were important for an e-commerce application as other studies have shown that buying behavior changes over time [
30]. The feature Season specifies a high season (autumn/winter for leather apparel) or not. We also know that a purchase is more likely to be made on the weekend, and that visiting an e-commerce application in midday hours usually results more purchases than in the night hours.
Nevertheless, the main difference in the purchase intent task is that we retrieved and modeled all user actions, and not only the View Item actions, as we did in our recommenders. All user actions belong in one out of the twelve action types. These twelve action types include all potential actions that customers do in e-commerce web applications. As such, hence they may be seen as a “standard” set of action types for other studies in the e-commerce domain.
Table 1 shows all user action types modeled and their frequency in the dataset and in each of the two session types we wanted to predict. Most of them are self-explanatory. The action type “Concerned” means that a user has visited a web page reflecting a customer concern about privacy policy, payment security or product shipping and returns. The “Recommend Product” action signals the recommendation of a product to another person by sending an email message.
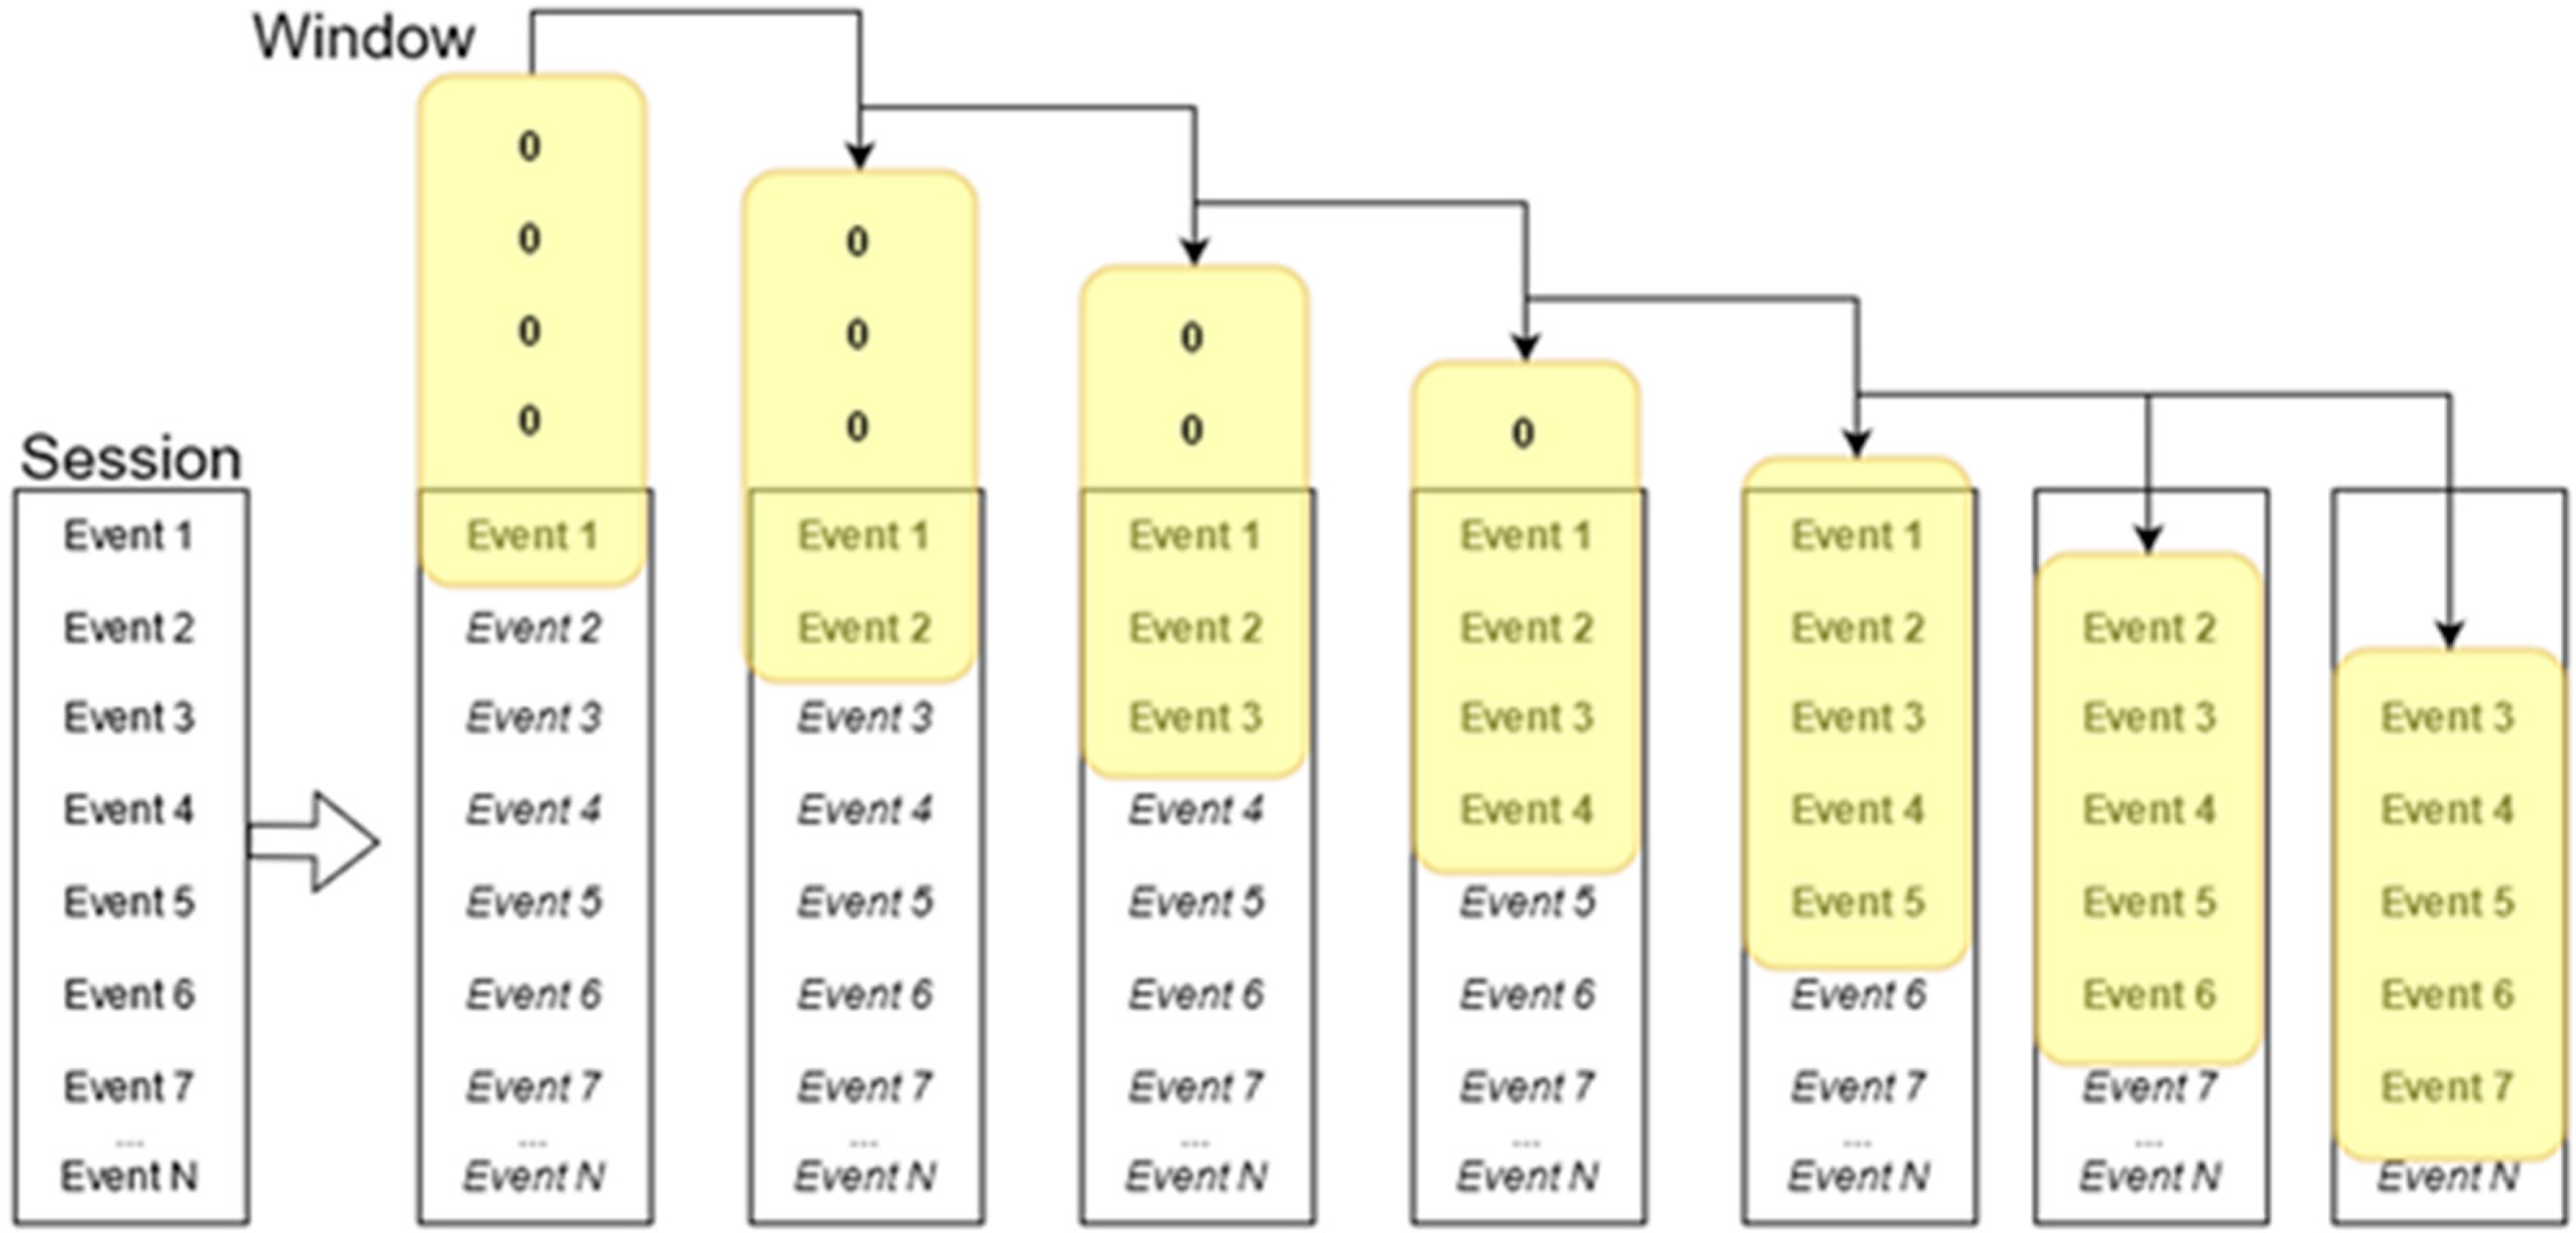
In this task, each event is represented with a vector and each session is modeled as a sequence of events. A sliding window, starting from the first session action, designates the context of each user movement and it is exactly this context window that it used as a sample for training (
Figure 4). The length of the window (N) is a parameter of our method. If the window ends inside the first N-1 events, the previous navigation steps apparently remain fewer than the size of window. In this case, the empty slots are taken as zeroed events.
Similarly, for each input instance, the output is computed using the remaining events. Specifically, for every occurring event, Ei, our method calculates the outcome after considering all the remaining events until the end of the session. The target is modeled as a 2-digit enumeration structure. Each binary digit independently represents one of the two actions of interest (i.e., add cart, make order). Thus, in total there are four outputs possible. Two of them, [1, 0] and [0, 1], signify that at least one add-cart or one purchase event occurred, respectively. The existence of both events is the output [1, 1]. If both these two events do not occur in the remaining segment of a session, the output is coded as [0, 0].
To summarize, our purchase intent system is modeled as a multilabel classification problem that determines, for each session action, the result of the rest session. The following four scenarios outline four different outputs:
A user adds item(s) to her/his cart but does not make a purchase finally. This is the cart abandonment scenario.
A user adds item(s) to the cart and makes a purchase (purchase scenario).
None of the add-item and make-order events happens (browse-only scenario).
A user makes a purchase.
2.5.8. Last-Item (Calling Tune Recommendation) Task Using the Node2Vec Method
In this task, we used a different method called Node2Vec, inspired from bio-informatics. The Node2Vec framework learns low-dimensional representations for nodes of a graph using random graph walks starting at a target node. This method requires the creation of a graph where the associations between the various entities—in our application, the main entities were users, songs, artists, genres—are represented as arcs. After creating the graph by applying 2nd-order random walks, numerical representations for each node within the graph can be produced. These representations are finally used as input to the classic word2vec algorithm (skip-gram model with negative sampling) to derive the final embeddings of each node. In essence, the resulting embeddings preserve the structure of the original network in the sense that related nodes have similar representations.
The key characteristic of 2nd-order random walks is that each transition to a neighboring node is accompanied by a probability, defined as a hyper-parameter, different from that of returning to the previous node. This particular methodology requires the user to define a series of hyper-parameters that control the process mainly in terms of complexity. These basic hyper-parameters are the following: number of walks, walk length, return value to the previous node (return hyper parameter—), and transition value to a new node (in-out hyper parameter—). The last two parameters concern the transition between nodes during the random walks phase.
When implementing this method, we had to solve several efficiency and scalability challenges. Initially we used the python library NetworkX to create the graph. NetworkX is the most common open source package for creating and editing graphs in python. Nevertheless, the specific method in its basic implementation, although highly effective, is not scalable enough due to memory (RAM) problems. This is because 2nd-order transitions increase the number of total transition probabilities quadratically with respect to the number of edges within the graph. For this reason, another implementation of this method called PecanPy was used which largely solves memory sufficiency problems. In essence, PecanPy solves the problem of parallelizing the two otherwise parallel processes, i.e., the preprocessing of the transition probability from each node, as well as the random walk application.
3. Datasets
In terms of data, the problem of SBRS becomes complex. There are several data items and certain feature selection, and session and feature engineering will be needed. The item (product, movie, tune, etc.) is the central concept, however the presence of the session concept and the potentially different domains, bring extra complexity. For example, selected past sessions may be characterized as irrelevant to the current ongoing session. The item concept in e-commerce will normally be a tangible product. However, item in the music domain will be a song. Additionally, tasks like the purchase intent or the requirement to address the temporal locality principle (i.e., make recommendations that predominantly reflect recent behavior) bring even more complexities.
Furthermore, a dataset in SBRS research should have a clear session structure. The session structure may also present a clear ordering of the events that occur within a session. If a sequence of the events is explicit in the dataset, then this dataset is best fitted for next-item tasks. Sometimes, session boundaries may be clear; however, the sequence of events within the session are not specified. For example, in a shopping cart dataset, each shopping basket has clear session boundaries which distinguish it from all the other baskets, and so it naturally represents a session. The recommendation tasks on such dataset can be next-item(s) or next-basket recommendations. However, it should be noted that the entire basket session should be considered in its entirety. This because we do not know the sequence in which a user has put these items into the basket. For all these reasons, such a dataset is better suited for the next-basket task and is totally unsuitable for the purchase intent task.
Our experimental work in the project was driven in part by the views we discussed above, but mainly by the funding requirements to deploy, apply, and evaluate our developed methods in real e-commerce environments for a long duration.
Many experiments reported in this paper used data that were extracted from the web server logs of an apparel e-commerce website for a relatively long period of time (a few months). The log data were analyzed to identify sessions, session length, user actions in each session, actions’ related items, item categories, and time spent on each action. As a result of this preprocess, the first dataset we produced (Dataset A) consisted of 24,111 sessions that altogether counted 312,912 user actions. Twelve different action types exist overall, but all the events were utilized only in the purchase event task. The 728 sessions ending in purchases represent a 3% conversion rate. In 22,008 sessions, users did not have any items in their shopping cart when they exited, meaning that 91.2% sessions were browse-only. The rest of the sessions had items in their shopping cart when they finished, but these never turned into purchases. In the next-item experiments reported in
Section 5, we included only the “View Product” user actions and only the sessions holding at least two different item views, finally collecting a number of 12,128 applicable sessions consisting of 67,101 “View Product” user actions.
The above dataset was further processed to create another variation (Dataset B) suitable for the purchase intent task. In this second dataset, we used all event types listed in
Table 2, but we kept the sessions that had at least 3 behavior sequences. This preprocessing led to the final dataset containing 21.896 sessions, including 258.101 user actions (the size of each session was 11.7 actions in average and the Median was 8). The average size of Browsing, Cart Abandonment and Purchase sessions are 11, 18.8, and 19.5, respectively. The 689 purchase sessions make a conversion rate of 3.14%. In 90.9% of sessions (19.902), users did not add any items to their shopping cart. In 1305 sessions, users added items to their shopping cart, albeit without completing a purchase.
Table 2 shows all user action types and their frequency in the complete dataset.
The third dataset we created (Dataset C) reproduces the next-basket scenario and it is also built on a real application. It contains purchased items (in baskets) from a pet-shop store. The dataset has 40,203 transactions (baskets) belonging to 1493 users of which 1408 two or more baskets, i.e., they can be included in the experiment. The dataset contains 6626 items in total. The average length of all baskets is 2.26, therefore we calculate F1@2 in our results. Another parameter that we tested was the number of previous baskets to consider in predicting the last-basket content.
In later phases of the project, we installed a logging component into an e-commerce web application, and we collected data, although this time not from the web server logs but directly by logging specific user actions. For the experiments we report in the next section, this dataset (Dataset D) was processed to obtain only the sessions that contain the “View Item” and “Add to Cart” actions, resulting in 102.024 records. A typical split into train (80%) and test (20%) datasets was performed. Thus, the train sessions are 81.651 and the test sessions 20.373. The total number of unique sessions is 19.236 which corresponds to 15.388 sessions in the train set and 3.848 unique sessions in the test set. The dataset contains 1448 unique items, of which 1429 appear in the train set and 1296 in the test set.
One last dataset we used was the one for the calling tune recommendation task using the Node2Vec method (Dataset E). The data for this task fall into one of these entities: user, song, artist, and genre of music (user_id, item_id, artist_id, genre_id). Initially, the construction of the graph required in Node2Vec was carried out by connecting all the correlations of the above fields with the central entity, which is that of the song/tune (item_id). Specifically, the following associations were added to the graph: item_id->user_id, item_id->artist_id, item_id->genre_id. It is worth noting that a graph created in this way is neither directed nor weighted. The initial dataset contained 662,698 instances. Many of the users appeared more than once and were the customers of interest to our method because users with a single transaction cannot be tested. For this reason, all records having users with just one transaction (tune) were removed and the final size of the dataset was reduced to 570,533 transactions. Then, to configure the train and test set, the following procedure was followed. The train set comprised all user tune records except for the last one, which was put in the test set. For example, if a user has 4 transactions, the first 3 are included in the train set while the fourth ends up in the test set. The size of the two resulting sets was 478,572 for the train set and 91,961 for the test set. The total training time of the model was in the order of minutes (5–10), which gives more value to this method.
4. Results and Discussion
Before discussing the results of each technique, we need make a few clarifications based on the experimental setting.
Section 4 provides a description of the datasets. In the next-item task, we created a list of recommended things that executed all methods for each item in each test session.
If a method needs the sequence of the item(s) viewed hitherto, then this sequence is provided to the method. We estimate the reciprocal rank for each list that each method returns, which is a ranked list of n recommended item(s) (RR). In this manner, the RR for each test session’s action is computed.
The mean reciprocal rank (MRR) of the entire session may then be calculated. Finally, the MRR of the approach can be calculated by averaging the MRR of all sessions that have been tested. The reason we choose MRR as the evaluation measure is because it expresses the effectiveness of a method to recommend the next-item as highly as possible in the recommendation list. If a method achieves an MRR of 0.25, then a recommender would require showing 4 recommended items to effectively include an item that could be selected with high probability.
The experiments described below were executed on a computer with an AMD Ryzen-9 CPU @ 4.9 GHz, 32GB memory, and a NVIDIA Titan Xp GPU card. The neural network models were executed on the tensorflow-2 platform, while Neo4j was used for the graph-based algorithms.
4.1. Results of the Next-Item and Next-Basket Tasks
In these experiments, 90% of dataset A was used for training and the remaining 10% for testing. A random split was repeated five times. The results reported here are the average of the results produced from each split. In the last-basket task, all available baskets were used both for training and testing. Specifically, all baskets, except for the last one, were used to train the last-basket prediction model. Then, the last basket of each user’s baskets was predicted and compared to the actual last basket the user purchased.
The post-prediction reranking was inspired by the knowledge that several product categories dominate each customer’s purchases. To apply this reranking method, we define the dominant category as the one with the most “hits” from the session’s start. Once the prevailing category is determined after each user action, all the recommended items in the dominant category are top-ranked. In the table summarizing the results, this method is indicated as “with reranking”.
The results of each method for the next-item (MRR) and the last-basket (F1@2) tasks are presented in
Table 2. The column “last” shows the results if only the last item was taken as the context. The column indicated as “all” presents the results when the entire user behavior sequence, from the session start until the current item, is taken into account.
The LSTM methods produced considerably better results. The MRR was 0.265 when we initialized the LSTM recommender using random weights. The embedded layer which we added improved the performance only marginally. The Doc2Vec method was the best from the embeddings that we tested, attaining an MRR of 0.101. The Item2Vec method performed less effectively, having an MRR of 0.087. When the content-based and the item sequence embeddings were combined, they produced better results. Finally, our experiments confirmed the intuitive assumption that category-driven reranking improves the results, except in the LSTM method. We believe this occurs because LSTMs already capture the focus on specific product categories.
Table 3 also illustrates the results of the last-basket prediction task. Column 4 presents the F1@2 results, considering seven previous baskets as the purchase history. Column 5 illustrates the results when all the purchases are considered. In these experiments, the results are quite different from the next-item task. In the reverse of what happens in the next-item task, the Item2Vec method in this task performs much better than the Doc2Vec. This is due to the smaller textual information available in the items in this dataset. Quite surprisingly, Item2Vec outperforms the LSTM method when only seven baskets are considered; however, the performance order is marginally reversed with larger purchase history. Generally, all methods produce better results when a shorter purchase history is used. It seems that a principle of locality consistently holds which states that the next user action is influenced more intensively by its immediate surroundings. Another interesting result is that category-based reranking negatively affects all methods. We believe this outcome relates to the organization of the dataset which has very few categories.
4.2. Results of the Purchase Intent Task
Dataset C was used in this task. A 10-fold stratified cross-validation procedure was applied. We found that the optimal settings are a 0.2 dropout rate, Adam optimizer and 500 LSTM units.
Table 3 shows the results using window size N = 10. When we combined LSTM with a GRU layer, the performance was better in comparison to result obtained using one LSTM layer. This finding is in accordance with other studies on sequence modeling (Chung et al, 2014), in which combinations of LSTM and GRU variants outperform standard RNNs. At the end of the architecture, we used a dense layer with sigmoid function to deliver the final probabilities for multilabel prediction.
The results produced by our fine-tuned method are better than those from other similar research reported in the literature using RNN-LSTM. Additionally, the results are comparable to the accuracy results that SotA methods have achieved (
Section 2.3).
The window size, i.e., the size of previous items considered as “history”, is an important parameter for our method. To that end, we performed further experiments to test our model using different window sizes. The cart abandonment sessions are of particular economic interest for e-commerce applications because the user adds item(s) into the cart, but s/he does not complete a purchase in the end. An e-commerce application will benefit remarkably if these sessions are predicted during a session as early as possible.
Table 4 presents the accuracy results as a function of multiple window sizes in two different conditions. The first includes all sessions, and the second considers only the “Cart Abandonment” sessions. The prediction of the cart abandonment sessions is less effective. Similar findings have been observed in other studies as a result of datasets containing many sessions that did not conclude with a purchased basket, and very few cart abandonment and purchase sessions.
4.3. Results of Our Graph-Based SBRS
Table 5 presents the MRR results of the proposed hierarchical sequence popularity recommendation method in comparison to the “simple” pair popularity graph-based recommendation approach and other recommendation methods using machine learning models (Item2Vec, Doc2vec and LSTM) in Dataset D.
Between the two graph-based methods, the new HSP approach outperforms the pair popularity approach in both next-item recommendation scenarios by 3–4%. In terms of comparison with the machine learning methods tested, in the case of the Item2Vec and Doc2vec models, the HSP method prevails by a significant margin.
According to the experimental results, the method that produces the best results is the LSTM machine learning model. The HSP makes recommendations based on limited history and using a quite small memory window extending up to only two previous items. Nevertheless, the performance of the HSP method is very close to the LSTM performance. This is surprising because the LSTM is one of the most powerful models and is equipped with infinite memory capability, enabling maximal exploitation of the history data in a session to produce good recommendations.
4.4. Results for the Calling Tune Recommendation Task using Node2Vec
In the experiments using Dataset E, after fine-tuning, the final values of the hyper-parameters discussed in 3.8 are the following: number of runs = 10, length of runs = 100, p value = 0.5, Q-value = 1.
A disadvantage of the way we implemented the Node2Vec method in this problem was that most nodes represented users. As a consequence, recommendations with the most “relevant” nodes always returned a large number of users. For this reason, there was a risk that, if the list of recommendations we requested from the graph was relatively small (of the order of hundreds), we would not receive recommendations concerning calling tunes. This was also the reason why MRR attained very low values.
Table 6 shows how the MRR is shaped in relation to the number of recommendations and how many queries end up not returning any music as an answer.
In summary, the Node2Vec recommendation method solves the problem of tune recommendation, but at the same time it is a method that does not require high computational costs. Its evaluation, although it does not seem very impressive, in reality should be considered highly satisfactory for this type of problem. Its qualitative evaluation showed that there is indeed a great relevance between the suggested tunes and the history of the user, regardless of whether s/he had not selected them up to that point in time.
4.5. Push (Offers) Notifications Task
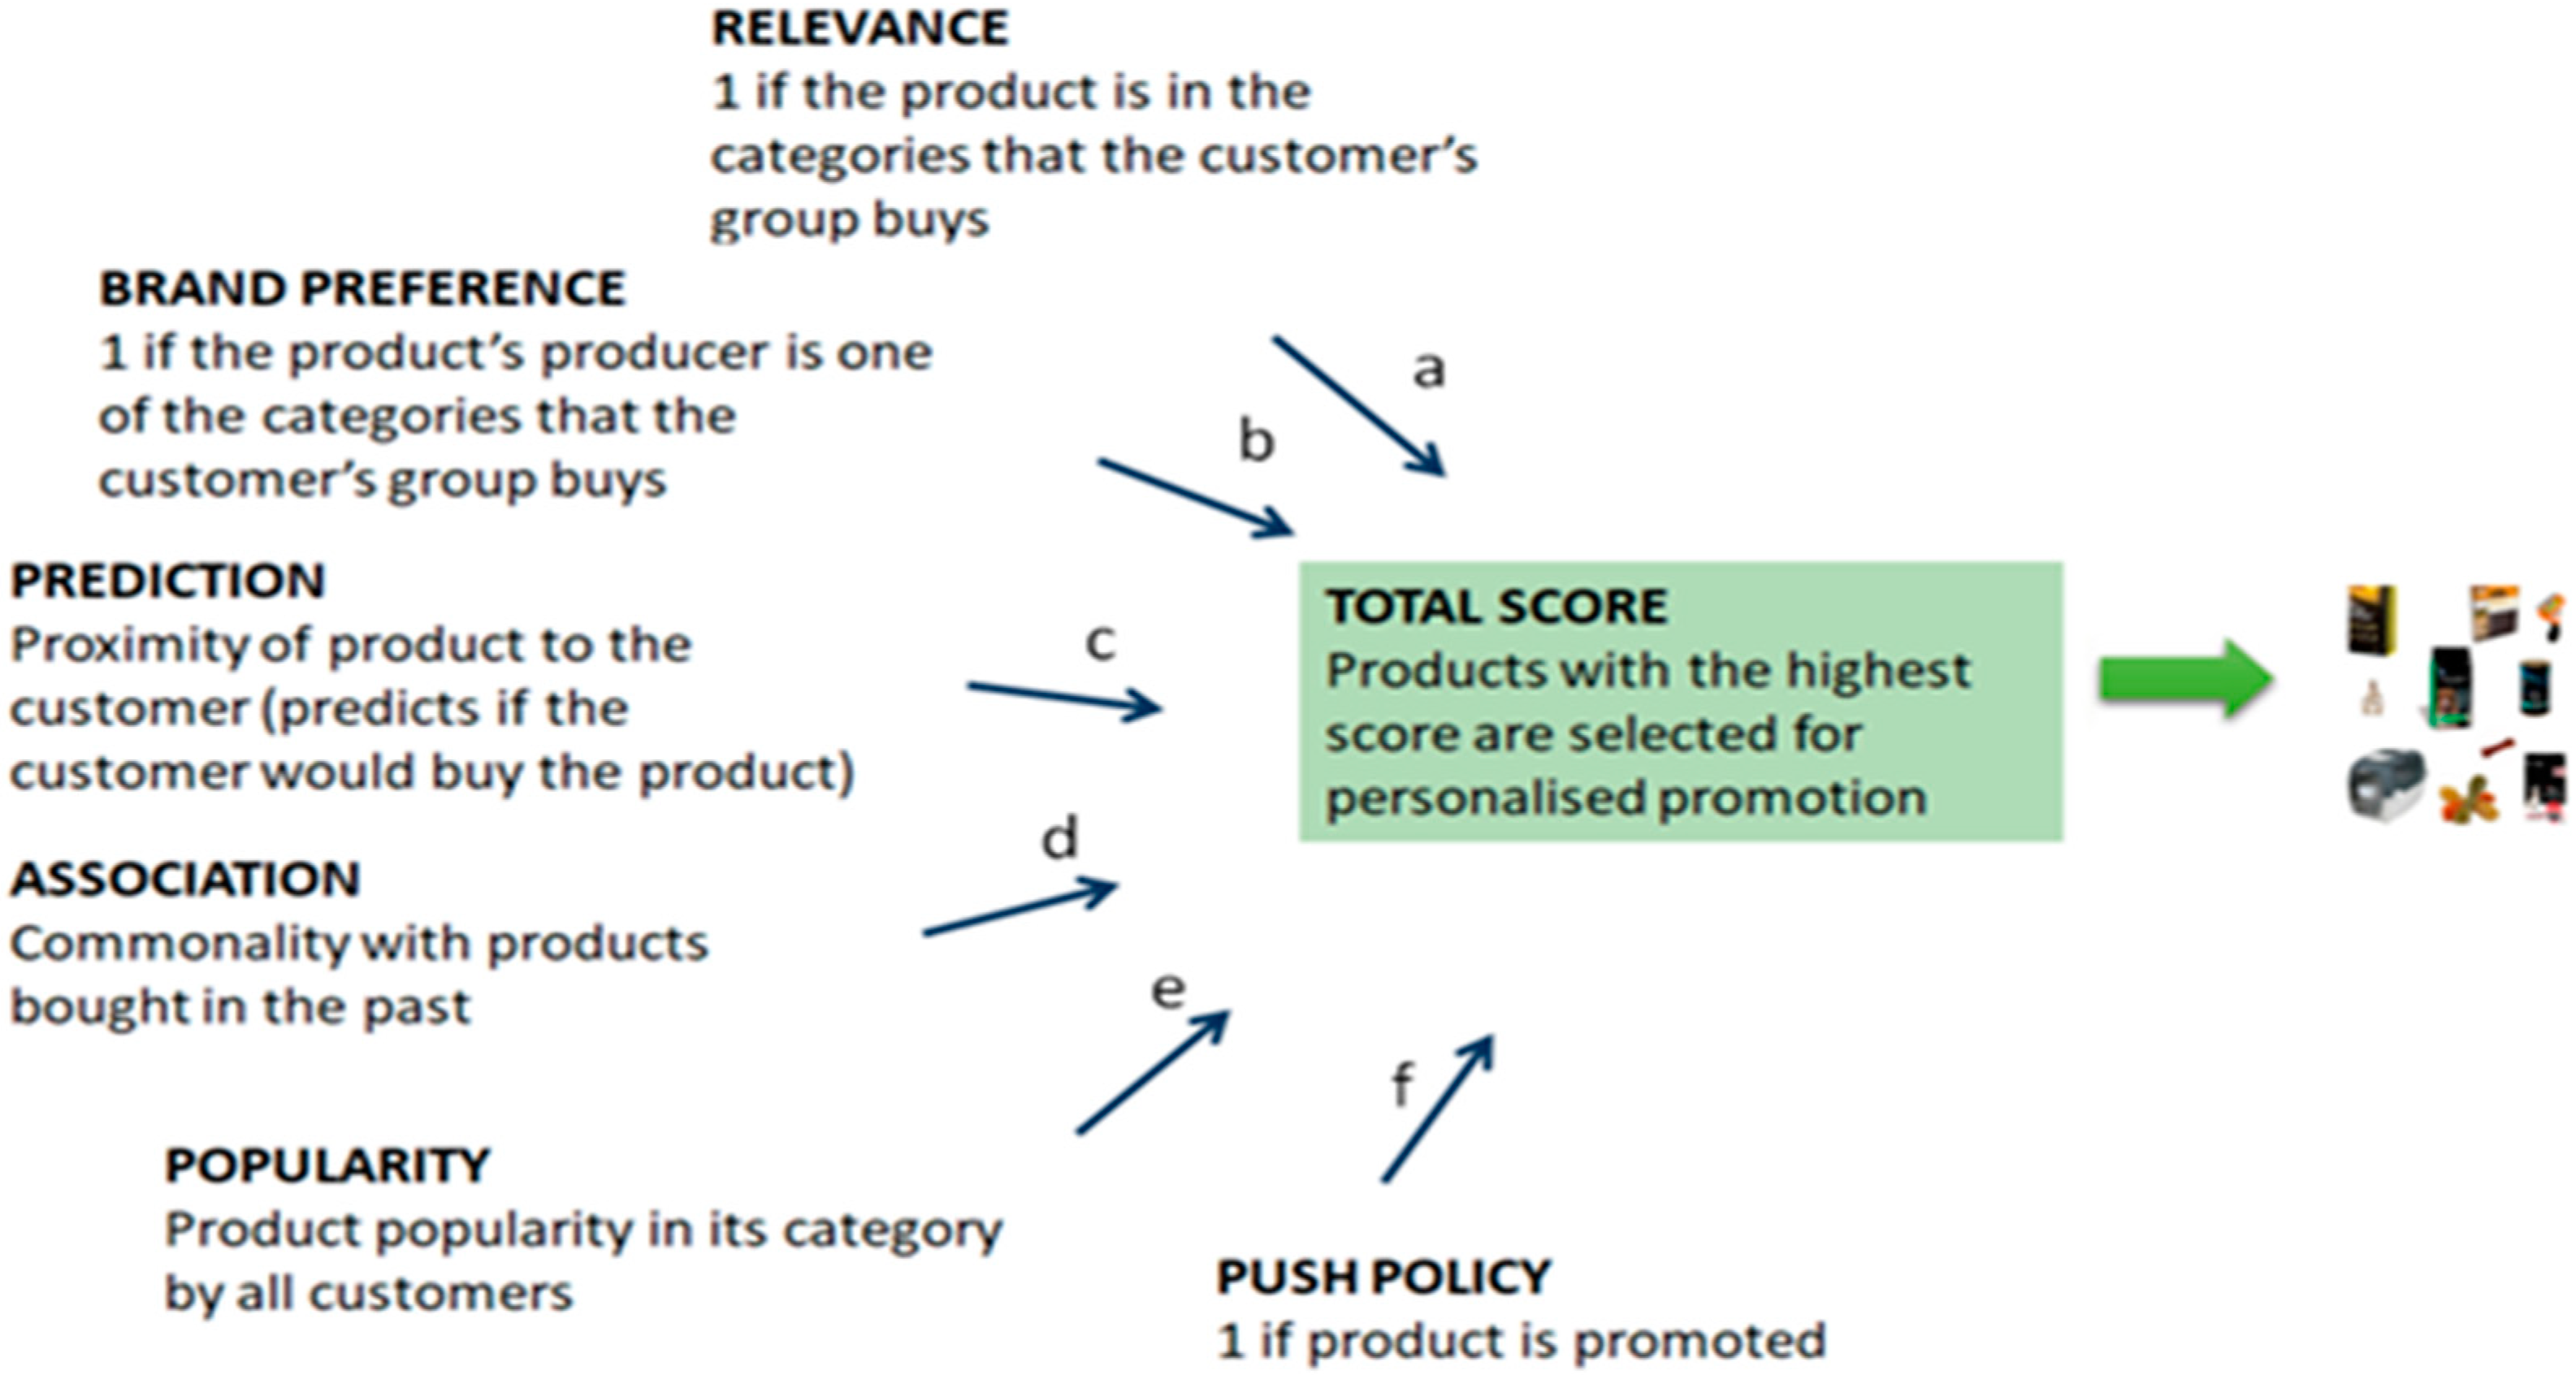
The widespread use of mobile applications developed specifically for use on small, wireless computing devices, such as smartphones and tablets, has developed the need for recommender systems that can execute the core task of sending push notifications. A push notification is a message that is “pushed” from a back-end server or application to a mobile application. However, although some aspects are similar, push notifications cannot be managed in the same way that next-item or next-baskets recommendations are created in e-commerce. This is mainly because push notifications have to take into account several other factors that will determine the type of the message or the items that may be recommended inside the delivered message. Such parameters may include the need not to disturb the customer receiving the notification, but also other marketing strategies like promoting specific brands and marketing goals (
Figure 5). Additionally, the situation for managing push notification messages is quite different, e.g., push messages may be ignored completely by the user, without even reading them. The final aim in assessing and criteria to evaluate a push notification strategy is the capacity to create push notifications that will be not rejected, will be read by users, but most importantly will activate links or recommended actions. In other scenarios, the aim is to lower customer churn, i.e., the rate at which customers will stop using an app or purchasing items with a company’s e-shop over a given period of time.
In our research project, we implemented a push notification subsystem for a pet-shop (Almapet, refers to Dataset C in
Section 4) and for a mobile lottery application. In the Almapet case study, the first objective was the exploratory analysis of the purchasing behavior of the pet-shop customers based on the history of their purchases from a physical store. The second objective was the prediction of the next purchases in order to recommend products that are relevant to a customer and can be the subject of personalized offers using notification messages. The training set included 1408 customers having more than 1 basket, a total of 40,203 baskets and approximately 6400 products. Two methods were used to categorize products. The first method was codenamed cat01 and used product categories (32 exist). The second method was named cat02 and was based on the producer. From the purchase history of each user, a vector representing the user’s profile was created. Additionally, clustering revealed 10 customer groups and their preferences according to the animals they own, the items they buy most often and the brands they prefer. The output of the clustering algorithm was used to produce a personalized prediction of the product categories each user buys (category relevance, see next paragraph) and the producers/brands they prefer (brand relevance, see next paragraph again).
The method overall takes as an input a user id and calculates: category relevance, brand relevance, items composing the next-basket, associated items (items purchased together), recent sales trends and finally the push policy, i.e., items and/or categories that are selected for promotion. Using a weighted scheme to assign a weight to each selection parameter, the management can decide its marketing strategy. For example, the aim to increase weights for category relevance, brand relevance and items composing the next-basket places the emphasis on a customer’s purchase needs. On the other hand, increased weights for the parameters associated items, sales trends and the push policy, increases the diversity, novelty and serendipity of the purchase behavior.
The second scenario regarding this push notification task builds around a mobile lottery application. The basic aim is to send push-promotion messages to increase the use of the lottery application. The strategy we used was to suggest new lottery games to mobile application users that were considered most likely to engage the recipient, with the following objectives:
Optimizing the effectiveness of promotional messages, which is expressed as (a) the probability that the message will be read and not rejected and (b) the probability that the recipient will respond to the purpose of the message, i.e., click on the link contained.
Reducing the annoyance and negative reaction that may be caused by sending promotional messages with content which the recipient is indifferent to or which is even annoying to the recipient.
This notification message component takes as its input the historical sequence of games that a user has played in the past and produces a recommendation about a game that a user has not played before. For this type of recommendation, we used the Word2Vec method. The training sessions, with each sequence of games played on by users being regarded as a session, are used to create and assign embeddings vectors for each game in the lottery application. Games that are played jointly by users (i.e., co-exist in the history of multiple users) are close to the vector space. Thus, by calculating the mean vector of the vectors of a user’s games we can say that we are vectorizing the user’s preference in the space of lottery games. Then, the Euclidean distance of the user’s preference with all the vectors of the games s/he did not play is calculated. The game with the shortest distance from the user’s preference vector becomes the recommended game for them that is sent through a push notification message.
4.6. A/B Testing Results
One of our research objectives and a deliverable aim of our project was to test session-based recommendations in the real environment of an online shop. For this purpose, we integrated all the SBRS methods that we analyzed in this paper and created a demonstrator to enable evaluations using different recommenders in a real environment and with real users. One target was to measure the effectiveness of SBRS, but we also wanted to consider other practical issues such as efficiency and adaptation to business rules.
We utilized A/B testing to conduct the study. A/B testing is a quantitative evaluation technique that compares two real versions of a web page or a component of a web application in general to examine which version performs better. These variations, known as A, B, etc., are selected randomly to each new user entering the website. Some of them will be directed to the first version, more rest to the second, and so on. Hence, product recommendations are made to each group of users by a different SBRS method. The division of users into groups is performed with a rotation function. Once users connect to any website, a unique alphanumeric is given which identifies the session id of each user. The session id remains the same for each user until they leave the site. So, the user’s session id can be fed into the rotation function and a different recommendation method is selected for the entire session of a user.
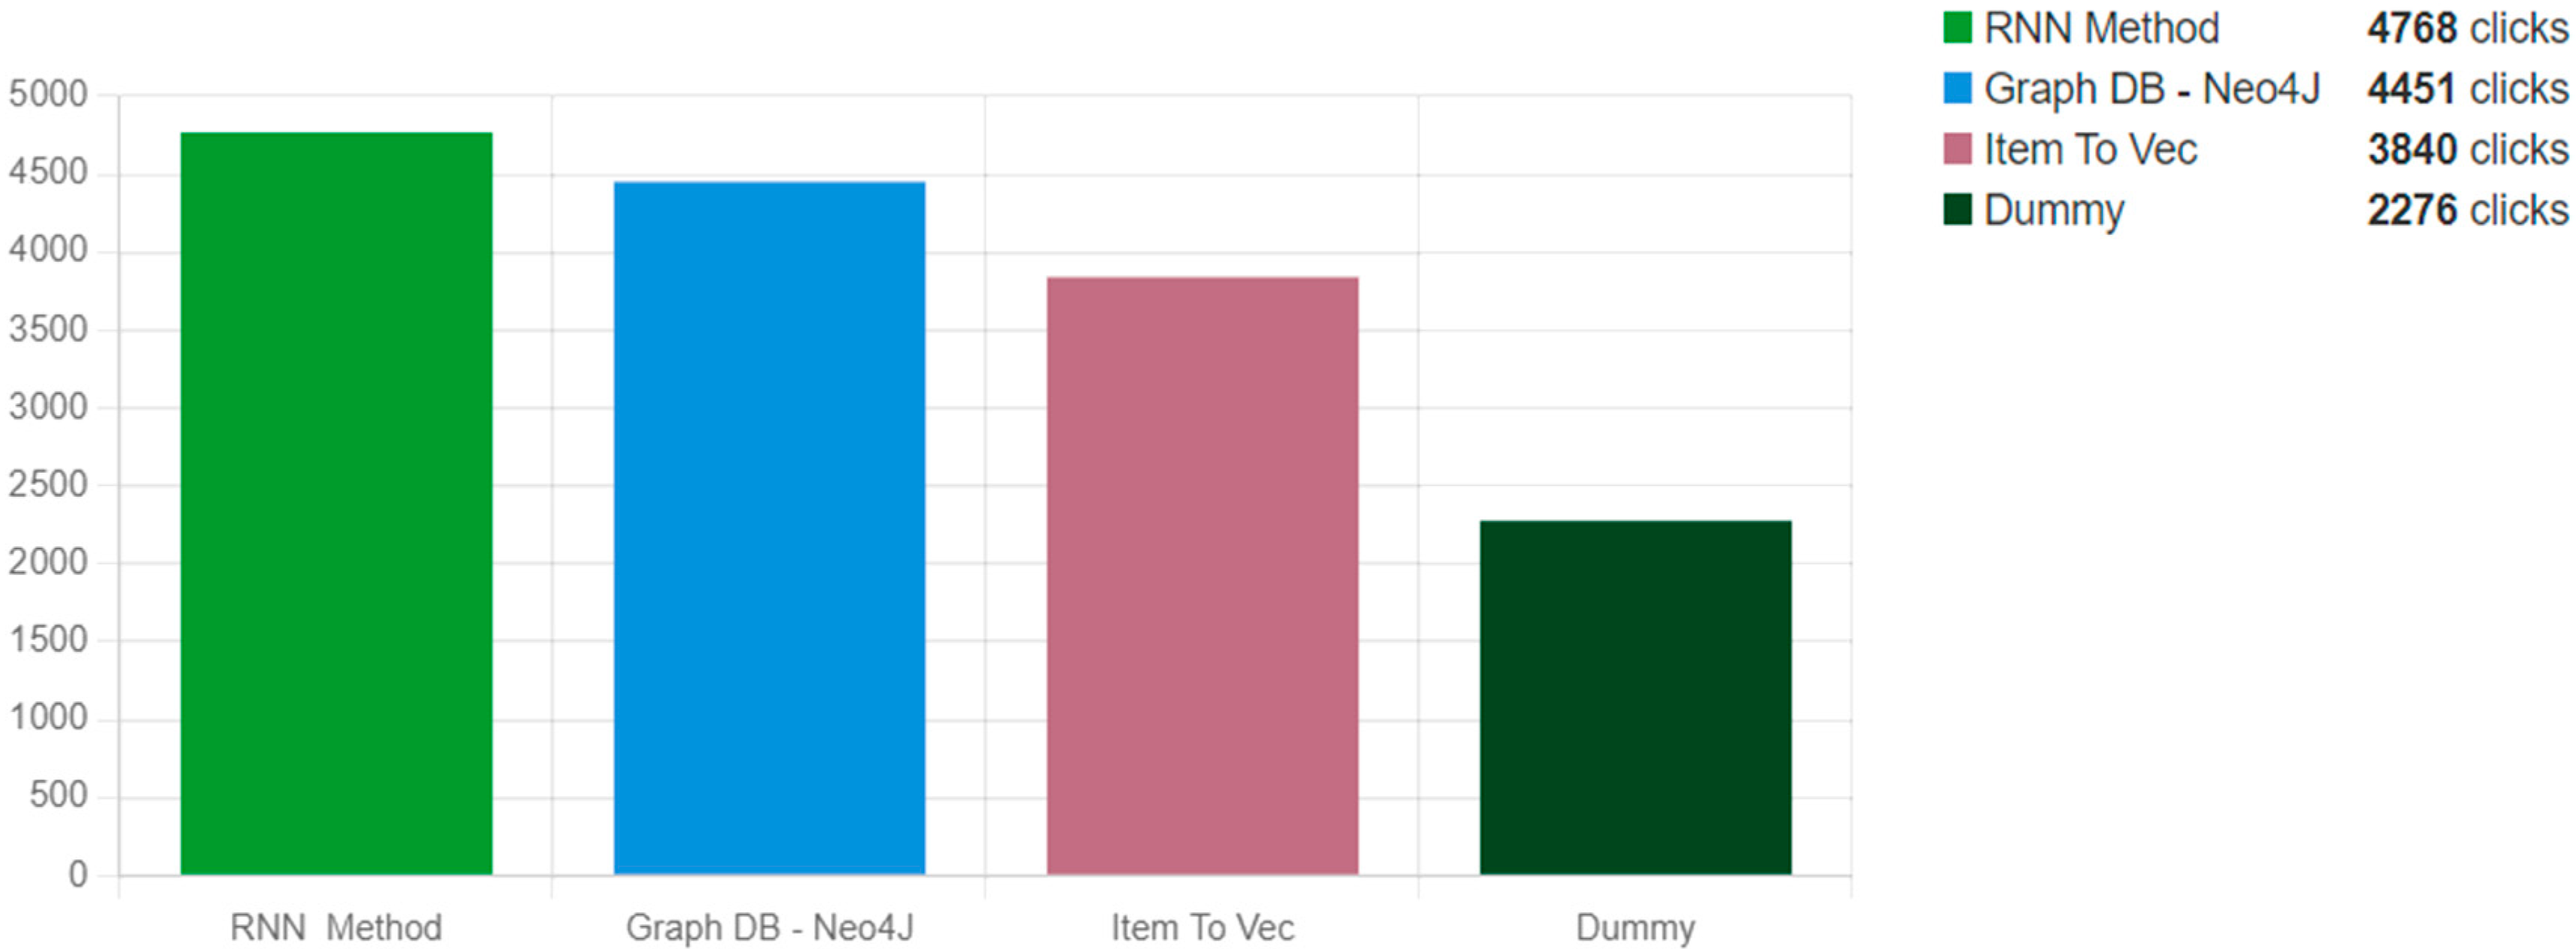
Using A/B testing, we were able to test and verify in a real e-shop which recommender method produces more clicks for recommended products, creates more purchases, and so on. Three SBRS methods were applied, specifically, RNN-based, graph-based, and Item2Vec. Additionally, we used an extra “random” algorithm which made suggestions using only the product category that the visitor was currently viewing.
The recommender component was integrated into an e-shop (leather apparel). When a product is viewed, it shows more recommended products to the visitor, aiming to provide them with a better experience. If this aim is realized, then longer user sessions should be expected, more customer satisfaction, hopefully leading to better conversion rates. Web usage data were recorded to enable calculation of several evaluation metrics (All data and statistics of our A/B testing are accessible in this URL:
https://fresanalytics.cntcloud.eu/, accessed on 20 February 2023). All methods have been evaluated for their success based on the number of clicks on recommended products.
Figure 6 shows the number of clicks made by users for an equal number of user sessions, using each algorithm for a period of time. Thus, based on the results, the RNN method produced more recommendations (4768 in number) while the Graph DB-Neo4J algorithm was the second most effective method (4451 clicks). The Item2Vec algorithm was the third best performing method. It is also important to note that the clicks produced by the “random” algorithm were almost half those of the other algorithms. From these results, one can easily infer that the three algorithms were more effective than the recommendations that were made solely based on category. In other words, the success of the recommendation engine, regardless of the algorithm used, is far greater than the most widely used practice, which is to recommend products coming from the same category as the current viewed product.
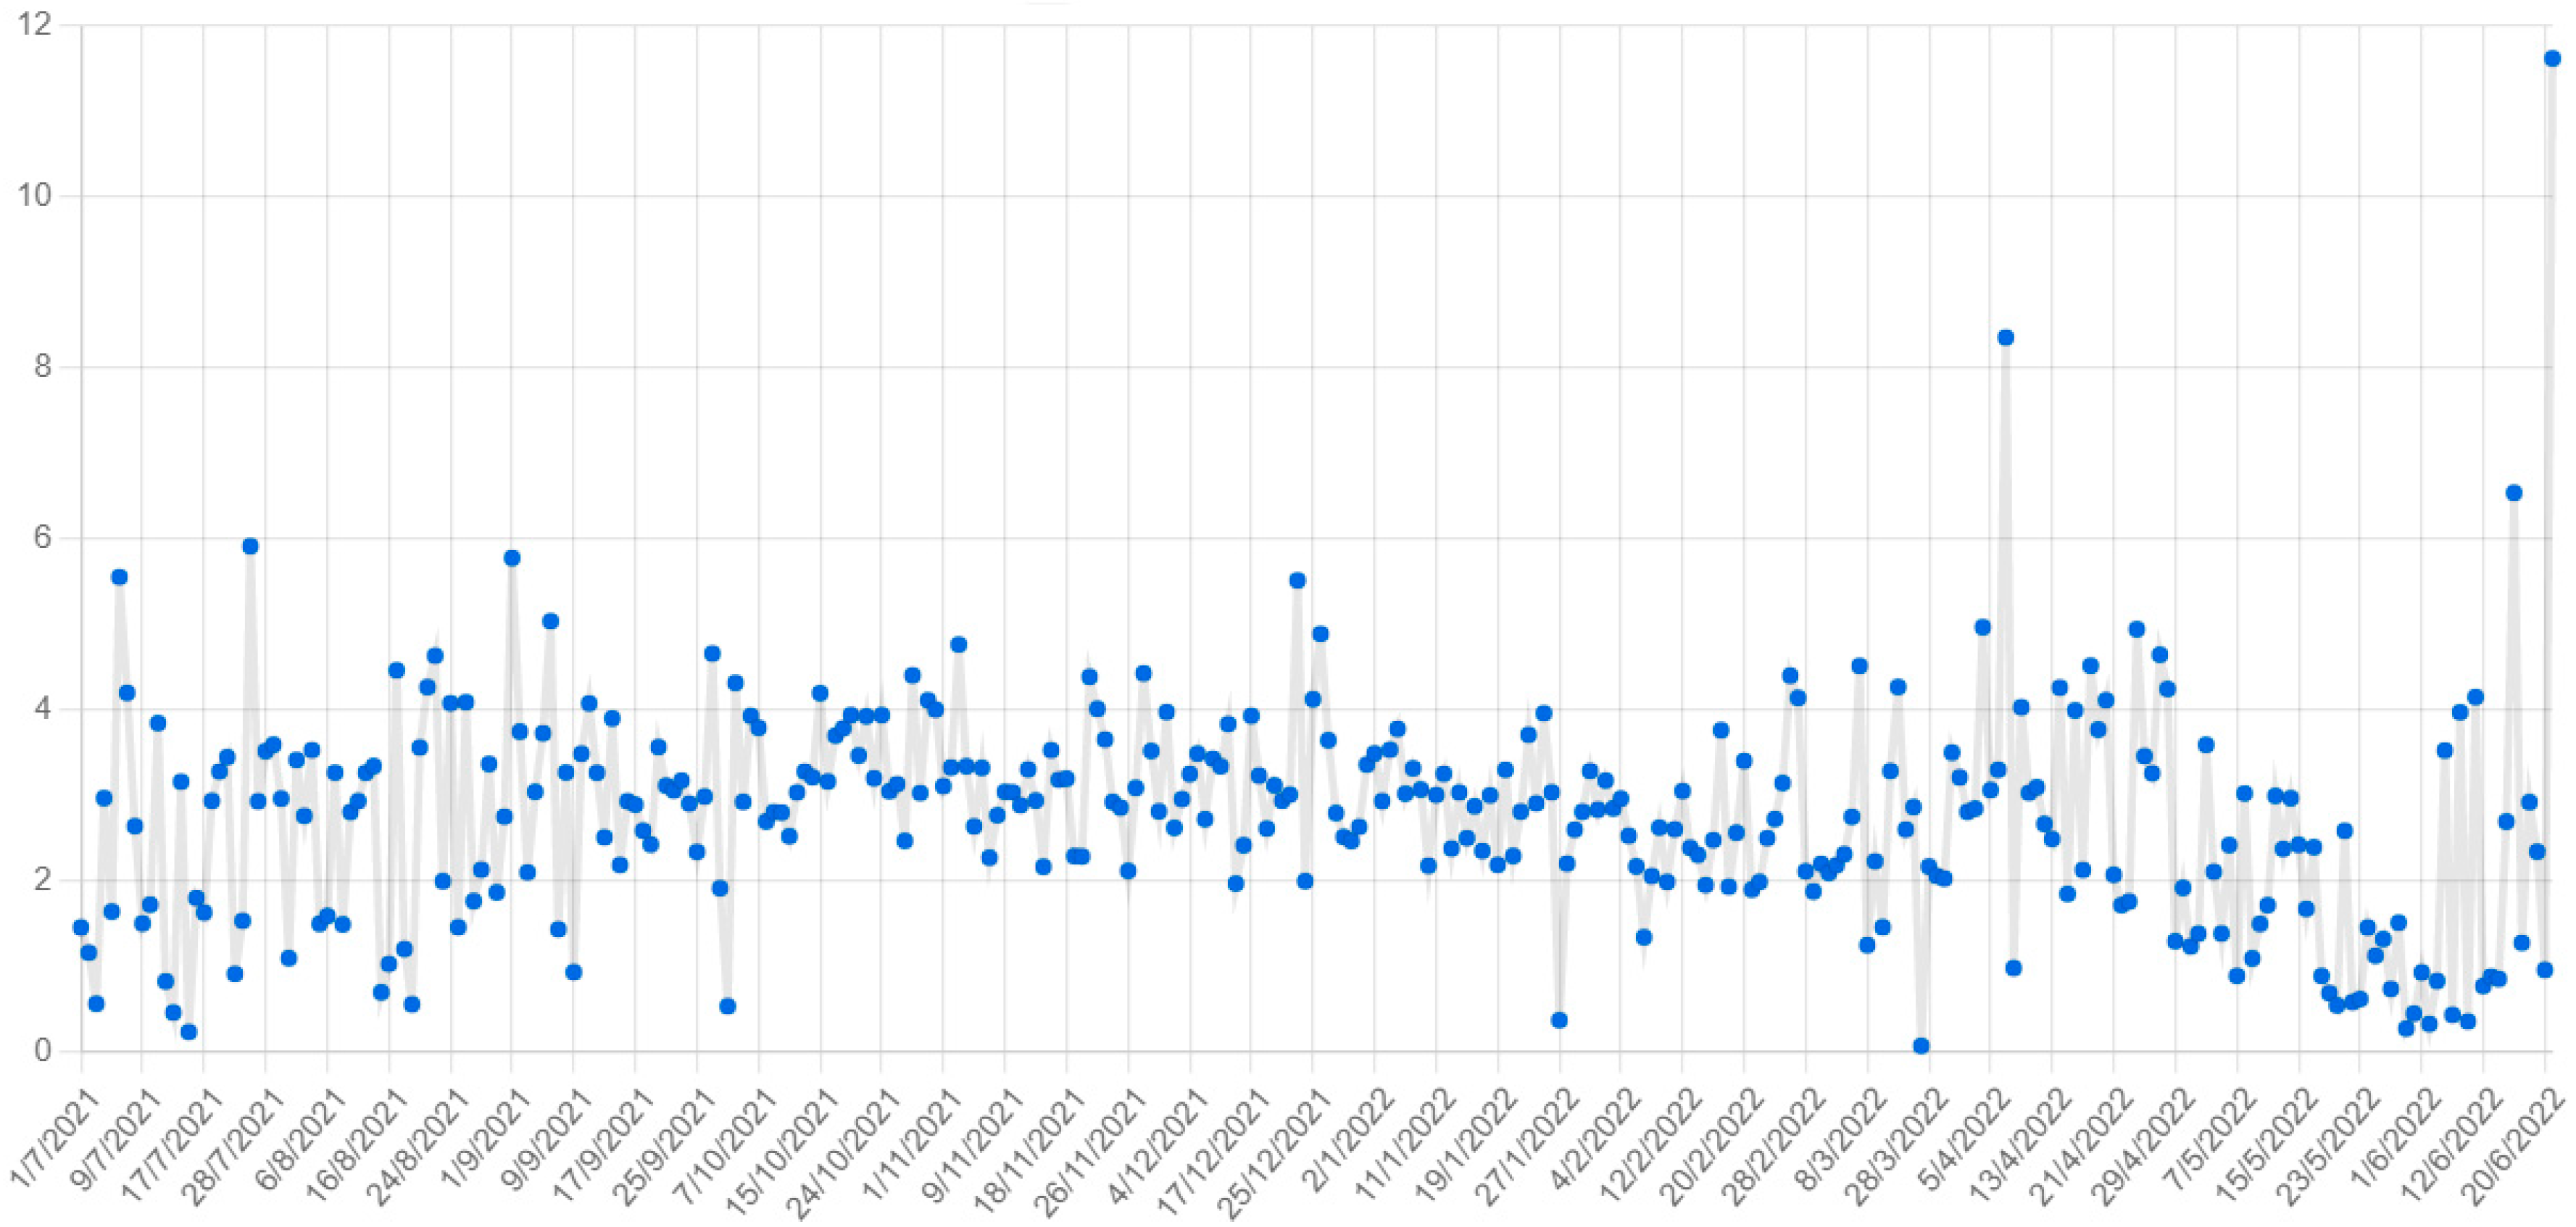
The most important metric that highlights the effectiveness of a recommendation engine not only scientifically but also commercially, however, is the click-through rate, i.e., the number of clicks that the e-shop users did as a proportion of the total item recommended (
Figure 7).
However, the findings, as presented in
Figure 7 below, are very encouraging as the click-through rate of the proposals that came from the recommendation engine exceeded 3%. The above percentage would be much higher if the panel of recommended products was higher on the product view web page. However, it was not possible to do this based on an agreement made with the company owning the e-shop. Another interesting finding was the significant improvement in terms of the bounce rate which was recorded in the Google Analytics of the e-shop after we installed the recommendation component, showing the success of the recommendation engine. Of course, several parameters have been identified that can be improved and would potentially lead to better results. One further experiment we intend to perform will test different layouts of the recommended products in order to increase the utility of the recommendation process and ultimately increase session time and user satisfaction.
5. Conclusions and Future Directions
Nowadays, many retail sales come from e-commerce web applications. Furthermore, e-commerce exploded during the pandemic, a business trend which is expected to last. Subsequently, the effectiveness of e-commerce solutions has become an important challenge for successful e-businesses. For large e-businesses that have tens of thousands or millions of users making repetitive visits and purchases, conventional recommender systems that rely on user ID and products views information are viable and very effective. However, these conventional systems cannot sufficiently address other widespread scenarios such as:
Smaller e-businesses, in which it is difficult to collect user ID information for privacy and other reasons.
More dynamic shopping environments that need to understand the user’s intent and preferences at a certain time point, without being obscured in long-term historical shopping behaviors.
Capture a short temporal preference shift in user buying behavior that is represented only in the intrinsic nature of each specific session.
The scenarios outlined above show the need for SBRS. In other words, in many e-commerce applications and environments, it is necessary to learn user behavior patterns using sessions as the main transaction unit. Having identified the main requirements of SBRS and the main tasks, our work in the FFRES project was driven by the need to investigate, develop and evaluate several methods for SBRS. After many lab experiments using our SBRS methods, but also testing their operation in real e-commerce application, our main conclusions related to the next-item and next-basket recommender tasks are as follows:
When used in next-item recommendations based on sessions, LSTMs perform noticeably better than embedding approaches. Furthermore, these approaches do not require adjusting and are simpler to implement. Additionally, these methods are easier to apply without much tuning. Furthermore, their dynamic nature, inherently models the behavior of explorative browsing that usually occurs in e-commerce applications; therefore, they are better suited for this task.
In our investigation, we used LSTMs, although they were not as effective at predicting the last basket. The performance of Item2Vec was just slightly superior to our best LSTM implementation (the one that uses the extra embedding layer tailored to RNNs). Additionally, LSTM approaches exceeded Word2Vec performance, albeit not on the same level as in the next-item task.
Combining several approaches has not always produced satisfying results. It significantly depends on whether textual data (Doc2Vec) can enhance the value of item-based recommendations. This observation inspires the concept of customized and pluggable recommenders that select the most appropriate recommendation algorithm in real time (for example, between Item2vec or LSTM). For each user action, we think a model may be trained to dynamically select one recommender technique, or possibly a combination of recommenders. We intend to go deeper into this topic.
Practical practices like category-based re-ranking could be useful, but only if recommenders perform poorly.
Graph-based methods can be a good compromise between effectiveness and efficiency. They can collect data from ongoing user sessions continually and make them available to the recommendation algorithm directly without any training phase.
Efficiency and scalability are critical issues that should be very carefully considered, especially in large-scale applications. Additionally, there is a need for methods supporting incremental training. We plan to investigate this issue further in future research.
During our collaboration with the e-shop top produce as our demonstrator, we realized that an important functional requirement for SBRS is to accommodate business rules that are required by the management of an e-commerce application.
These conclusions we believe make it clear that designing a SBRS is a complex problem that has practical constraints. Recommendations must be effective, i.e., propose relevant items but also deliver next-item recommendations as highly as possible in the list of suggestions. At the same time, the operation of a recommender (i.e., data gathering, data curation and modeling, processing, analysis, filtering) should be executed efficiently and in a way that allows operators to frequently update the recommender models. This is one direction that we plan to explore in our future research.
Besides the work we conducted on next-item and next-basket recommendations, we also worked on the purchase intent problem. This study was mainly motivated by the idea that e-commerce applications should have components for continuously monitoring users during their navigation. We believe that the key features such components can deliver into e-commerce applications are proactive stimuli actions, offering buying incentives to the user.
In conclusion, we believe that by completing the FRES project we have demonstrated the importance of SBRS for e-commerce applications. Furthermore, we have developed and tested many methods to effectively execute all the main tasks and predictions of an SBRS: next-item and next-basket recommendations, as well as purchase intent. The most effective method in all these tasks was RNN-LSTM. This method could become the cornerstone for developing more complex frameworks for e-commerce applications that will aim at higher conversion rates and better profitability.


 ,
, 


