Article

A Machine Learning-Based Intelligent Vehicular System (IVS) for Driver’s Diabetes Monitoring in Vehicular Ad-Hoc Networks (VANETs)

1
Department of IT, The University of Haripur, Haripur 22620, Pakistan
2
Department of Computer Science, University of Engineering and Technology, Taxila 39161, Pakistan
3
Department of Computer Science, GANK(S) DC KTS Haripur, Haripur 22620, Pakistan
4
Department of Information Technology, College of Computer and Information Sciences, Princess Nourah bint Abdulrahman University, P.O. Box 84428, Riyadh 11671, Saudi Arabia
5
College of Pharmacy, Gachon University Medical Campus, No. 191, Hambakmoero, Yeonsu-gu, Incheon 21936, Republic of Korea
6
Department of Telecommunication Networks and Data Transmission, The Bonch-Bruevich Saint-Petersburg State University of Telecommunications, 193232 Saint Petersburg, Russia
7
Department of Applied Probability and Informatics, Peoples’ Friendship University of Russia (RUDN University), 117198 Moscow, Russia
*
Author to whom correspondence should be addressed.
These authors contributed equally to this work.
Appl. Sci. 2023, 13(5), 3326; https://doi.org/10.3390/app13053326
Submission received: 15 January 2023 / Revised: 20 February 2023 / Accepted: 22 February 2023 / Published: 6 March 2023

Abstract

:
Diabetes is a chronic disease that is escalating day by day and requires 24/7 continuous management. It may cause many complications, precisely when a patient moves, which may risk their and other drivers’ and pedestrians’ lives. Recent research shows diabetic drivers are the main cause of major road accidents. Several wireless non-invasive health monitoring sensors, such as wearable continuous glucose monitoring (CGM) sensors, in combination with machine learning approaches at cloud servers, can be beneficial for monitoring drivers’ diabetic conditions on travel to reduce the accident rate. Furthermore, the emergency condition of the driver needs to be shared for the safety of life. With the emergence of the vehicular ad-hoc network (VANET), vehicles can exchange useful information with nearby vehicles and roadside units that can be further communicated with health monitoring sources via GPS and Internet connectivity. This work proposes a novel approach to the health care of drivers’ diabetes monitoring using wearable sensors, machine learning, and VANET technology. Several machine learning (ML) algorithms assessed the proposed prediction model using the cross-validation method. Performance metrics precision, recall, accuracy, F1-score, sensitivity, specificity, MCC, and AROC are used to validate our method. The result shows random forest (RF) outperforms and achieves the highest accuracy compared to other algorithms and previous approaches ranging from 90.3% to 99.5%.

1. Introduction

Diabetes is a chronic disease escalating daily and requires 24/7 continuous management. The World Health Organization (WHO) estimates suggest that by 2025 there will be 300 million people affected by diabetes overall [1]. Shaw JE estimates that by 2030 adult diabetes patients will increase to 439 million, approximately 7.7% of the world population [2]. Zou Q. et al. proposed that by 2040 the world’s diabetic patients will arrive at 642 million, which implies that one in every ten adults in the future is suffering from diabetes [3]. There is no uncertainty that this disturbing figure needs incredible attention. Figure 1 demonstrates the expected diabetes cases.
There is a need to monitor the blood glucose level to avoid future complications continuously. Monitoring blood glucose at home became a reality in the late 1970s when Anton H. Clemens developed the first self-monitoring BG (SMBG) meter, known as the Ames reflectance meter (ARM) [4]. SMBG frameworks are versatile gadgets that measure BG, typically 3 to 4 times daily, using a drop of blood on slim glucose oxidase-based strips. Due to inadequate sampling frequency, it was apparent that SMBG cannot disclose all severe incidents arising in daily life, e.g., severe hyperglycemia and hypoglycemia. In current years, blood glucose (BG) monitoring has been transformed by the advancement of continuous glucose monitoring (CGM) sensors. These non-invasive wearable sensors analyze glucose attentiveness almost continuously, e.g., every 1 to 5 min. The first wearable CGM sensor model was presented in 1999 [5], and since then, gadgets have developed quickly. Today, CGM sensors implant numerous features that can authorize a user’s ability to make intelligent decisions, e.g., taking drugs, exercising to manage hyperglycemia, and eating foods that offset hypoglycemia. Modern CGM devices can show the existing blood glucose level in real-time and provide visual alerts for hyper/hypoglycemia.
Advanced sensors utilize non-invasive or minimally invasive needle sensors, typically injected in the subcutaneous tissue, on the arm, or in the abdomen, as presented in Figure 2, which quantifies an electrical flow signal generated by the glucose oxidase response. This sign corresponds to the glucose absorption accessible in the interstitial fluid, which is then changed into a glucose concentration by an adjustment strategy generally performed twice daily.
Several medical conditions and diseases require continuous monitoring of physiological data regularly, even when the diabetic patient is on the move. Studies show that complications caused by diabetes are the main cause of major road accidents [6]. In this study, the recent literature was observed and reviewed concerning early detection and real-time monitoring of diabetes, which shows that most vehicle crashes are due to the drivers having diabetes. This area has received significant attention by finding the relationship between hypoglycemia and vehicle crashes [7,8]. Vehicle crashes could have been avoided if the driver had been warned ahead of time. Machine learning plays a significant role in the early prediction and detection of diabetes. Recent advancements in VANET and ubiquitous computing alongside novel wearable biosensors give constant observation of a patient’s condition and offer another point of view on diabetes management. Useful suggestions from the surrounding vehicles in the VANET environment could be vital to reducing the risk of vehicle crashes and improving the safety of the drivers. The intelligent vehicle having an on-board unit (OBU) and application unit (AU) is outfitted with VANET for obtaining, conveying, and sending the necessary information to another vehicle or V-Server [9,10,11].
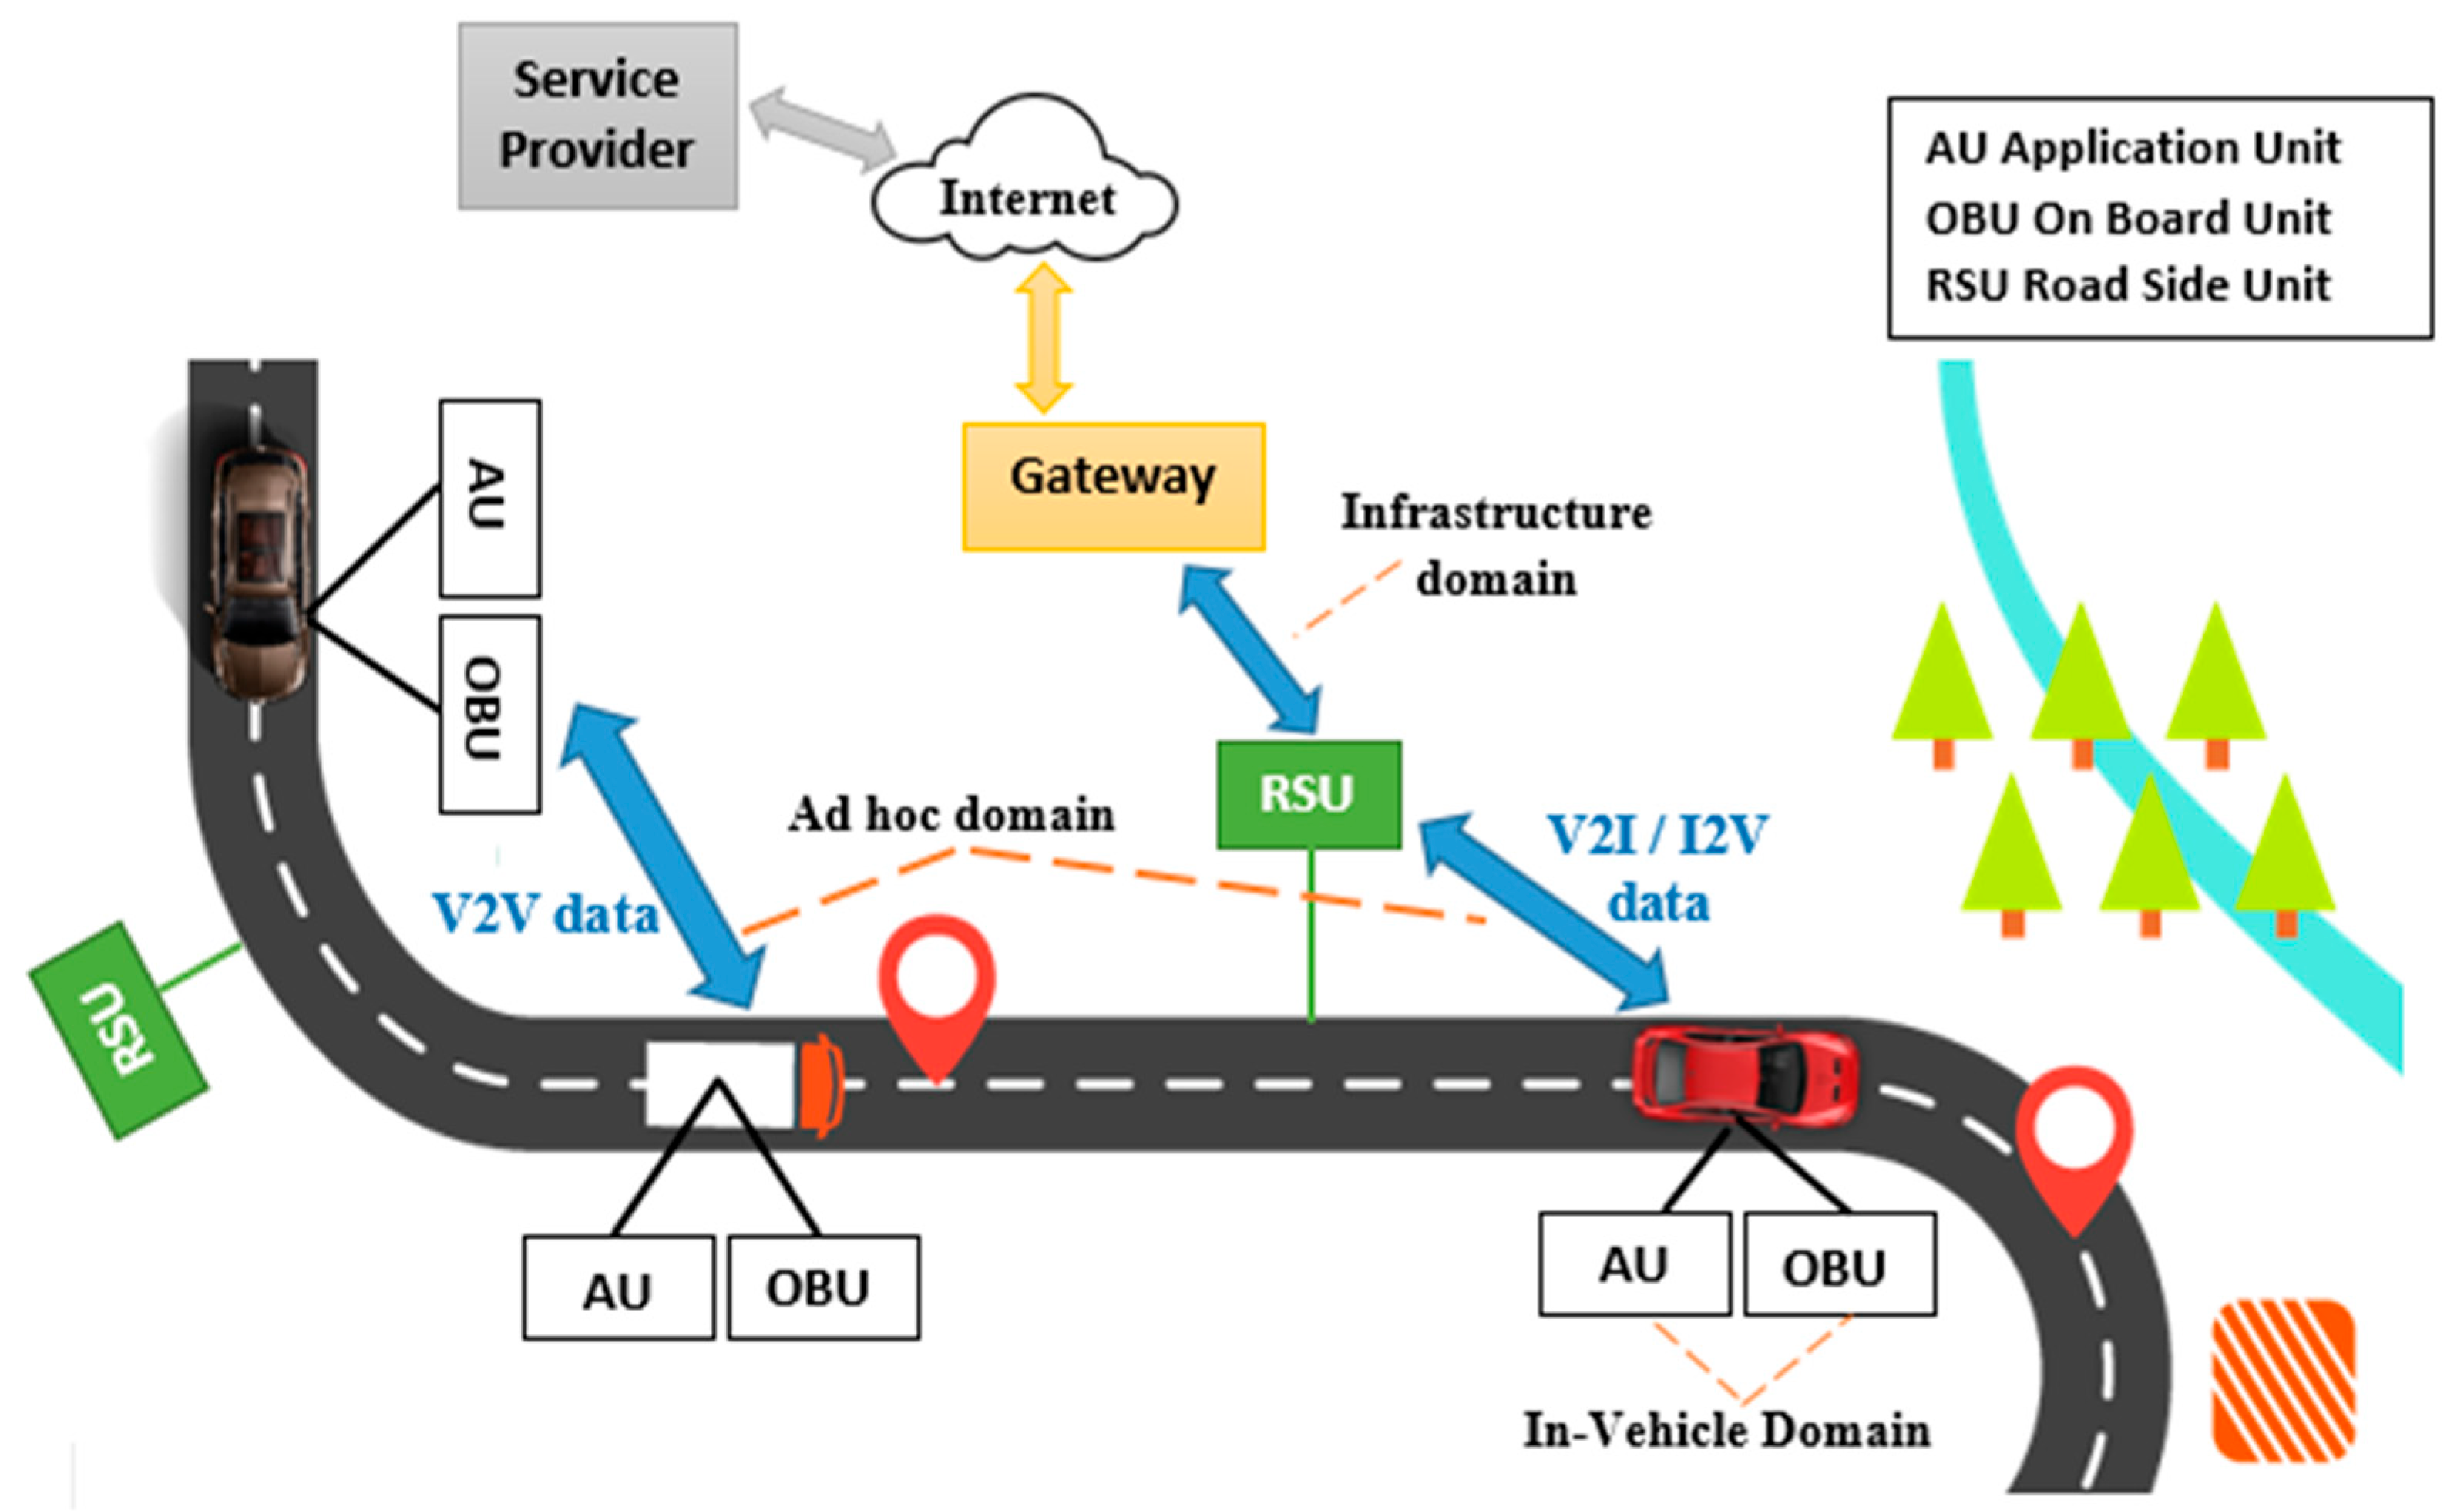
Our aim in this research is to propose an effective solution for human biological problems and efficiency by utilizing an intelligent vehicular system and advanced CGM sensors. This proposed solution will help discover and monitor diabetes by using the existing datasets available and from the digitalization of data obtained from different experiments in the lab or by existing advanced CGM devices. We proposed an evaluation of VANET for collecting and monitoring real-time data of diabetic drivers, which provides safe practice for driving and reduces the risk of vehicle crashes among individuals. The intelligent vehicle is outfitted with VANET for obtaining, conveying, and sending the necessary information to another vehicle or V-Server. OBU is embedded in the vehicle for data collection from the patient’s medical sensor. OBU is closely associated with the processing unit for intelligent decision-making when the blood glucose (BG) of the patient varies from threshold values (80–100 mg/dL). The accepting data through the vehicle would be stored in the V-Server and analyzed for the next execution level. As per the choice, it would communicate to specialists/physicians, contact VANET members for the nearest help, or contact the nearest emergency service using GPS. Further, the proposed system also embedded the VANET environment, which could be beneficial in medical emergency scenarios to increase the security of the driver, passengers, and pedestrians on the road. Figure 3 illustrates the VENET environment.
The proposed system reduces the risk of vehicle crashes caused by drivers having diabetes by providing infrastructure for real-time monitoring of diabetes through VANET that will respond according to the situation, which helps to save lives, time, and cost. We also provide a novel approach for the early prediction and detection of diabetes as well as distinguish different types of diabetes. The proposed system increases the efficiency and accuracy of advanced glucose monitoring sensors by integrating human genetics information. Our proposed methods outperform by achieving accuracy up to 95.0%, precision up to 95.4%, recall up to 95.0%, F1-score up to 95.0%, specificity up to 92.7%, sensitivity up to 96.6%, MCC up to 90.3%, and AROC up to 99.5%.

1.1. Motivation

Early detection of several human diseases, especially diabetes, through real-time monitoring, screening programs, and the availability of effective and safe therapies even when the patient is driving or on the move reduces accidents, mortality, and morbidity by delaying or preventing future complications of the disease. Numerous ML applications assume a critical job in accomplishing a bioinformatics investigation from the natural data available. Choosing appropriate approaches for that type of problem leads to more efficient and accurate results.

1.2. Research Questions

a.
How does the vehicle detect diabetic patients?
b.
How is genetic testing valuable in the diabetes monitoring of drivers?
c.
How do vehicles take appropriate measures upon detecting hypo/hyperglycemia?
The rest of this paper is organized as follows: Section 2 covers related work and background in the relevant field. It also describes the approaches to previous associated works for managing diabetes. Section 3 presents the methodology of this research and the application scenario of how our proposed system works, and it also describes the framework of the proposed approach. Section 4 is composed of research simulations and results. Finally, Section 5 outlines this work’s conclusion precisely and describes the scope of future work for possible extended application of the research.

2. Related Work

Diabetes is a chronic disorder that prompts long-term complications and other disorders. Finding the disease at the beginning phases diminishes clinical expenses and the risk of patients having more confounded medical conditions. Researchers have made fruitful accomplishments in the field of diabetes prediction and treatment. Abundant, helpful, and indicative information is required for further comprehensive research by utilizing data mining (DM) and ML later. This segment gives a summed-up survey of all the recently proposed diabetes prediction and monitoring approaches.
Kavakiotis I. et al. [12] provide a precise survey of data mining, ML strategies, and instruments in the field of diabetes research concerning: Diabetic complications, prediction and diagnosis, genetic background, environmental risk factors, and health care and management. A broad series of ML algorithms were utilized. A total of 15% of those was portrayed by unsupervised learning techniques and 85% by supervised ones, and all the more explicitly, association rules. Concerning the kind of information, clinical datasets were utilized. Rghioui A. et al. [13] proposed an intelligent architecture for monitoring diabetic patients using machine learning algorithms. The architecture elements included smart devices, sensors, and smartphones to collect measurements from the body. Naive Bayes, SVM, random forest, and simple classification and regression tree (CART) algorithms were used. As evaluation parameters, specificity, sensitivity, accuracy, and precision were used, and they achieved accuracy (average of 70.08). Chen M. et al. [14] proposed a 5G-smart diabetes framework, which consolidates recent technologies, such as big data, ML, and wearable 2.0, to create a comprehensive examination and detection for patients experiencing diabetes. This can be achieved by assembling a 5G-smart diabetes testbed with cell phones, a huge data cloud, and smart clothing. Three machine learning calculations, SVM, DT, and ANN, are actualized to build various models for finding a cure for diabetes.
However, Noshadi H. et al. [15] present a substitute technique for gathering diabetic patients’ pre-recorded physiological information utilizing VANET. The vehicles gather synthetic, noise, and traffic tests and can straightforwardly correspond with the subject’s anxiety. The correspondence between the patient and the vehicle was started. At the same time, the on-body sensor receives the message from the vehicle’s GPS information and IP address. The system was liable for data assortment, beginning the communication among vehicles and wearable devices and affirming content delivery. Songer, T. J. et al. [16] highlight a higher involvement of drivers with diabetes in vehicle road accidents. According to this report, vehicle crash risk remained higher for drivers with diabetes throughout the age span. The finding of this report indicates that the risk of vehicle crashes is 30% higher in diabetic patients than in the non-diabetic population.
Several cases reported hypoglycemia involvement in vehicle crashes. Merickel J. et al. [17] address the necessity for the driver-state area using a wearable sensor and in-vehicle assessments of driver well-being and physiology. Wearable sensors, in-vehicle frameworks, and strategies equipped for measuring real-world execution and driving conduct are used to monitor drivers with Type 1 diabetes. They showed that the behavior of drivers with diabetes changed as a component of the glycemic state, especially the hypoglycemia framework that measures the glycemia state in drivers with diabetes utilizing the CGM sensor innovation. For the most part, the discoveries of this paper show an undeniable connection between in-danger driver physiology and genuine real-world driving. Chang YH. et al. [18] investigate motorcycle crashes among drivers having diabetes. The study was conducted in Taiwan on 989,495 patients. The authors observe that drivers having diabetes had a higher accident rate than other drivers.

Discussion

The proposed work aims to reduce the complications of diabetic patients through early detection and real-time monitoring, precisely when a patient moves, which may risk their and other drivers’ and pedestrians’ lives. Our proposed work includes the selection of the right attributes for early and accurate prediction of diabetes. We proposed a novel approach that integrates human genetics information with advanced CGM sensors combined with machine learning approaches and VANET technology. Table 1 presents the recent studies that compare machine learning algorithms and identify the best-performing algorithm for diabetes prediction.
All the above-proposed approaches perform well and give fruitful information regarding diabetes prediction, analysis, awareness, and monitoring. However, some are using clinical or manual data, and some are testing their results on a specific group of people. At the same time, our proposed approach is novel and generic, which can predict the future diabetic level based on current genetic data and provide an opportunity for future researchers. Additionally, our proposed method outperforms by achieving results up to 99.5% using all evaluation parameters and 10-fold cross-validation.

3. Proposed Methodology

Diabetes requires urgent treatment to save the lives of a diabetic patient and pedestrians or other drivers when a patient is driving. This proposed approach will help increase the efficiency of the existing monitoring systems intelligently in terms of cost, time, and accuracy. The proposed idea involves two major steps.
(a)
Machine learning-based diabetes prediction using genetic information;
(b)
Intelligent vehicular system (IVS) framework for real-time data processing.

3.1. Machine Learning-Based Diabetes Prediction Using Genetic Information

To predict any disease, we have to know the reason behind that disease. Researchers identified changes in the DNA sequence that are straightforwardly engaged with the development of diabetes and give important insights into the instrument by which they present risk. Humans are unpredictable life forms comprised of trillions of cells, each with their own structure and framework. The transformation in a solitary gene arrangement of any of these cells may change an entire biological measure that may cause a certain disease. Human genes have unique information that can predict any disease undeniably. Therefore, in our novel proposed system, we predict diabetes using the genetic information of patients, which can not only predict diabetes but also recognize two main types of diabetes, Type 1 and Type 2 diabetes, at earlier stages.
We proposed to integrate HGI with existing advanced technologies by utilizing available online genetics databases for early disease prediction. We extracted human genes information from NCBI (https://www.ncbi.nlm.nih.gov/) accessed on 15 October 2022, which is the National Center for Biotechnology Information and contains several biomedicine/biotechnology databases, and from DisGeNET (http://www.disgenet.org/) accessed on 15 October 2022, for candidates’ genes that are involved in causing diabetes and their corresponding gene sequence information from UniProt (http://www.uniprot.org/) accessed on 16 October 2020. These are publicly available online databases. Figure 4 shows our proposed research methodology for diabetes prediction and is elaborated in the following sections.
We chose the data from several genomic databases, and after the data acquisition, the human genome data will be available in digital form and contaminated by multiple artifacts. Then, using features-extracting techniques, we extracted the relevant features and combined them into a new dataset known as the feature set. Afterward, we tested different machine learning algorithms utilizing the extracted feature set and evaluated the performance of these models. By utilizing all these information assets, we separated distinctive genetic features. The extracted dataset was then passed to various computational strategies for characterization using a 10-fold cross-validation mode. We not only predicted diabetes but also proposed a complete framework for continuous monitoring of diabetic patients after the prediction to avoid future complications.

3.1.1. Data Acquisition

Only the required data relevant to our work were extracted from the databases in data acquisition. Afterward, feature extraction techniques were applied to extracted data.

3.1.2. Feature Extraction

Feature extraction refers to extracting the appropriate information from the dataset. Features extraction methods reduce the number of attributes by avoiding redundant features. If there are too many relevant features, our model will perform better. There are numerous feature extraction methods, and we used discrete wavelet transform (DWT) to extract useful features and principal component analysis (PCA) to reduce the dimensionality and redundant data.
Genetic features were mined by utilizing the alpha-amino carboxylic acid (amino acid) sequence grouping data of genes. Human cells are made up of enormous fractions of alpha-amino carboxylic acids that give cells their structure. Amino acid sequence information was downloaded from the publicly available online genetic databases; then, length, entropy, discrete wavelet, and principal component features were extracted from this sequence information. Each of these features is described below.
Gene sequence arrangement is a mixture of diverse amino acids. Various arrangements are of dissimilar sizes. We can assess length by tallying a gene’s alpha-amino carboxylic acid arrangement. So, the length is mainly the measurement of the alpha-amino carboxylic acid sequence.
The entropy can be assessed by determining a particular possibility’s likelihood [22]. Entropy is defined in Equation (1).
E = n = 1 20 p n × log 2 p n
where p n is a probability of an alpha-amino carboxylic acid in a sequence.
A feature extraction procedure based on DWT is proposed. DWT is a powerful and popular tool that distinguishes between significant and irrelevant data without losing actual data. DWT is used to extract useful information at high speed. It reduces the resources and computation time and is also easy to implement. In our proposed method, we applied a discrete wavelet transform on extracted gene sequences by employing Python programming language using the NumPy library, which returns the detail coefficient (DC) and approximation coefficient (AC) values for each gene sequence.
A gene is made up of 20 alpha-amino carboxylic acids. A vector length of 20 is attained for a solitary gene, and then a discrete wavelet transform is applied to the EIIP values of this vector [23]. There are distinct EIIP values for every alpha-amino carboxylic acid. These EIIP values choose the consistent energy conditions for the entire valance electron in the specific alpha-amino carboxylic acid. The list of alpha-amino carboxylic acids, representation codes, and EIIP values is shown in Table 2.
In our work, the algorithm based on DWT [24] was used to perform feature extraction in which data were decomposed and divided into two parts using Equations (2) and (3).
I i j = 1 2 I 2 i j + 1 + I 2 i + 1 j + 1
D i j = 1 2 I 2 i j + 1 I 2 i + 1 j + 1
PCA is a modern data analysis tool for making predictive models [25,26]. It is a very useful method for extracting relevant information from confusing datasets. It reduces the various actual indicators to single or more inclusive indicators. We applied PCA to our dataset to detect the correlation between variables and avoid repetitive information. The model for calculating and extracting PC factors [3] is:
F i = T i 1 X 1 + T i 2 X 2 + T i k X k i = 1 , 2 , 3 , , m
where F i is i principal component factor, k is the number of indicators, and m is the number of principal component factors.
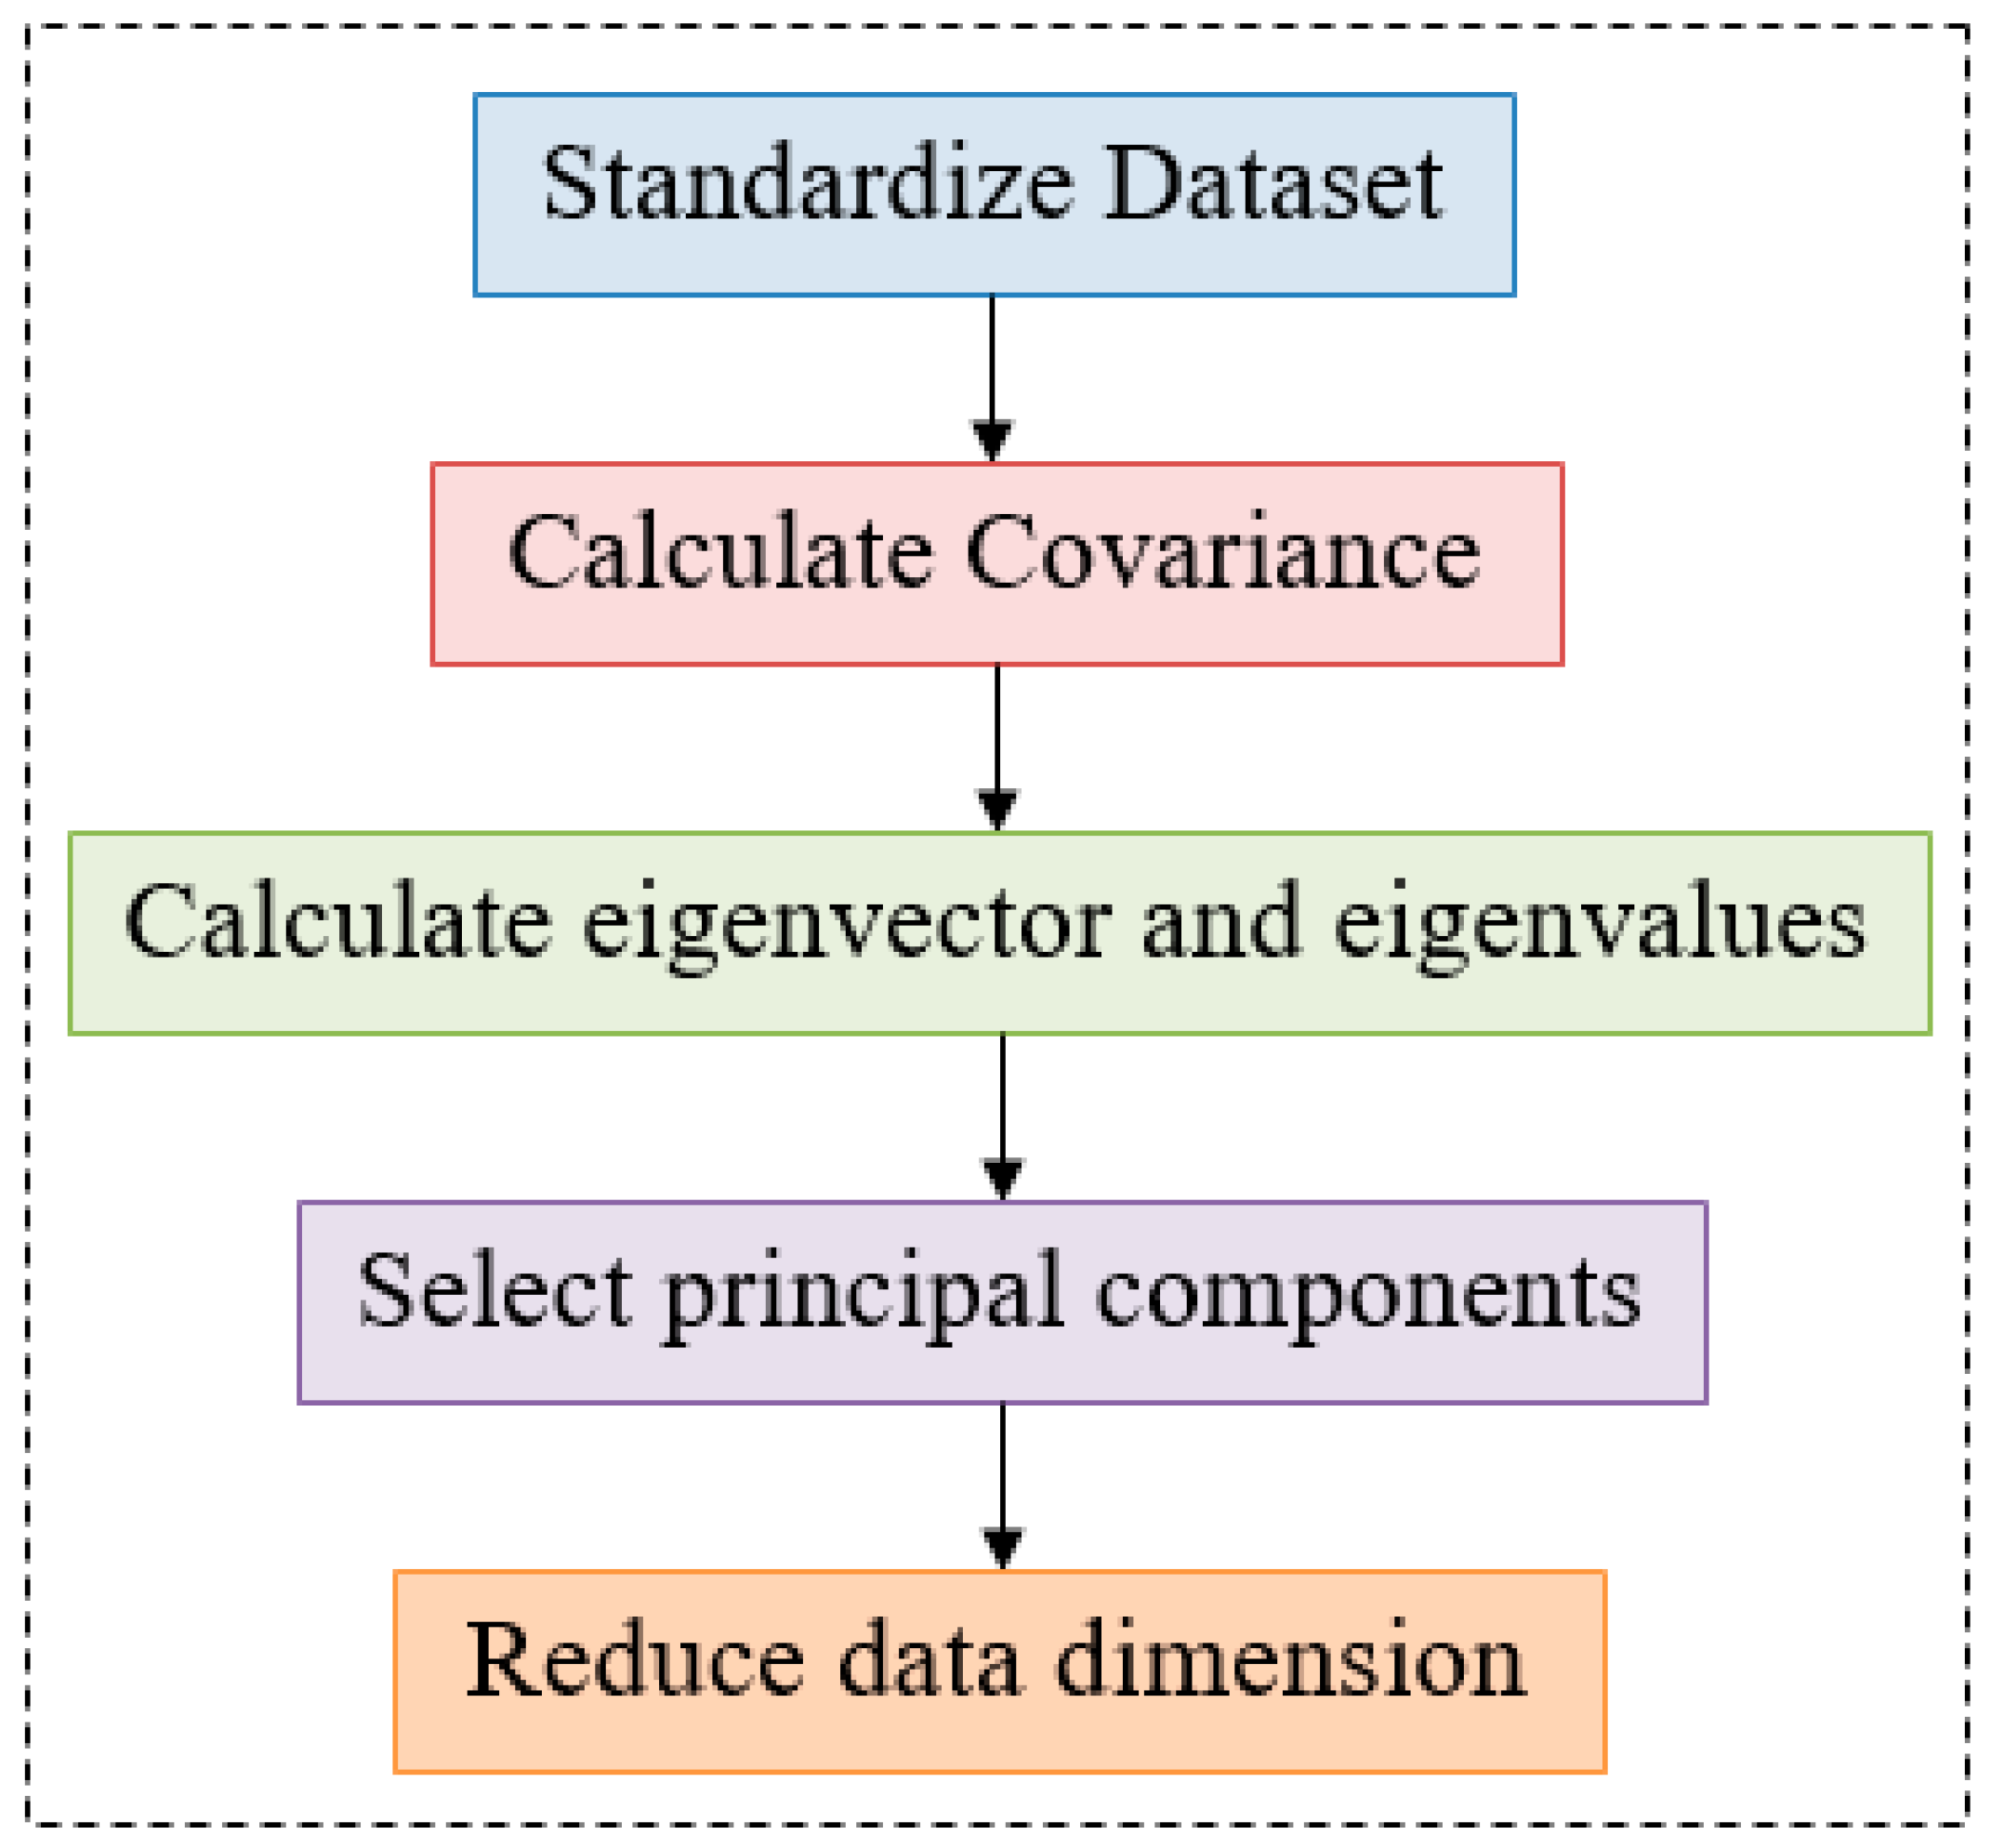
We used PCA as an unsupervised learning technique in which our dataset of interrelated variables was transformed into a novel set of variables recognized as principal components (PCs). In our work, PCA worked as a dimensionality reduction technique. Figure 5 represents the principal component analysis block diagram to discover the PCs.
To standardize the dataset, Equation (5) calculates the mean and standard deviation [27].
S D = x μ 2 N
where x is the observed value, μ is the sample’s mean, and N is the number of data points of the sample.
Equation (6) calculates the covariance for the given dataset [28].
C o v x , y = x i x ¯ y i y ¯ N 1  
in which x i is the data value of x, y i is the data value of y, x ¯ is the mean of x, y ¯ is the mean of y, and N is the number of data values.
Eigenvector and eigenvalues [29] are calculated from Equation (7).
T(v) = πv
where v is a nonzero vector known as the eigenvector of T if T(v) is a scalar multiple of v, and π is the eigenvalue associated with v.
Sort eigenvalues and their equivalent eigenvectors, select k eigenvalues, and custom eigenvectors dataset.
Data dimension reduction can be made by Equation (8).
F e a t u r e   d a t a s e t k   e i g e n   v e c t o r = T r a n s f o r m e d   d a t a s e t
This transformed dataset is then utilized as a feature set in this work. Consequently, our extracted feature set is passed to the machine learning classification algorithms for comparative analysis among existing algorithms for the best possible performance. These algorithms classify and identify genes according to diabetes. Table 3 comprises our extracted feature set statistics.
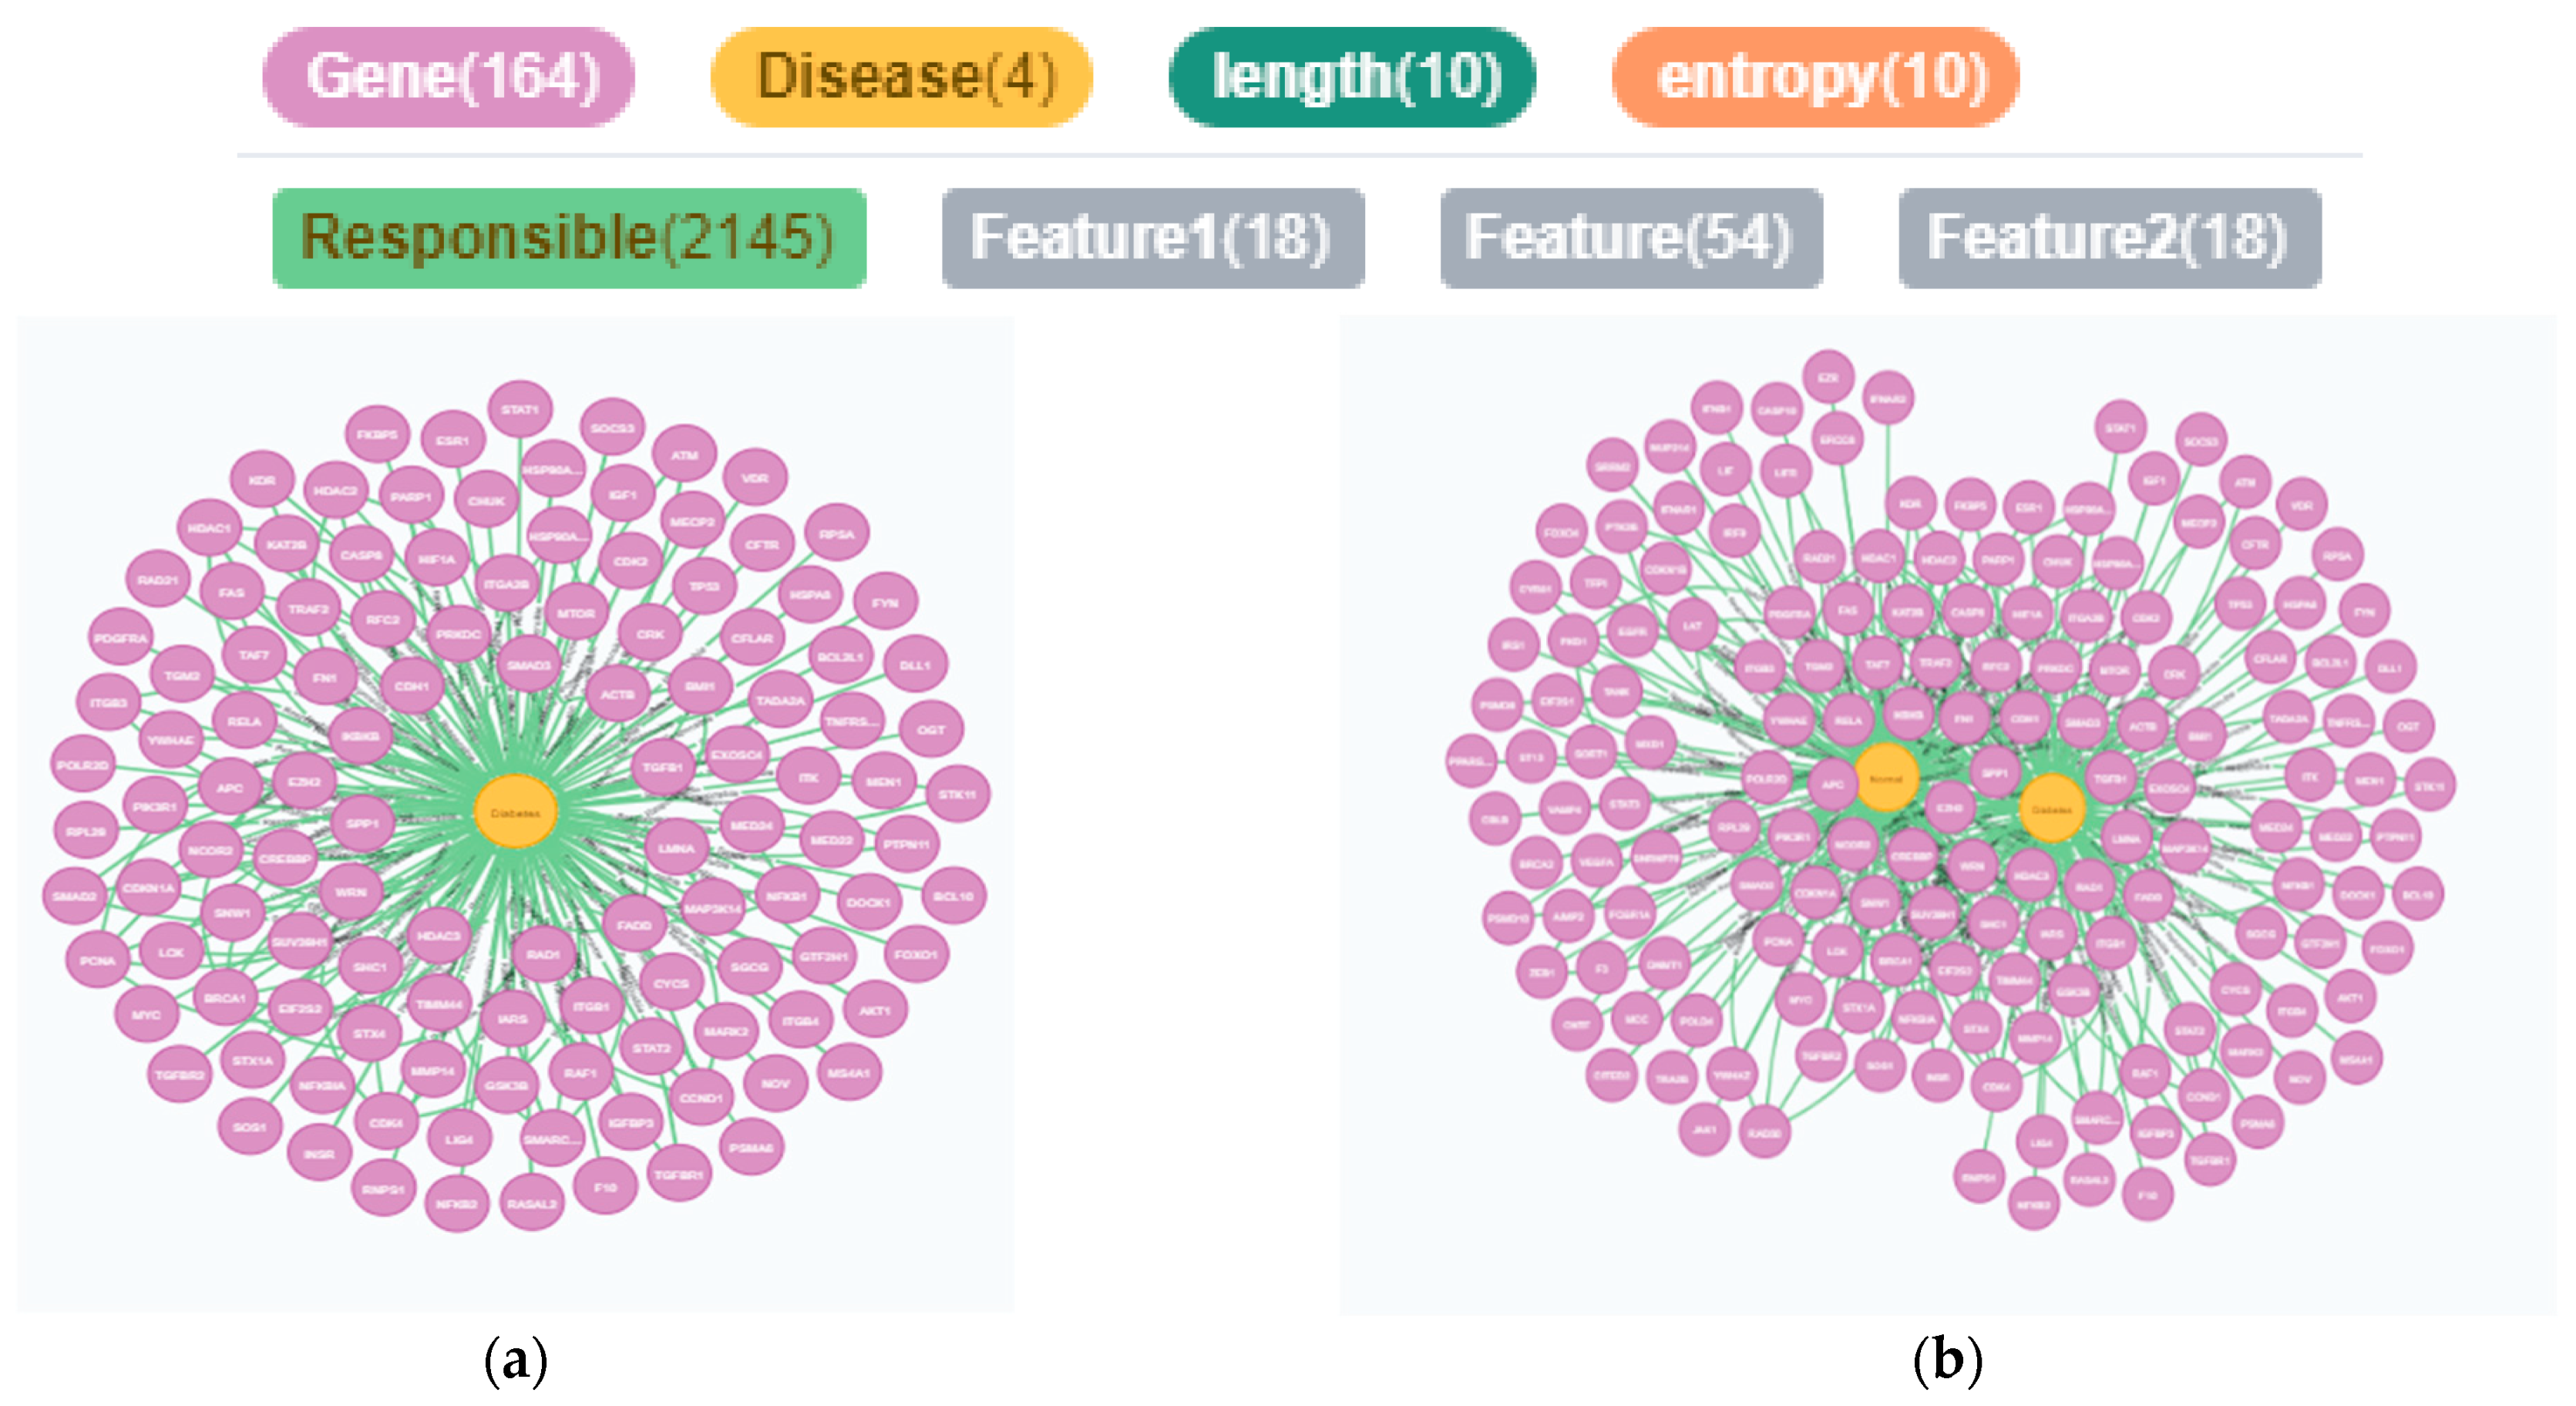
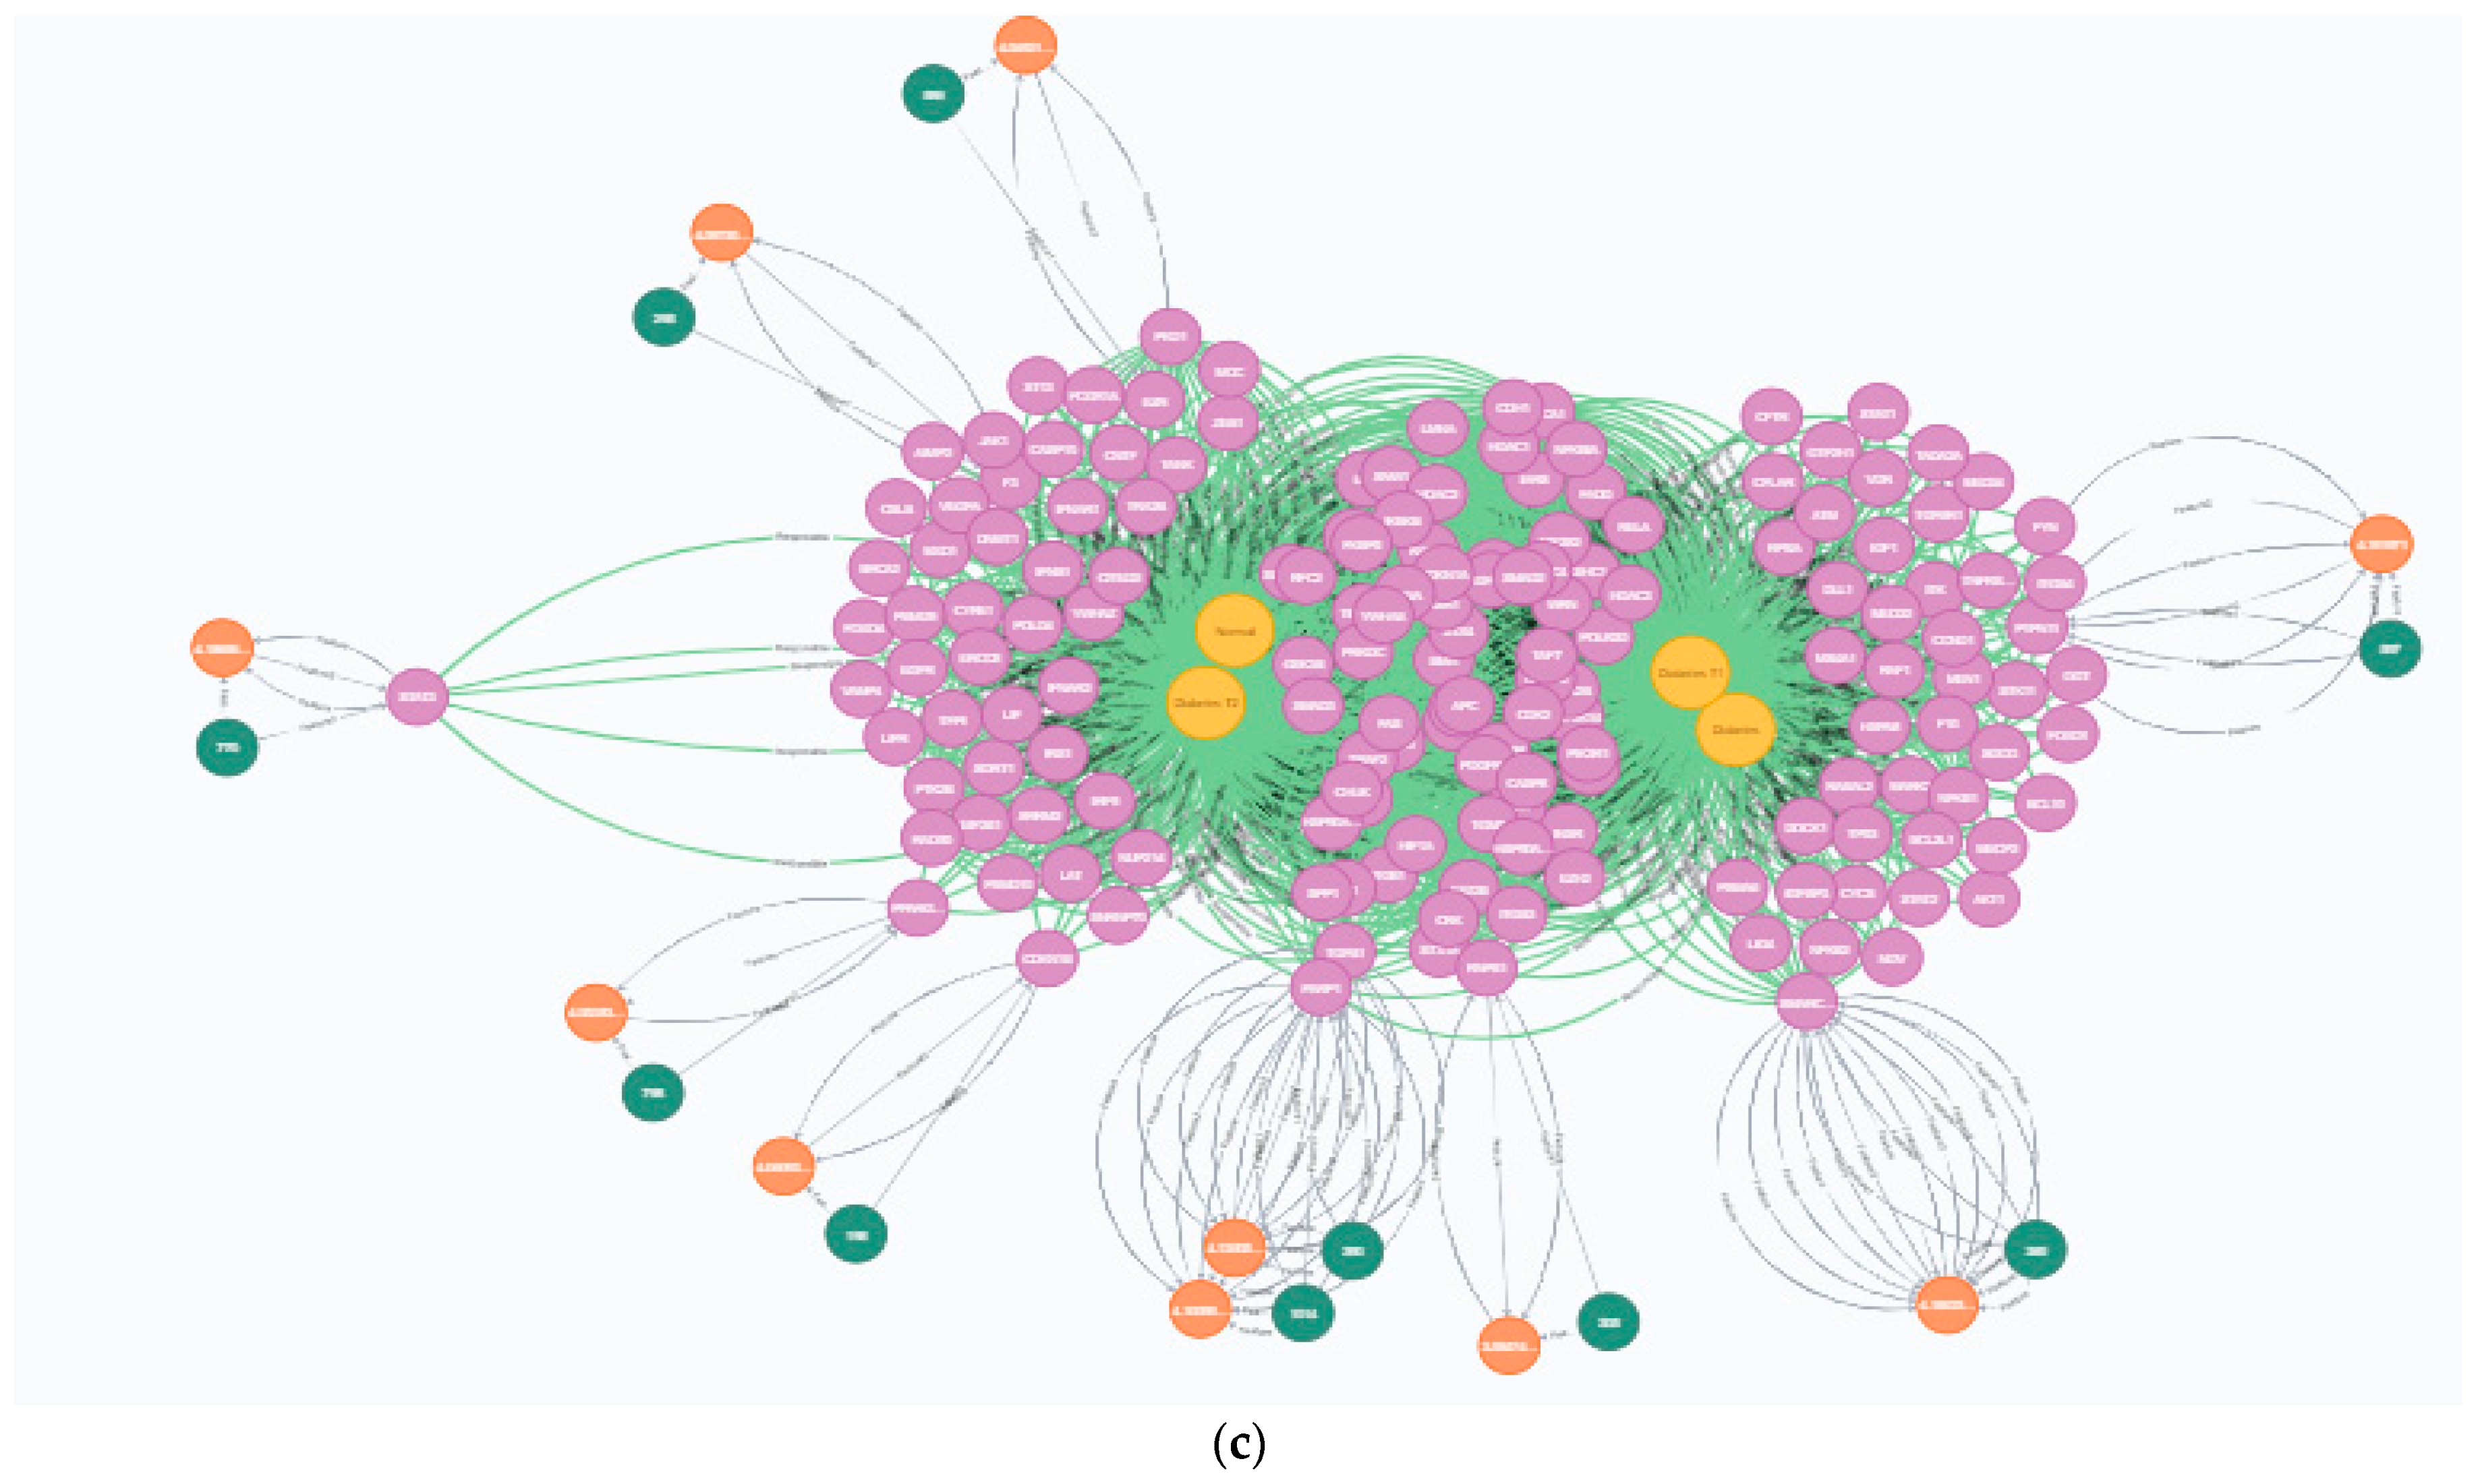
For the visual representation of our feature set, we used Neo4j (https://neo4j.com/) accessed on 15 October 2022, an online graph database management system available for the presentation of relationships between entities for the lightning-fast read. It shows the relationship between diabetes and genes responsible for causing Type 1 diabetes and Type 2 diabetes. Figure 6 shows a relationship between regular diabetic patients, Type1 diabetes and Type 2 diabetes genes, and their respective extracted features.

3.2. Intelligent Vehicular System (IVS) Framework for Real-Time Data Processing

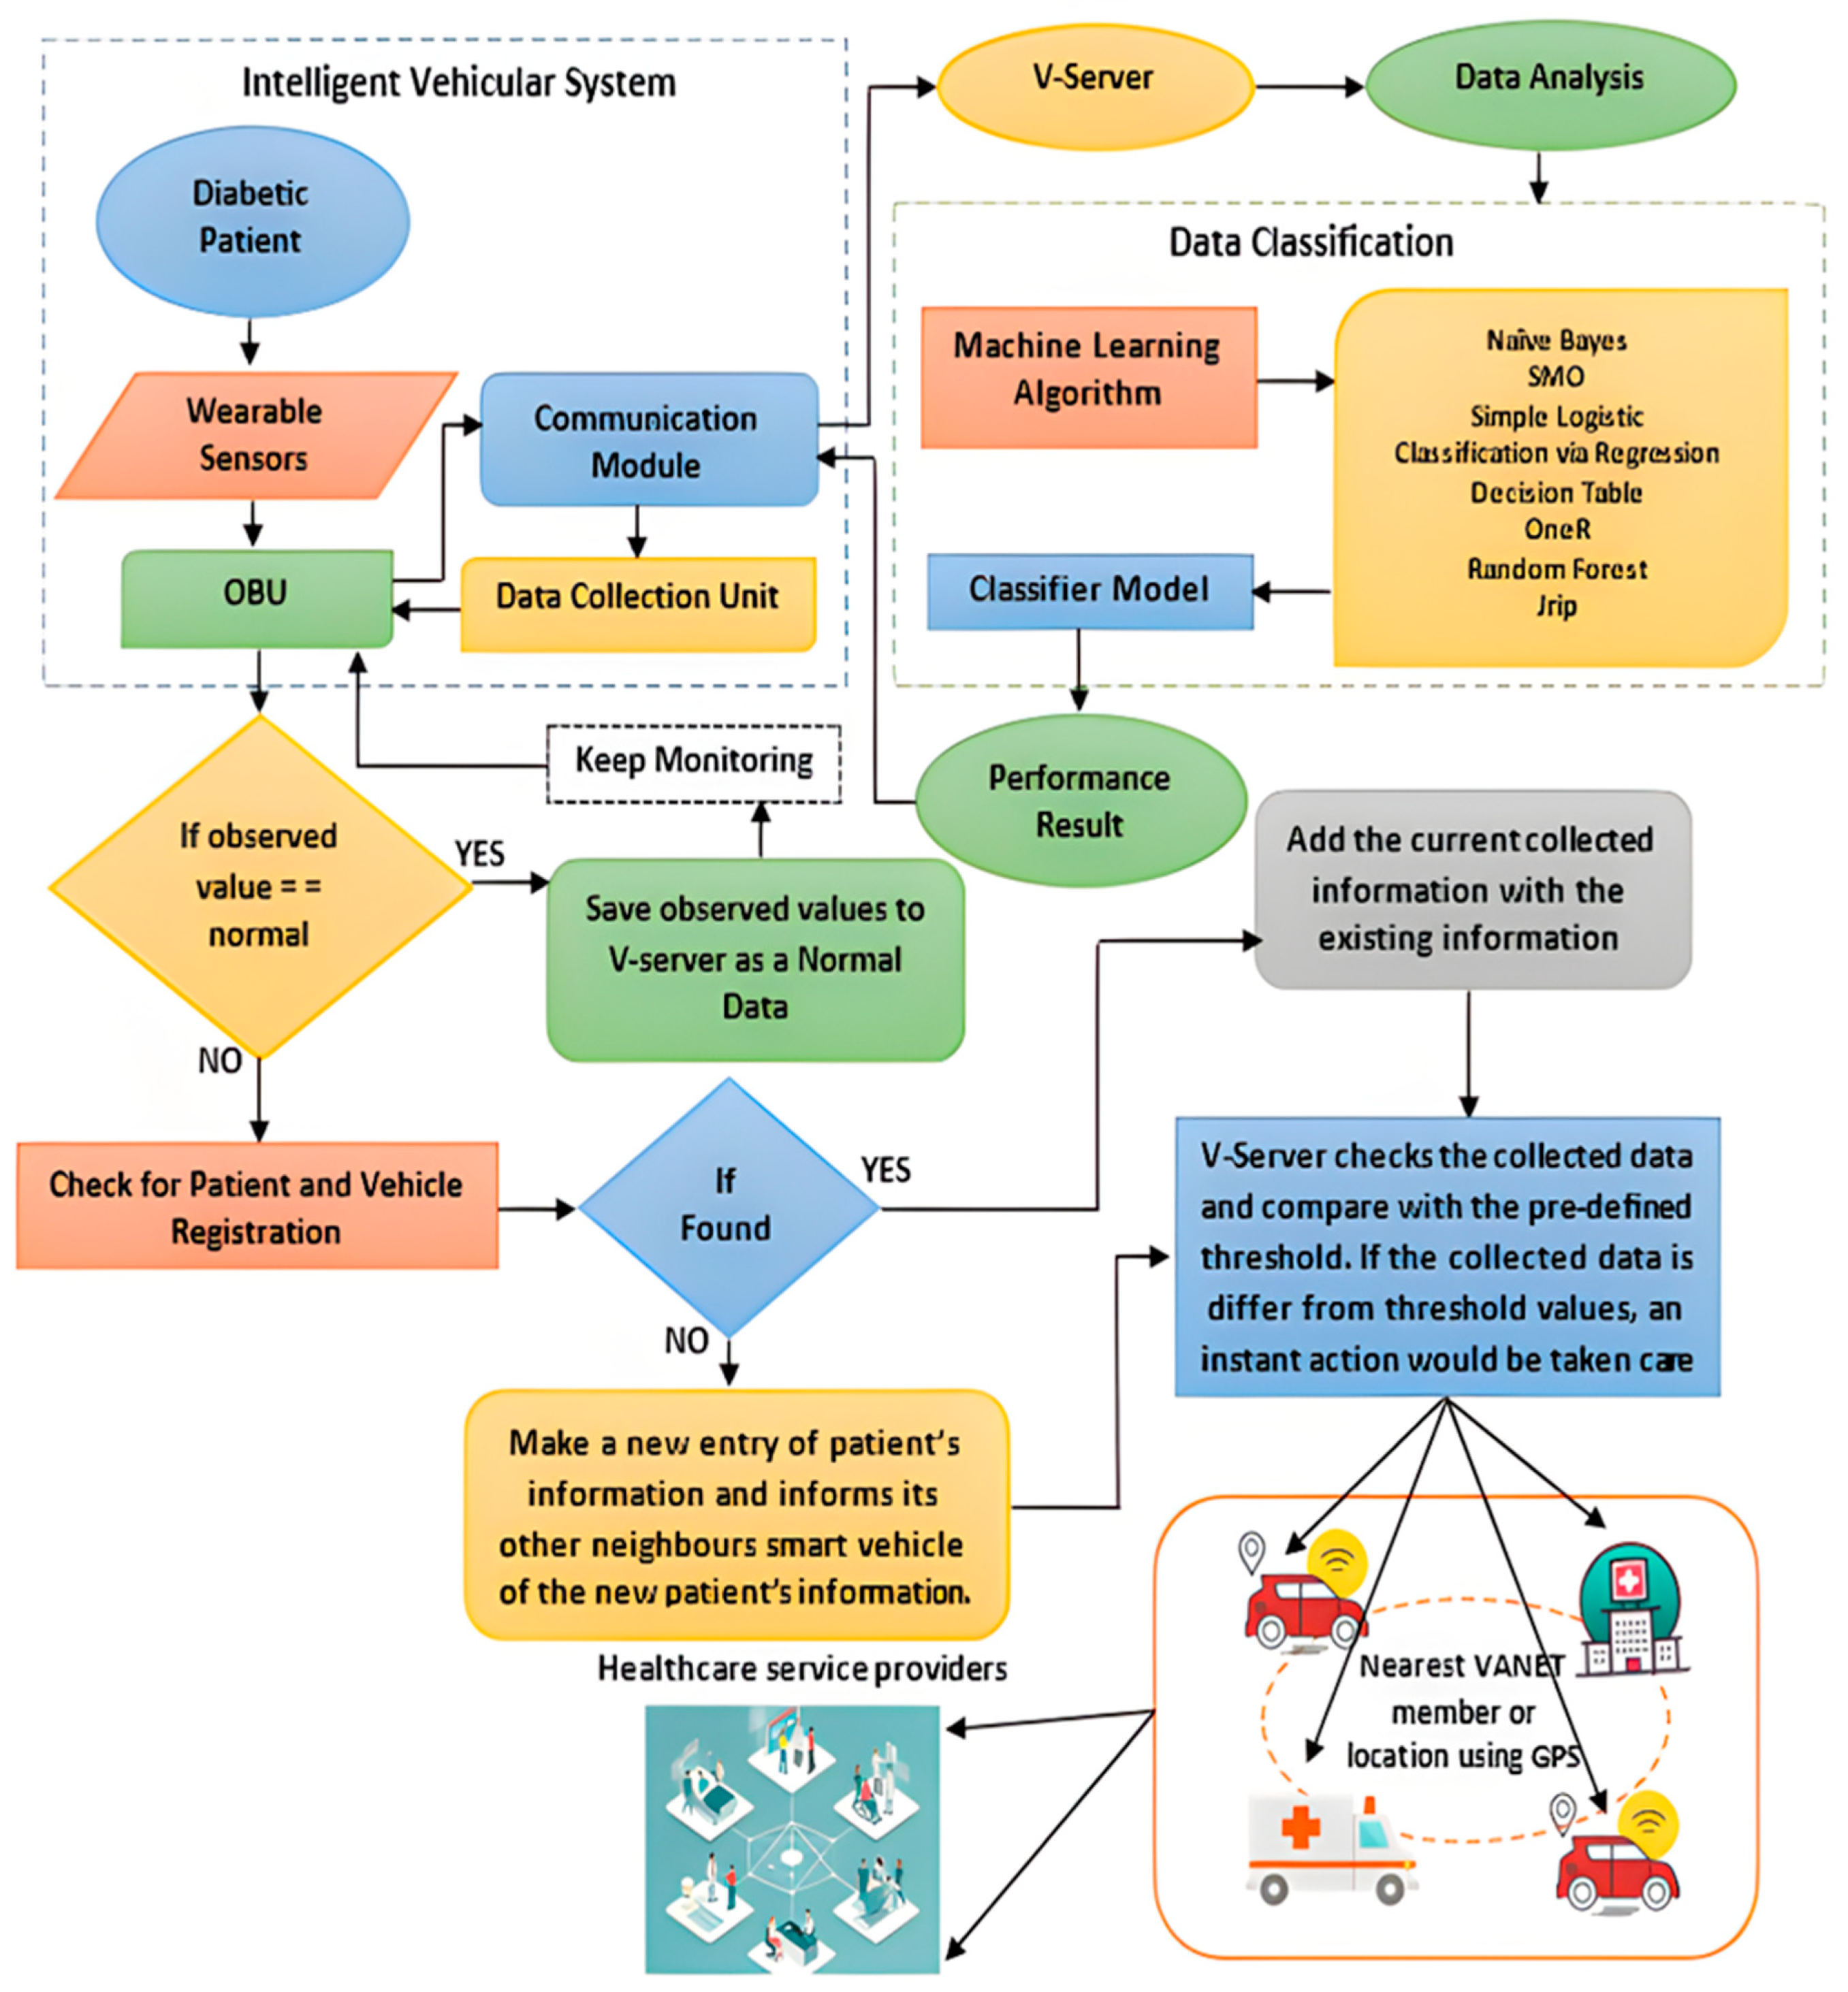
After the outstanding results of our novel approach, we proposed to integrate modern and trending technology with our proposed solution for real-time monitoring and management of diabetes. We used the model of an IVS for healthcare issues that use VANET technology for providing healthcare services and taking care from a distance. This IVS is embedded in a VANET environment for a prompt response, providing wireless communication even when the cellular network fails due to natural disasters, heavy traffic, or other reasons. VANET helps a group of vehicles to create and maintain a correspondence network among them where there is no infrastructure and any controller or central base station [30]. Figure 7 shows the framework of the proposed methodology for real-time monitoring of a diabetic patient when he is moving, i.e., traveling or driving. The process comprises advanced CGM wearable sensors, and data are transmitted and processed using a VANET environment. Data are sent to the vehicular server to monitor and manage retrieved values. VANET provides an ideal environment to determine emergency cases rapidly and efficiently without delay. Performance results are sent to the OBU, which is responsible for our scenario’s intelligent decision. Retrieved values are compared with threshold values. If an emergency occurs, the data will be sent to the nearest available physician or VANET member with the location using the GPS information of the patient for early treatment.
Three critical kinds of communication happen when we utilize the VANET environment [31]. The correspondence between the two vehicles for transmitting information during mobility is known as V2V (vehicle to Vehicle) communication. When the two infrastructures communicate with one another for quick transmission of information, this is known as I2I (infrastructure to infrastructure) communication, and when the vehicles straightforwardly communicate with the foundation when they are connected to the Web by sending the patients’ well-being information, this is known as V2I (vehicle to infrastructure) communication.
In this recent era, scholarly pursuit in innovation has become a large part of improving technology, wireless communication, the vehicle industry, and VANETs, one of the most encouraging exploration regions. This technology aims to make vehicles, sensors, and devices intelligent so they can make decisions on behalf of a human.

4. Experiments and Results

This portion presents the simulation results for genetic data based on performance metrics. We also compare our proposed approach with recent diabetes prediction and management methods.

4.1. Experimental Environment

We implement the proposed methodology in NS-2.33 to evaluate the proposed model. We employed the whole scenario in the NS-2 simulator with an area range of 1400 m × 1400 m. The experimental parameters and settings are shown in Table 4. To evaluate the performance of the proposed protocol, we evaluate the custom network topology, which has interaction points, vehicles, highways, RSUs, source vehicles, and destination vehicles. Weka (Waikato environment for knowledge analysis) is used for evaluation and classification. Several worthy classification techniques have been proposed in the past for diabetes management, i.e., decision tree (DT), random forest (RF), naïve Bayes (NB), sequential minimal optimization (SMO), logistic regression (LR), etc. It has been found that no classification algorithm performs well with different evaluation parameters and 10-fold cross-validation; hence, the study of numerous classifiers is useful. Classification assigns categories to data collection to predict and analyze more accurately. Classification is performed based on a set of characteristics or features.
We explored all the existing methods and proposed a new approach for predicting diabetes based on genetic features. We also performed a comparative analysis among existing classification algorithms for the best possible performance. We test our data by using eight different algorithms, including naïve Bayesian (NB), sequential minimal optimization (SMO), simple logistics (SL), classification via regression (CvR), decision tree (DT), OneR, random forest (RF), and JRip. We found that all the classifiers, as mentioned above, predict differently and generate different results. All the computed parameters are unified and fragmented into train and test sets by applying n-fold cross-validation where n = 10. To validate our result, we place emphases on accuracy, precision, recall, and F-measure. However, we not only compare all algorithms used in this study but also our results with recent research works using all performance metrics of their studies, i.e., sensitivity, specificity, MCC, and AROC.
We use the cross-validation method to evaluate our model, focusing on this study’s eight classification algorithms. The itemized after-effects of every expectation model are introduced one after the other.

Dataset Description

The supervised machine learning technique required labeled datasets for training and testing purposes. The numerical results are based on a real dataset that demonstrates the effectiveness of the proposed content pre-caching scheme. We are working on a novel technique to solve the problem of driver’s diabetes monitoring. The dataset is obtained and generated using the VANET environment in NS-2. The main characteristics of the dataset are indicated using Table 3 with sample values. There are 115,585 records of the dataset. A total of 40% dataset is used for training, and the remaining 60% is used for testing purposes.

4.2. Performance Evaluation Parameter

The proposed model deals with the classification and detection of drivers having diabetes. Classification algorithms of this study classify our feature set individually based on correctly classified instances and incorrectly classified instances by evaluating the true positive (TP) rate, true negative (TN) rate, false negative (FN) rate, and false positive (FP) rate. TP and TN show the numbers of diabetic patients that were accurately classified, and FN and FP demonstrate the quantities of diabetic patients that were erroneously classified. Table 5 shows the training time with the frequency of correctly classified and incorrectly classified instances, including the TP and FP rates of all algorithms. The algorithms compare the different results on the same dataset over multiple machine learning algorithms to evaluate the efficiency of the algorithms.
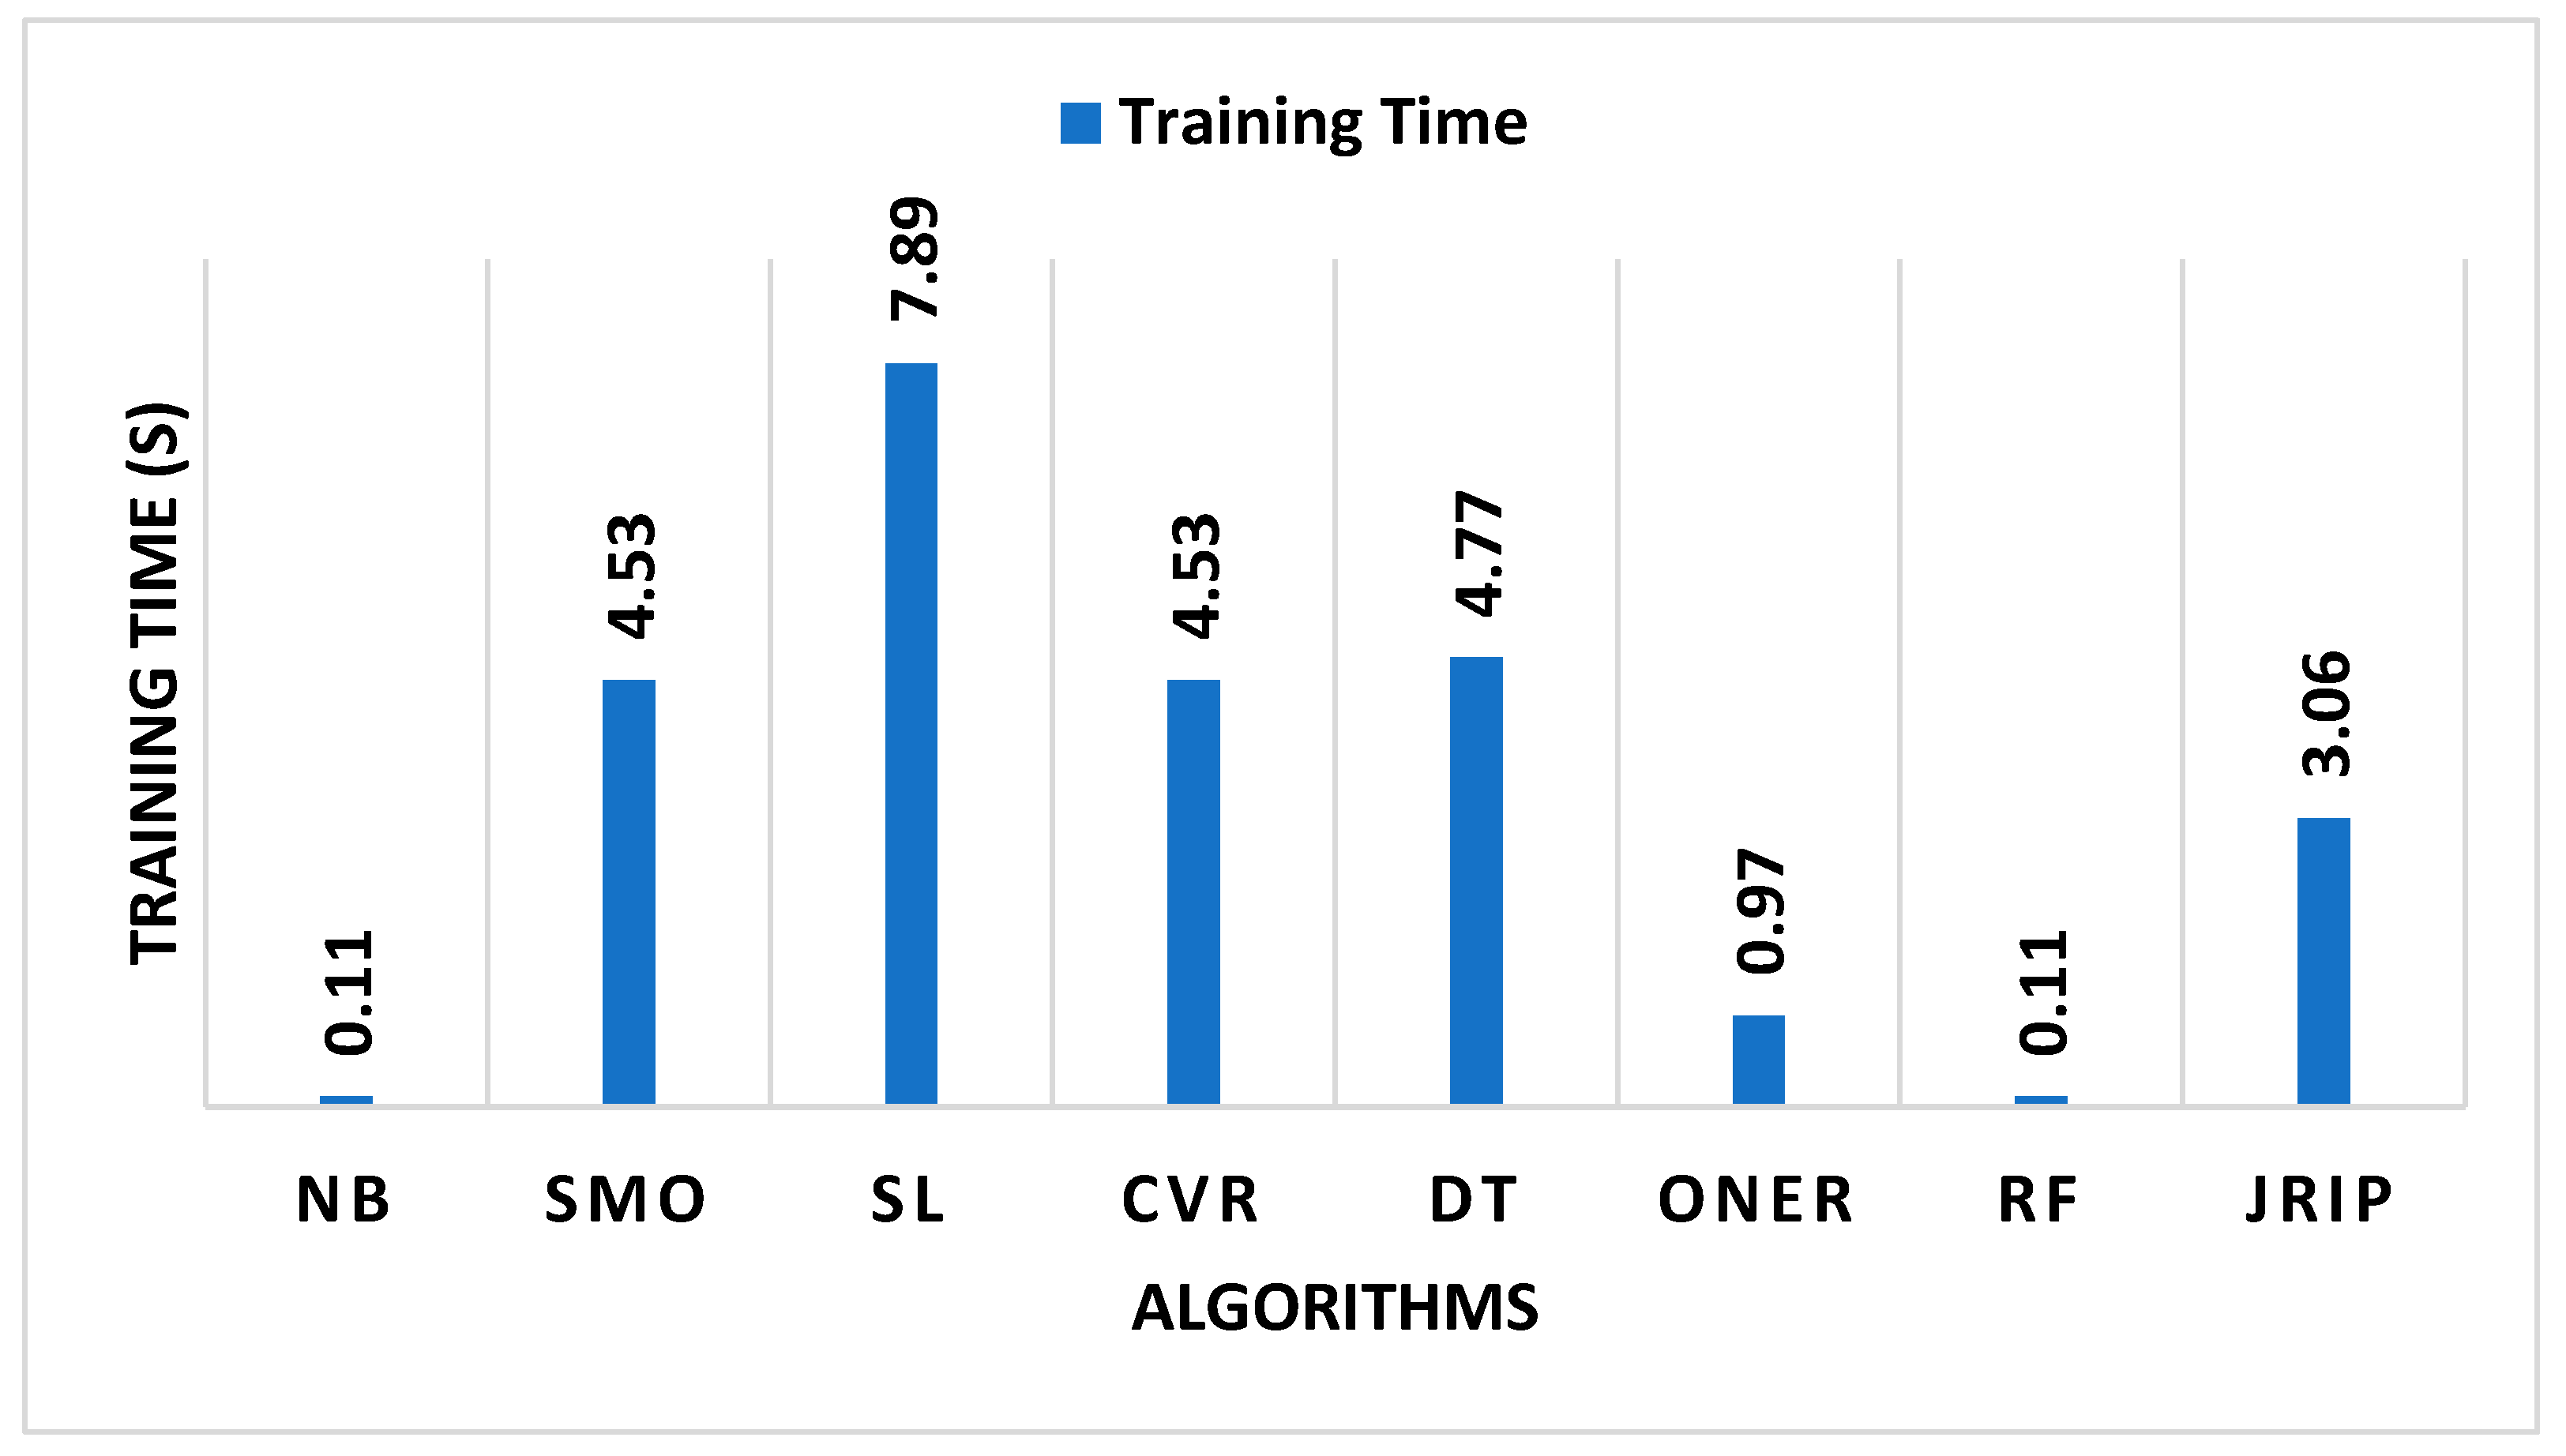
Figure 8 shows the training time of the algorithms, as mentioned above. Naïve Bayes and random forest take the shortest time, i.e., 0.11 s, whereas simple logistic takes the longest time, about 7.89 s.
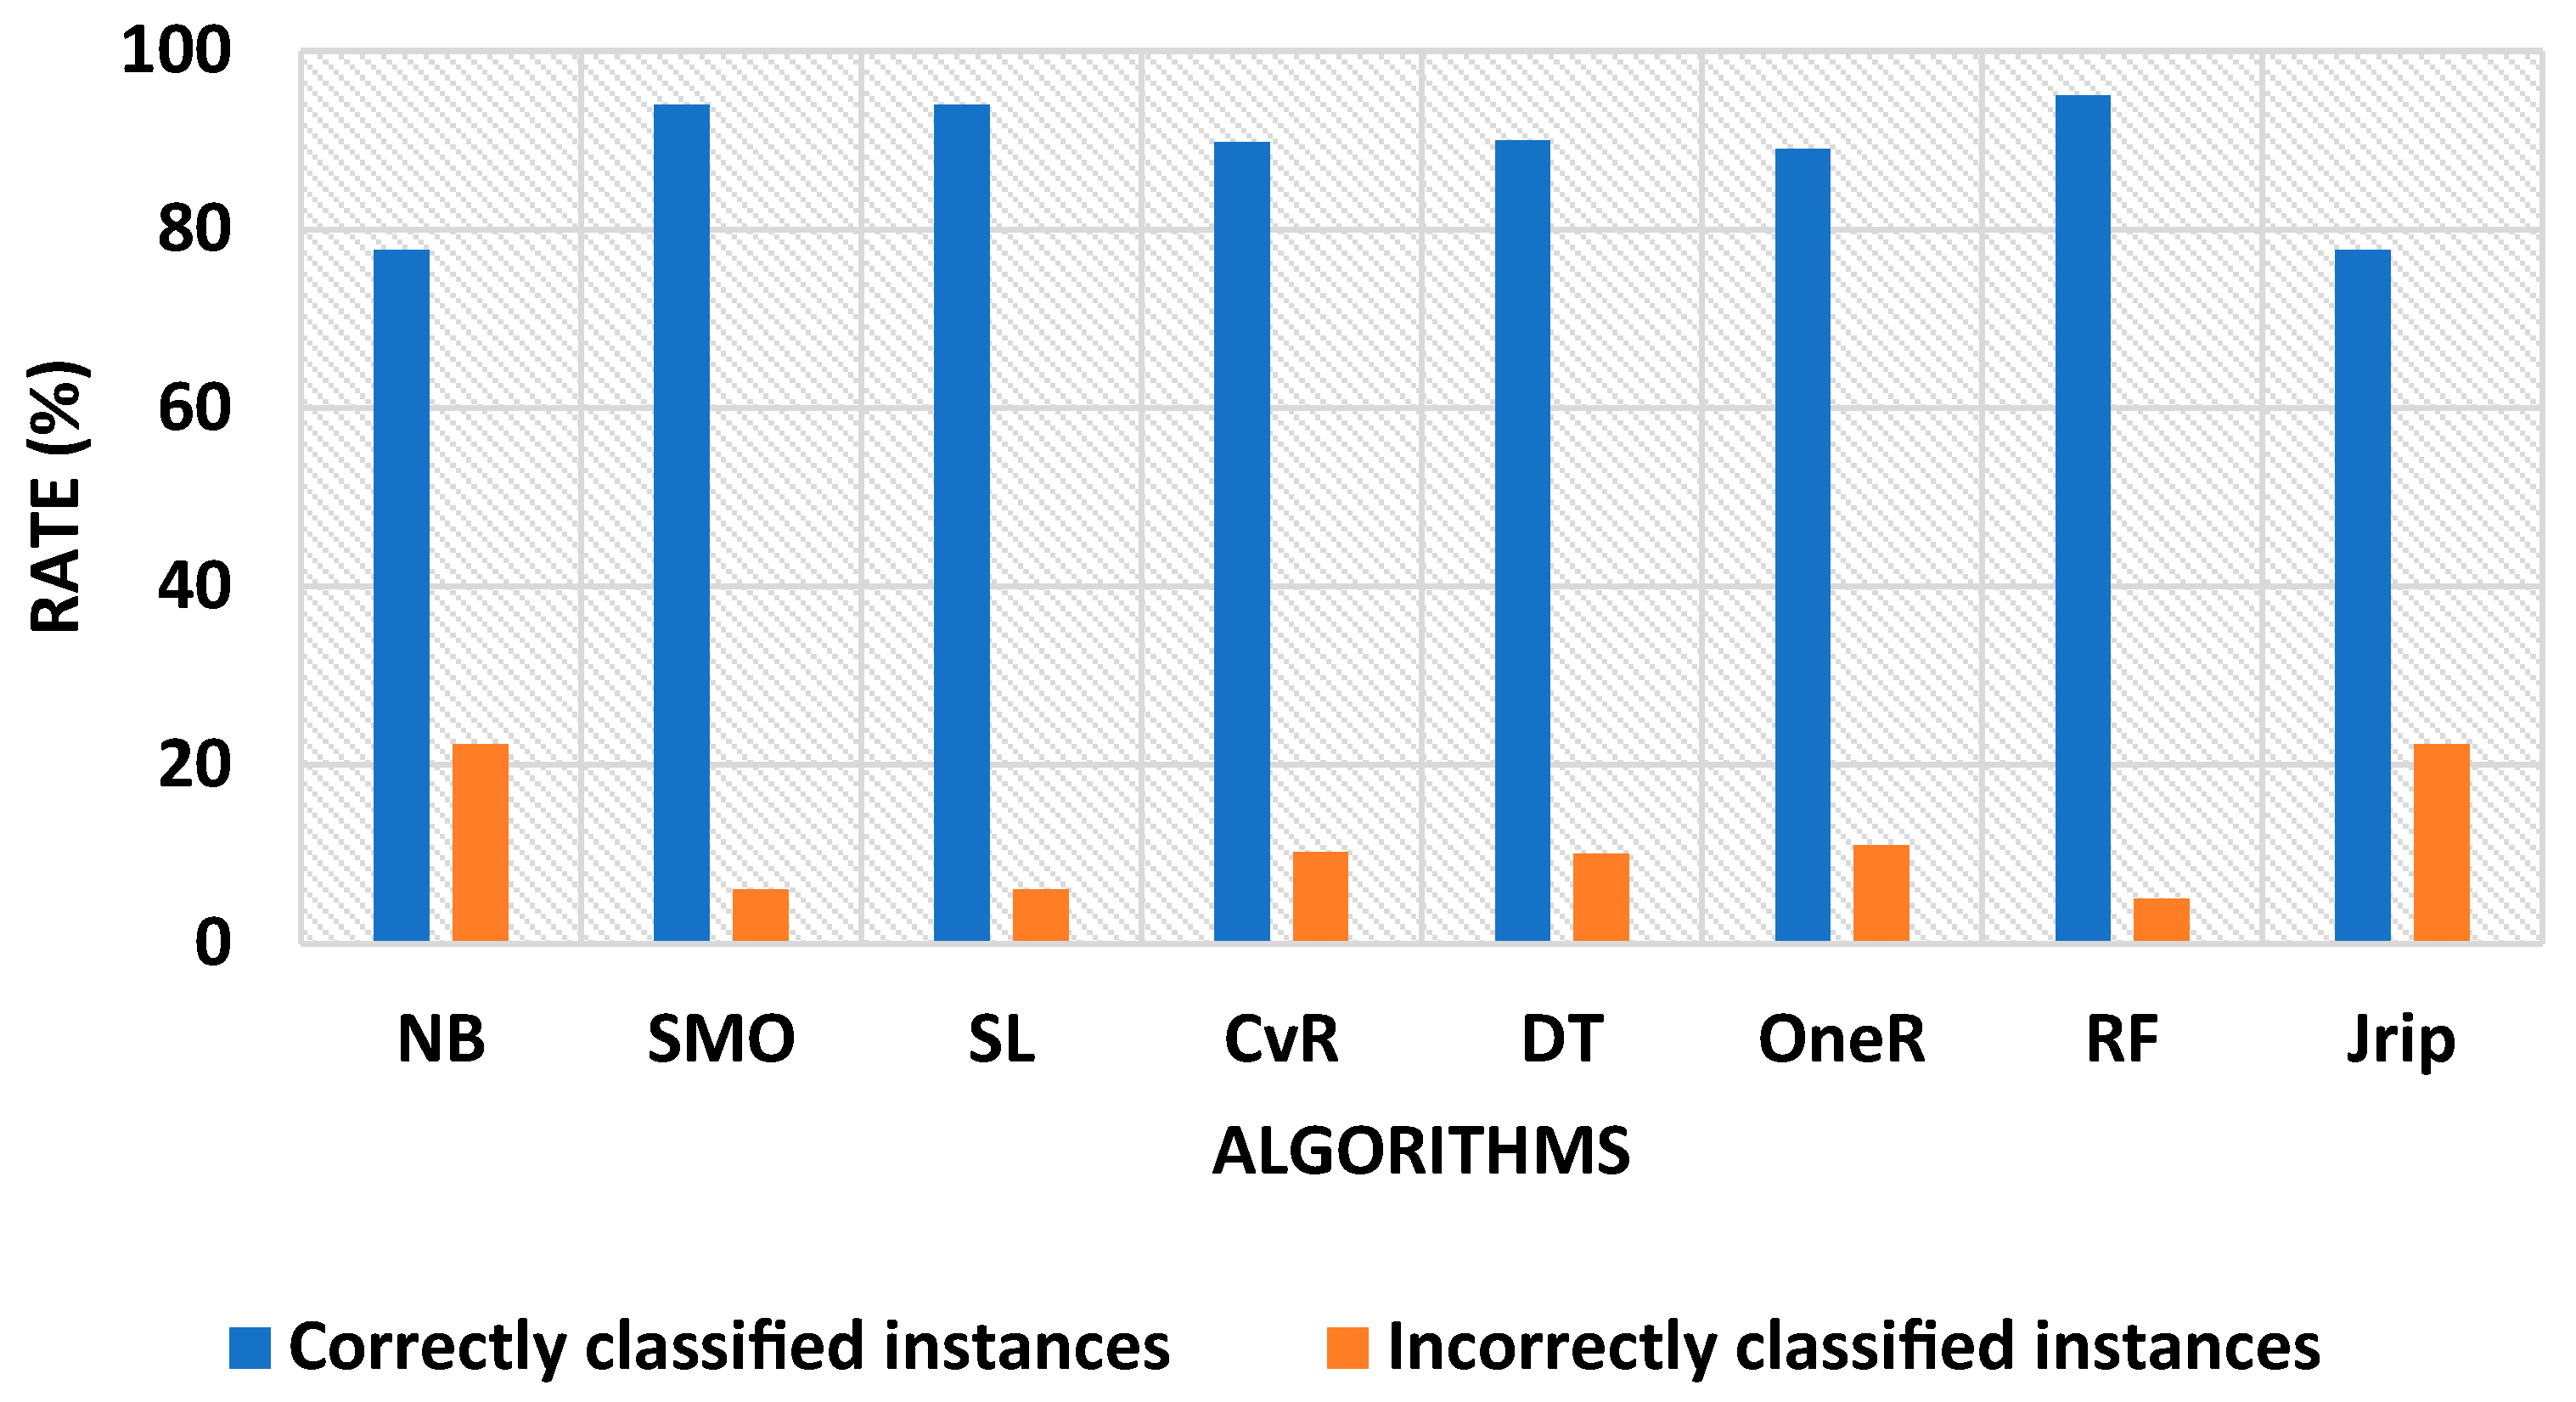
Figure 9 presents a comparison between all algorithms of this study in terms of correctly classified instances and incorrectly classified instances.
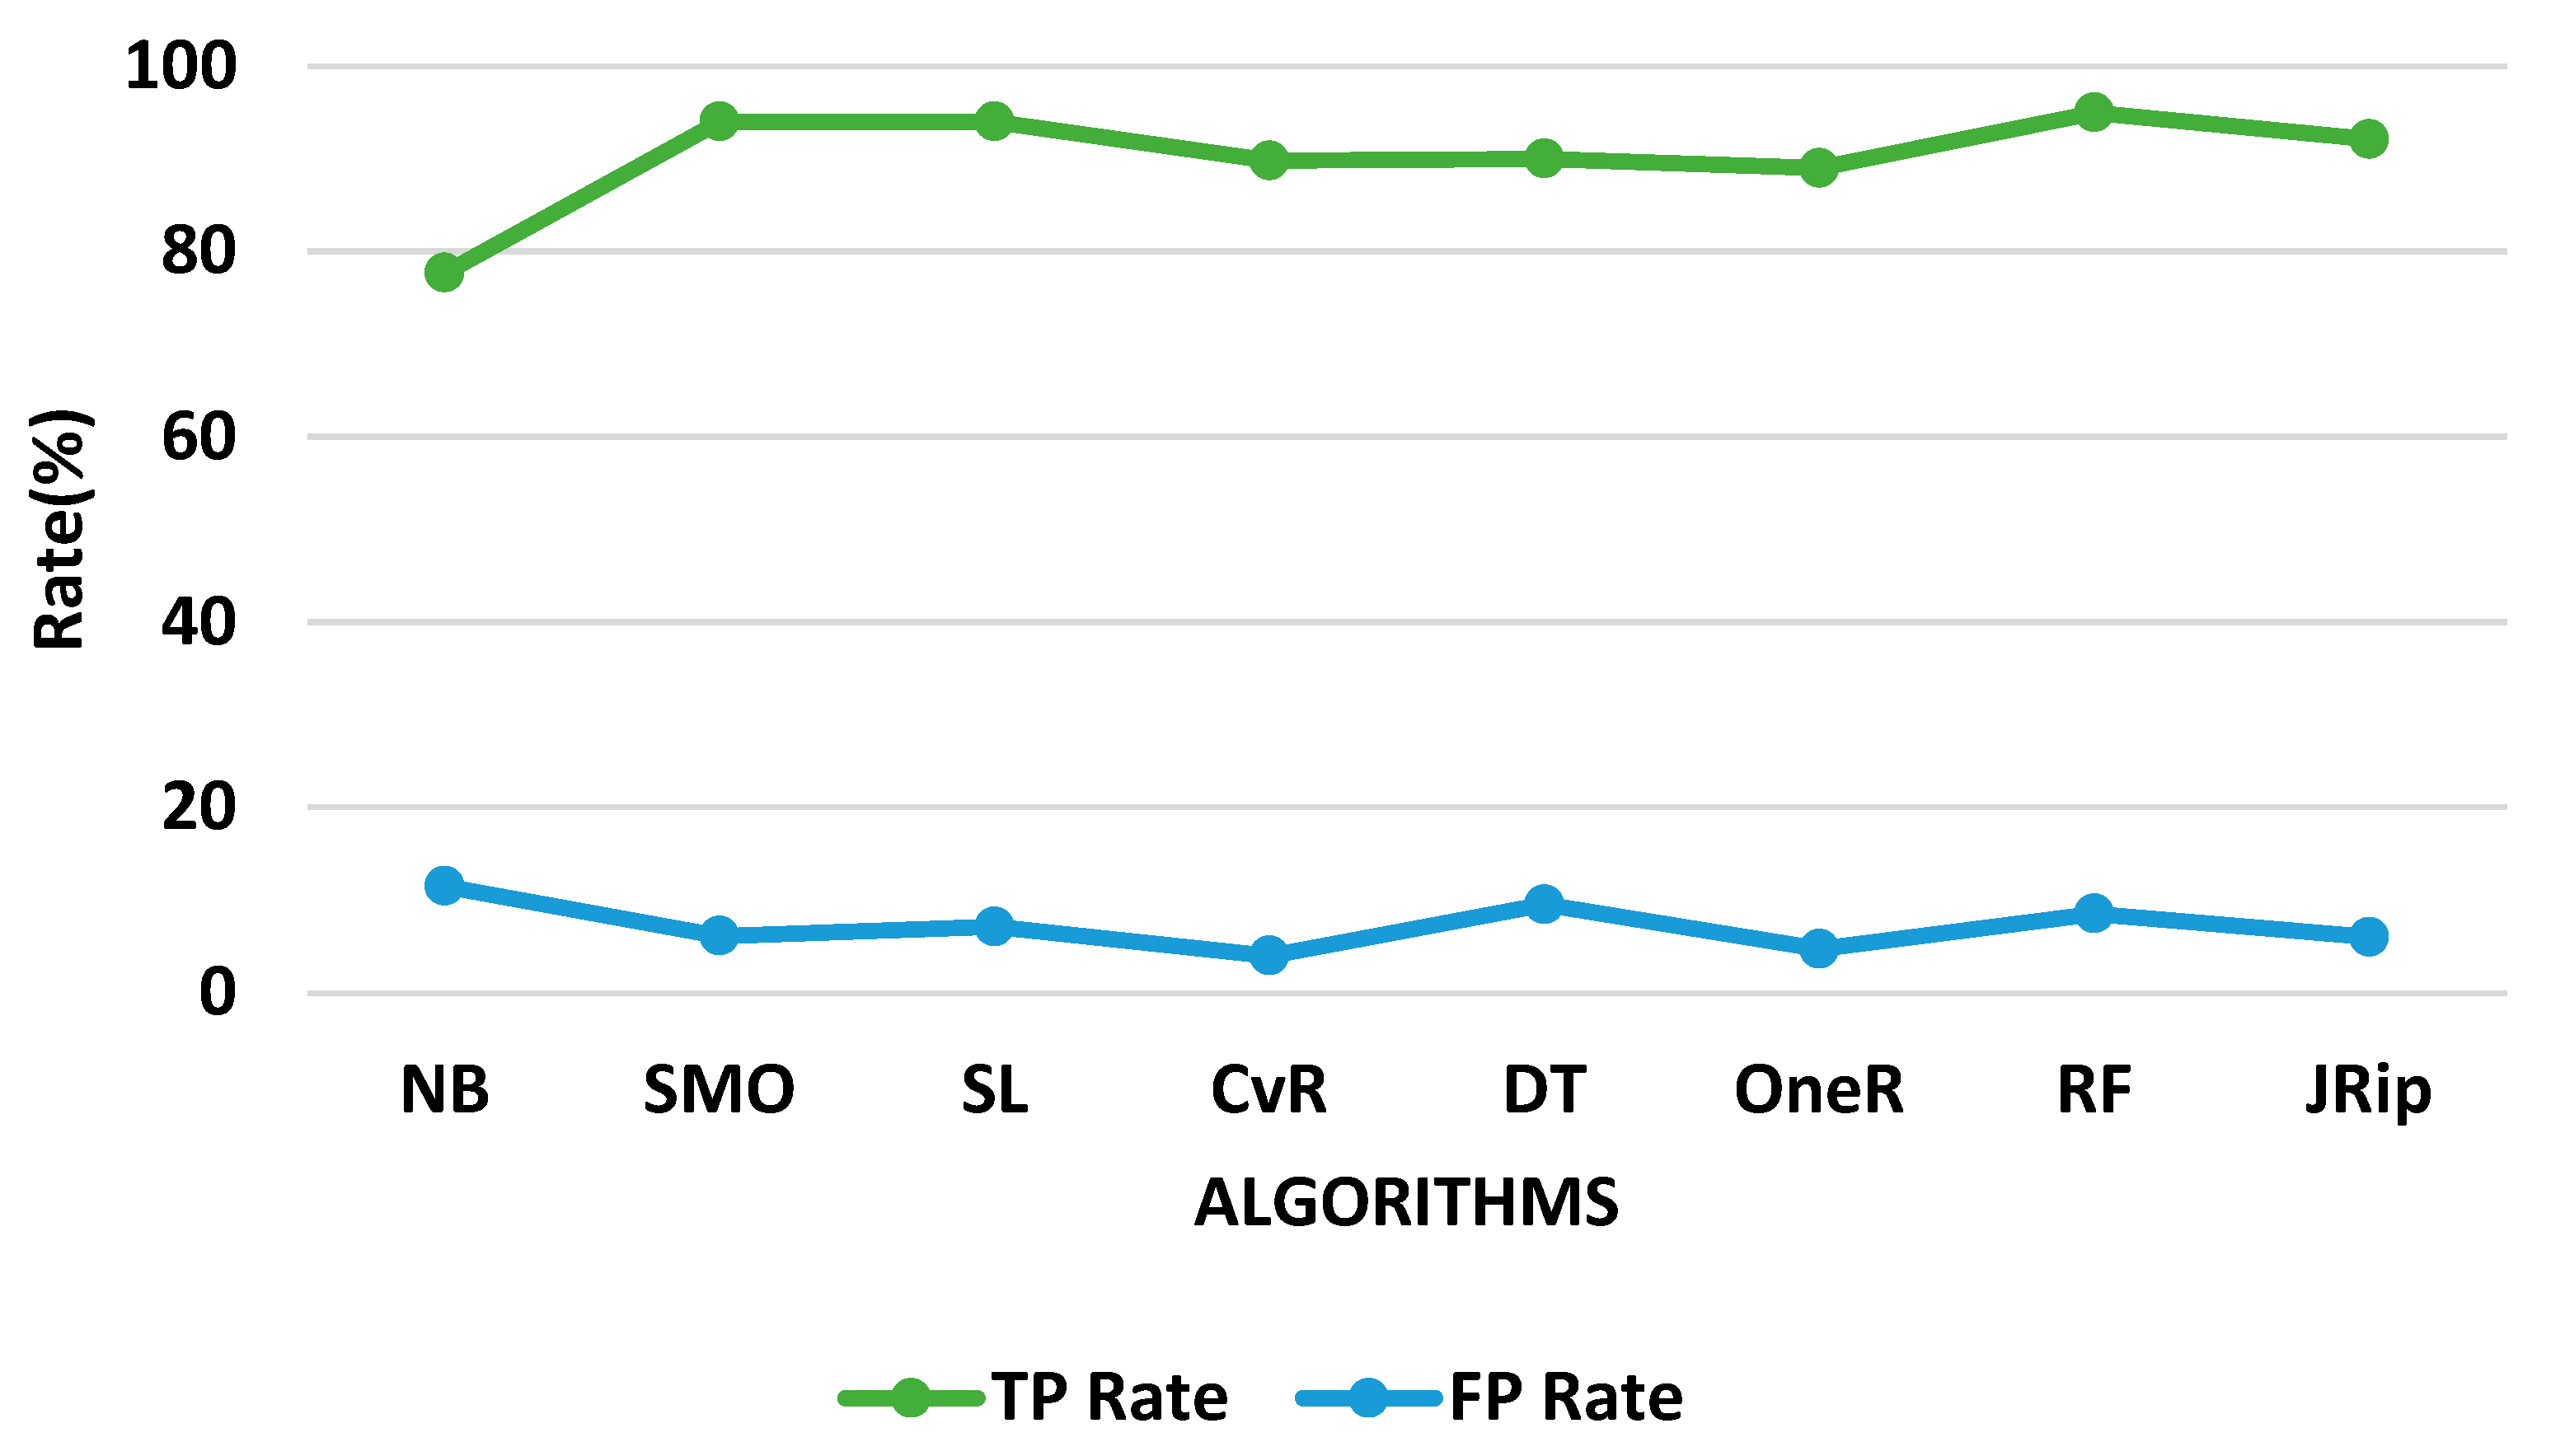
TP specifies the ability of all algorithms to accurately predict diabetes, whereas FP specifies the knowledge of all algorithms, which accurately predict those not having diabetes, respectively. Figure 10 shows the TP and FP rates of all algorithms.
The performance measurements of the classification model are estimated depending on the evaluation parameters introduced.
Accuracy [13] defines the ratio of correctly predicted diabetes cases out of all instances, and precision defines how many of those predicted as diabetic have diabetes. TP specifies the ability of all algorithms to accurately predict diabetes, whereas FP specifies the ability of all algorithms, which accurately predict those not having diabetes, respectively.
Accuracy = TN + TP TN + TP + FP + FN
Precision [13] defines how many of those who are predicted as having diabetes are diabetic patients.
Precision = TP TP + FP
Recall [13] defines all the diabetic patients and how many are correctly predicted.
Recall = TP TP + FN
whereas the F1-score [32], also recognized as F-measure, is the harmonic mean of precision and recall.
F - measure / F - sore = 2 × recall × precision recall + precision
Mean squared error (MSE) [32] measures the mean squared difference between predicted diabetes cases and actual cases.
MSE = 1 n i = 1 n y i   y ˇ i 2
Mean absolute error (MAE) [33] measures the number of errors in classification.
MAE = i = 1 n y i x i n
Cohen’s kappa [34] measures the performance of the model.
KAPPA = P 0 P e 1 P e
Table 6 summarizes the classification model performance. The outcomes are compared with different execution estimates with various evaluation parameters described above.
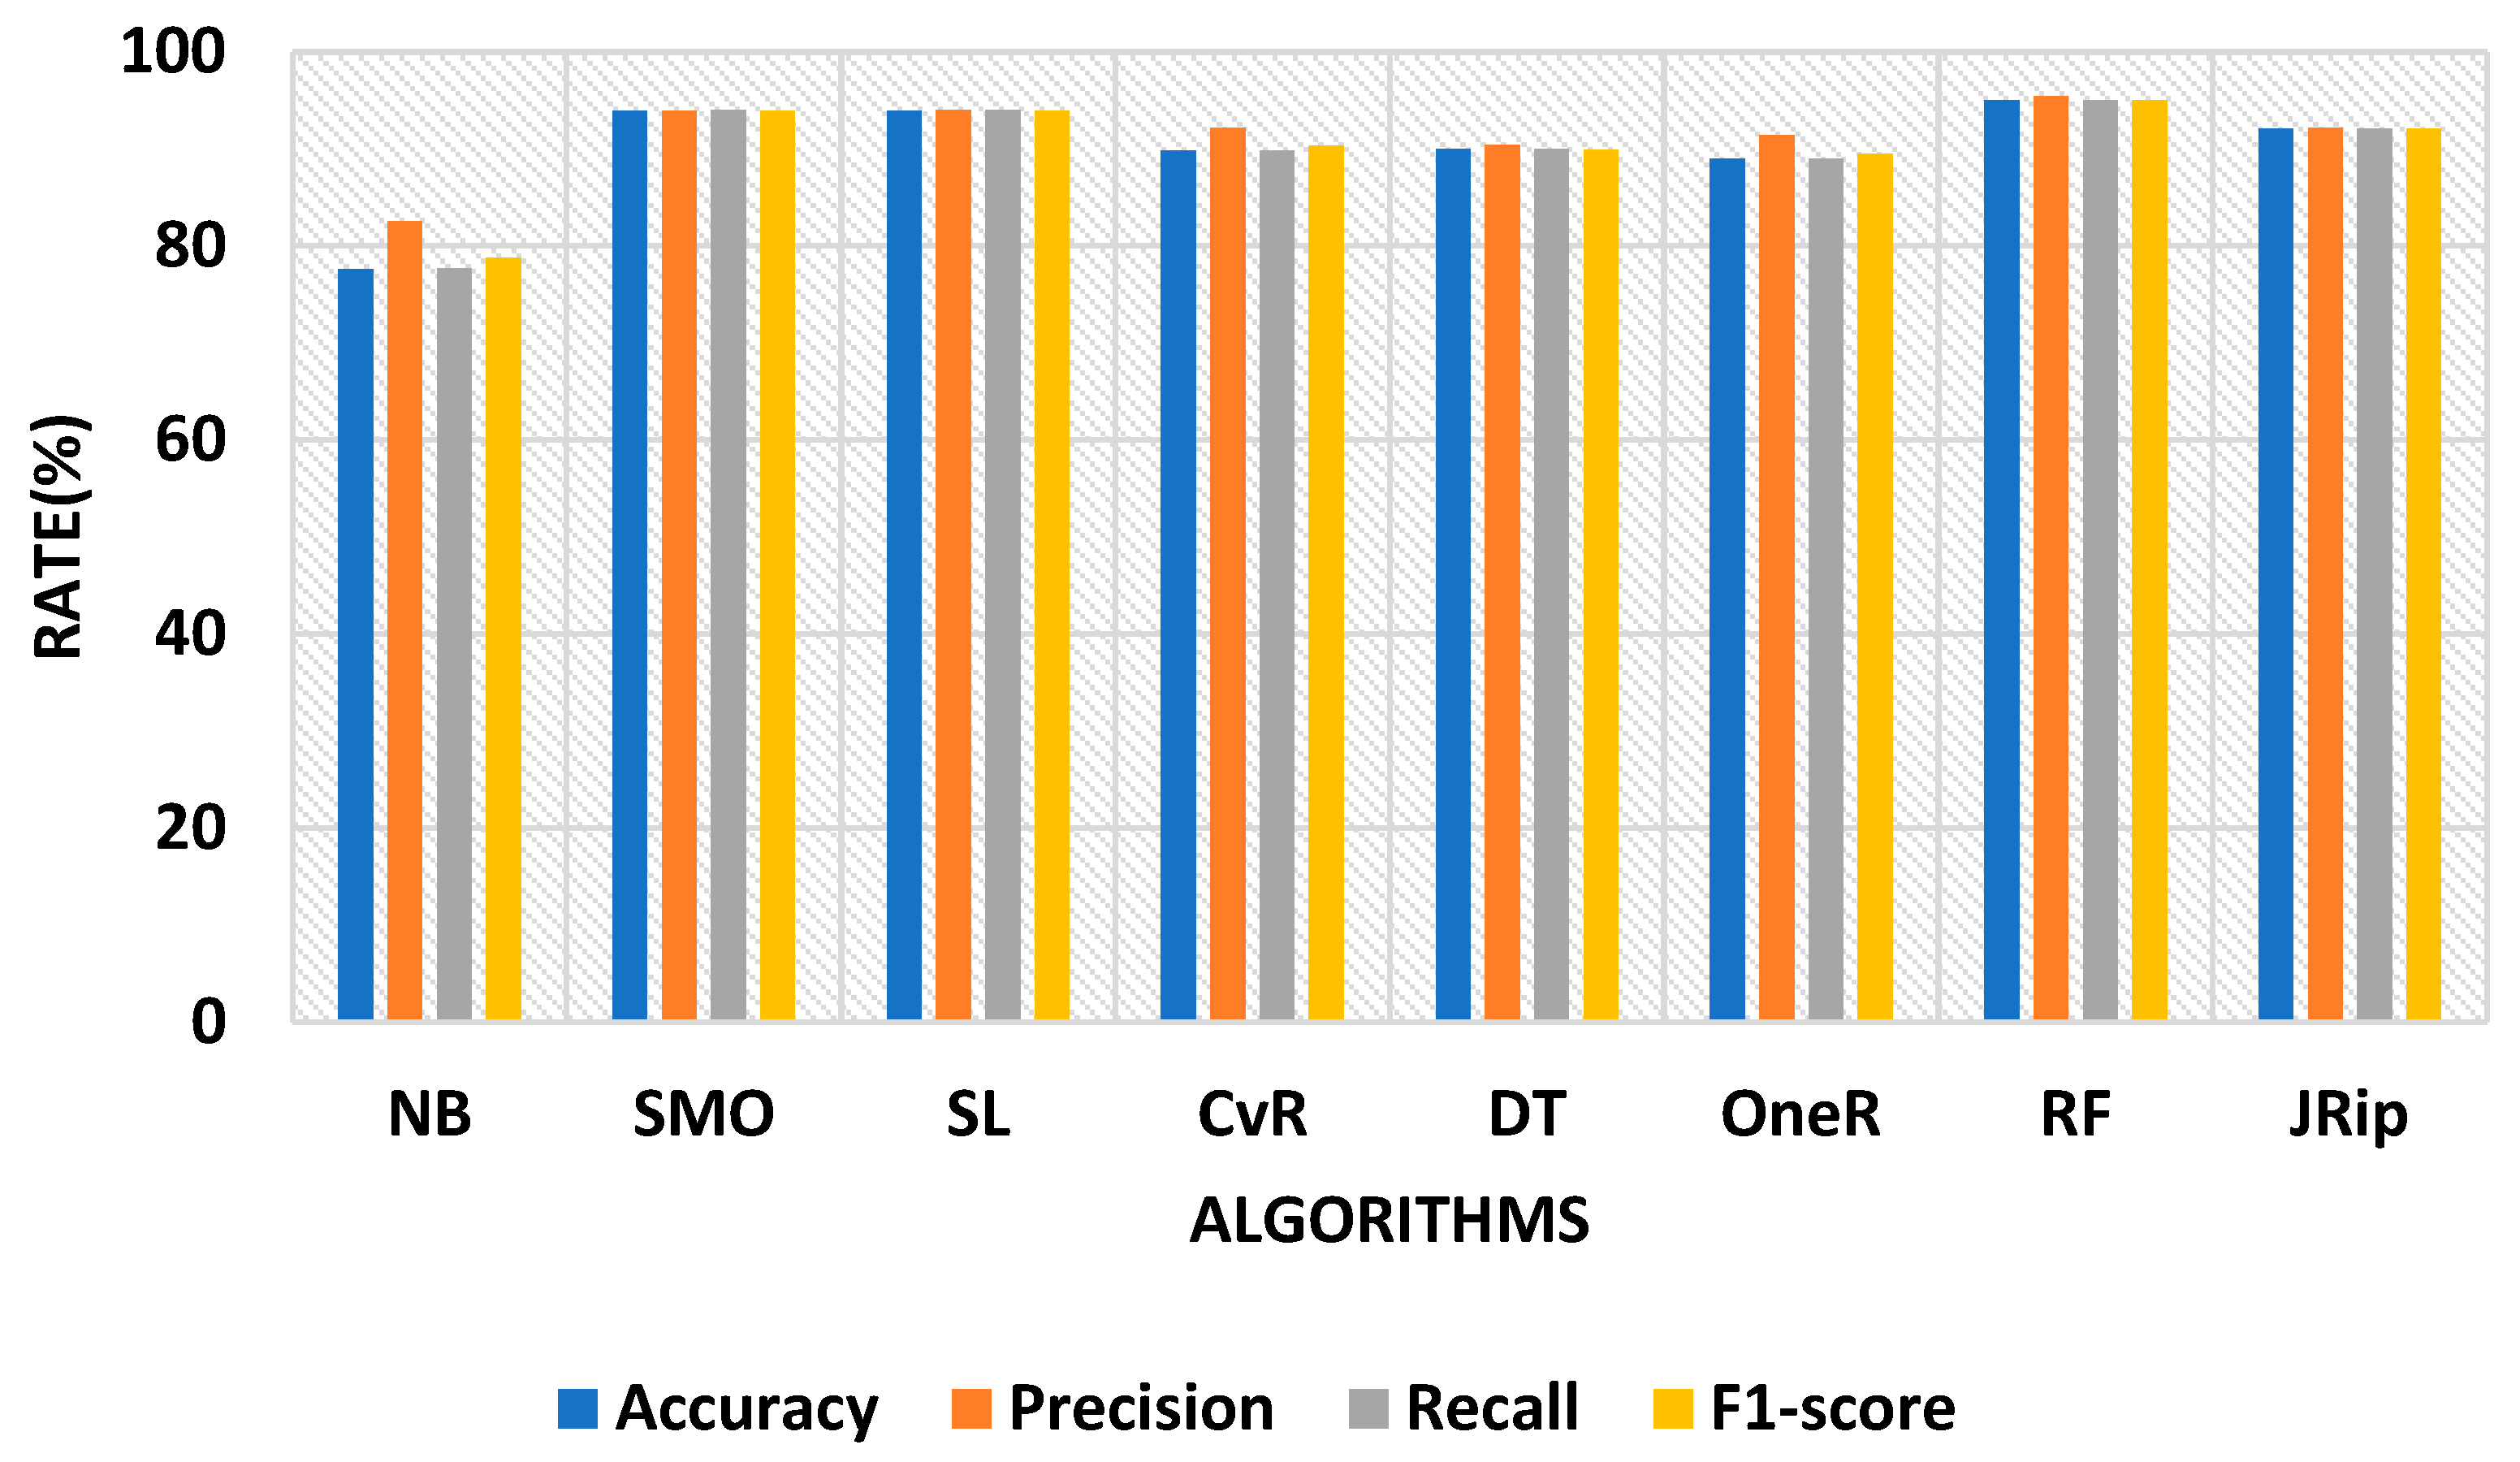
Figure 11 shows evaluated results of classification algorithms, such as naïve Bayesian (NB), sequential minimal optimization (SMO), simple logistic (SL), classification via regression (CvR), decision tree (DT), OneR, random forest (RF), and JRip, respectively.
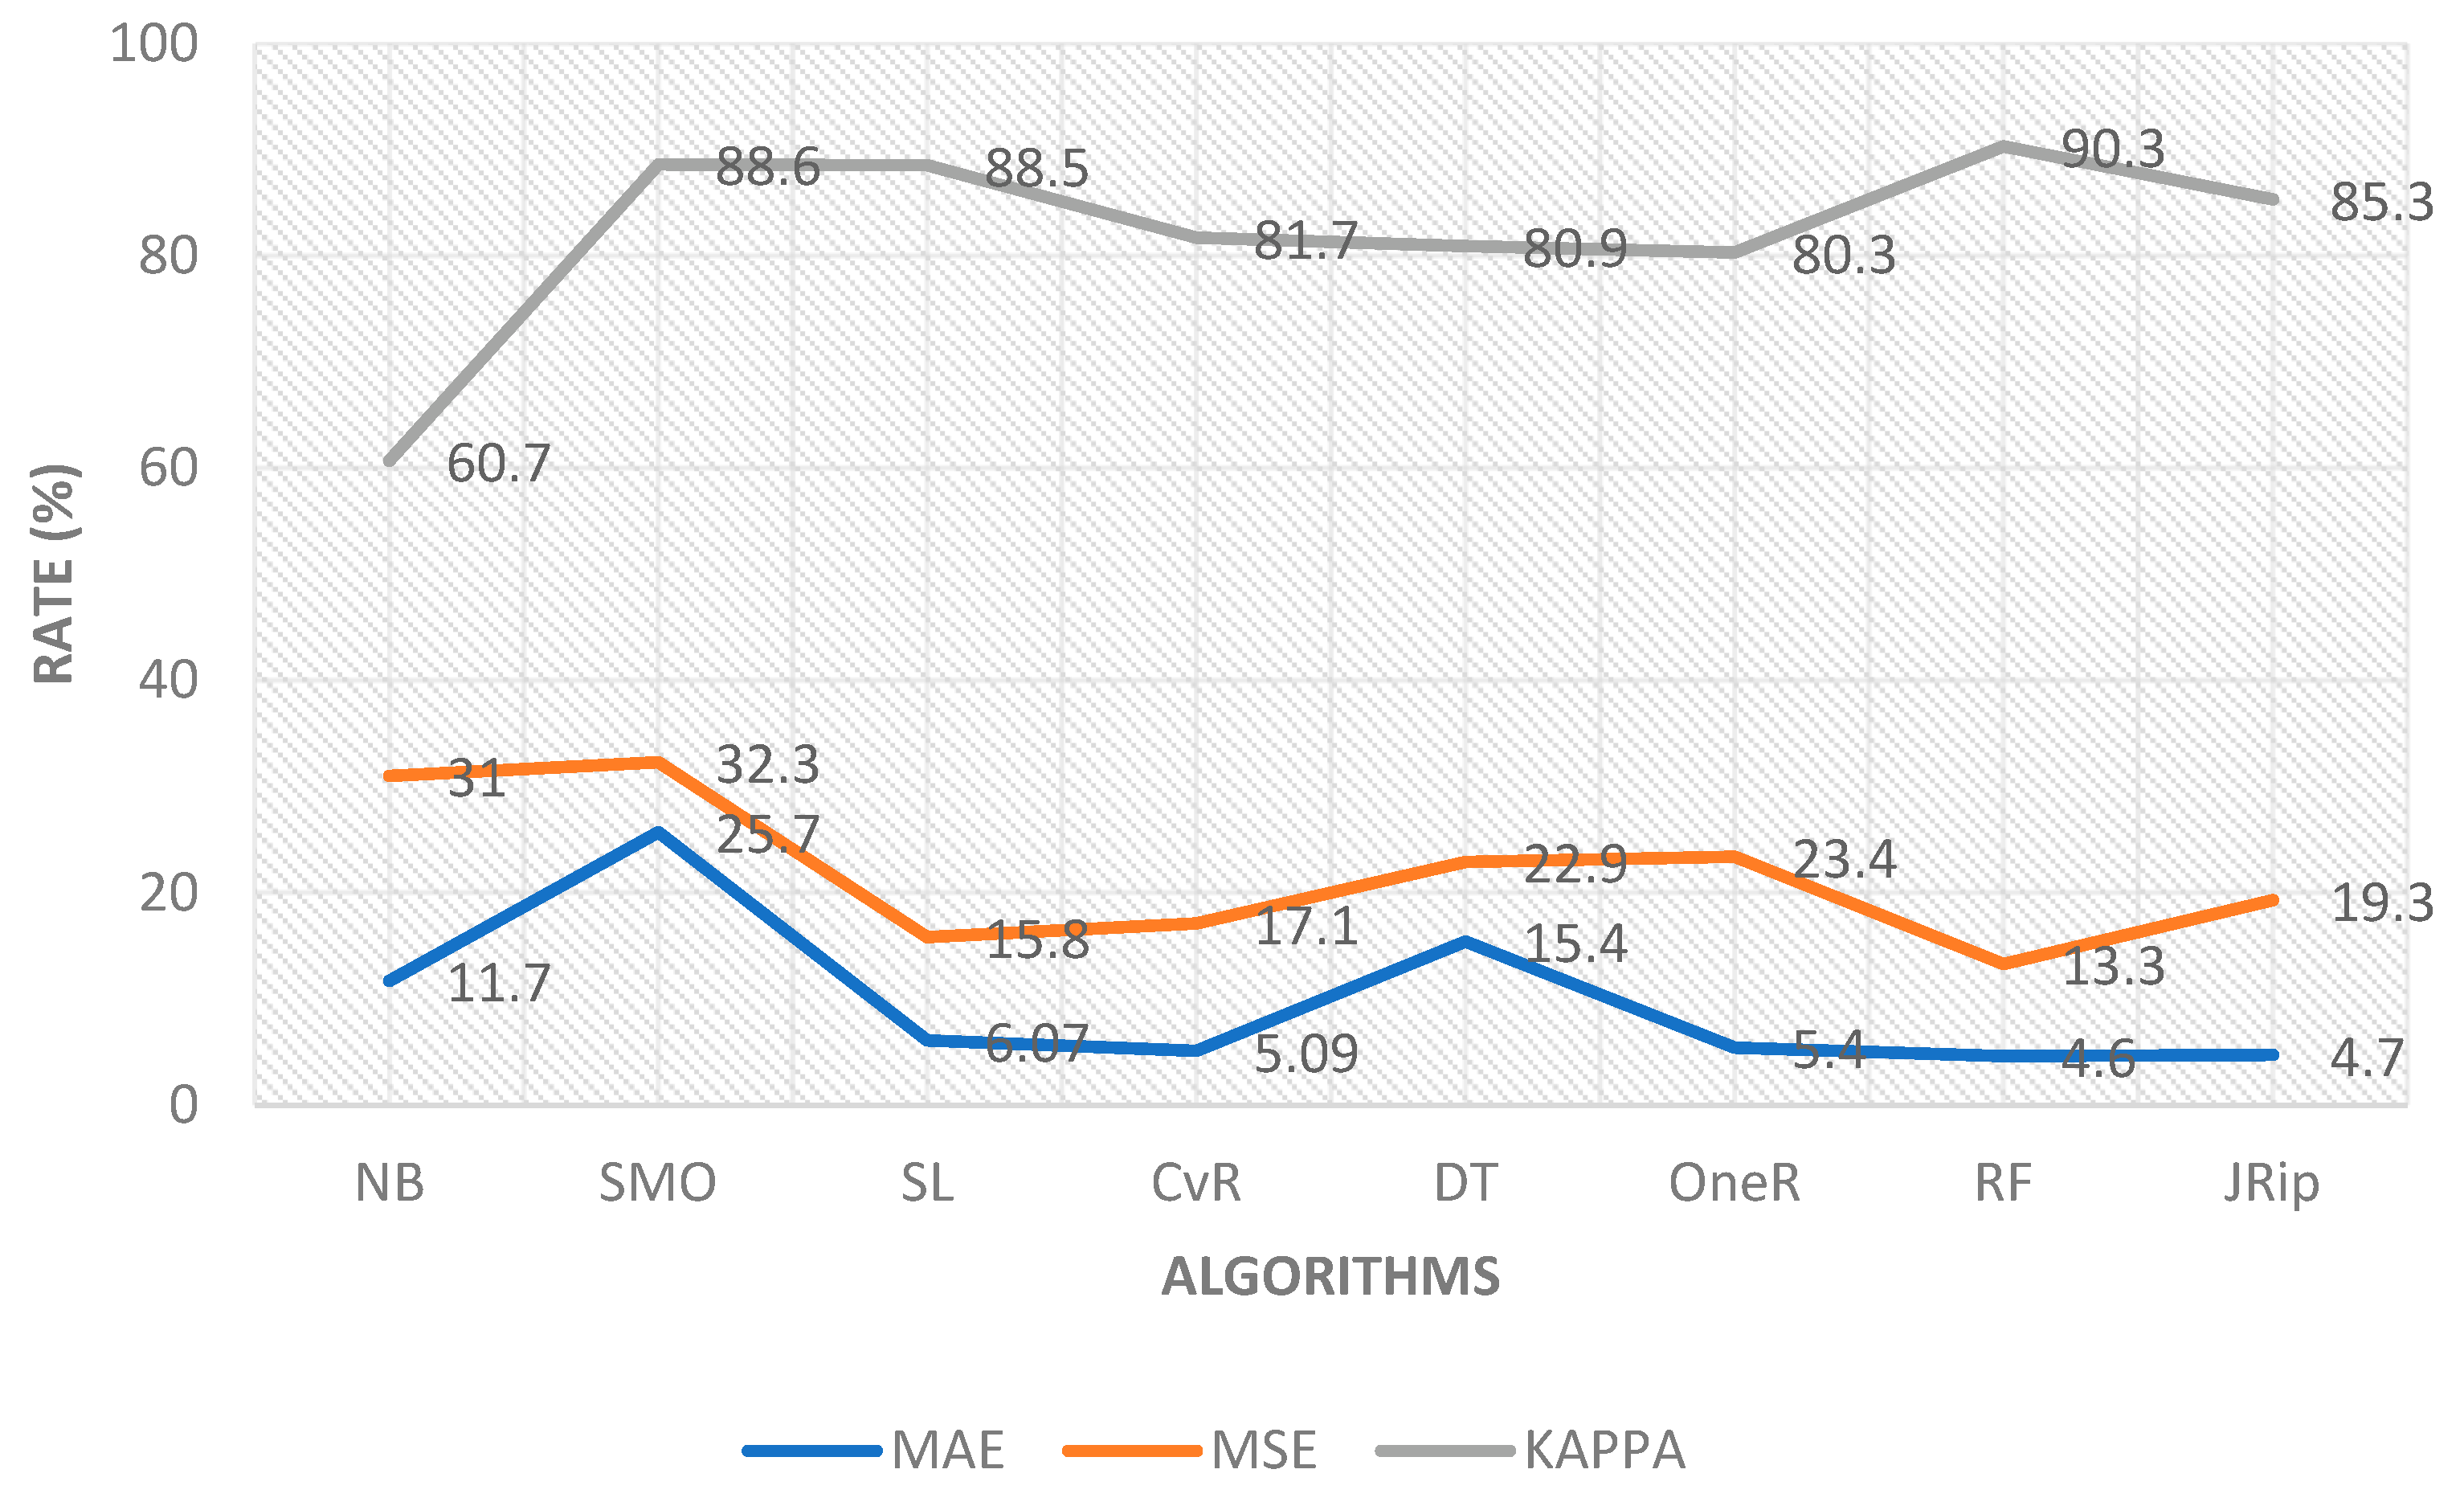
We analyzed and compared the different classification calculations of this study. We can observe that the accuracy, precision, recall, and F1-score obtained by random forest (95.0–95.5%) is better than NB, SMO, SL, CvR, DT, JRip, and OneR. It is also simple to see that RF presents the uppermost value of correctly classified instances and a training time of 0.11 s. In the wake of picking the RF as the anticipated model, we can now investigate the outcomes acquired by assessing the efficiency of our proposed algorithms. Moreover, Table 5 displays that RF achieved the maximum accuracy, precision, recall, and F1-score compared to other advanced algorithms. Additionally, the RF algorithm presents the lowest MSE and MAE rates, as shown in Figure 12.
From these outcomes, we can infer that random forest (RF) has outflanked the other algorithms in this study.

4.3. Comparison to Previous Work

Several researchers proposed valuable approaches in the field of diabetes prediction in different ways. Some of them are based on clinical results of diabetes, and some of them are proposed for any specific area or specific situation. Although, our proposed work is generic and based on the genetic information of humans, which is unique information and cannot be denied at any point.
We approve our model utilizing precision, recall, accuracy, and F1-score. At the same time, different approaches use different evaluation parameters to validate their results. Some of them are specificity, sensitivity, AROC (area under the receiver operating characteristic curve), and MCC (Matthews correlation coefficient), including accuracy, precision, and recall [1,2,14,19,20].
Sensitivity [13] is the proportion of positive diabetes cases predicted positively.
Sensitivity = TP TP + FN
Specificity [13] specifies correctly the negative diabetes cases that were predicted correctly, whereas AROC is plotted between TP and FP rates for discrete cutoff points of a variable.
Specificity = TN TN + FP
MCC is a correspondence coefficient between the predicted classification and the actual classification [3].
MCC = TP × TN FN × FP TP + FN × TN + FP × TP + FP × TN + FN
To compare our methods with previous research work, we evaluate our method by using the same evaluation parameters as previous research works. Table 7 displays our proposed model’s outcomes according to the performance of the abovementioned metrics.
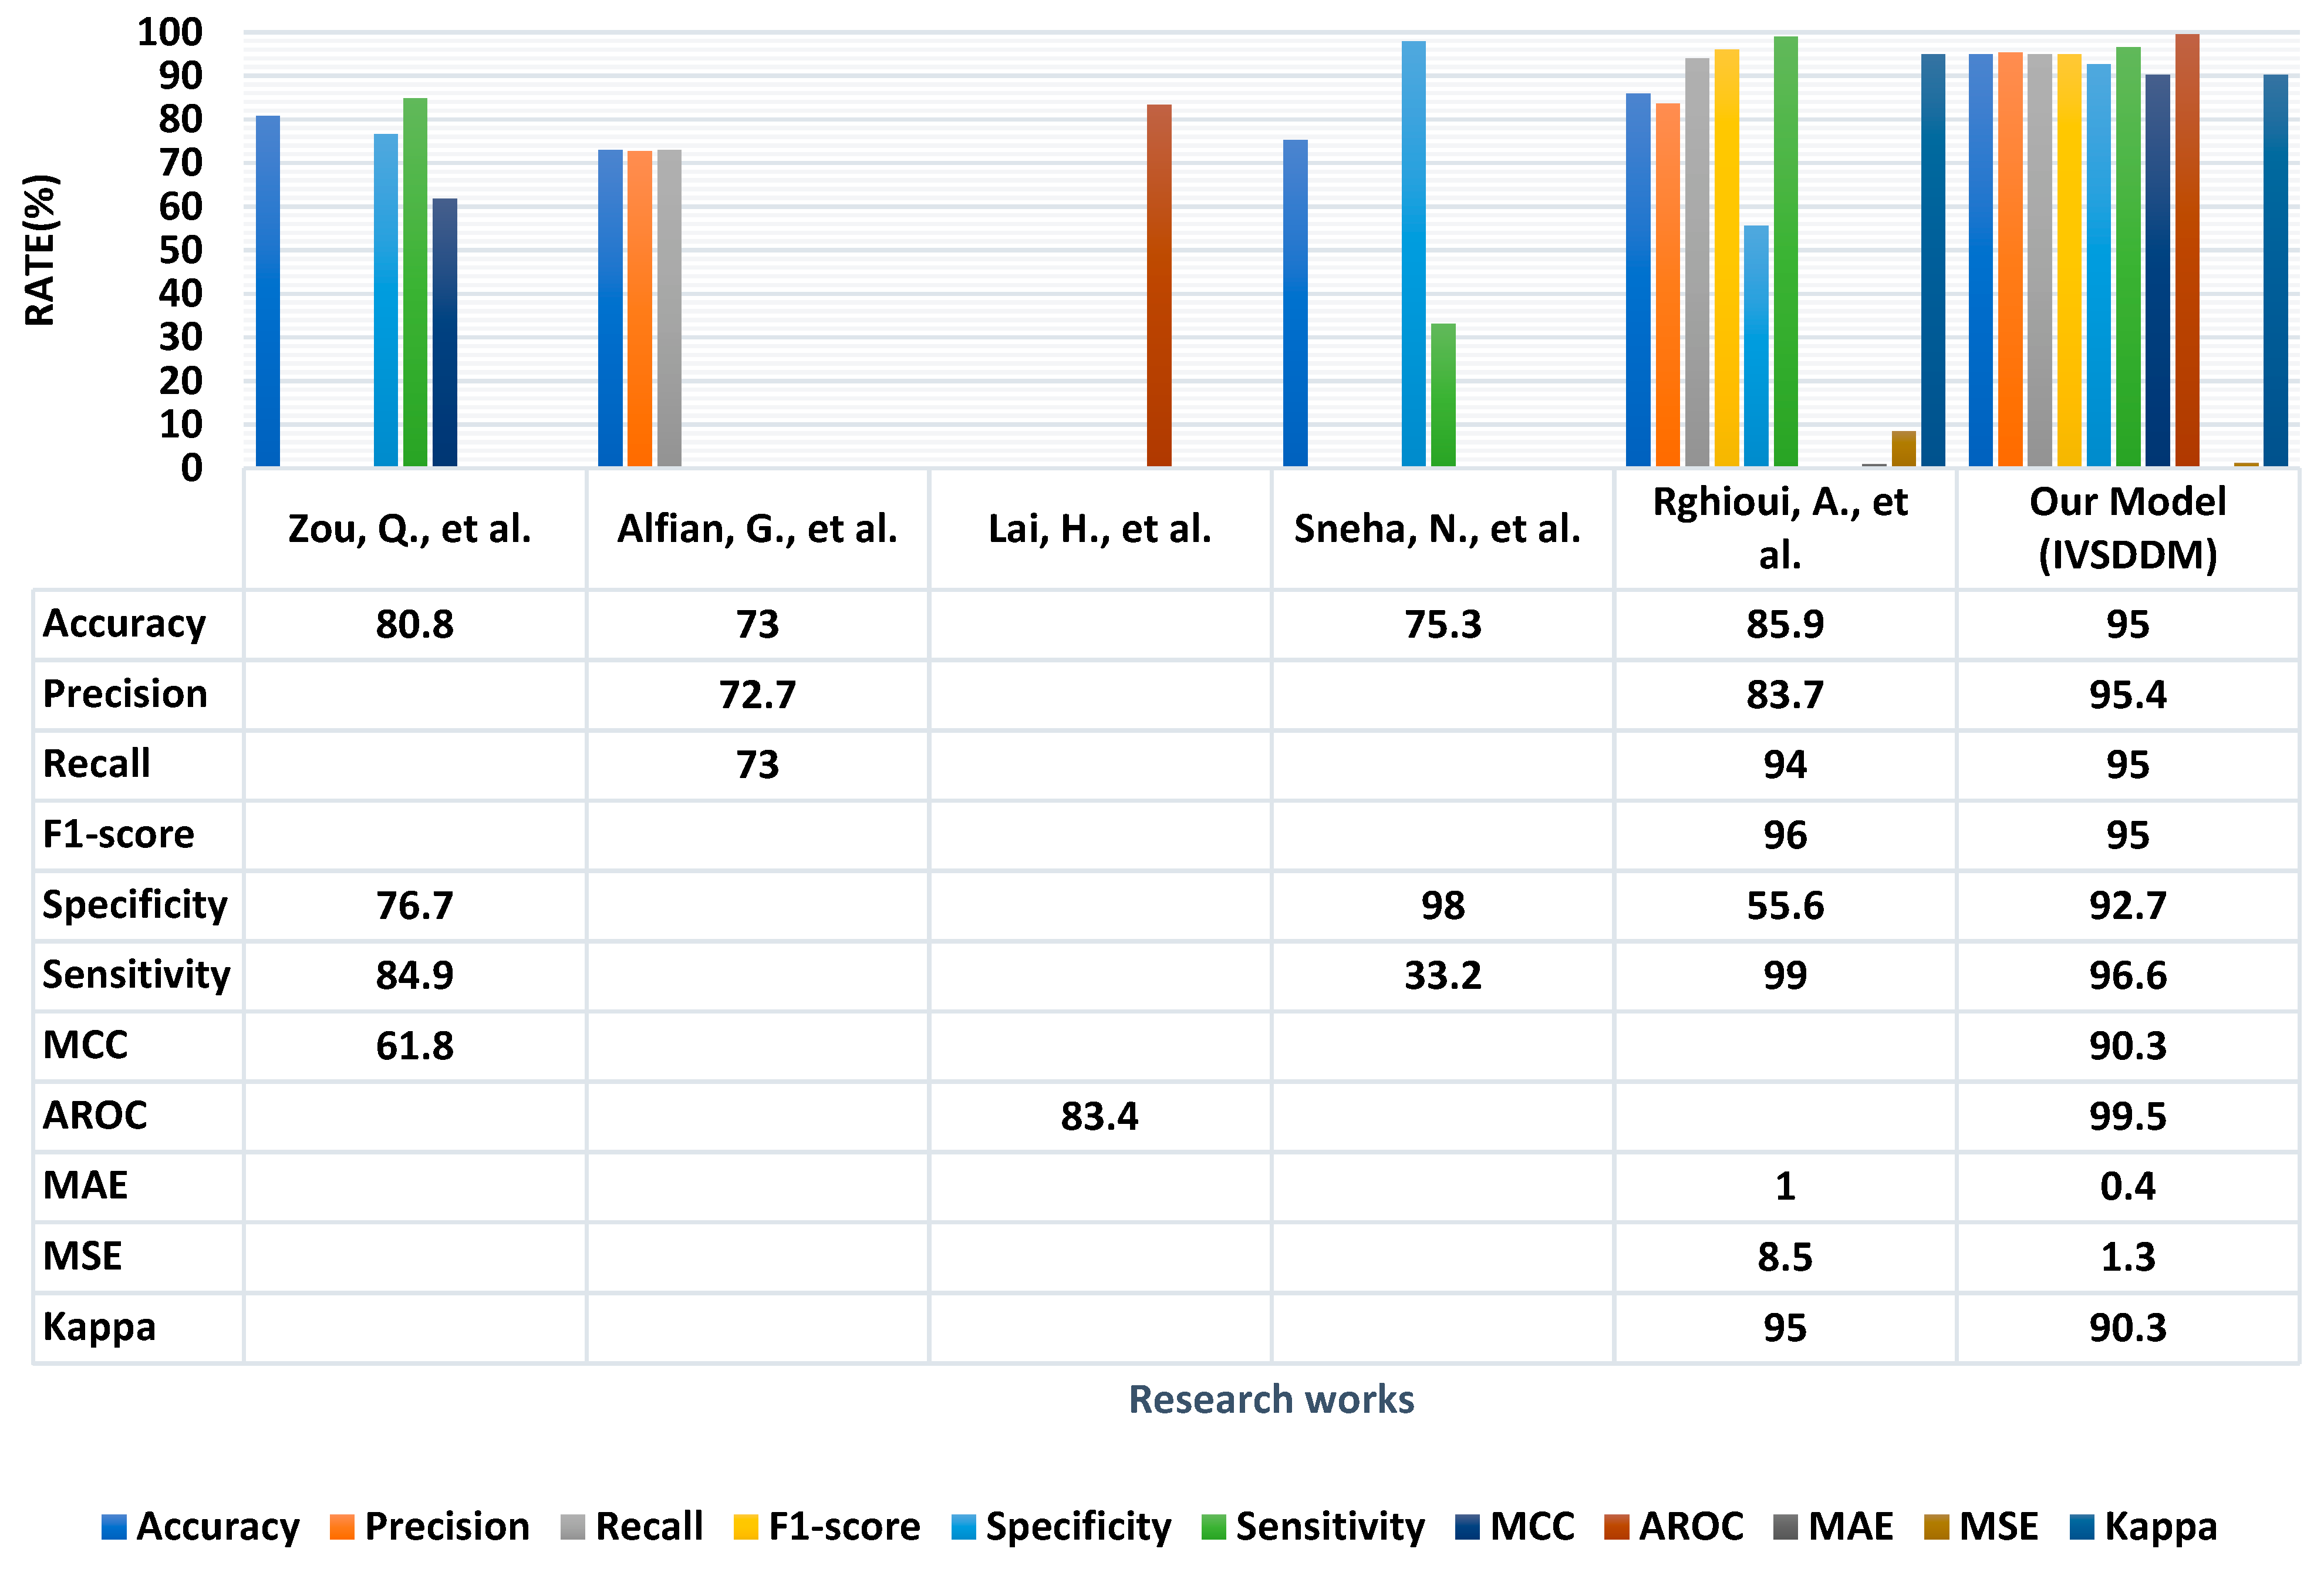
This shows that random forest performs best in all performance matrices and behaves as a perfect classifier for diabetes prediction. However, most previous methods use two or three evaluation parameters [3], such as those that achieved an accuracy of up to 80.8%, specificity of up to 76.7%, sensitivity of up to 84.9%, and MCC of up to 61.8%. Ref. [13] was evaluated based on accuracy that was 85.9%, precision 83.7%, recall 99.7%, F1-score 99.7%, specificity 55.6%, sensitivity 99%, MAE 1%, MSE 8.5%, kappa 97.7%. Ref. [19] used accuracy that was 73.0%, precision at 72.7%, and recall at 73%. Ref. [20] has an area under the ROC curve (AROC) up to 83.4%. Ref. [21] achieved accuracy up to 75.3%, specificity up to 98%, and sensitivity up to 33.2%. Comparing all these evaluation parameters with our evaluated methods, it is evident that our methods outperform by having an average accuracy of 95%. The comparison of our method with previous methods is shown in Figure 13.
This proposed work provides a novel approach to solving human health problems efficiently.

5. Conclusions and Future Work

Diabetes is a chronic disease escalating daily and requires 24/7 continuous management. Recent advancements in VANET, alongside novel wearable biosensors, give constant observation of a patient’s condition and offer another point of view on diabetes management. In this study, the recent literature was observed and reviewed concerning early detection and real-time monitoring of diabetes. This work proposes a novel approach to the health care of drivers’ diabetes monitoring using wearable sensors, machine learning, and VANET technology. Several machine learning (ML) algorithms assessed the proposed prediction model for diabetes using the cross-validation method. Performance metrics precision, recall, accuracy, F1-score, sensitivity, specificity, MCC, and AROC are used to validate our method. The result shows random forest (RF) outperforms and achieves the highest accuracy compared to other algorithms and previous approaches ranging from 90.3% to 99.5%. The proposed system suggested ways to reduce the risk of vehicle crashes among individuals with diabetes by providing infrastructure for real-time monitoring of diabetes through wearable sensors and VANET.
In the future, proper modeling techniques, i.e., routing protocols, data transmission, data processing, and data security, are essential for designing consistent communication in a VANET environment. Moreover, we need additional and more accurate genetic-based features other than gene sequences to predict diabetes or any particular disease, which will enhance the performance of the proposed system in absolute value. In future work, we will upgrade our proposed framework by improving the proficiency and accuracy of real-time analyzed data using our proposed architecture. Our approach will serve as knowledge in other advanced fields, such as precision medicine and the internet of bio-nano things, showing potential in healthcare and technology for better health and disease management.

Author Contributions

Conceptualization, methodology R.S. and Y.S.; methodology, A.A., H.A., and Y.S.; software, H.A.; validation, R.A., R.S. and A.A.; formal analysis, H.A. and H.J.; investigation, A.A.; resources, A.M. and Y.S.; data curation, Y.S.; writing—original draft preparation, R.S.; writing—review and editing, A.A.; visualization, Y.S. and A.M.; supervision, R.A. and Y.S.; project administration, H.A., H.J. and R.A.; funding acquisition, A.M. and A.A. All authors have read and agreed to the published version of the manuscript.

Funding

Princess Nourah bint Abdulrahman University Researchers Supporting Project number (PNURSP2023R323), Princess Nourah bint Abdulrahman University, Riyadh, Saudi Arabia.

Institutional Review Board Statement

Not applicable.

Informed Consent Statement

Not applicable.

Data Availability Statement

Not applicable.

Conflicts of Interest

The authors declare that there are no conflict of interest regarding the publication of this paper.

References

  1. King, H.; Aubert, R.E.; Herman, W.H. Global burden of diabetes, 1995–2025: Prevalence, numerical estimates, and projections. Diabetes Care 1998, 21, 1414–1431. [Google Scholar] [CrossRef]
  2. Shaw, J.E.; Sicree, R.A.; Zimmet, P.Z. Global estimates of the prevalence of diabetes for 2010 and 2030. Diabetes Res. Clin. Pract. 2010, 87, 4–14. [Google Scholar] [CrossRef]
  3. Zou, Q.; Qu, K.; Luo, Y.; Yin, D.; Ju, Y.; Tang, H. Predicting diabetes mellitus with machine learning techniques. Front. Genet. 2018, 515, 00515. [Google Scholar] [CrossRef] [PubMed]
  4. Clarke, S.F.; Foster, J.R. A history of blood glucose meters and their role in self-monitoring of diabetes mellitus. Br. J. Biomed. Sci. 2012, 69, 83–93. [Google Scholar] [CrossRef] [PubMed]
  5. Garg, S.K.; Potts, R.O.; Ackerman, N.R.; Fermi, S.J.; Tamada, J.A.; Chase, H.P. Correlation of fingerstick blood glucose measurements with GlucoWatch biographer glucose results in young subjects with type 1 diabetes. Diabetes Care 1999, 22, 1708–1714. [Google Scholar] [CrossRef] [PubMed]
  6. Petrosyan, L.; Ghazaryan, Z.; Muradyan, G.; Aghajanova, E.; Brabece, M.; Žďárská, D.J.; Halčiakova, K.; Polák, J.; Frier, B.M.; Brož, J. Limited knowledge of safe driving practice among drivers with diabetes in Armenia: Association with greater risk of motor vehicle accidents. J. Diabetes Mellit. 2019, 9, 14. [Google Scholar] [CrossRef] [Green Version]
  7. Keten, A. Diabetes and driving safety. Accid. Anal. Prev. 2021, 149, 105854. [Google Scholar] [CrossRef] [PubMed]
  8. Potter, K.; Virtanen, H.; Stewart, F.; Luca, P.; Ho, J.; Nettel-Aguirre, A.; Pacaud, D. Exploring knowledge and safety practices for driving in youth with type 1 diabetes. Can. J. Diabetes 2020, 44, 169–174. [Google Scholar] [CrossRef]
  9. Cooper, C.; Franklin, D.; Ros, M.; Safaei, F.; Abolhasan, M. A comparative survey of VANET clustering techniques. IEEE Commun. Surv. Tutor. 2016, 19, 657–681. [Google Scholar] [CrossRef]
  10. Da Cunha, F.D.; Boukerche, A.; Villas, L.; Viana, A.C.; Loureiro, A.A. Data Communication in VANETs: A Survey, Challenges and Applications. Ph.D. Thesis, University of Bordeaux, Bordeaux, France, INRIA Saclay, Bordeaux, France, 2014. [Google Scholar]
  11. Shah, S.S.; Malik, A.W.; Rahman, A.U.; Iqbal, S.; Khan, S.U. Time barrier-based emergency message dissemination in vehicular ad-hoc networks. IEEE Access 2019, 7, 16494–16503. [Google Scholar] [CrossRef]
  12. Kavakiotis, I.; Tsave, O.; Salifoglou, A.; Maglaveras, N.; Vlahavas, I.; Chouvarda, I. Machine learning and data mining methods in diabetes research. Comput. Struct. Biotechnol. J. 2017, 15, 104–116. [Google Scholar] [CrossRef] [PubMed]
  13. Rghioui, A.; Lloret, J.; Sendra, S.; Oumnad, A. A smart architecture for diabetic patient monitoring using machine learning algorithms. Healthcare 2020, 8, 348. [Google Scholar] [CrossRef] [PubMed]
  14. Chen, M.; Yang, J.; Zhou, J.; Hao, Y.; Zhang, J.; Youn, C.H. 5G-smart diabetes: Toward personalized diabetes diagnosis with healthcare big data clouds. IEEE Commun. Mag. 2018, 56, 16–23. [Google Scholar] [CrossRef]
  15. Noshadi, H.; Giordano, E.; Hagopian, H.; Pau, G.; Gerla, M.; Sarrafzadeh, M. Remote medical monitoring through vehicular ad hoc network. In Proceedings of the 2008 IEEE 68th Vehicular Technology Conference, Calgary, AB, Canada, 21–24 September 2008; pp. 1–5. [Google Scholar]
  16. Songer, T.J.; Dorsey, R.R. High risk characteristics for motor vehicle crashes in persons with diabetes by age. Annu. Proc. Assoc. Adv. Automot. Med. 2006, 50, 335. [Google Scholar]
  17. Merickel, J.; High, R.; Smith, L.; Wichman, C.; Frankel, E.; Smits, K.; Drincic, A.; Desouza, C.; Gunaratne, P.; Ebe, K.; et al. Driving safety and real-time glucose monitoring in insulin-dependent diabetes. Int. J. Automot. Eng. 2019, 10, 34–40. [Google Scholar] [CrossRef] [Green Version]
  18. Chang, Y.H.; Hou, W.H.; Wu, K.F.; Li, C.Y.; Hsu, I.L. Risk of motorcycle collisions among patients with type 2 diabetes: A population-based cohort study with age and sex stratifications in Taiwan. Acta Diabetol. 2022, 59, 1625–1634. [Google Scholar] [CrossRef]
  19. Alfian, G.; Syafrudin, M.; Ijaz, M.F.; Syaekhoni, M.A.; Fitriyani, N.L.; Rhee, J. A personalized healthcare monitoring system for diabetic patients by utilizing BLE-based sensors and real-time data processing. Sensors 2018, 18, 2183. [Google Scholar] [CrossRef] [PubMed] [Green Version]
  20. Lai, H.; Huang, H.; Keshavjee, K.; Guergachi, A.; Gao, X. Predictive models for diabetes mellitus using machine learning techniques. BMC Endocr. Disord. 2019, 19, 101. [Google Scholar] [CrossRef] [PubMed] [Green Version]
  21. Sneha, N.; Gangil, T. Analysis of diabetes mellitus for early prediction using optimal features selection. J. Big Data 2019, 6, 13. [Google Scholar] [CrossRef]
  22. Sikandar, A.; Anwar, W.; Bajwa, U.I.; Wang, X.; Sikandar, M.; Yao, L.; Jiang, Z.L.; Chunkai, Z. Decision tree based approaches for detecting protein complex in protein protein interaction network (PPI) via link and sequence analysis. IEEE Access 2018, 6, 22108–22120. [Google Scholar] [CrossRef]
  23. Mabrouk, M.S. A study of the potential of EIIP mapping method in exon prediction using the frequency domain techniques. Am. J. Biomed. Eng. 2012, 2, 17–22. [Google Scholar] [CrossRef] [Green Version]
  24. Li, T.; Li, Q.; Zhu, S.; Ogihara, M. A survey on wavelet applications in data mining. ACM SIGKDD Explor. Newsl. 2002, 4, 49–68. [Google Scholar] [CrossRef]
  25. Polat, K.; Güneş, S. An expert system approach based on principal component analysis and adaptive neuro-fuzzy inference system to diagnosis of diabetes disease. Digit. Signal Process. 2007, 17, 702–710. [Google Scholar] [CrossRef]
  26. You, Y.; Cai, H.; Chen, J. Low rank representation and its application in bioinformatics. Curr. Bioinform. 2018, 13, 508–517. [Google Scholar] [CrossRef]
  27. Khan Academy. Available online: http://www.khanacademy.org/math/statistics-probability/summarizing-quantitative-data/variance-standard-deviation-population/a/calculating-standard-deviation-step-by-step/ (accessed on 12 August 2022).
  28. Corporate Finance Institute. Available online: http://www.corporatefinanceinstitute.com/resources/knowledge/finance/covariance/ (accessed on 12 August 2022).
  29. Math is Fun. Available online: http://www.mathsisfun.com/algebra/eigenvalue/ (accessed on 15 August 2022).
  30. Ur Rehman, S.; Khan, M.A.; Zia, T.A.; Zheng, L. Vehicular ad-hoc networks (VANETs)-an overview and challenges. J. Wirel. Netw. Commun. 2013, 3, 29–38. [Google Scholar]
  31. Hamdi, M.M.; Audah, L.; Rashid, S.A.; Mohammed, A.H.; Alani, S.; Mustafa, A.S. A review of applications, characteristics and challenges in vehicular ad hoc networks (VANETs). In Proceedings of the 2020 International Congress on Human-Computer Interaction, Optimization and Robotic Applications (HORA), Istanbul, Turkey, 26–27 June 2020; pp. 1–7. [Google Scholar]
  32. Wikipedia.org/wiki/Mean_squared_error. Available online: https://en.wikipedia.org/wiki/Mean_squared_error (accessed on 15 October 2022.).
  33. Statisticshowto.com/absolute-error. Available online: https://www.statisticshowto.com/absolute-error/ (accessed on 17 October 2022.).
  34. Towardsdatascience.com/cohens-kappa-9786ceceab58. Available online: https://towardsdatascience.com/cohens-kappa-9786ceceab58 (accessed on 25 October 2022).
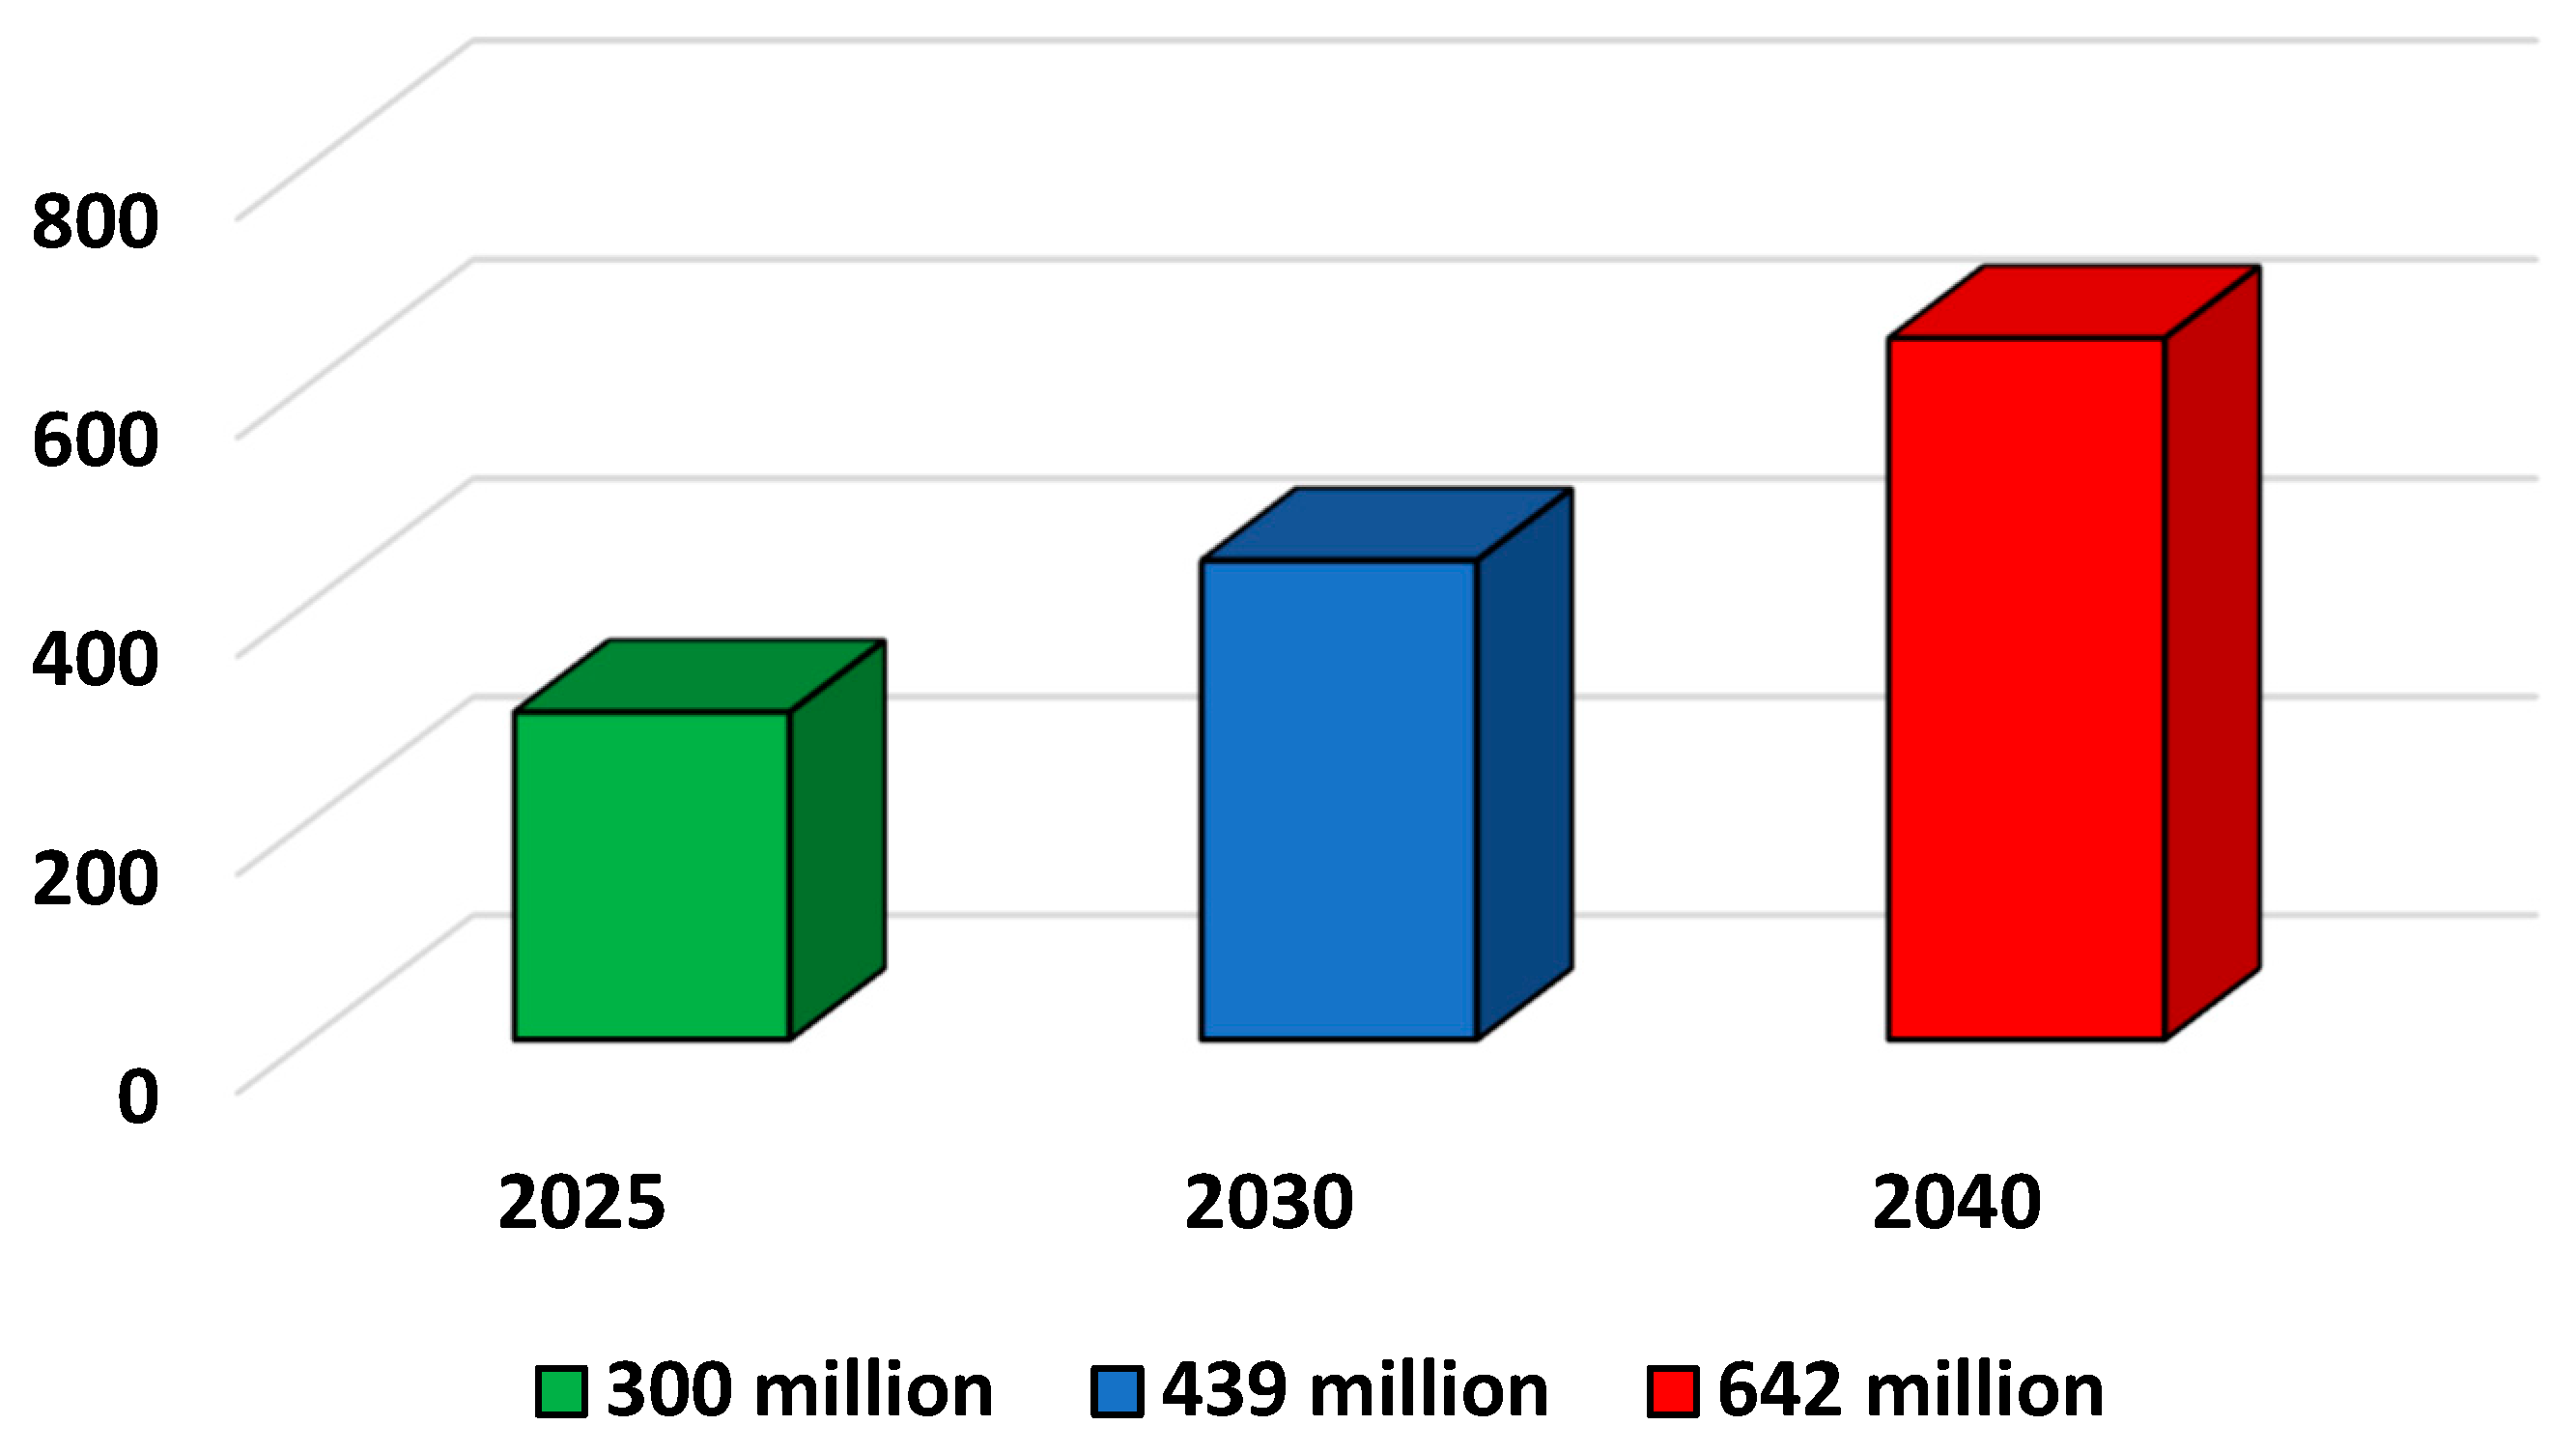
Figure 1. Estimate of expected diabetes cases year-wise.
Applsci 13 03326 g001
Figure 2. (a) Non-invasive abdomen sensor; (b) non-invasive arm sensor; (c) minimally invasive interstitial fluid transmitter glucose sensor.
Applsci 13 03326 g002
Figure 3. VANET environment with OBU, AU, message transferring, and data transfer.
Applsci 13 03326 g003
Figure 4. Proposed research methodology for diabetes prediction.
Applsci 13 03326 g004
Figure 5. Flow chart working on principal component analysis (PCA).
Applsci 13 03326 g005
Figure 6. Graph representation of the feature set: (a) Multiple genes responsible for a single disease; (b) involvement of similar genes in one or more diseases; (c) relation between multiple genes in selected diseases and normal human beings concerning extracted features for respective genes.
Applsci 13 03326 g006aApplsci 13 03326 g006b
Figure 7. A novel approach for the intelligent vehicular framework for drivers’ diabetic data processing.
Applsci 13 03326 g007
Figure 8. The training time of the algorithms.
Applsci 13 03326 g008
Figure 9. Rate of correctly classified instances and incorrectly classified instances.
Applsci 13 03326 g009
Figure 10. Performance results of TP and FP rate.
Applsci 13 03326 g010
Figure 11. Statistical comparison of performance measures of algorithms.
Applsci 13 03326 g011
Figure 12. Rates of MAE, MSE, and kappa.
Applsci 13 03326 g012
Figure 13. Comparison of the proposed model (IVSDDM) with previous research works [3,13,19,20,21].
Applsci 13 03326 g013
Table 1. Comparison of different machine learning algorithms for diabetes prediction.
PublicationCompared AlgorithmsParametersBest Accuracy
Zou Quan et al. [3]RF, J48, Neural NetworksAccuracy, Sensitivity, Specificity, MCCRandom Forest
Accuracy = 80.84%
Rghioui A., et al. [13]Naïve Bayes, J48, SMO, ZeroR, OneR, Simple Logistic, Random ForestAccuracy, Precision, Sensitivity, Specificity, Recall, F-measureSMO
Accuracy = 99.66%
Alfian G., et al. [19]Random Forest, Naïve Bayes, SVM, Logistic Regression, Multilayer PerceptronPrecision, Recall, AccuracyMultilayer Perceptron
Accuracy = 77.08%
Lai H. et al. [20]Logistic Regression, Gradient Boosting Machine, Random Forest, RPARTAROC, SensitivityLogistic Regression
Sensitivity = 73.4%
N. Sneha, et al. [21]Decision Tree, Naïve Bayes, Support Vector Machine, Random Forest, KNNAccuracy, Sensitivity, SpecificityNaïve Bayes
Accuracy = 82.30%
Table 2. Amino acids and respective EIIP values.
NameAlanineArginineAsparagineAspartic AcidCysteineGlutamineGlutamic acidGlycineHistidineIsoleucineLeucineLysineMethioninePhenylalanineProlineSerineThreonineTryptophanTyrosineValine
CodeARNDCQEGHILKMFPSTWYV
EIIP0.03730.09590.00360.12630.08290.07610.00580.00500.0242000.03710.08230.09460.01980.08290.09410.05480.05160.0057
Table 3. The feature set statistics.
Total number of instances (Genes)1030
List of attributes omitted (Features)104
Table 4. Simulation Setup in VANET.
ParametersValues
Simulator UsedNS-2.34
Network Area RangeHighway of 1400 m × 1400 m
Total Simulation Time350 ms
Nodes Density10, 20, 30, 40, 50, 60, 70, 80
Transmission Range Among Vehicles260 m
Number of Vehicles0, 10, 20, 30, 40, 50, 60, 70, 80, 90, 100
Number of RSUs 10 (1 per 10 vehicles)
Network ConnectivityWi-Fi
Table 5. Training time and accuracy level of the algorithms.
AlgorithmsTraining Time (s)Correctly Classified Instances (%)Incorrectly Classified Instances (%)FP Rate (%)TP Rate (%)
Naïve Bayes0.1177.669922.330111.577.7
SMO4.5393.98066.01946.194.0
Simple Logistic7.8993.98066.01947.194.0
Classification via Regression4.5389.805810.19424.089.8
Decision Table4.7790.010.09.590.0
OneR0.9789.029110.97094.789.0
Random Forest0.1195.04854.95158.595.0
JRip3.0677.669922.33016.092.1
Table 6. The performance comparison of the classifiers for diabetes classification.
AlgorithmsAccuracy (%)Precision (%)Recall (%)F-Measure (%)MSEMAEKAPPA
Naïve Bayes77.682.577.778.831.011.760.7
SMO93.993.994.093.932.325.788.6
Simple Logistic93.994.094.093.915.86.0788.5
CvR89.892.289.890.317.15.0981.7
Decision Table90.090.490.089.922.915.480.9
OneR89.091.489.089.523.405.480.3
Random Forest95.095.495.095.013.304.690.3
JRip92.192.292.192.119.304.785.3
Table 7. Performance comparison of the proposed model with different performance metrics.
AlgorithmsSensitivity (%)Specificity (%)MCC (%)AROC (%)
Naïve Bayes83.969.864.591.5
SMO95.991.288.794.1
Simple Logistic95.991.288.697.8
Classification via Regression92.985.483.598.1
Decision Table93.185.782.096.0
OneR92.484.382.192.2
Random Forest96.692.790.399.5
JRip94.688.686.093.6
Disclaimer/Publisher’s Note: The statements, opinions and data contained in all publications are solely those of the individual author(s) and contributor(s) and not of MDPI and/or the editor(s). MDPI and/or the editor(s) disclaim responsibility for any injury to people or property resulting from any ideas, methods, instructions or products referred to in the content.