Article

Numerical Study on the Coupling Effect on a Retaining Structure of a Complex Deep Foundation Pit Group Excavation in a Soft-Soil Area

1
Nanjing Urban Construction Tunnel and Bridge Wisdom Management Co., Ltd., Nanjing 210017, China
2
School of Transportation, Southeast University, Nanjing 210096, China
3
Institute of Geotechnical Engineering (Institute of Future Underground Space), Nanjing 210096, China
4
Southwest Municipal Engineering Design & Research Institute of China Co., Ltd., Chengdu 610225, China
*
Authors to whom correspondence should be addressed.
Appl. Sci. 2023, 13(5), 3263; https://doi.org/10.3390/app13053263
Submission received: 5 December 2022 / Revised: 10 January 2023 / Accepted: 1 March 2023 / Published: 3 March 2023
(This article belongs to the Special Issue Advances in Sustainable Geotechnical Engineering)

Abstract

:
Based on the complex deep foundation pit group process of the Huimin Avenue Comprehensive Reconstruction Project in Nanjing, the finite element numerical simulation method is used to analyze the deformation characteristics of the retaining structure and the coupling effect between foundation pits during the whole process of excavation and support construction of the complex foundation pit group. Meanwhile, the differences in the deformation characteristics and coupling effects of the retaining structure under different construction time sequence schemes of the foundation pit group are studied. Finally, some suggestions are put forward for the monitoring and construction in this project, which provides a reference case for the design and construction of similar foundation pit groups.

1. Introduction

With the acceleration of urbanization, the pace of urban construction is becoming tighter and tighter, and the construction of underground space is gradually becoming an important development direction of urban infrastructure construction. In urban core areas, a large number of underground buildings, such as subway stations, underground commercial complexes, and underground garages, are closely adjacent to each other or connected into a single monolithic structure, making the underground structure complex and variable, thus bringing many challenges to the underground construction [1,2,3,4,5,6]. The unified design and construction of the foundation pit group are becoming more and more common in urban underground construction [7,8,9]. Compared with a single foundation pit, the dewatering and excavation of different pits in the construction of a foundation pit group will cause multiple consolidation settlements and unloading of the soil. Thus, the superposition of earth pressure and the deformation of the retaining structure will be greater, the construction period will be longer, and the space–time effect will be more significant. Complex foundation pit group construction often means the occurrence of excessive deformation and greater construction risk.
At present, many researchers have conducted extensive studies on the deformation of foundation pits and the influence of the surrounding environment [10,11,12,13,14]. Huang et al. proposed a new analytical solution for surface settlement of deep foundation pits, which considered the differences in loading and unloading the modulus of the soil, and verified the practicality and feasibility of the calculation model by comparing the calculation results with the monitoring results [15]. Tan et al. compared the deformation characteristics of the normal method, the top-down method, and the semi-top-down method in foundation pit engineering through field monitoring data and found that the rigid floor slab poured by the semi-top-down method can restrain the displacement of the wall and the ground, as well as the lifting of the support. The lateral displacement caused by the semi-top-down construction method is much smaller than that caused by the normal construction method and the top-down construction method. The semi-top-down construction method is applicable to excavation in crowded urban environments [16]. Feng et al. used numerical simulation to study the characteristics of the excavation behavior of the foundation pit by applying the prestressed support (IPS) earth retention system, and found that the IPS earth retention system can effectively reduce the lateral displacement of the foundation pit. The control of deformation was more obvious by reducing the thickness of layered excavation than by adjusting the excavation sequence [17]. Wang et al. investigated the stress and deformation characteristics of a composite soil nailing wall and an anchored soldier pile wall combined retaining system. The study showed that the location of the bending moment extremes of the retaining piles was located near the excavation surface. Increasing the stiffness or burial depth of retaining piles or the pre-stressing of anchor piles can effectively control the lateral displacement of excavation, but the effect is not obvious after exceeding a certain range [18]. Yang et al. studied the deformation law of a subway station foundation pit in a soft-soil area using a diaphragm wall and a multi-support system, and found that the method of excavation in sections and layers can effectively control the deformation of foundation pit support structure and reduce the impact on surrounding buildings. Increasing the insertion ratio of the diaphragm wall can reduce the maximum horizontal displacement, but when the insertion ratio is greater than 0.9, the influence of the insertion ratio on the horizontal displacement is very small [19]. Dan and Sahu [20] proposed an evaluation method based on the minimum potential energy method to predict the deformation of the ground and the deflection of the support wall within the influence zone of the foundation pit excavation, and the comparison with the measured data was in good agreement. Zhou et al. conducted back analysis on the permeability coefficient of the soil layer based on the on-site pumping test, and simulated the dewatering of the foundation pit using the three-dimensional finite difference method. The results showed that the settlement amplitude of aquifer soil decreases with the increase in the depth of the diaphragm wall. The maximum ground settlement outside the foundation pit can be reduced by optimizing the drainage scheme [21].
This study analyzes the interaction and the complex deformation mechanism of each foundation pit excavation, relying on the complex deep foundation pit group of the Huimin Avenue Comprehensive Reconstruction Project in Nanjing. The foundation pit group project is part of an underground interchange construction project. Due to the complexity of the underground ramp and numerous connection interfaces, the excavation depths of different pits of the foundation pit group are different. In addition, the project site is located in the flood plain area of the Yangtze River, where mucky silty clay is widely distributed and the groundwater level is high, which greatly increases the difficulty of deformation control of foundation pit groups. In order to ensure safety, the excavation is divided into six foundation pits that belong to three construction stages. Due to the large excavation area and the deep distribution of soft soil, multiple excavation unloading will have superimposed effects on each pit. Therefore, a complete 3D finite element model is established and the supporting axial force and deformation characteristics of the foundation pit group during the construction process is studied. In addition, the effects of different construction sequences on the deformation of the retaining structure and the supporting axial force are simulated and analyzed. Deformation control measures for the design and construction of the foundation pit group are proposed.

2. Project Overview

2.1. Project Description

The Huimin Avenue Comprehensive Reconstruction Project is located in Gulou District, Nanjing. The project starts from the intersection of Huimin Avenue and Xinxing Road in the south and ends at the intersection of Huimin Avenue and Chenghe Road in the north, with a length of about 2.37 km. The utility tunnel along the whole road is about 1.99 km long. The project mainly includes the reconstruction of the Huimin Avenue viaduct into a two-way six-lane tunnel, the underground interchange ramp of Huimin Avenue, the river crossing channel of Jianning West Road, and the Huimin Avenue utility tunnel. The width range of the foundation pit group is 13.5–55.6 m, the excavation depth is 20.72–29.88 m, and the total perimeter of foundation pit is about 1600 m. A satellite image is shown in Figure 1.
It can be seen from the Figure 1 that the foundation pit group is irregular in shape, similar to an “oil gun”, and there is a small non-excavated area in the middle of the foundation pit group, which increases the construction difficulty. Due to the large traffic flow and the limited construction space, the staged construction technology is adopted to reduce the impact on traffic and nearby buildings and to ensure the safety of the foundation pit itself. The foundation pit group is divided into six independent pits: Pit A, Pit B, Pit C, Pit D, Pit E, and Pit F. Each pit shares a diaphragm wall with the adjacent pit. It should be noted that a pit-in-pit exists in Pit B, Pit C, and Pit D, and the relative depth of the small pit-in-pit is 2.9–8.0 m. In order to reduce the mutual influence during the construction of foundation pit group, it is proposed to arrange six foundation pits into three construction stages. The first construction stage includes the excavation of Pit A. In the second construction stage, Pits B and C are constructed, and the final construction stage involves the excavation of Pits D, E, and F.

2.2. Site Description

Before the design of the foundation pit, a series of laboratory and field tests were carried out, including the physical and mechanical parameters analysis, oedometer tests, direct shear tests, triaxial compression tests, and static cone penetration tests. The test results and the comprehensive analysis were written into the geological survey report. The landform of the project is the Yangtze River floodplain and the construction site is generally flat. The shallow layer of the site is mainly artificial fill, and the subsoil is composed of Quaternary sediments, which are divided into several sublayers. The mucky silty clay and the clayey silt are considered as the water-resisting floor. The soil layer within 70 m below the surface mainly includes miscellaneous fill, plain fill, mucky silty clay, clayey silt, fine silty sand, and limestone from shallow to deep. Table 1 shows the main physical and mechanical parameters of the soil layers. According to local hydrogeological data, the annual variation in the groundwater level is about 1.5 m, which is mainly affected by rainfall, surface evaporation, and the Yangtze River (about 600 m away). The burial depth of the highest water level in the site in the past 3–5 years is 0.5 m.

2.3. Retaining Structure and Construction Process

The foundation pit group adopts the diaphragm wall and internal support as the retaining structure. The pit-in-pit in foundation Pits B, C, and D adopt the bored cast-in-place piles and mixing piles as the retaining structure and the water-sealing curtain. The base of the diaphragm wall is completely embedded in the rock, with a depth of 50–66 m and a thickness of 1.2 m or 1.5 m. The bored cast-in-place pile has a diameter of 1 m and the clear spacing is 200 mm, with a depth of 10–12 m. Internal support includes cast-in-place concrete support and steel pipe support. The safety grade of the foundation pit group is of grade I according to the Chinese technical specification for retaining and protection of building foundation excavations (JGJ120–2012). The construction sequence is from Stage 1 to Stage 3, dewatering must be conducted before excavation in each pit, and the water level must be kept 1 m below the pit bottom. After excavation, the internal supports (including the concrete supports and the steel pipe supports) must be installed in time. After excavation to the bottom of the pit, the concrete cushion must be cast in time.

3. Numerical Model

3.1. Finite Element Model

ABAQUS finite element software is used to simulate the whole construction process of the foundation pit group, and the corresponding numerical model is established considering the requirements of design and construction. Due to the complexity of construction and geological conditions, in order to balance the modeling and calculation efficiency, the following approaches are adopted: (a) simplify the characteristics of stratum distribution, keep each stratum horizontal, and adopt average thickness; (b) ignore the influence of interlayer soil and assume that all the stratum are homogeneous; (c) consider all soil layers as normally consolidated soil; (d) assume that the diaphragm wall, the support pile, the concrete cushion, and internal support are elastic.
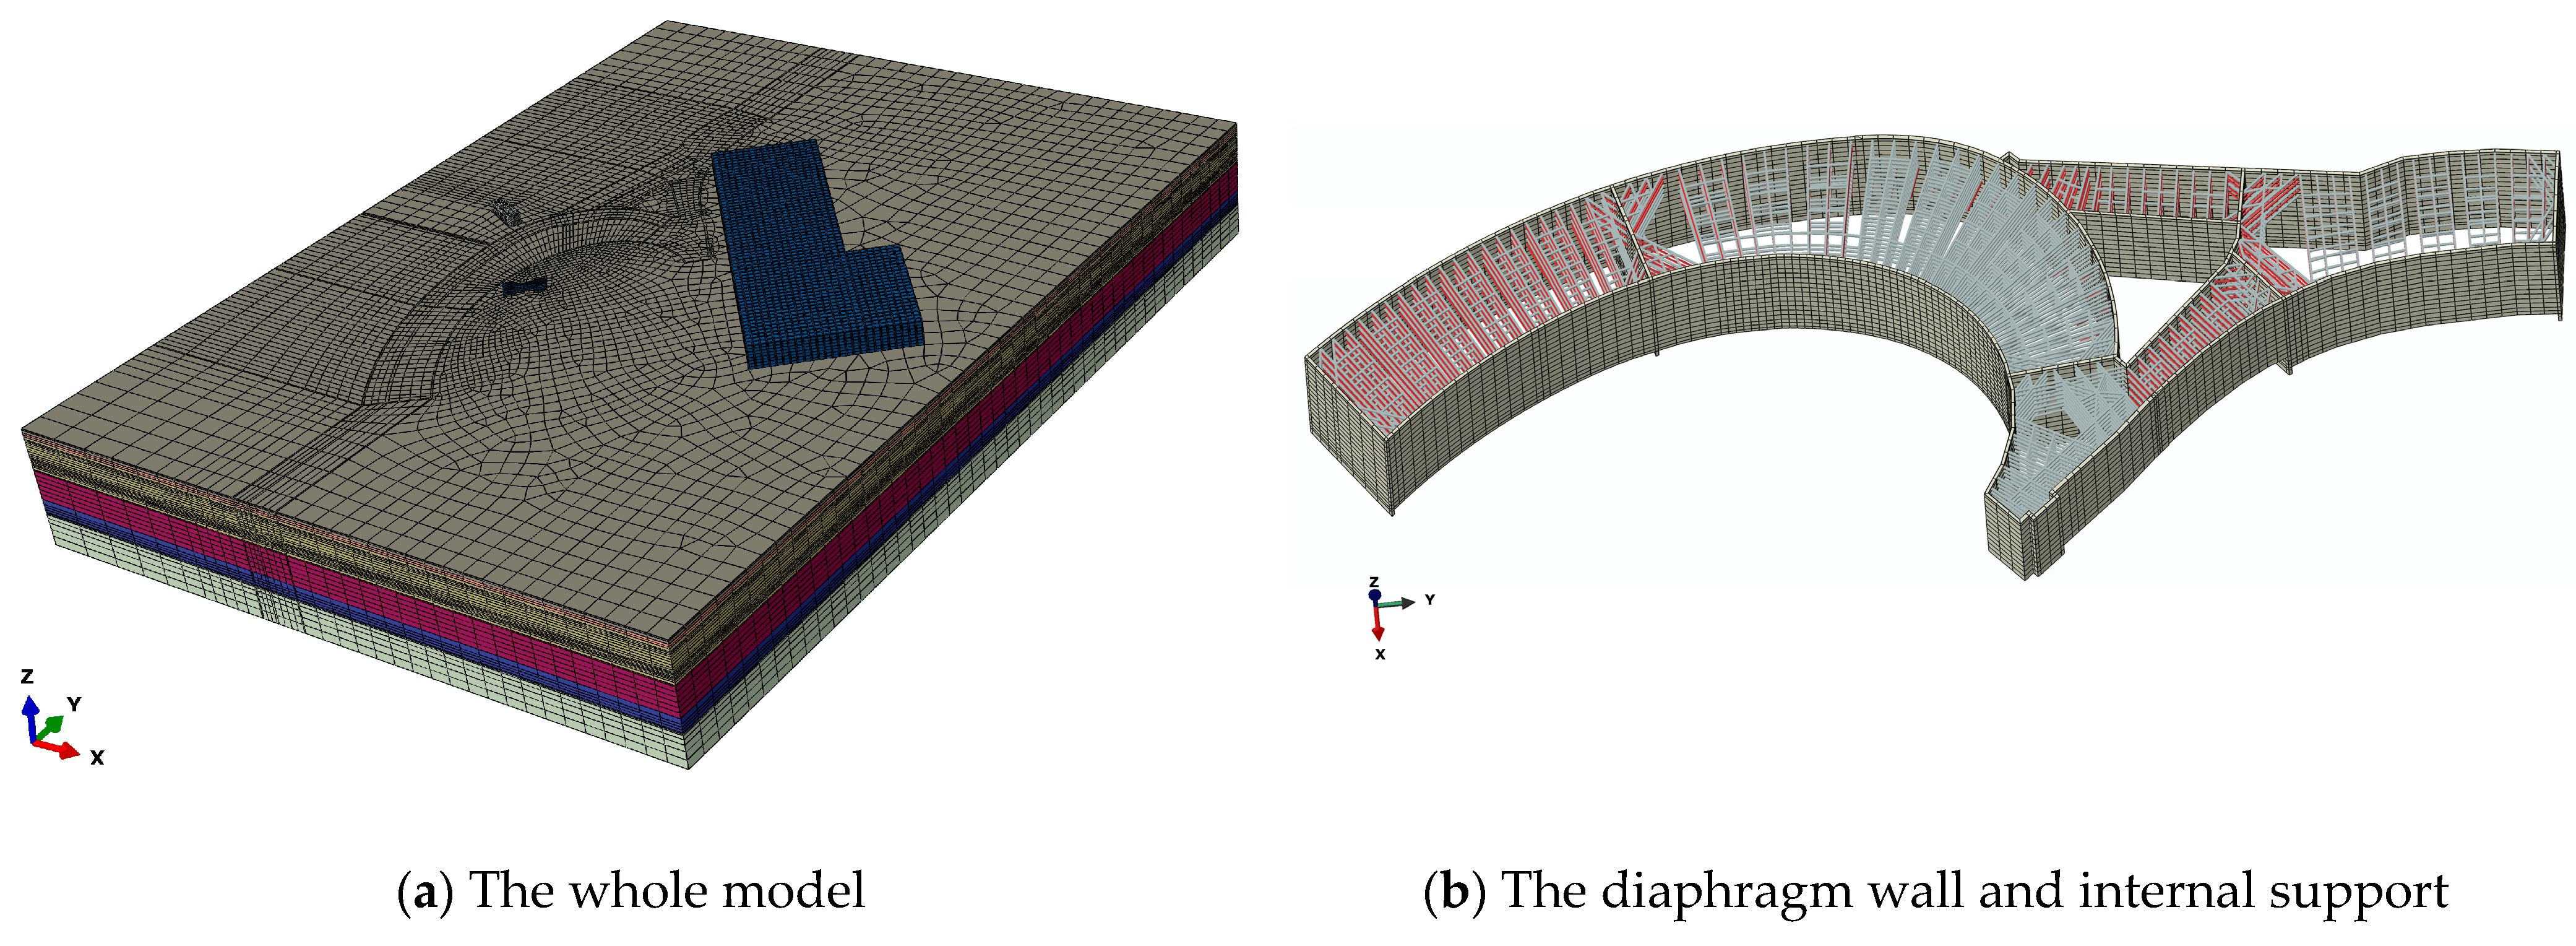
According to existing research results, the horizontal influence range of the foundation pit is 3–4 times the excavation length and width, and the influence range in the depth direction is 2–4 times the excavation depth. In order to minimize the boundary effect, the size of the 3D finite element model is determined to be 700 m × 520 m × 90 m. To balance the calculation accuracy and efficiency, the grid size is set to gradually increase from the foundation pit to the boundary of the calculation domain [22]. The side boundary of the calculation domain is set as a vertical displacement constraint, the bottom boundary is set as a fixed displacement constraint, and the top boundary remains free. In order to obtain more realistic simulation results, it is considered that the influence of dewatering on deformation development cannot be ignored. Therefore, the dewatering calculation is considered in the model, and eight nodes hexahedral element coupled pore water pressure (C3D8P) is adopted for the soil. Eight nodes hexahedral incompatible element (C3D8I) is adopted for the diaphragm wall to improve calculation accuracy. Beam unit (B31) is adopted for internal support [22]. The initial groundwater burial depth of the model is set as 1 m, the top boundary allows free drainage, and the sides are set as constant heads to simulate groundwater recharge. The 3D finite element model is shown in Figure 2.

3.2. Model Parameters

The nonlinear behavior of soil is realized by a modified Cam clay constitutive model (MCC), and the rock is realized by the Mohr-Coulomb constitutive model. The calculation parameters of the stratum are derived from the geological survey report, as shown in Table 2. Based on the principle of equivalent stiffness, the retaining pile is simplified to a diaphragm wall of corresponding thickness. The calculation parameters of the diaphragm wall, the retaining pile, the concrete cushion, and internal support are shown in Table 3.
In order to simulate the relative sliding between the diaphragm wall and the soil during the foundation pit construction, the contact interface is set between the wall and the soil. The interface is modelled by the Coulomb friction law. The interface friction is equal to the friction coefficient multiplied by the normal effective stress between two contact surfaces. The friction coefficient can be calculated by the interface friction angle and the interface friction angle can be evaluated by the friction angle of soil [23]. It is assumed that limiting shear displacement of 5 mm is used to realize the full adjustment of the interface friction [23]. The friction coefficient of the contact surface is estimated to be 0.3.

3.3. Construction Simulation

The construction simulation must be consistent with the actual construction process. First, calculate the geostress of the stratum to obtain the initial stress field and eliminate the displacement. Neglecting the construction impact of the diaphragm wall, the “wise in place” method is used to activate the diaphragm wall and the retaining pile; then, the construction simulation of the foundation pit group is carried out. The dewatering is simulated by setting a zero pore pressure at the level where the water table should be maintained, and the excavation is simulated by deactivating the soil element on the excavated side.
When the excavation reaches the target depth, the support must be activated, and the excavation and installation support must be conducted alternately until the excavation reaches the design pit bottom. It should be noted that when deactivating the soil element, the corresponding soil-wall contact pair must be deactivated, otherwise convergence problems will occur. The numerical modeling procedure is shown in Table 4.

4. Results and Discussion

4.1. Lateral Wall Deflection

Figure 3 shows the deformation contour image of the diaphragm wall after each stage of excavation. It can be seen that the adjacent pit excavation has different effects on the deformation of the diaphragm wall at different positions of the excavated pit. Subsequent excavation will increase or reduce the existing deformation of the diaphragm wall. After the excavation of all pits, the maximum horizontal deformation of the diaphragm wall is located in the arc section of Pit C, followed by Pit A.
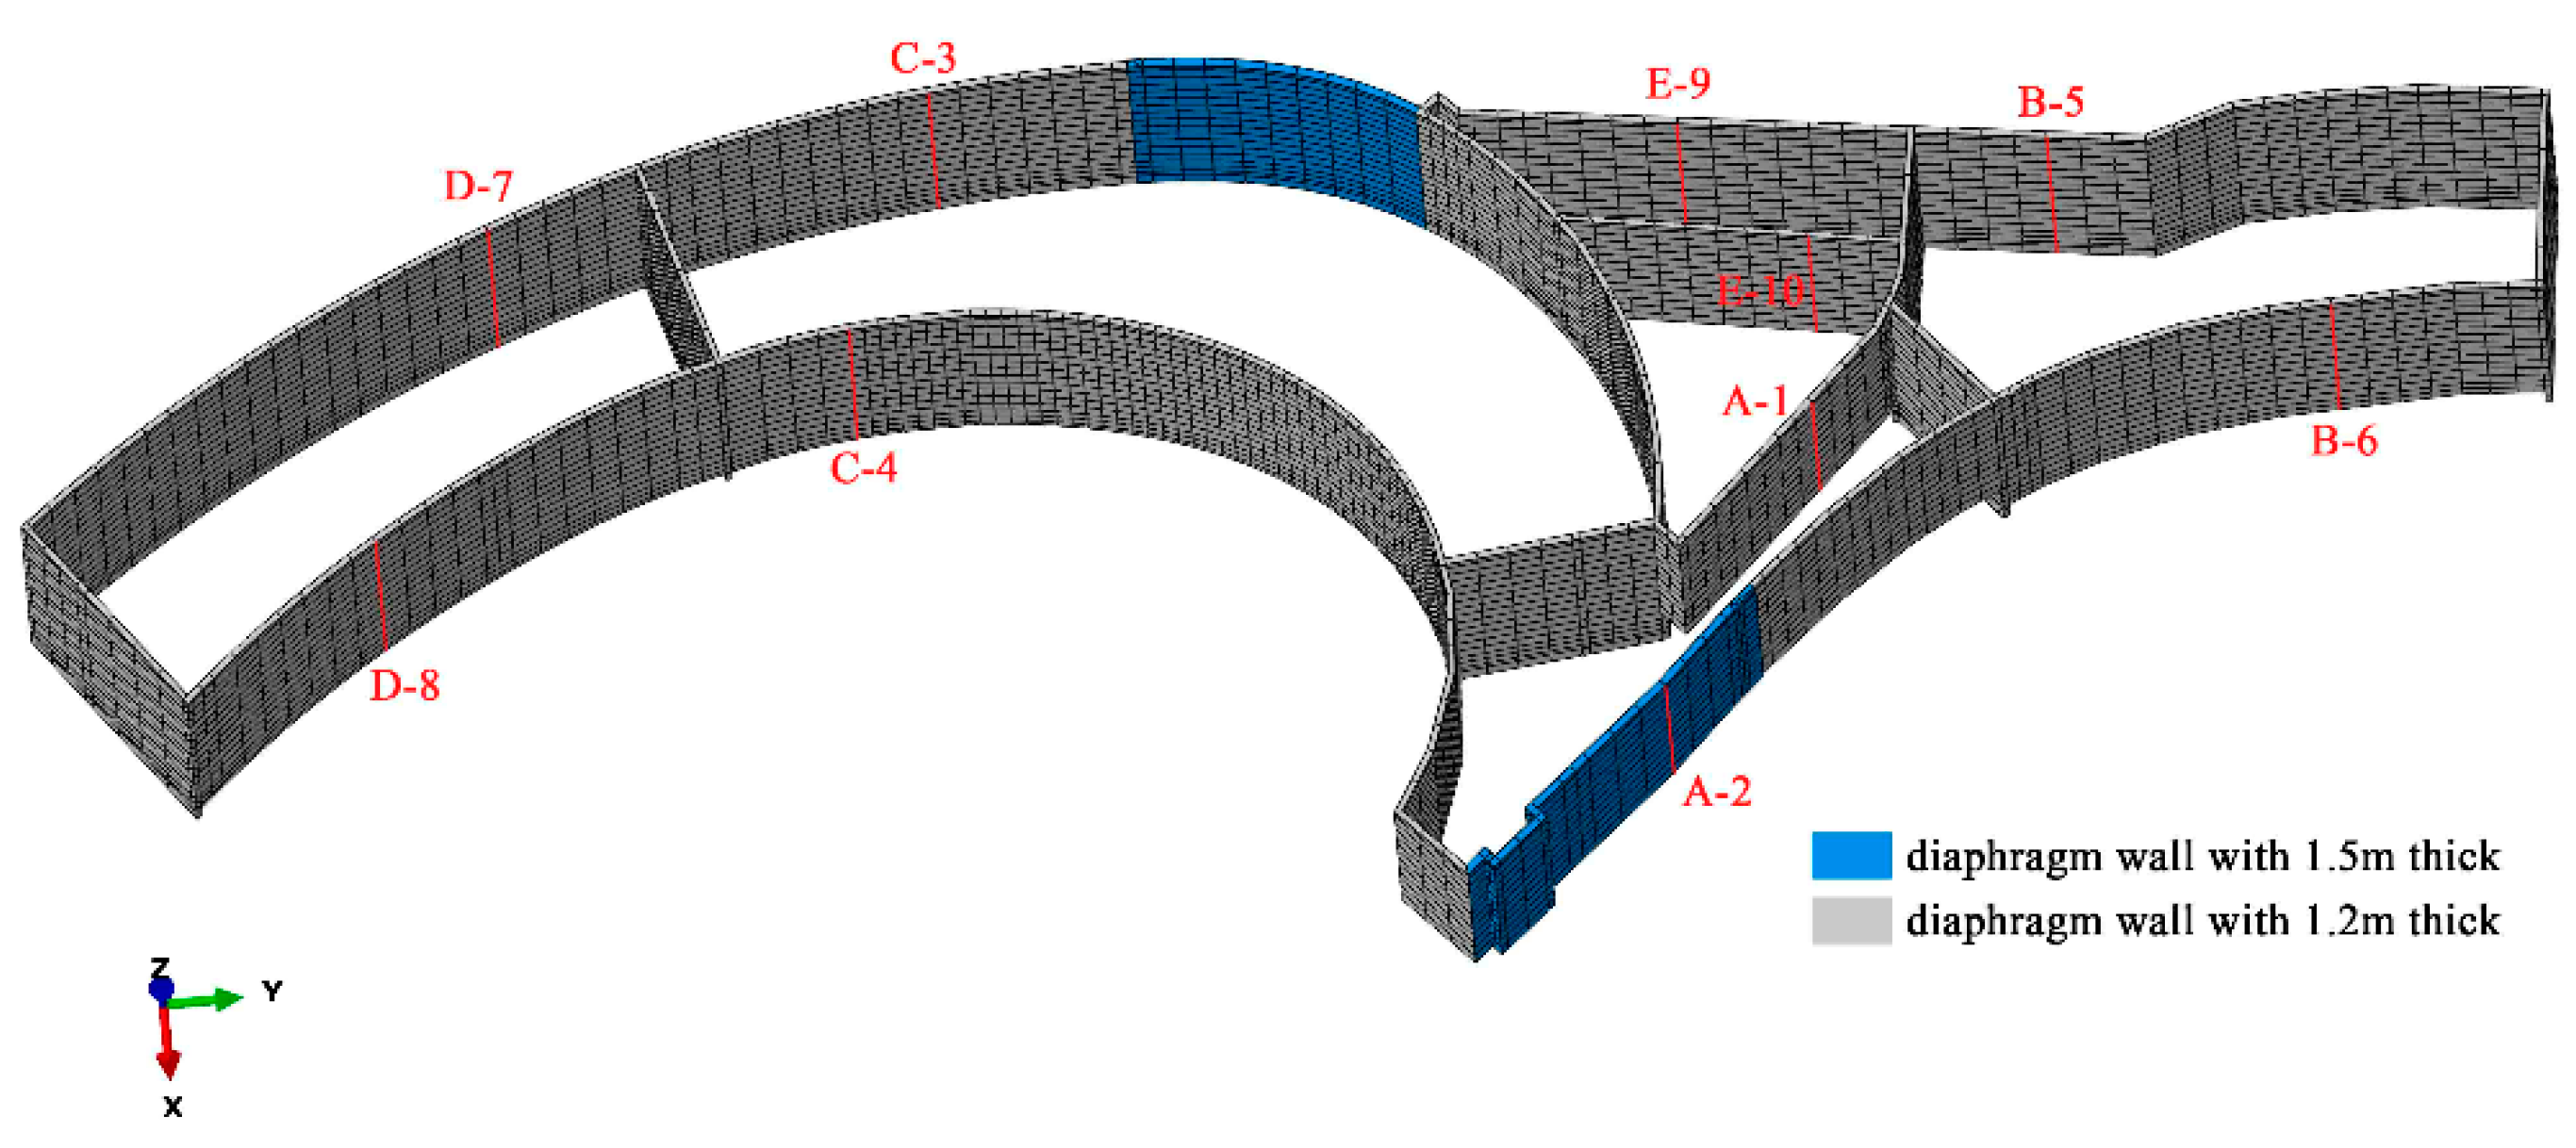
In order to conveniently illustrate the coupling effect on the deformation of the diaphragm wall, the deformation data of the diaphragm wall at about half of the excavation process and at the end of each process are selected. The selected construction processes are shown in Table 5. The maximum lateral deformation value of the diaphragm wall of each pit is taken as the representative, and the extracted positions are shown in Figure 4.
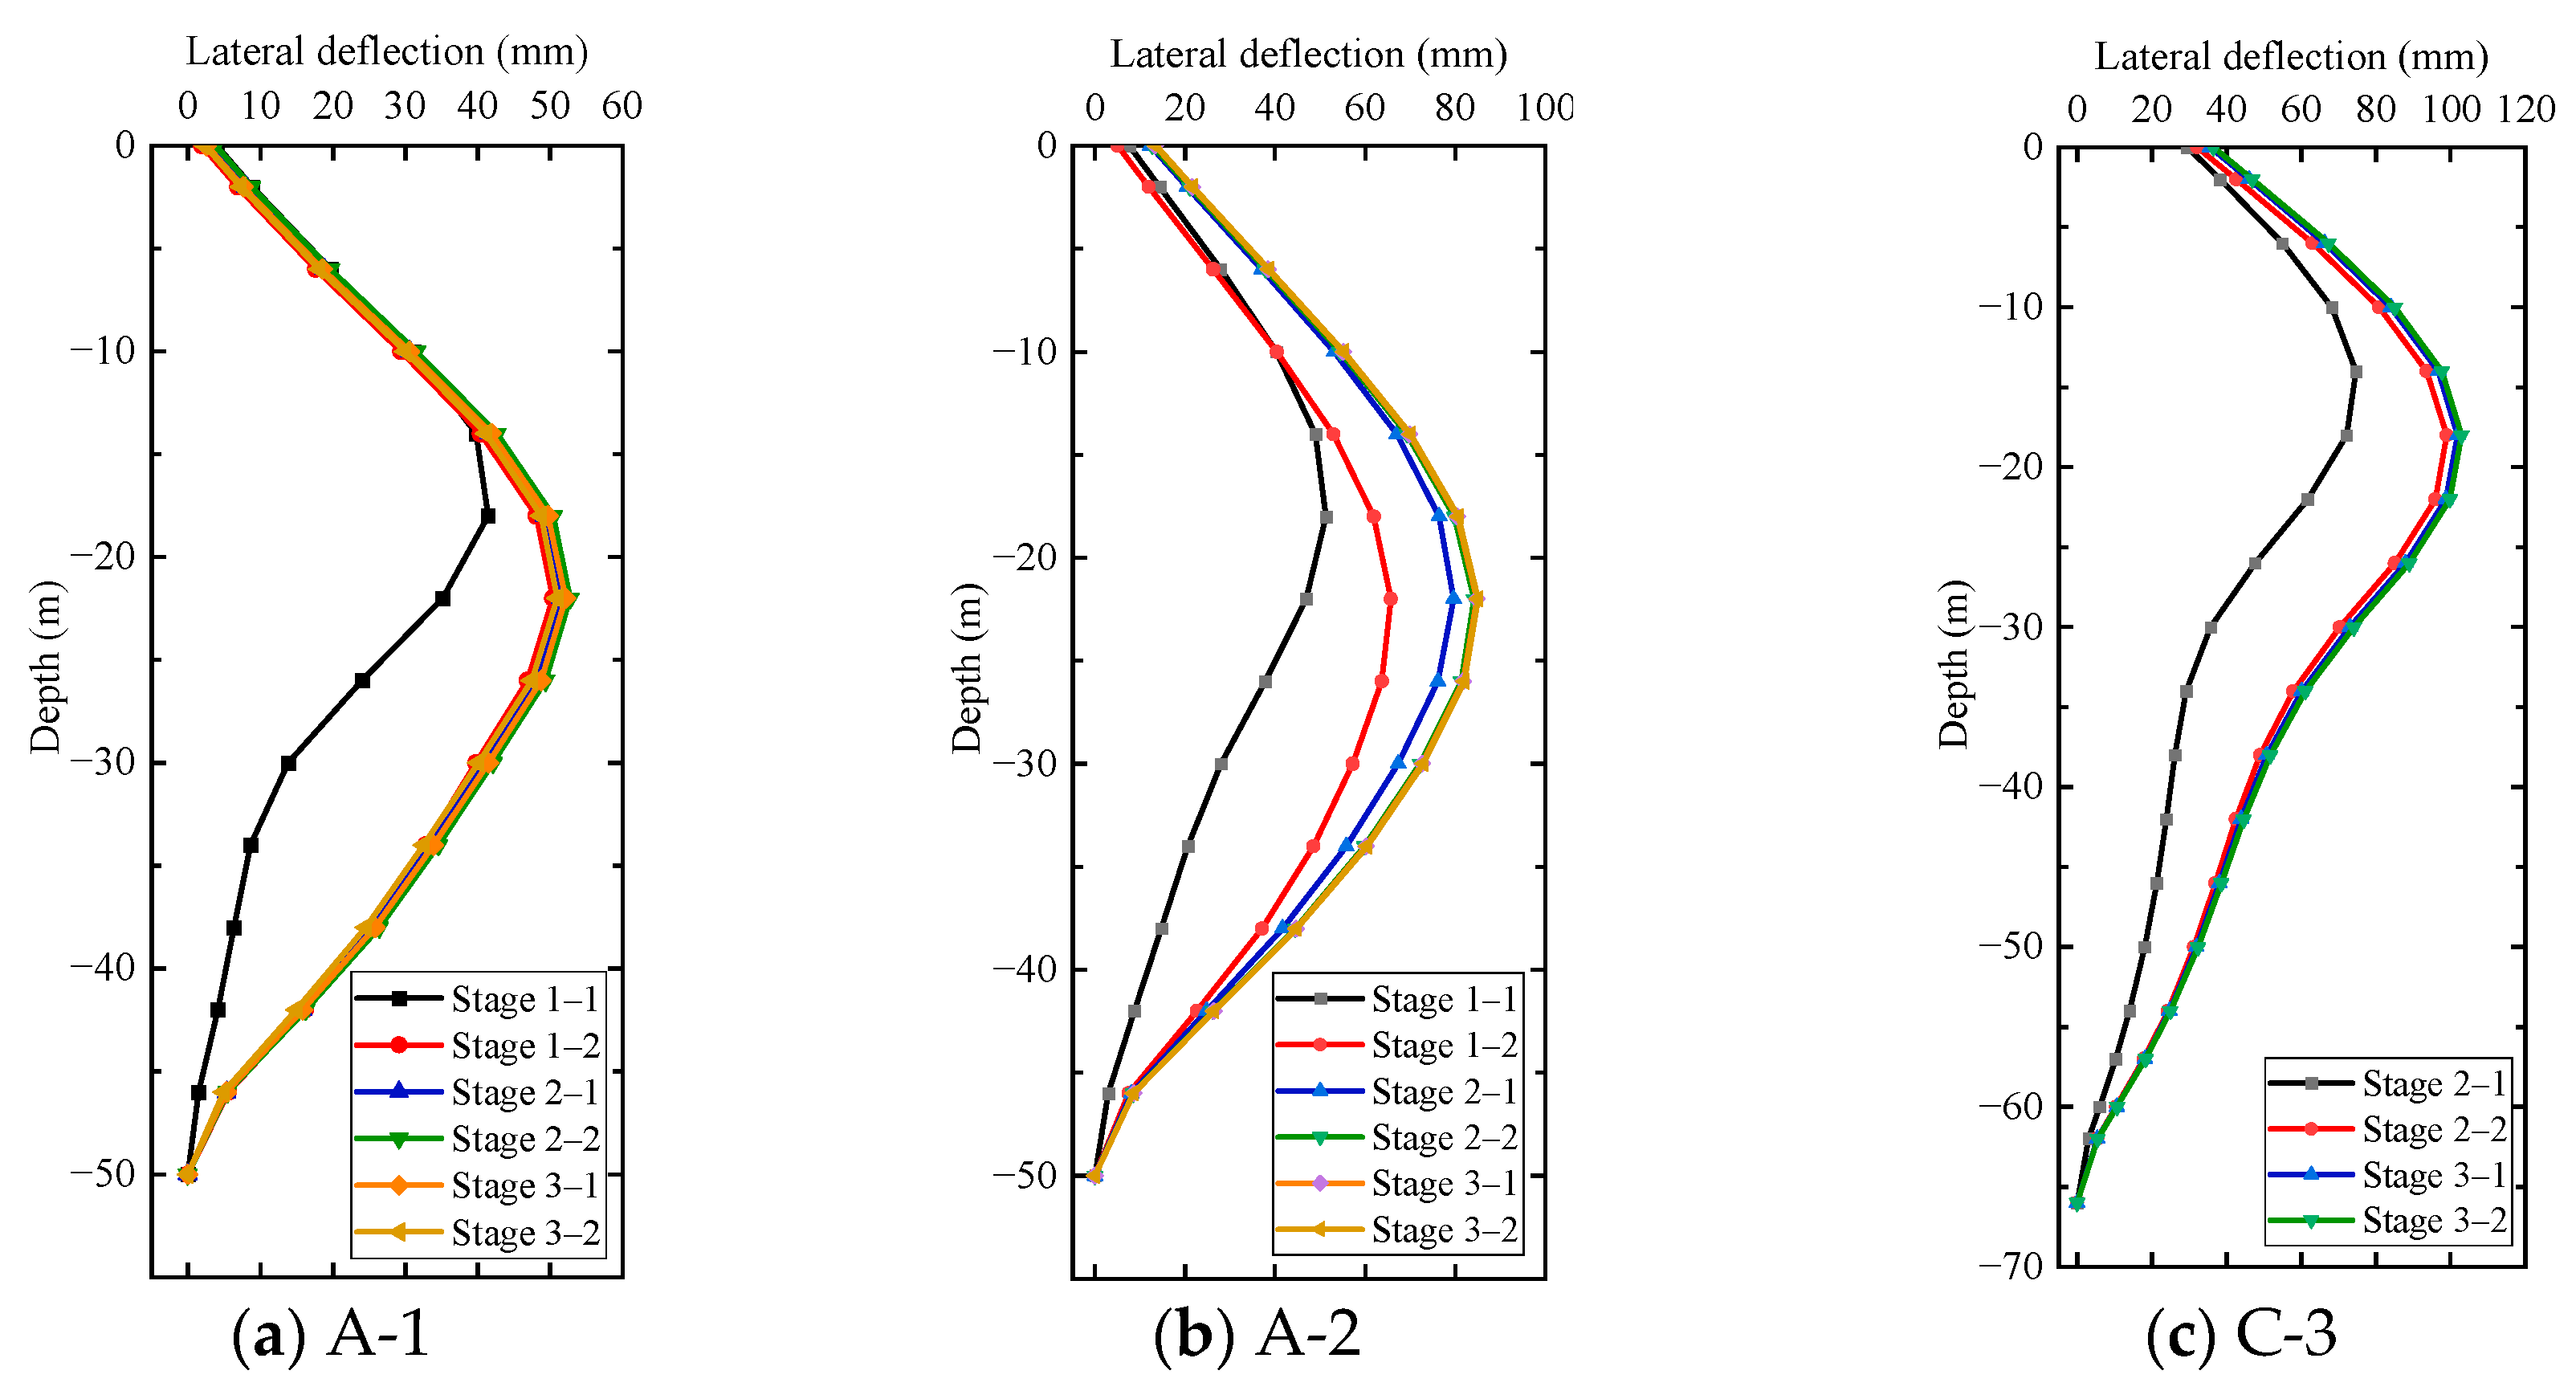
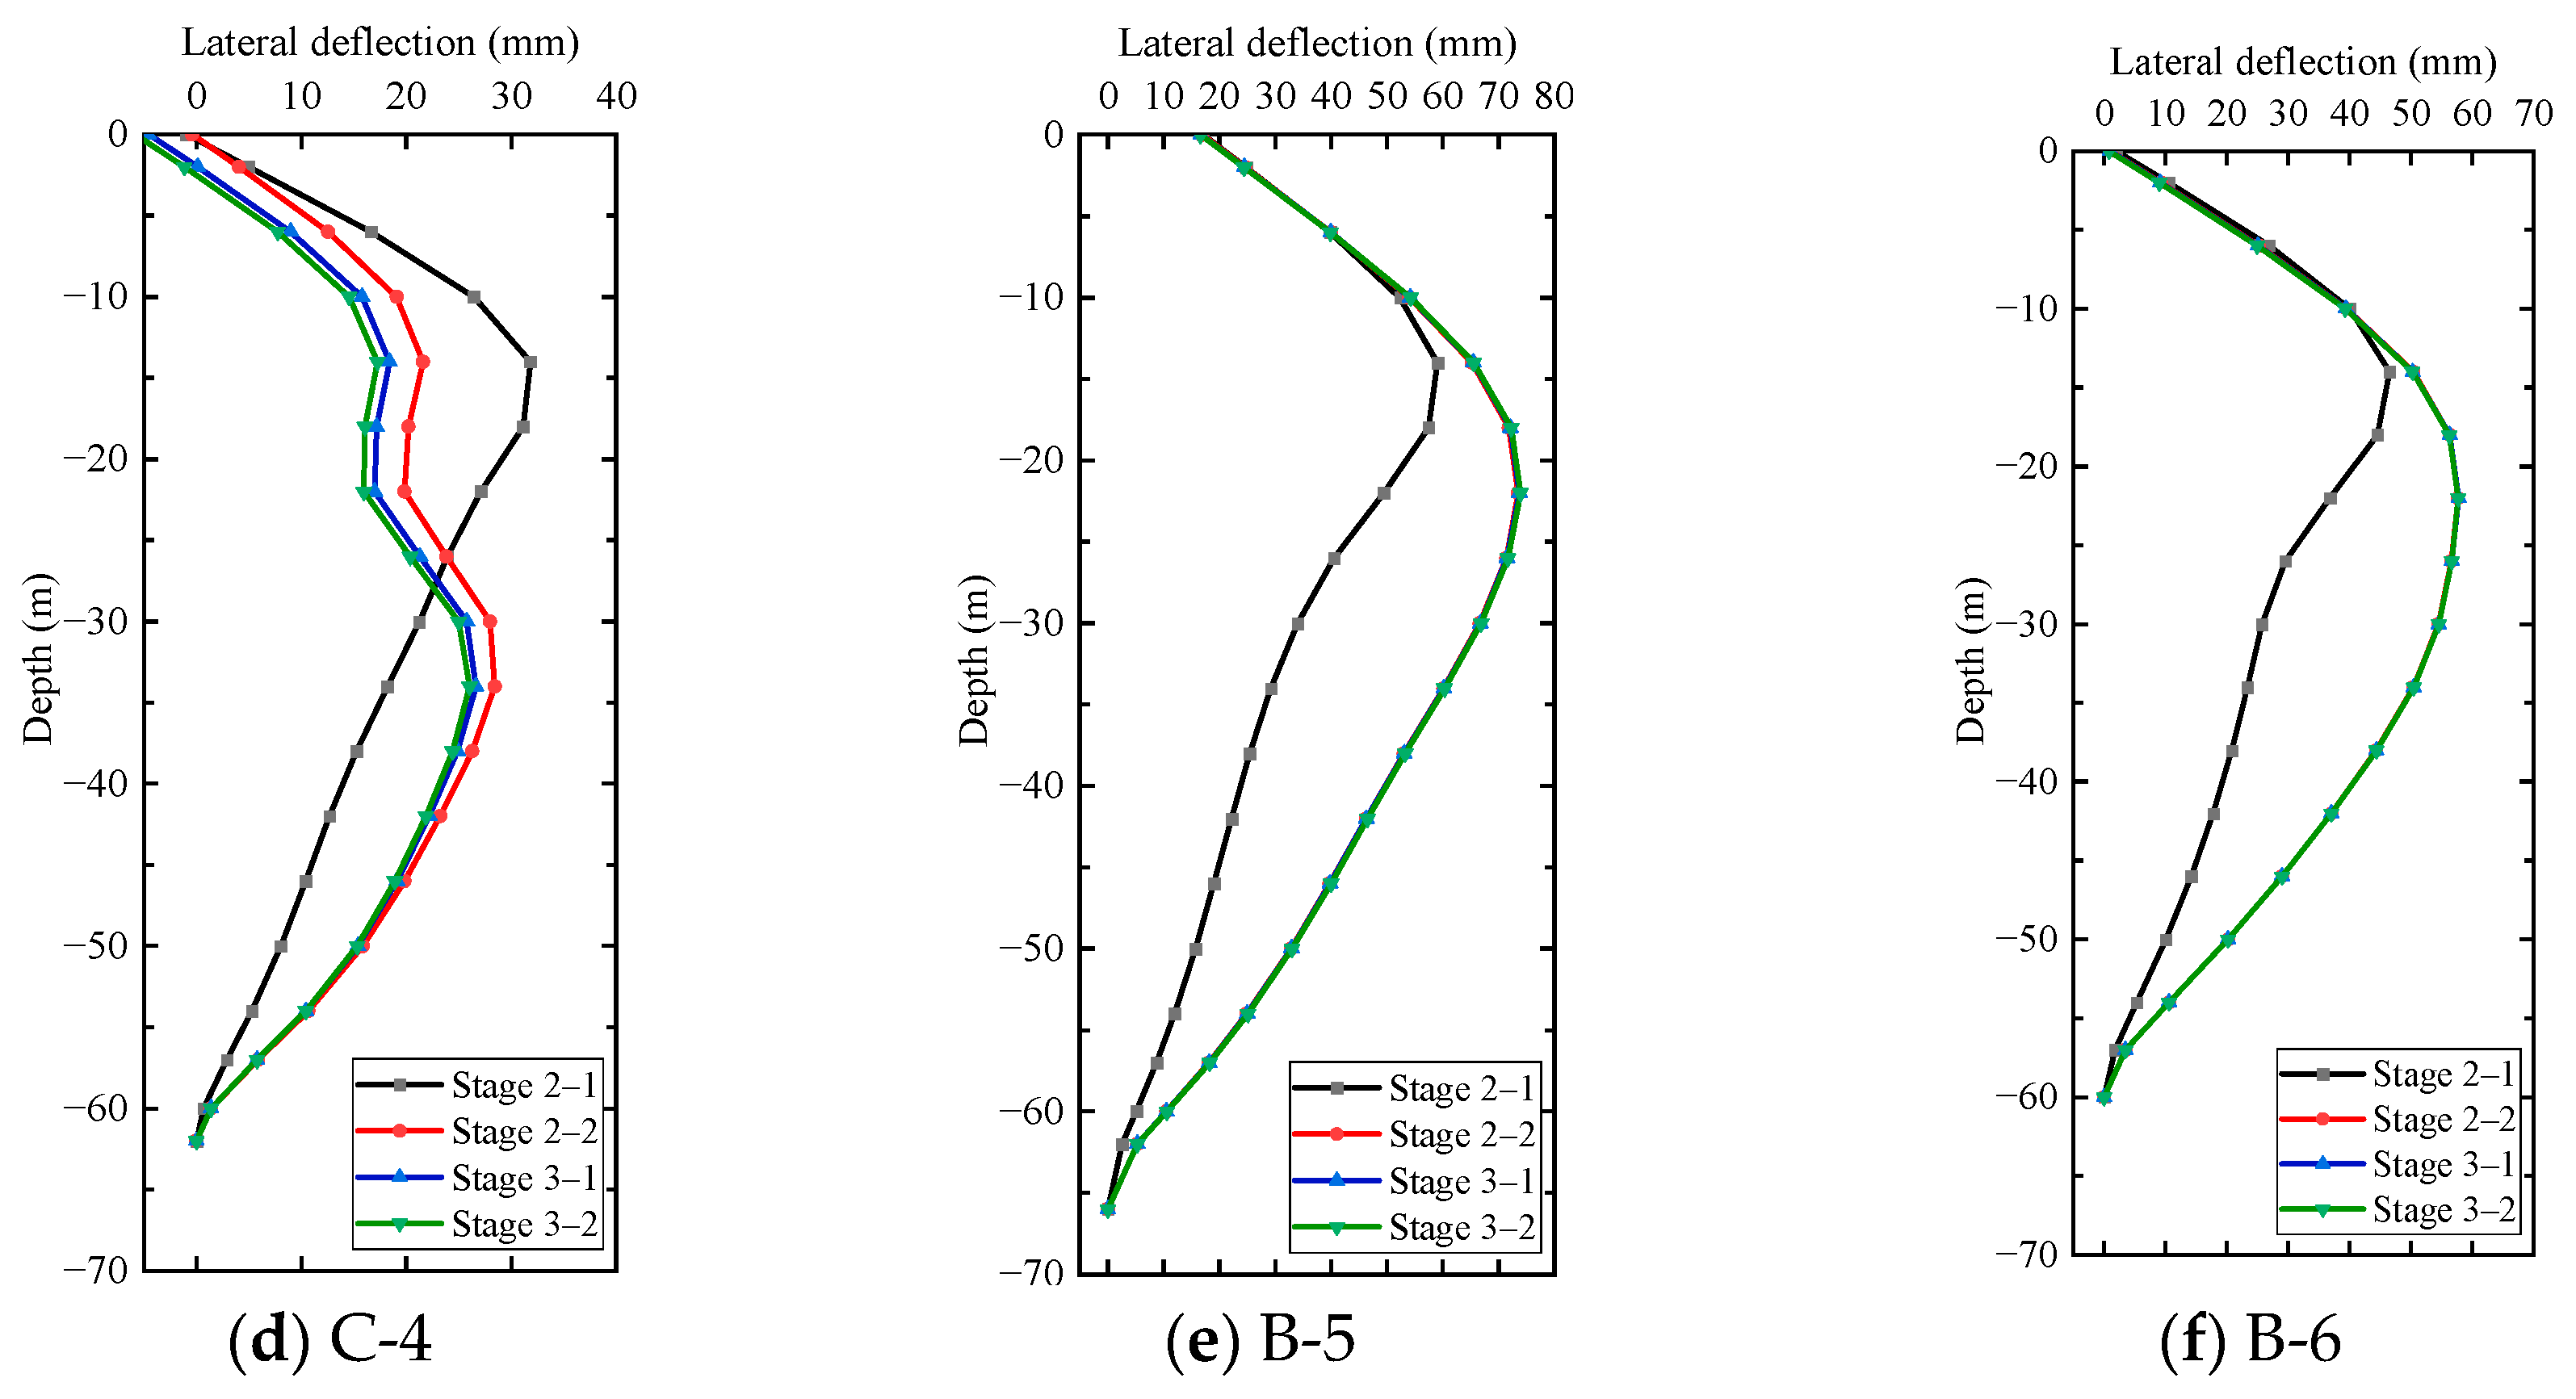
Figure 5 shows the lateral deflection curve of the diaphragm wall at different extracted positions of the foundation pit group. It can be seen that the lateral deformation shape is generally consistent, appearing as a “bow”. The concrete support at the top of the diaphragm wall limits the lateral deflection, and the base of the wall is embedded into the rock layer, restricting the deformation of the base as well. The maximum lateral deformation of the diaphragm wall is 102.9 mm at C-3. The maximum lateral displacement of the diaphragm walls at A-1, A-2, and C-3 is about 2/3 of the excavation depth. As the concrete cushion is cast at the bottom of Pit C, the buried depth of the maximum lateral displacement at C-4 is 10 m below the excavation surface. The maximum lateral displacement at B-5 and B-6 occurs near the excavation surface of pit-in-pit.
It can be seen from Figure 5a,b that from Stage 1–2 to Stage 2–2, the maximum lateral displacement at A-1 increases from 50.36 mm to 52.77 mm, with an increase of about 4.8%. In addition, the maximum lateral displacement at A-2 increases from 65.71 mm to 84.22 mm, with an increase of about 28.2%. It can be concluded that the process of Stage 2 has a greater impact on the displacement of the diaphragm wall at A-2. As the excavation and unloading takes place in Pit B, the soil outside moves toward the pit, driving the soil at A-2 to move toward Pit A. The position of A-2 is close to the existing building, making the soil at A-2 more susceptible to disturbance. Thus, the earth pressure on the diaphragm wall at A-2 increases, making the lateral displacement increase rate of A-2 larger. A-1 is located between foundation Pit B and Pit C, and the excavation of Pit C makes the soil outside tend to move toward Pit C, causing the soil at A-1 to unload to some extent. Therefore, the increase rate of lateral displacement at A-1 is smaller. From Stage 2–2 to Stage 3–2, the maximum lateral displacement at A-1 decreases from 52.77 mm to 51.01 mm, decreasing by about 3.3%. The maximum lateral displacement at A-2 increases from 84.22 mm to 85.11 mm, increasing by about 1%. Since Pit D is far from Pit A, the excavation in Pit D has little impact on lateral displacement at A-1 and A-2.
By comparing Figure 5c and Figure 5d, it can be found that the maximum lateral displacement at C-3 is much greater than that at C-4. C-3 is close to the pit-in-pit in Pit C. The depth of the pit-in-pit is 29 m, while the excavation depth of Pit C is 22 m. In addition, the constraint of the concrete cushion at C-4 further reduces the lateral displacement at C-4. It can be concluded that the excavation depth and the constraint of the concrete cushion have a great influence on the lateral displacement of the diaphragm wall. According to the Chinese technical standard for monitoring of building excavation engineering (GB50497-2019), the control value of the lateral deformation of the foundation pit classified into grade I is 0.4–0.5% of the excavation depth. Therefore, the control value of the lateral deformation is within the range of 116–145 mm, and the deformation at C-3 is acceptable.
It can be seen from Figure 5c–f that, from Stage 2–2 to Stage 3–2, the maximum lateral displacement at C-3 increases from 98.9 mm to 102.9 mm, with an increase of about 4%, and the maximum lateral displacement above the excavation surface at C-4 decreases from 20.2 mm to 16 mm, with a decrease of about 20.8%. The excavation of Pit D drives the soil mass at C-3 to move toward the pit, resulting in the increase in earth pressure at C-3 and the increase in the lateral displacement of the wall. However, C-4 is close to the shared diaphragm wall of Pit C and D, and both sides of the shared diaphragm wall are braced with diagonal supports. Thus, the lateral displacement at C-4 is affected by the great stiffness of the diagonal supports, showing the trend of moving away from Pit C. The process of Stage 3 has little effect on the lateral displacement at B-5 and B-6. Although B-5 is close to Pit E, the shared diaphragm wall of Pit E and Pit B limits the displacement of the wall near B-5. Moreover, the excavation area of Pit E is small, so the impact of excavation can be ignored.
In summary, the coupling effect on the lateral deformation of the diaphragm wall at A-2 and C-4 is obvious and cannot be ignored; the adjacent pit excavation will have a greater impact on the deformation of the wall at A-2 and C-4. Thus, during Stage 2 and Stage 3, the influence of the coupling effect on the deformation of the diaphragm wall at A-2 and C-4 can be controlled by adjusting the axial force of the servo steel supports. The duration of excavation must be reduced as far as possible. The additional deformation from the coupling effect must be of concern. The coupling effect on the deformation of the wall at A-1 and C-3 is small, and B-5 and B-6 are hardly affected by the excavation of the adjacent pit. The lateral deformation of the wall at C-3 is the largest. The lateral deformation of the wall at A-2 is significantly increased due to the more prominent coupling effect, as its location is close to the existing building. Therefore, the deformation development at C-3 and A-2 should be focused on during the excavation process.

4.2. Internal Support Axial Force

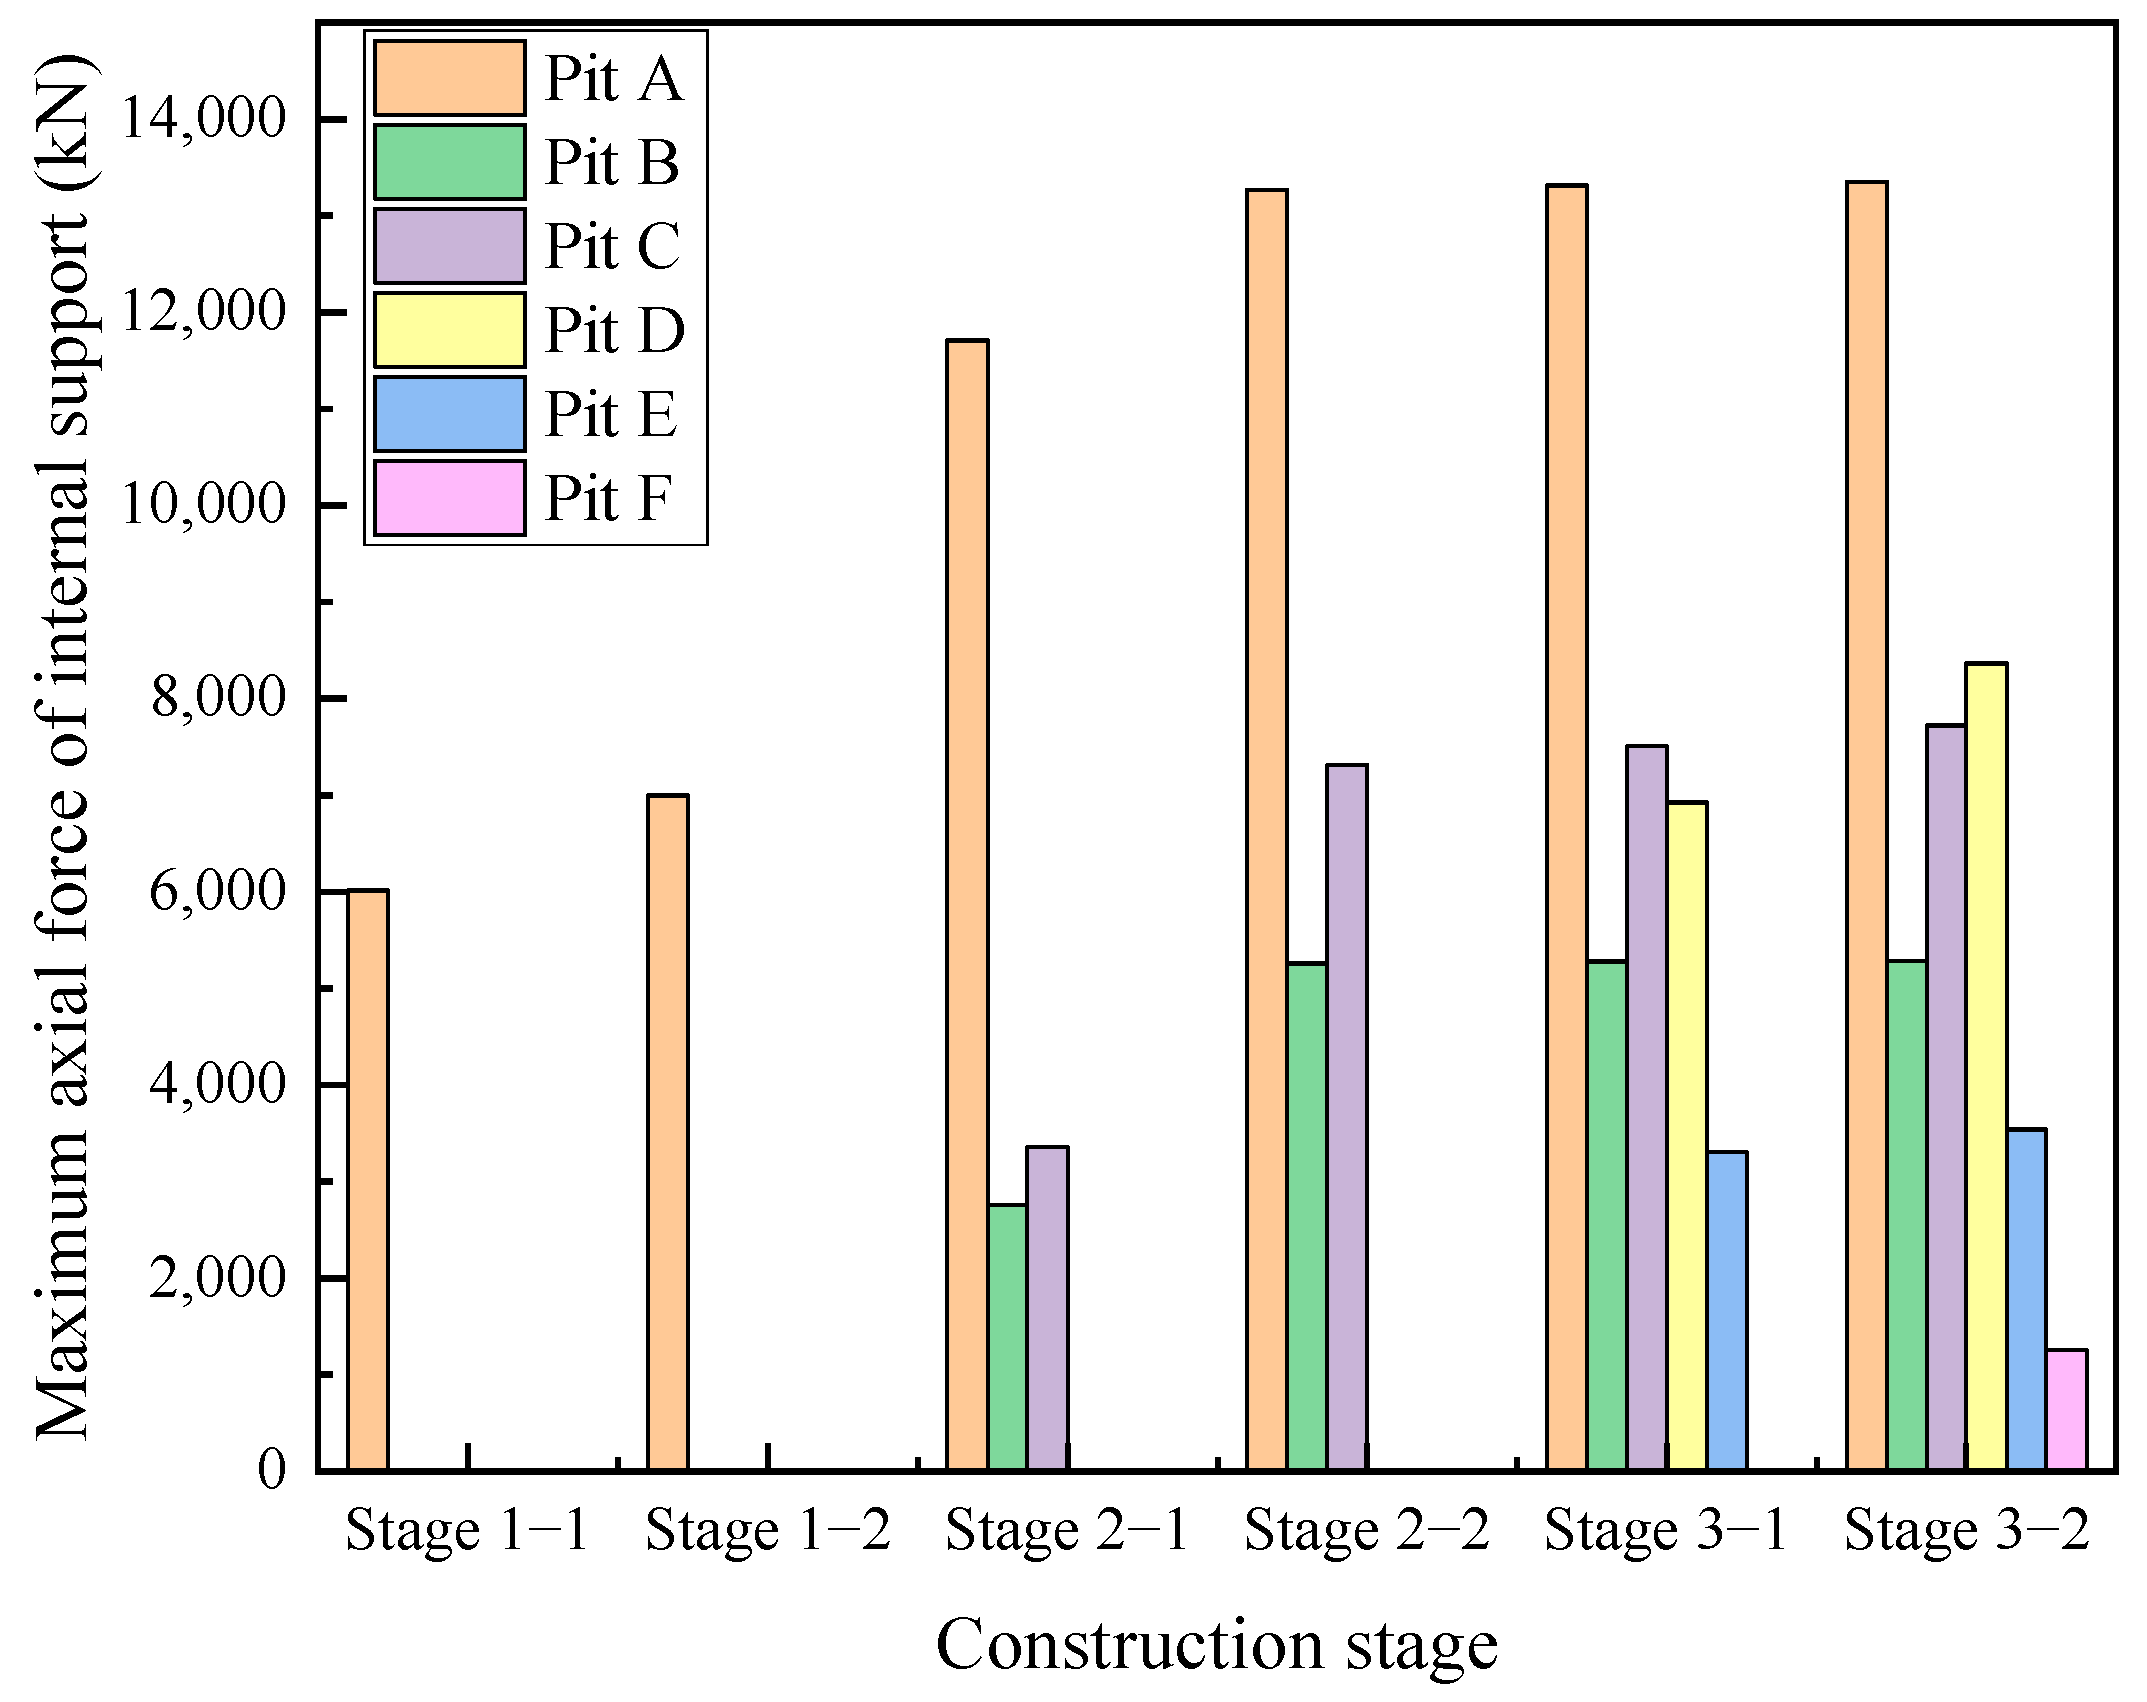
It can be seen from Figure 2b that the number of internal supports in the foundation pit group is large and the support system is complex. The internal support positions of each pit are not at the same height, so the axial force variation of the support cannot be estimated by conventional methods and engineering experience, which greatly increases the engineering risk. However, the layered construction process of the support can be considered in a numerical simulation, which is an effective way to solve this problem. Figure 6 shows the maximum supporting axial force after each excavation.
It can be seen from Figure 6 that the maximum axial force of the support in Pit A is always far greater than that in other pits in each construction stage. After the excavation of all foundation pits, the maximum axial forces of the supports in Pit A–Pit F reach 13,350 kN, 5286 kN, 7723 kN, 8365 kN, 3540 kN, and 1257 kN, respectively. As the minimum width of Pit A is only 13.5 m, the internal supports have a strong supporting effect. In addition, Pit A is close to a building, which makes the axial force of the internal support in Pit A larger, always exceeding that in other pits in the subsequent construction stage. After Stage 2 excavation, the maximum axial force of support in Pit B is always less than that in Pit C. The excavation depth of Pit B is 22 m, and the pit-in-pit is located in the middle with a small excavation area. In contrast, Pit C is a large excavation area with a curved shape, and the excavation depth is 23.8 m. The pit-in-pit in Pit C is close to the diaphragm wall with a large excavation area. Therefore, the supports in Pit C have greater axial forces. Similarly, the maximum axial force of the support in Pit D is always greater than that in Pit E. The excavation depth of Pit F is the shallowest, only 4.5 m, so the maximum axial force of support is the smallest.
After the process of Stage 2, the maximum axial force of the support in Pit A increases from 7000 kN to 13,270 kN, increasing by 89.6%. After Stage 3 excavation, the maximum axial force of the support continues to increase to 13,350 kN, with an increase of 0.6%. It can be seen that the second stage excavation has a significant impact on the maximum axial force in Pit A. Pit B and Pit C are close to Pit A. When they are excavated at the same time, the soil mass near Pit A receives an unloading disturbance and the supports in Pit A will bear greater axial forces. However, Pit D, Pit E, and Pit F are far away from Pit A, so their excavation has little impact on the axial force in Pit A, which could almost be ignored.
After the construction of Stage 3, the maximum axial force in Pit C increases from 7314 kN to 7723 kN, with an increase of 5.6%, and the maximum axial force in Pit B increases from 5259 kN to 5286 kN, with an increase of 0.51%. It can be seen that the third stage excavation has a certain degree of influence on the axial force in Pit C. The excavation area of Pit D is obviously larger than that of Pit E and Pit F, and it is close to the curved Pit C, so the construction of Stage 3 mainly affects the support of Pit C. The shapes of Pit E and Pit F are similar—both are narrow and long, so the impact on the axial force in Pits C and B is very small.
In general, the maximum axial force of the support in Pit A is far greater than that in other pits, and the excavation of Stage 2 has a great impact on the axial force in Pit A. Pit A is close to the existing building, and the coupling effect of adjacent excavations shows the obvious impact on the maximum axial force in Pit A. In addition, the excavation of the third stage has a certain influence on the axial force in Pit C. Therefore, during the construction of the foundation pit group, full attention should be paid to the impact of adjacent pit excavation on existing supports, especially the development of the axial force of the support in Pit A.

5. Influence of Construction Sequence

5.1. Influence on Lateral Wall Deflection

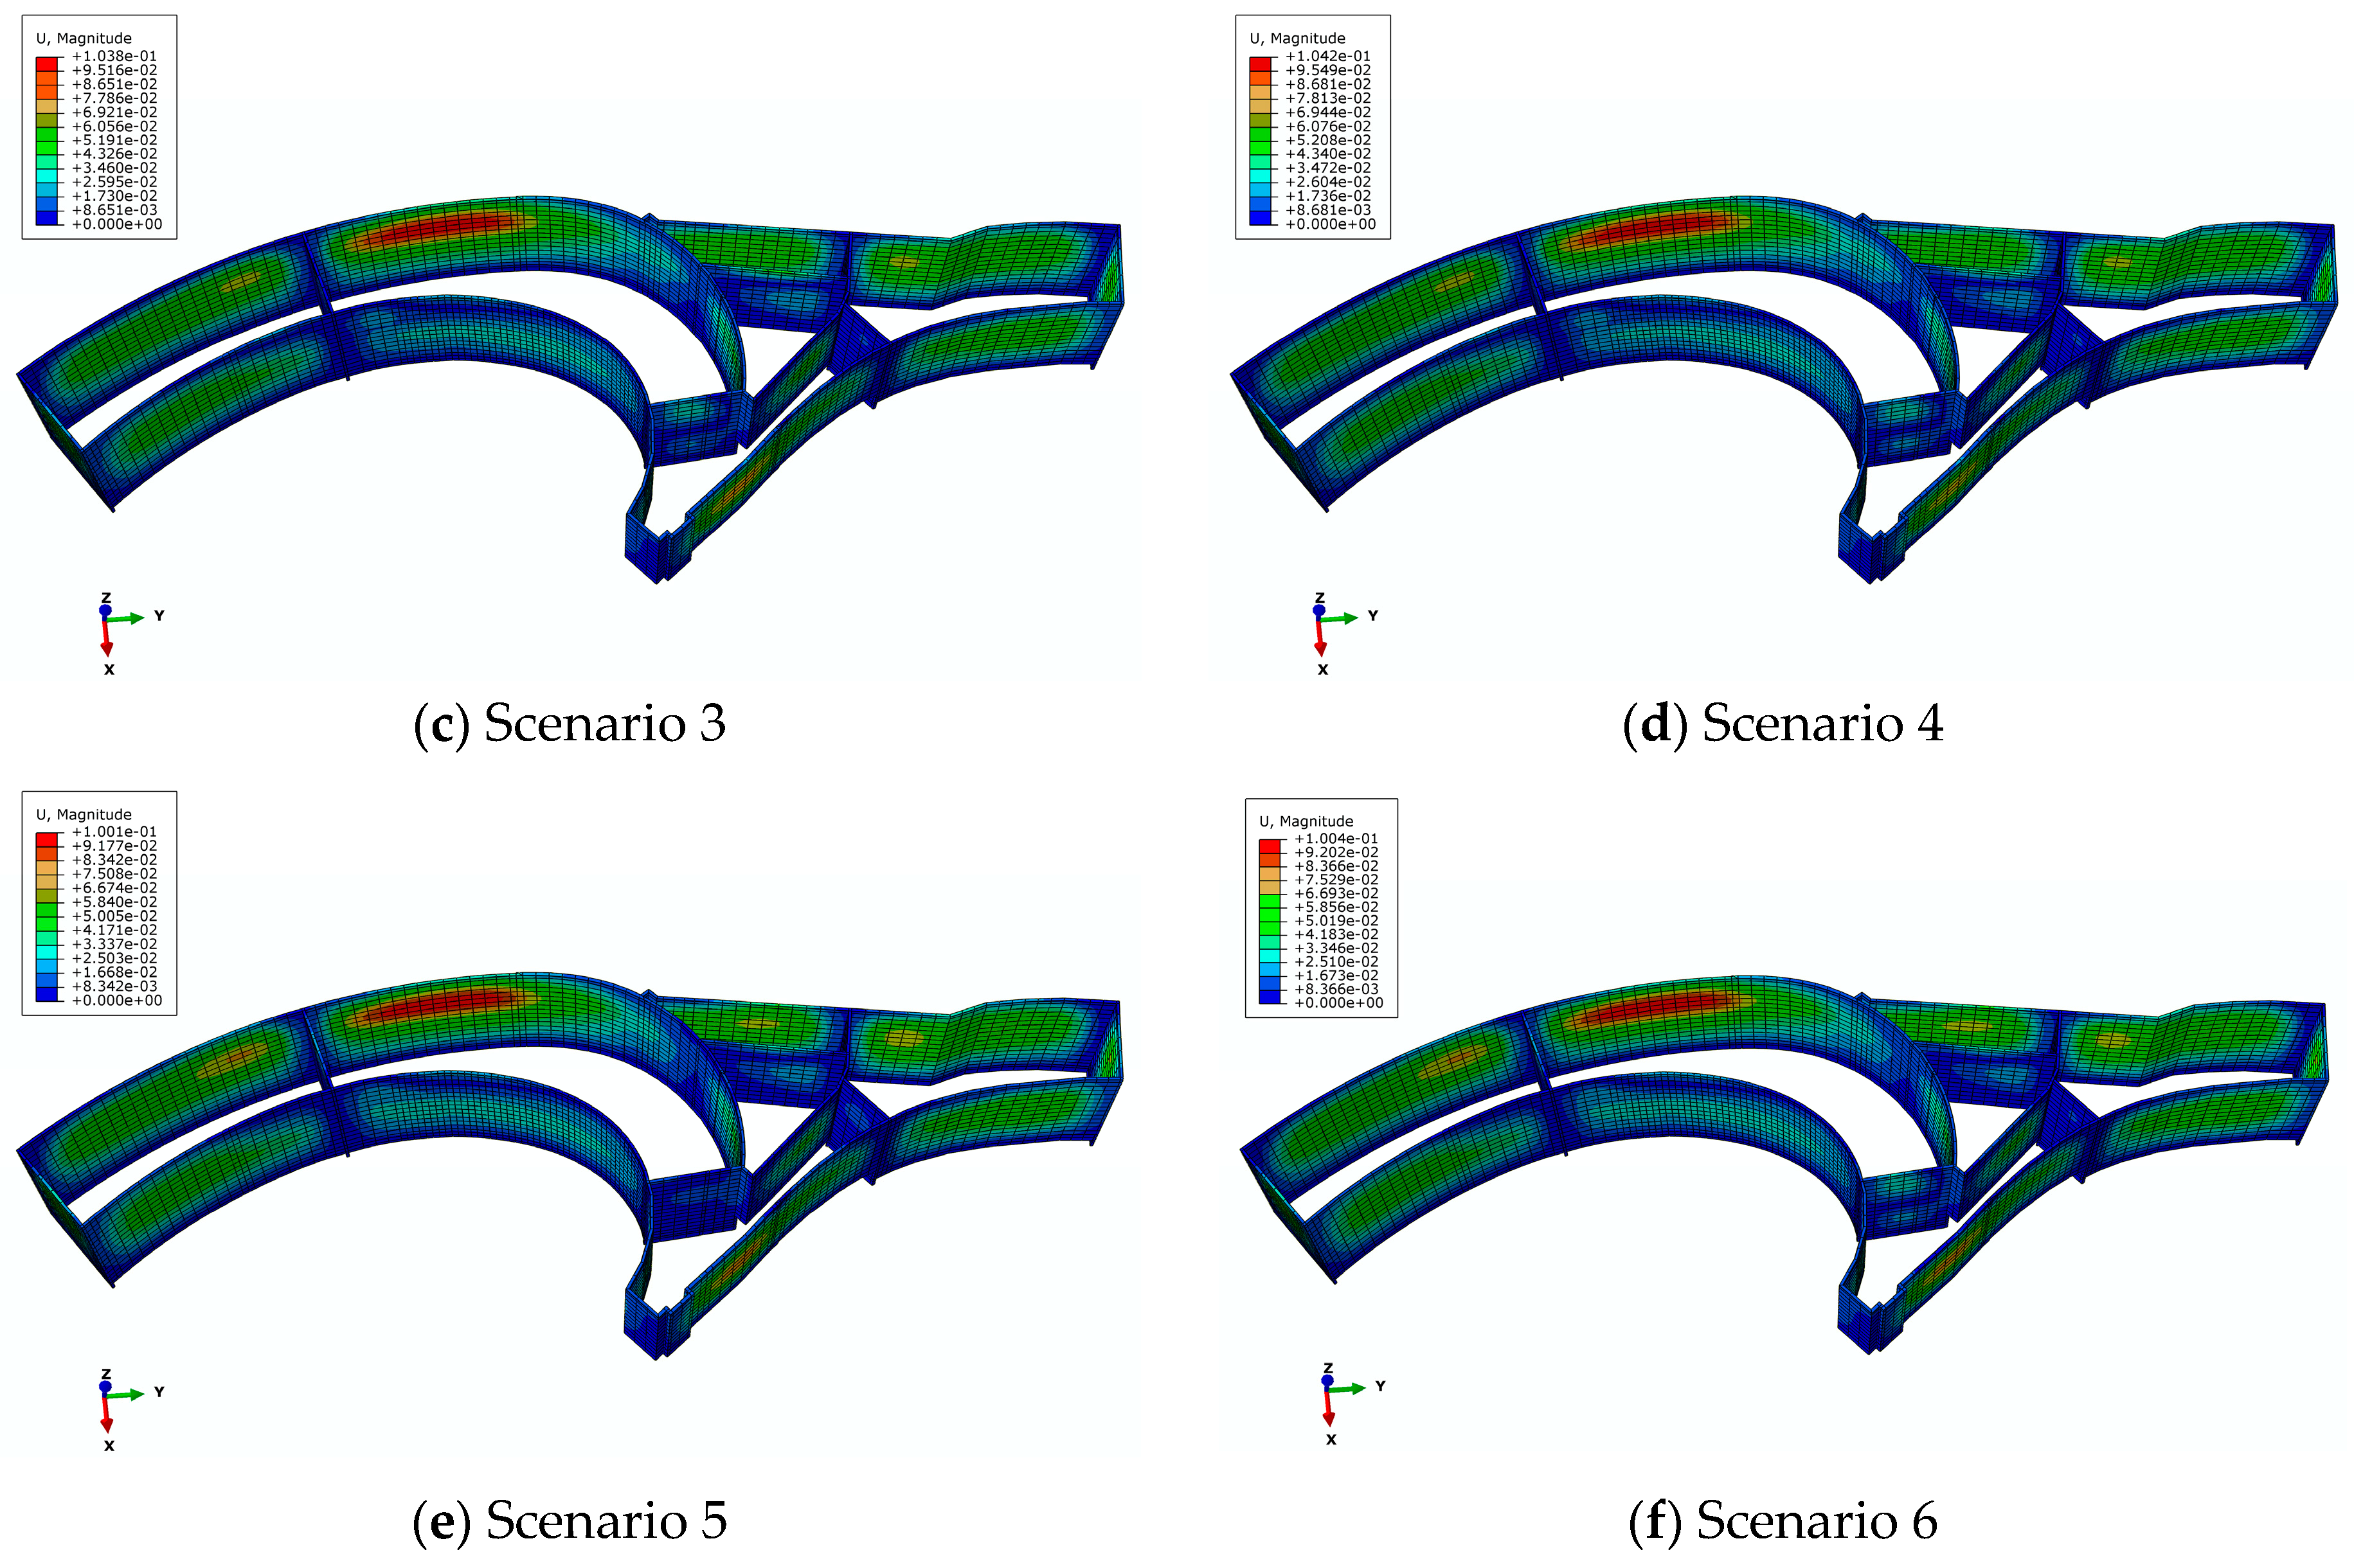
In the different excavation sequences of the foundation pit group, the surrounding soil mass will have different unloading processes, which will exhibit different coupling effects. For a single foundation pit, the excavation area, the excavation depth, and the setting of internal support will have a significant impact on the deformation of the foundation pit. The layered and blocked excavation must be followed, and the internal support must be installed in time without over-excavation. For a complex foundation pit group, these essential instructions are also applicable. The foundation pit group of this project includes six pits, and the construction sequence is an important factor affecting the deformation of the foundation pit. In order to better understand the coupling effect of different construction sequences on the deformation of the foundation pit group, the original construction sequence is changed for simulation to analyze the difference characteristics of the support structure. To facilitate the description of different construction stages, the above names of each foundation pit must remain unchanged and the construction content of each stage must be changed, as shown in Table 6. Figure 7 shows the deformation contour image of the diaphragm wall after excavation in each stage.
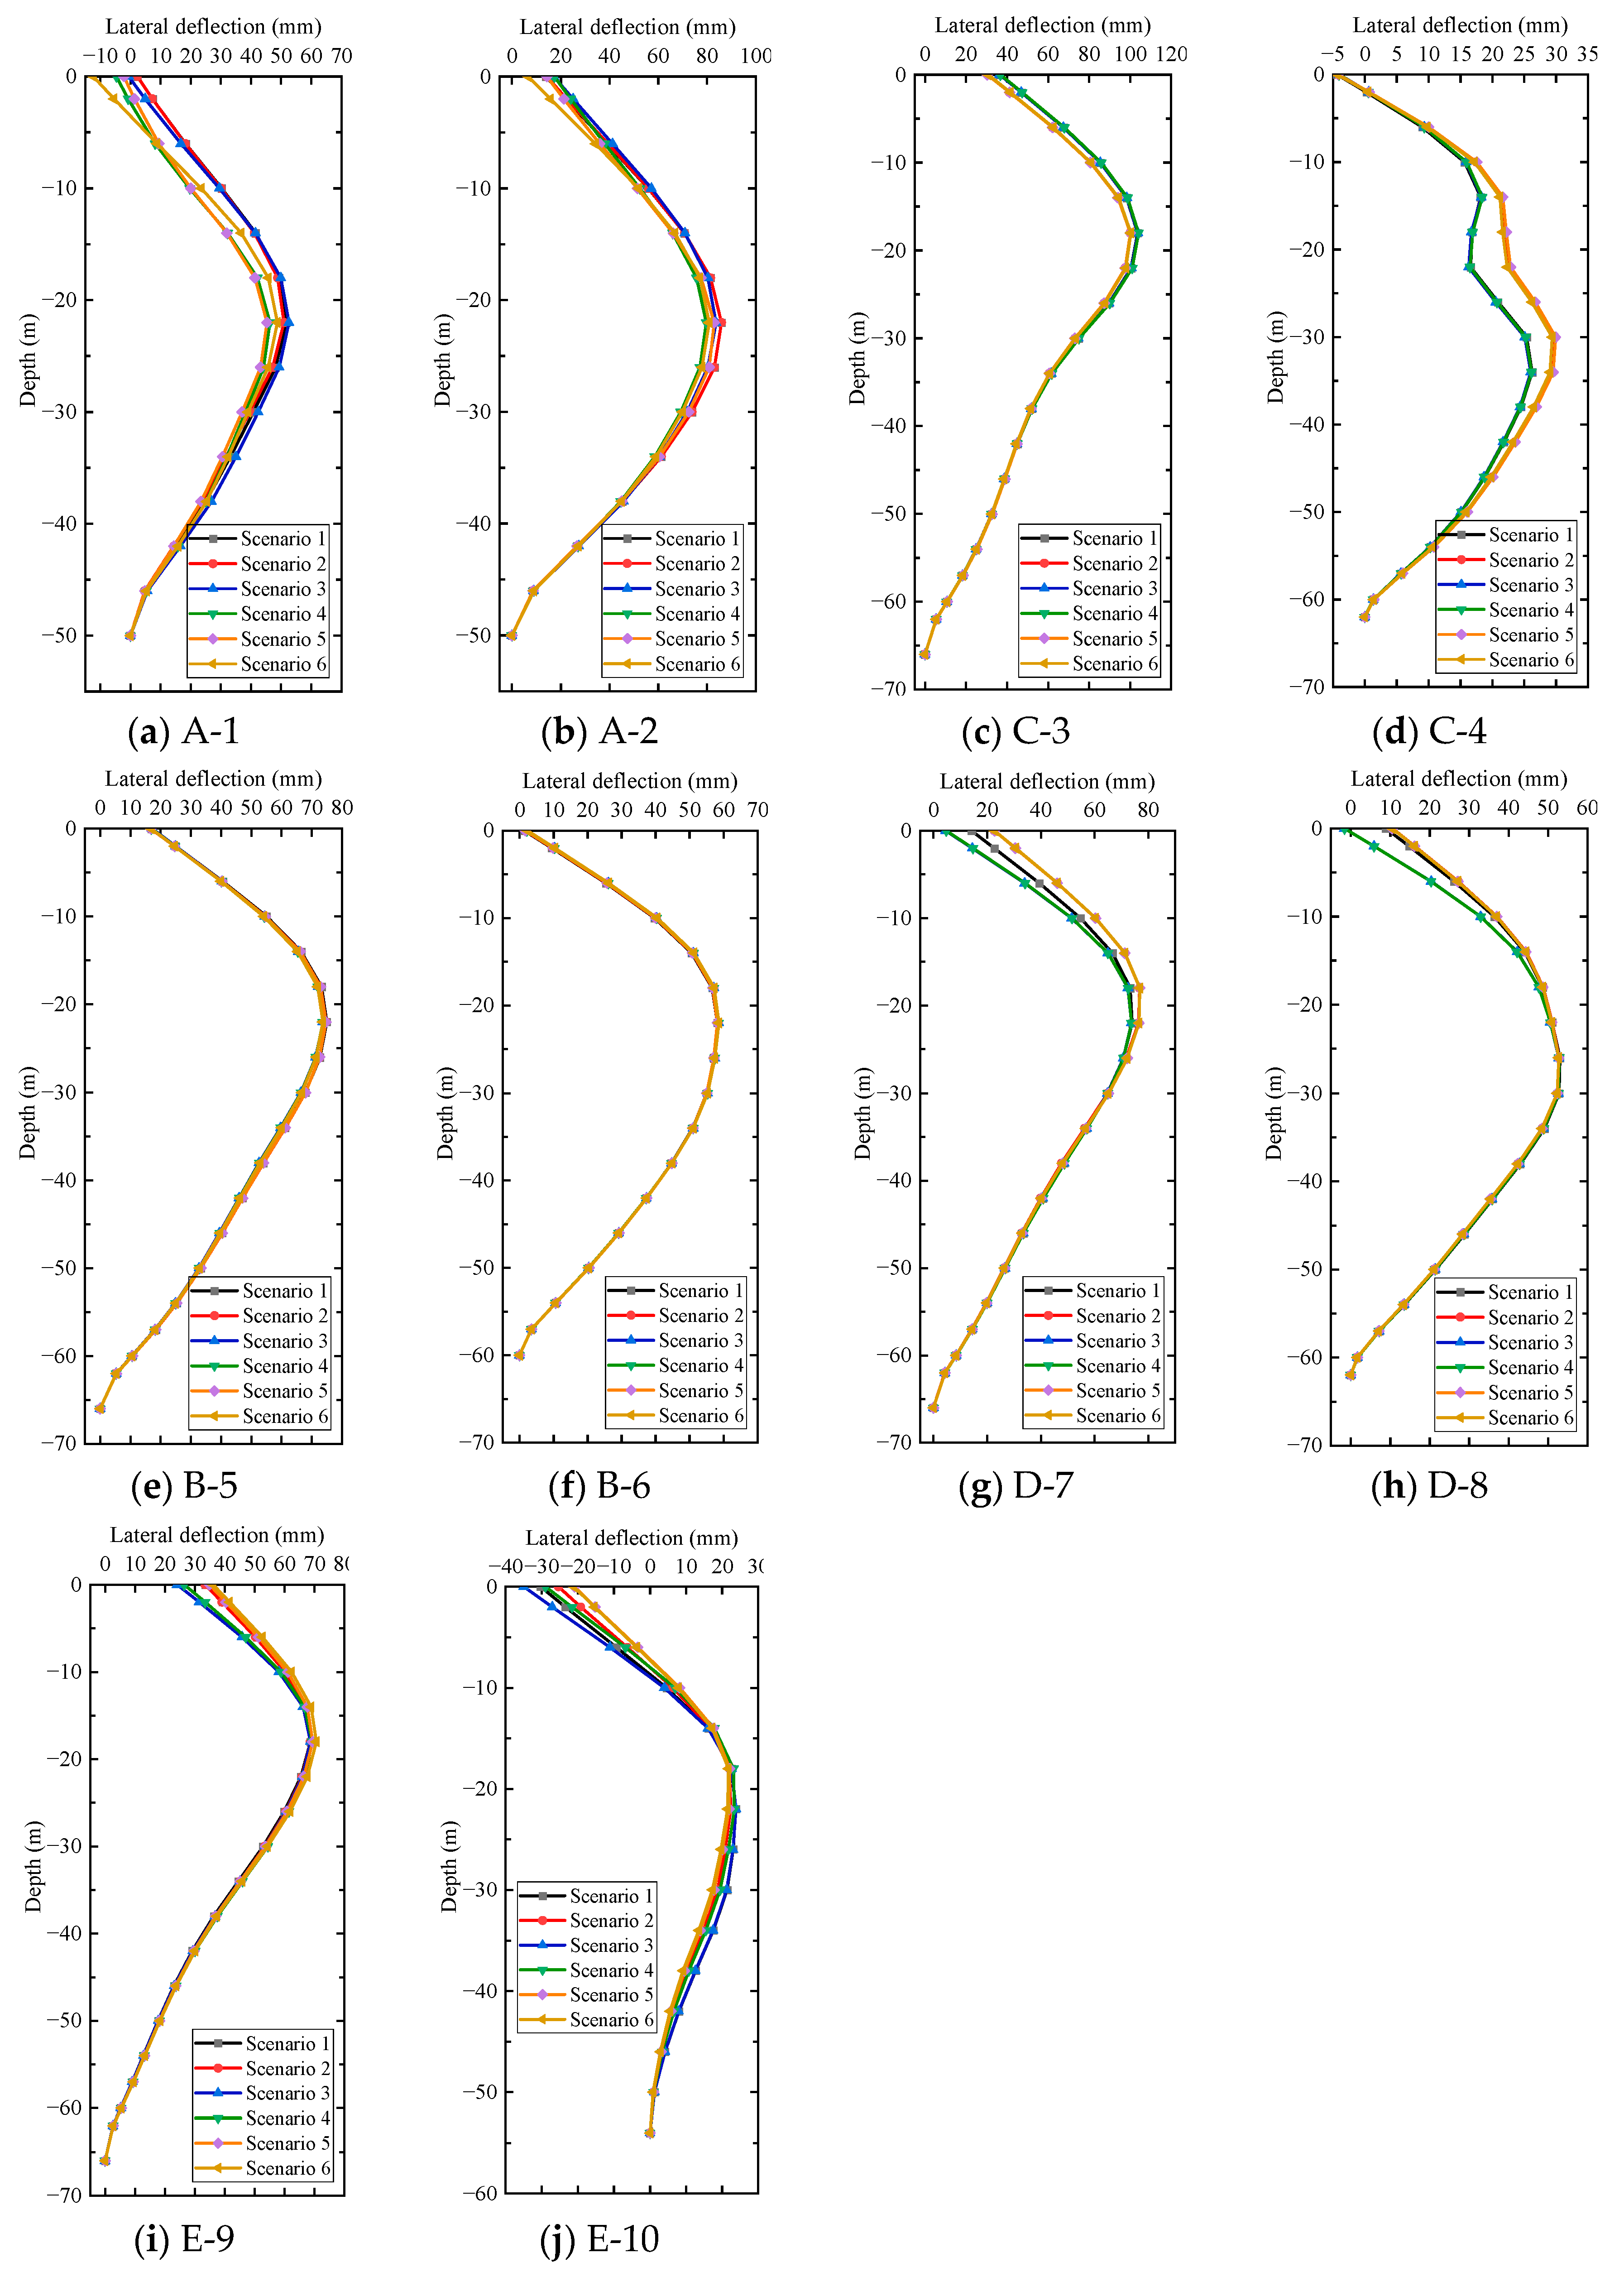
Figure 8 shows the lateral deflection curves of the diaphragm wall after the excavation of the foundation pit group under different construction sequences. It can be seen from Figure 8a that the construction sequence has various influence on the displacement at A-1. In Scenario 5, the lateral displacement value at A-1 is the minimum, at 45.3 mm, while in Scenario 3, the lateral displacement value at A-1 is the maximum, at 52.5 mm, with a difference of 15.9%. The maximum lateral displacement under other scenarios is between the above two. At the same time, Figure 8a shows that the deflection curves of Scenario 1 and Scenario 2, Scenario 4 and Scenario 6 are similar. It can be seen that when Pit A is excavated in the second stage, the specific excavation plans of the first and third stages will have a decisive impact on the lateral deformation of the diaphragm wall at A-1. From Figure 8b, the maximum lateral displacement of the diaphragm wall at A-2 is about 86 mm in Scenario 1 and Scenario 2. In Scenario 4 and Scenario 6, the maximum lateral displacement of the diaphragm wall at A-2 is the smallest, at about 80 mm. The difference between the two reaches 7.5%; that is, when Pit A is first excavated, the deformation at A-2 is maximum, and when Pit A is last excavated, the deformation at A-2 is minimum. In addition, the construction sequence has a greater impact on deformation at A-1, compared with A-2.
It can be seen from Figure 8c,d that the maximum lateral displacement of the diaphragm wall at C-3 is about 103 mm in Scenarios 1, 3, and 4, and the maximum lateral displacement is about 100 mm in Scenarios 2, 5, and 6, with a difference of 3%. In Scenarios 1, 3, and 4, the maximum lateral displacement of the diaphragm wall at C-4 is about 26 mm, and the maximum lateral displacement is about 30 mm in Scenarios 2, 5, and 6, with a difference of 15.4%. Thus, the maximum lateral displacement at C-3 and C-4 cannot reach the minimum value at the same time in the six scenarios; that is, there is no optimal scenario.
It can be seen from Figure 8e,f that the lateral deflection curves of the diaphragm wall at B-5 and B-6 are almost coincident in the six scenarios, indicating that the construction sequence has little impact on the final lateral displacement values at B-5 and B-6.
It can be seen from Figure 8g,h that the maximum lateral displacement of the diaphragm walls at D-7 is smallest in Scenarios 1, 3, and 4, at about 74 mm, and largest in Scenarios 2, 5, and 6, at about 76 mm, increasing by 2.7%. Therefore, the maximum lateral displacement at D-7 is mainly related to the excavation process of Pit C. When Pit C is excavated first, the soil mass outside Pit D will move toward the pit, causing greater displacement of the diaphragm wall in later excavation in Pit D. Nevertheless, the maximum lateral displacement of the diaphragm wall at D-8 is almost the same in the six scenarios. Since it is far away from other pits, the excavation of other pits has almost no coupling effect on the deformation of the diaphragm wall at D-8.
It can be seen from Figure 8i,j that the maximum lateral displacement of the diaphragm wall at E-9 is about 69 mm in Scenarios 1, 2, and 3, and the maximum lateral displacement is 70.6 mm in Scenario 6, increasing by 2.3%. Thus, the excavation of Pit A before Pit E will help control the lateral displacement of the diaphragm wall at E-9. The maximum lateral displacement of the diaphragm wall at E-10 is about 21.5 mm in Scenarios 5 and 6 and about 23.8 mm in Scenarios 1 and 3, with a difference of 10.7%. Therefore, the maximum lateral displacement at E-10 is mainly related to the excavation process of Pit E. When Pit E is excavated in Stage 1, the maximum lateral displacement at E-10 will be the minimum, and vice versa.
It can be seen from Figure 8i,j that the maximum lateral displacement of the diaphragm wall at E-9 is about 69 mm in Scenarios 1, 2, and 3, and the maximum lateral displacement is 70.6 mm in Scenario 6, increasing by 2.3%. Thus, the excavation of Pit A before Pit E will help control the lateral displacement of the diaphragm wall at E-9. The maximum lateral displacement of the diaphragm wall at E-10 is about 21.5 mm in Scenario 5 and 6 and about 23.8 mm in Scenarios 1 and 3, with a difference of 10.7%. Therefore, the maximum lateral displacement at E-10 is mainly related to the excavation process of Pit E. When Pit E is excavated in Stage 1, the maximum lateral displacement at E-10 will be the minimum. The maximum lateral displacement at E-10 will be the maximum if Pit E is excavated in Stage 3.
In general, different excavation sequences have distinct coupling effects on the lateral deformation of the diaphragm walls at A-1, A-2, C-4, and E-10, have ordinary coupling effects on C-3, D-7, and E-9, and have almost no coupling effects at B-5, B-6, and D-8. It can be considered that the excavation sequence has diverse influences on the lateral deflection of the diaphragm wall. Unfortunately, it seems difficult to select the optimal construction sequence for controlling the deformation of the diaphragm wall.

5.2. Influence on Internal Support Axial Force

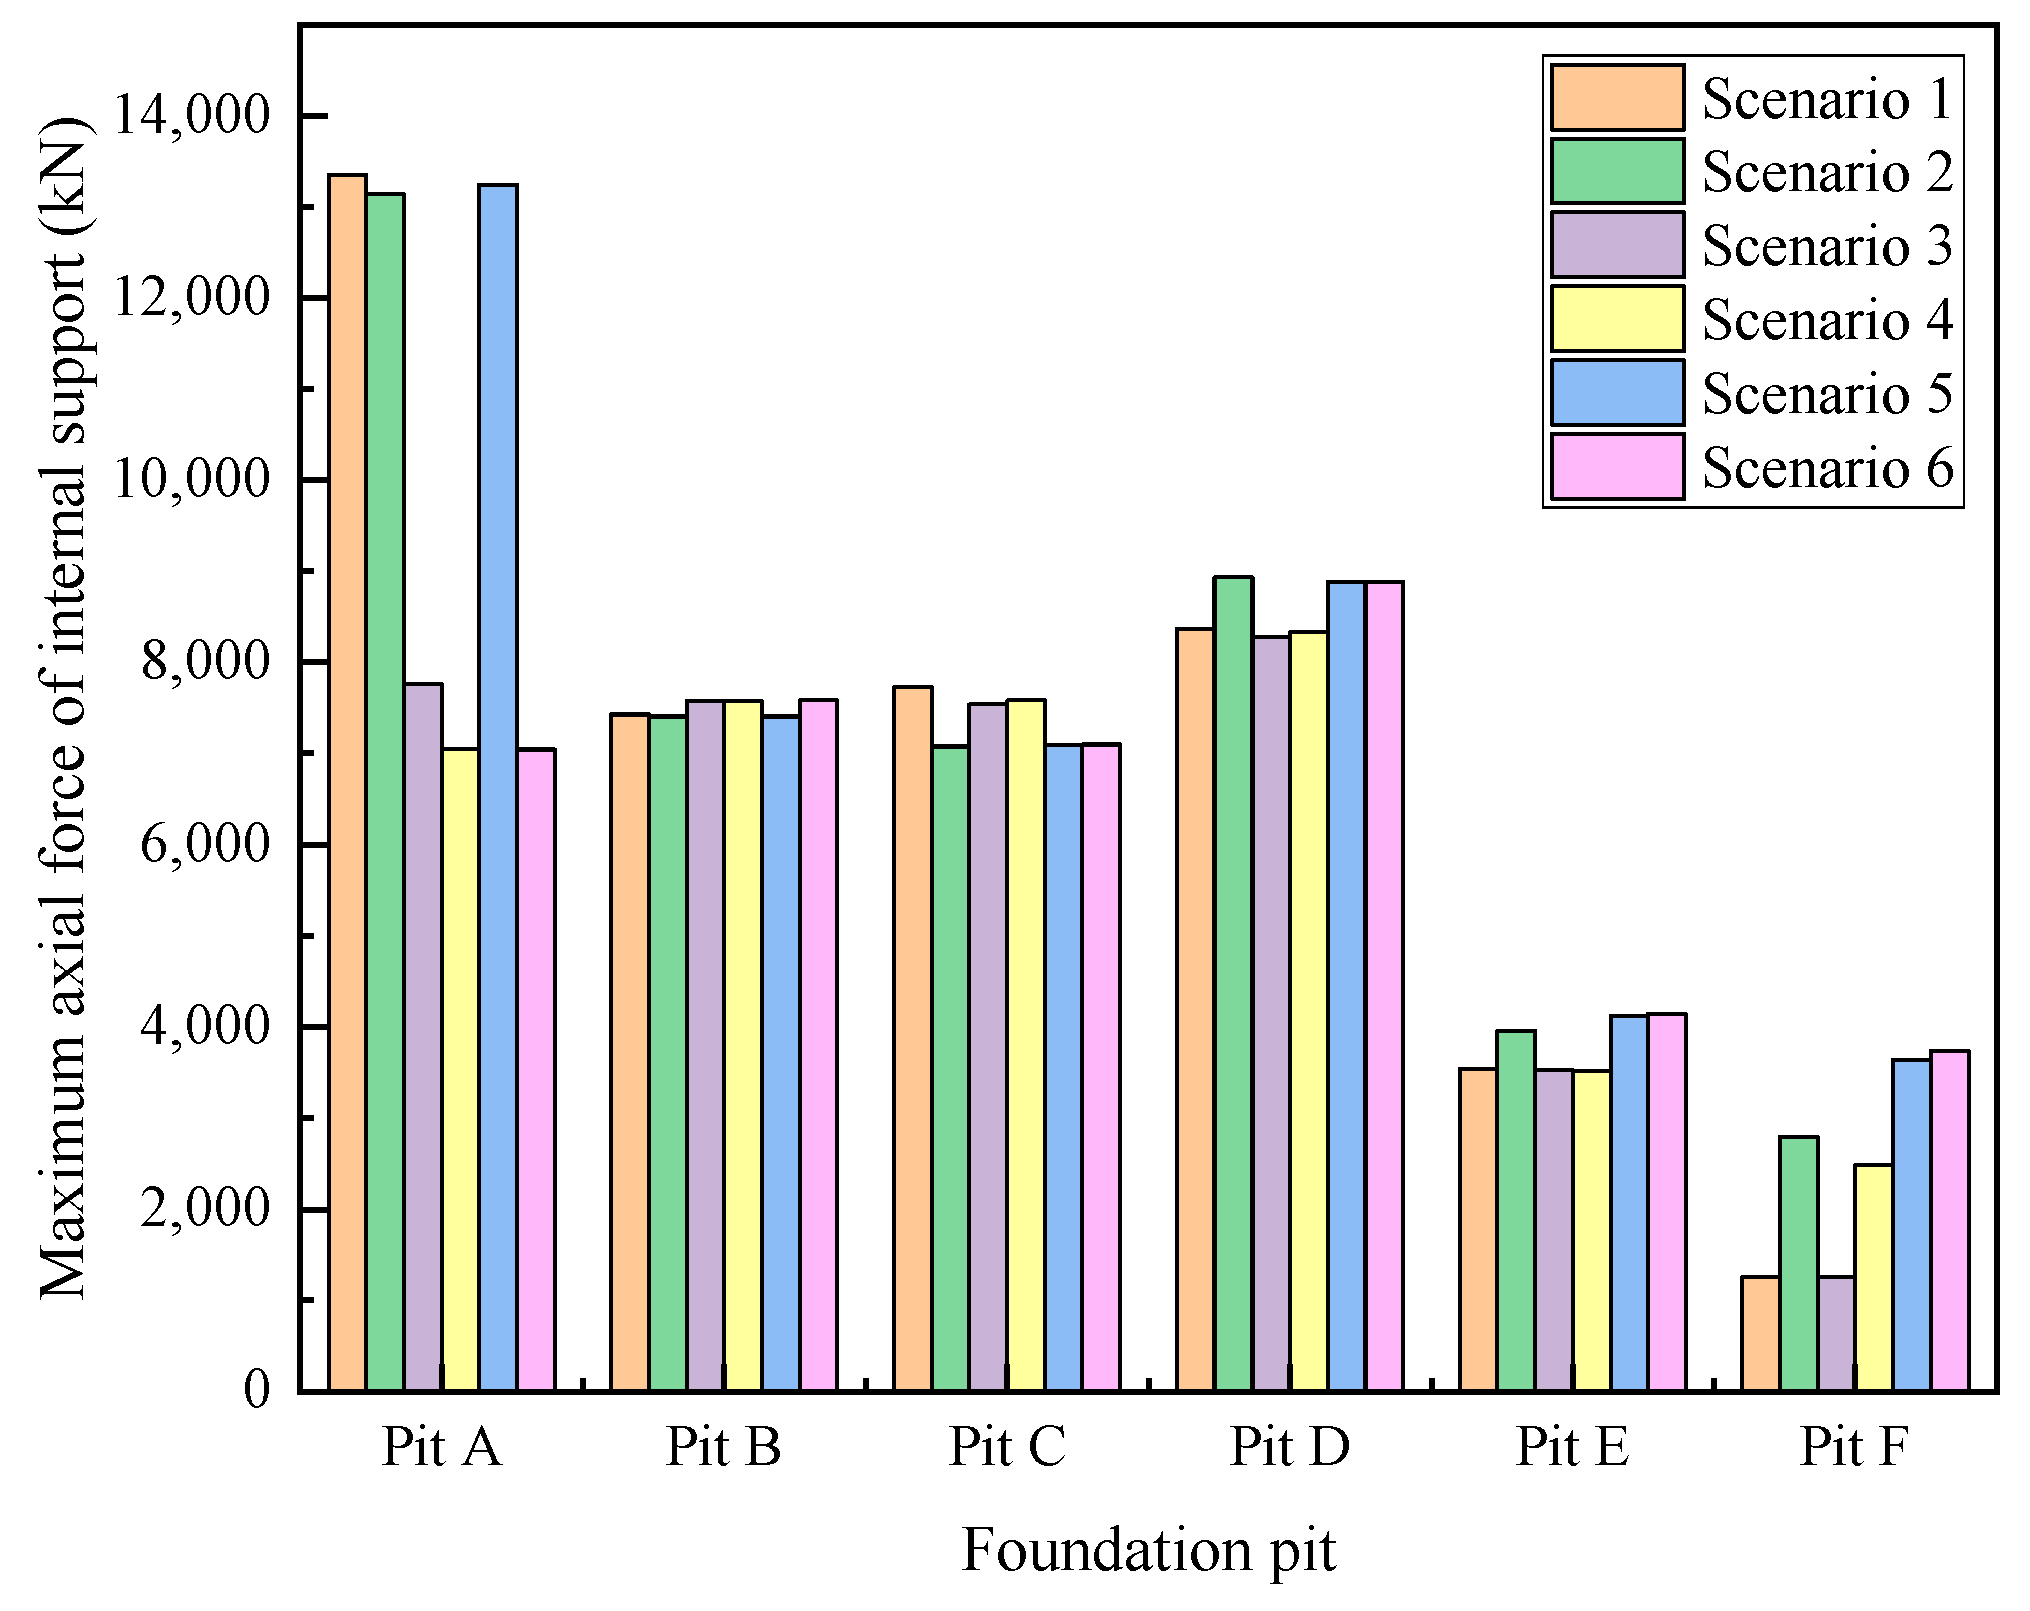
Figure 9 shows the maximum axis force of internal support in each foundation pit under different construction sequences. It can be seen from the figure that the construction sequence of the foundation pit group has the greatest impact on the maximum axial force in Pit A. In Scenario 1, the maximum axial force in Pit A is 13,350 kN, and the minimum is 7045 kN in Scenario 6, with a difference of 89.5%. Therefore, the excavation of Pit B and Pit C has the most obvious impact on the maximum axial force in Pit A, while the excavation of Pit D, Pit E, and Pit F has little impact.
In Scenarios 3, 4, and 6, the maximum axial force in Pit B is almost the same, which is greater than that in Scenarios 1, 2, and 5. This shows that the excavation of Pit A before Pit B will cause the maximum axial force in Pit B to increase, while the excavation of Pit D, Pit E, and Pit F will have negligible impact. In Scenarios 2, 5, and 6, the maximum axial force in Pit C is almost the same, which is less than that in Scenarios 1, 3, and 4, indicating that the excavation of Pit D, Pit E, and Pit F increases the maximum axial force in Pit C. However, the impact of Pit A excavation can be ignored.
The maximum axial force of support in Pit D and Pit E is almost the same in Scenarios 2, 5, and 6, and almost the same in Scenarios 1, 3, and 4, as well. The former is greater than the latter, which means that the excavation of Pit B and Pit C will increase the maximum axial force in Pit D and Pit E, while the impact of the excavation of Pit A can be ignored. The maximum axial force in Pit F is about 1260 kN in Scenarios 1 and 3 and about 3700 kN in Scenarios 5 and 6, with a difference of 193.6%. Therefore, the maximum axial force in Pit F is greatly affected by the construction sequence. The earlier Pit F is excavated, the more conducive it will be to controlling the maximum axial force.
In general, the maximum axial force of support in Pit A is more affected by the excavation of Pit B and Pit C. The maximum axial force in Pit B is mainly affected by the excavation of Pit A. The maximum axial force in Pit C is mainly affected by the excavation of Pit D and Pit E. The maximum axial force in Pit D and E is mainly affected by the excavation of Pit B and Pit C. In particular, the maximum axial force in Pit F is mainly affected by the excavation of Pit A, Pit B, and Pit C. From the perspective of reducing the axial force of support, the construction sequence of the foundation pit group should focus on reducing the axial force in Pit A. Therefore, Scenarios 3, 4, and 6 are optional for foundation pit group construction.

6. Conclusions

By establishing a three-dimensional finite element model, the whole process of staged excavation and support of a complex foundation pit group consisting of six foundation pits was simulated. This paper analyzed the deformation characteristics of the diaphragm wall and the variation characteristics of the axial force of internal support in each foundation pit during the staged construction of the foundation pit group. In particular, the coupling effects on the deformation of the diaphragm walls and the axial force of support were studied emphatically. Moreover, with the change in construction sequences, the variation characteristics of deformation of wall deflection and axial force of internal support were analyzed, and the differences in the coupling effects were compared. The following conclusions can be drawn:
  • In the original construction scenario (Scenario 1), the lateral deformation of the diaphragm walls at A-2 and C-4 showed the obvious coupling effect from the surrounding excavation, and the maximum change rates were 28.2% and 20.8%, respectively. The coupling effect on the lateral deformation of the diaphragm wall at A-1 and C-3 was not apparent, and the maximum change rates were 3.3% and 4%, respectively. However, the lateral deformation of the diaphragm wall at B-5 or B-6 was hardly affected by the excavation of other pits.
  • In Scenario 1, the maximum axial force in Pit A was far greater than that in other pits, and it increased by 89.6% after the construction of Stage 2, indicating a strong coupling effect. In contrast, the construction of Stage 3 had little impact on the maximum axial force in Pit A and a certain degree of coupling effect on the maximum axial force in Pit C.
  • After changing the construction sequence, the coupling effects on the lateral deformation of the diaphragm walls at A-1, A-2, C-4, and E-10 were obviously different. Among the six construction scenarios, the maximum change rates of maximum lateral deformation at the above positions were 15.9%, 7.5%, 15.4%, and 10.7%, respectively. However, the maximum change rates of maximum lateral deformation at other positions did not exceed 3%. The maximum change rates of the maximum axial force in Pit A and Pit F were 89.5% and 193.6%, respectively, and that in other pits was little affected by the construction sequence.
  • The coupling effect of foundation pit group excavation on the lateral displacement of the diaphragm wall near the existing building was more significant, and the deformation development should be focused on. The constraint of the concrete cushion can effectively reduce the lateral displacement of the diaphragm wall. In addition, the maximum axial force of the support in the pit adjacent to the existing building was obviously affected by the coupling effect of the adjacent excavations.
  • Due to the quantity and the irregular shape of the foundation pits in the foundation pit group, many different construction scenarios can be formulated. However, considering the impact of construction on traffic flow and the safety of the foundation pit group, the six scenarios studied in this paper are representative and reflect the coupling effects between each foundation pit during the construction of the foundation pit group, which can be used as a reference. The practical construction scheme must also be formulated by considering the on-site environment and various other factors.

Author Contributions

Conceptualization, Y.X.; methodology, Y.X., Q.Z. and Q.Y.; software, Q.Y.; formal analysis, X.Y. and Q.Z.; investigation, Q.Z. and Q.Y.; resources, X.Y. and Q.Z.; data curation, X.Y., Q.Z. and Q.Y.; writing—original draft preparation, X.Y. and Q.Z.; writing—review and editing, Y.X. and Q.Y.; supervision, L.T.; project administration, X.Y. and L.T.; funding acquisition, L.T. All authors have read and agreed to the published version of the manuscript.

Funding

This research was funded by the National Natural Science Foundation of China (Grant No. 52178384).

Institutional Review Board Statement

Not applicable.

Informed Consent Statement

Not applicable.

Data Availability Statement

The data are contained within the article.

Acknowledgments

The authors wish to express their gratitude to the reviewers and editors for their positive and constructive comments and suggestions on the manuscript.

Conflicts of Interest

The authors declare no conflict of interest.

References

  1. Goh, A.T.; Zhang, F.; Zhang, W.; Chew, O.Y. Assessment of strut forces for braced excavation in clays from numerical analysis and field measurements. Comput. Geotech. 2017, 86, 141–149. [Google Scholar] [CrossRef]
  2. Liao, S.-M.; Wei, S.-F.; Shen, S.-L. Structural Responses of Existing Metro Stations to Adjacent Deep Excavations in Suzhou, China. J. Perform. Constr. Facil. 2016, 30, 04015089. [Google Scholar] [CrossRef]
  3. Liu, H.; Li, K.; Wang, J.; Cheng, C. Numerical Simulation of Deep Foundation Pit Construction under Complex Site Conditions. Adv. Civ. Eng. 2021, 2021, 6669466. [Google Scholar] [CrossRef]
  4. Shi, J.; Fu, Z.; Guo, W. Investigation of geometric effects on three-dimensional tunnel deformation mechanisms due to basement excavation. Comput. Geotech. 2019, 106, 108–116. [Google Scholar] [CrossRef]
  5. Shi, X.; Rong, C.; Cheng, H.; Cui, L.; Wang, B.; Sun, S. Analysis on Deformation and Stress Characteristics of a Multibraced Pit-in-Pit Excavation in a Subway Transfer Station. Adv. Civ. Eng. 2020, 2020, 8844461. [Google Scholar] [CrossRef]
  6. Wang, Z.-Z.; Goh, S.H.; Koh, C.G.; Smith, I.F. An efficient inverse analysis procedure for braced excavations considering three-dimensional effects. Comput. Geotech. 2019, 107, 150–162. [Google Scholar] [CrossRef]
  7. Chen, S.; Cui, J.; Liang, F. Case Study on the Deformation Coupling Effect of a Deep Foundation Pit Group in a Coastal Soft Soil Area. Appl. Sci. 2022, 12, 6205. [Google Scholar] [CrossRef]
  8. Guo, L.Q.; Cheng, Y.G. Consideration on Group Excavation Engineering. Appl. Mech. Mater. 2013, 256–259, 315–319. [Google Scholar] [CrossRef]
  9. Li, M.-G.; Zhang, Z.-J.; Chen, J.-J.; Wang, J.-H.; Xu, A.-J. Zoned and staged construction of an underground complex in Shanghai soft clay. Tunn. Undergr. Space Technol. 2017, 67, 187–200. [Google Scholar] [CrossRef]
  10. Wang, J.H.; Xu, Z.H.; Wang, W.D. Wall and Ground Movements due to Deep Excavations in Shanghai Soft Soils. J. Geotech. Geoenviron. Eng. 2010, 136, 985–994. [Google Scholar] [CrossRef]
  11. Yang, Z.; Chen, Y.; Yan, C.; Azzam, R. Numerical Evaluation of Isolation Walls in Modifying Excavation-Induced Dis-placement Field. Arab. J. Sci. Eng. 2022. [Google Scholar] [CrossRef]
  12. Chen, R.P.; Li, Z.C.; Chen, Y.M.; Ou, C.Y.; Hu, Q.; Rao, M. Failure Investigation at a Collapsed Deep Excavation in Very Sensitive Organic Soft Clay. J. Perform. Constr. Facil. 2015, 29, 04014078. [Google Scholar] [CrossRef]
  13. Blackburn, J.T.; Finno, R.J. Three-Dimensional Responses Observed in an Internally Braced Excavation in Soft Clay. J. Geotech. Geoenviron. Eng. 2007, 133, 1364–1373. [Google Scholar] [CrossRef] [Green Version]
  14. Yang, Z.; Chen, Y.; Azzam, R.; Yan, C. Performance of a top-down excavation in shanghai: Case study and numerical ex-ploration. Eur. J. Environ. Civ. Eng. 2021, 26, 7932–7957. [Google Scholar] [CrossRef]
  15. Huang, M.; Liu, X.-R.; Zhang, N.-Y.; Shen, Q.-W. Calculation of foundation pit deformation caused by deep excavation considering influence of loading and unloading. J. Central South Univ. 2017, 24, 2164–2171. [Google Scholar] [CrossRef]
  16. Tan, Y.; Zhu, H.; Peng, F.; Karlsrud, K.; Wei, B. Characterization of semi-top-down excavation for subway station in Shanghai soft ground. Tunn. Undergr. Space Technol. 2017, 68, 244–261. [Google Scholar] [CrossRef]
  17. Feng, T.; Liu, L.; Tong, T.; Zhou, M. Numerical study on lateral wall displacement of deep excavation supported by IPS earth retention system. Undergr. Space 2017, 2, 259–271. [Google Scholar] [CrossRef]
  18. Wang, S.; Li, Q.; Dong, J.; Wang, J.; Wang, M. Comparative investigation on deformation monitoring and numerical simulation of the deepest excavation in Beijing. Bull. Eng. Geol. Environ. 2021, 80, 1233–1247. [Google Scholar] [CrossRef]
  19. Yang, J.; Kong, D. Deformation of deep and large foundation pit in soft soil of Fuzhou Subway. Arab. J. Geosci. 2020, 13, 36. [Google Scholar] [CrossRef]
  20. Dan, K.; Sahu, R.B. Estimation of Ground Movement and Wall Deflection in Braced Excavation by Minimum Potential Energy Approach. Int. J. Géoméch. 2018, 18, 04018068. [Google Scholar] [CrossRef]
  21. Zhou, N.; Vermeer, P.A.; Lou, R.; Tang, Y.; Jiang, S. Numerical simulation of deep foundation pit dewatering and optimization of controlling land subsidence. Eng. Geol. 2010, 114, 251–260. [Google Scholar] [CrossRef]
  22. Dong, Y.; Burd, H.J.; Houlsby, G.T. Finite element study of deep excavation construction processes. Soils Found. 2017, 57, 965–979. [Google Scholar] [CrossRef]
  23. Soomro, M.A.; Saand, A.; Mangi, N.; Mangnejo, D.A.; Karira, H.; Liu, K. Numerical modelling of effects of different multipropped excavation depths on adjacent single piles: Comparison between floating and end-bearing pile responses. Eur. J. Environ. Civ. Eng. 2021, 25, 2592–2622. [Google Scholar] [CrossRef]
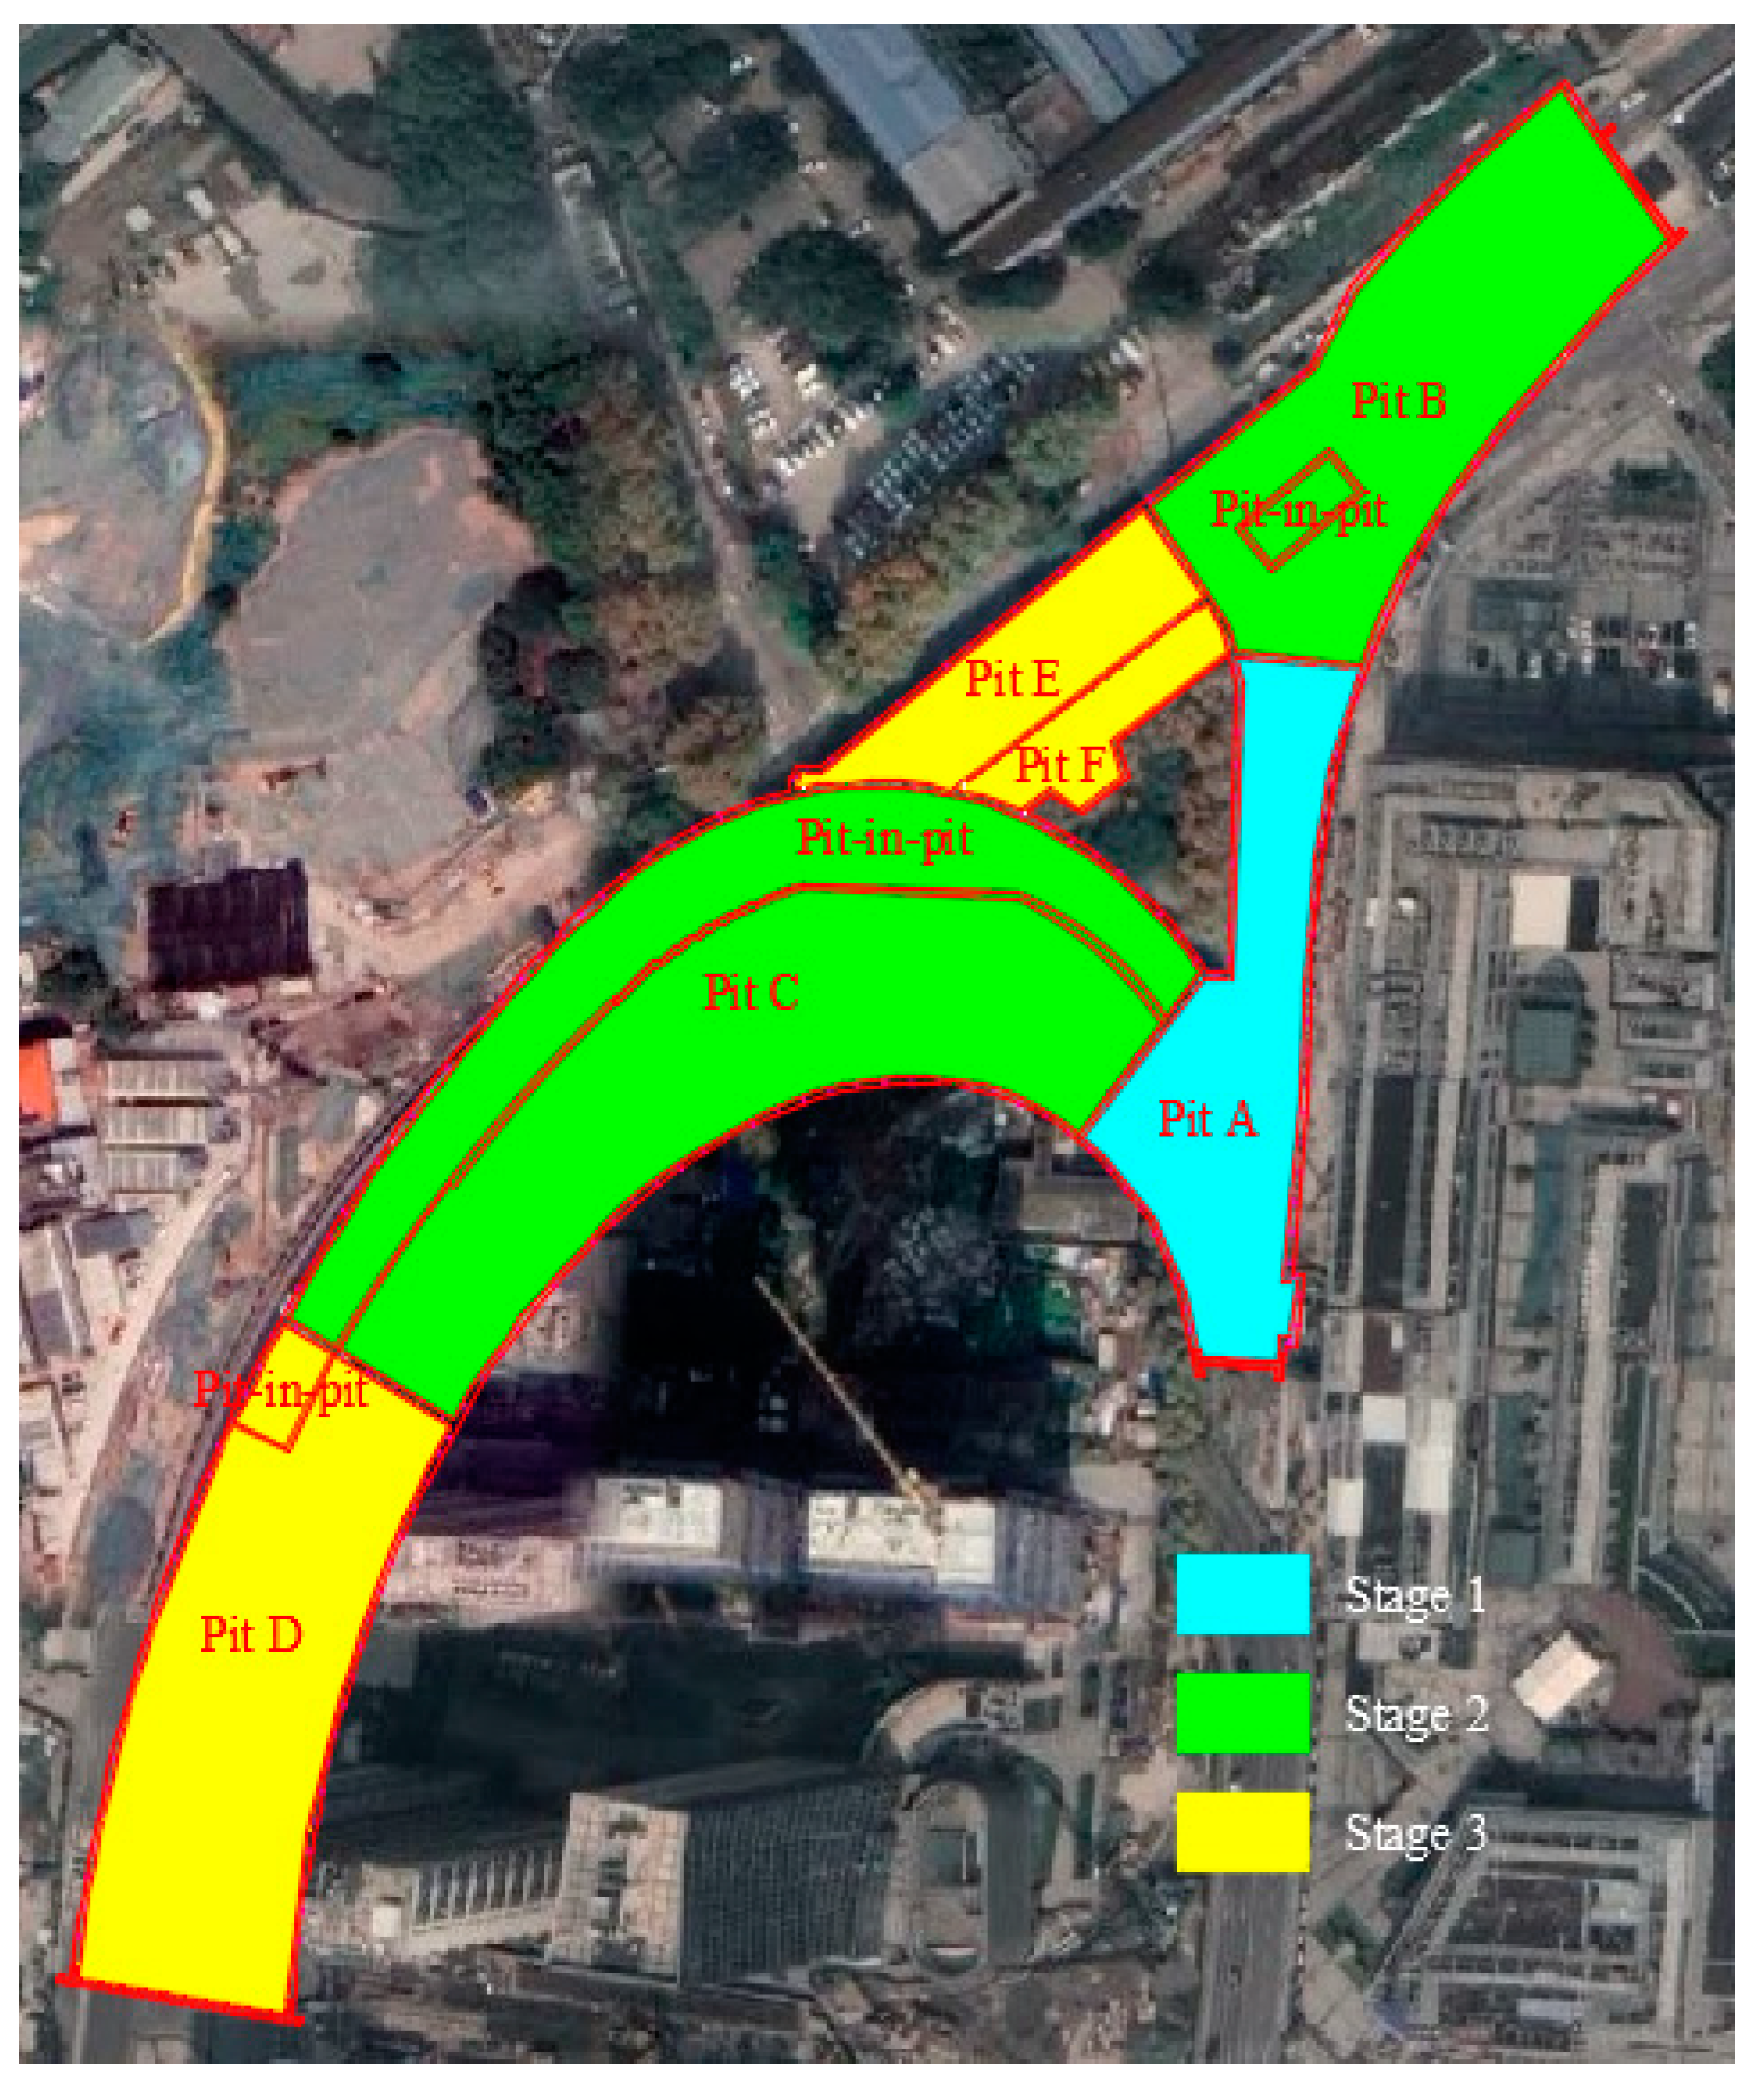
Figure 1. Satellite view of the foundation pit group.
Applsci 13 03263 g001
Figure 2. 3D finite element model.
Applsci 13 03263 g002
Figure 3. Lateral deflection of diaphragm wall.
Applsci 13 03263 g003
Figure 4. Maximum lateral deflection position (A-1, A-2, C-3, etc. are position numbers).
Applsci 13 03263 g004
Figure 5. Lateral deflection curve of diaphragm wall.
Applsci 13 03263 g005aApplsci 13 03263 g005b
Figure 6. Maximum axial force variation of internal support.
Applsci 13 03263 g006
Figure 7. Lateral deflection of diaphragm wall with six different scenarios.
Applsci 13 03263 g007aApplsci 13 03263 g007b
Figure 8. Lateral deflection curves under six different scenarios.
Applsci 13 03263 g008
Figure 9. Maximum axial force variation of internal support with different construction sequences.
Applsci 13 03263 g009
Table 1. Main physical and mechanical parameters of the soil/rock layer.
Soil/RockThickness (m)Unit Weight (kN/m3)Compressive Modulus (MPa)Poisson’s RatioCohesion (kPa)Friction Angle (°)Permeability Coefficient (cm/s)
Miscellaneous fill319904.10.3015122 × 10–3
Pain fill317903.770.3519162.5 × 10–5
Mucky silty clay2517603.570.3010.618.25 × 10–6
Clayey silt1317704.20.3510.819.84 × 10–6
Fine silt sand11184011.20.282.333.91.63 × 10–3
Limestone252750-0.3680040-
Table 2. Constitutive parameter of the soil layer.
Soil/RockCompression Index λSwelling Index κCritical State Parameter MInitial Void Ratio e0
Miscellaneous fill0.0950.0060.5430.98
Pain fill0.0830.0090.6070.99
Mucky silty clay0.1270.0080.6731.06
Clayey silt0.0810.0050.7350.90
Fine silt sand0.0540.0031.4180.72
Table 3. Constitutive parameter of the main structure.
Structure TypeWeight (kN/m3)Elastic Modulus (MPa)Poisson’s Ratio
Diaphragm wall253.15 × 1040.2
Concrete support253.25 × 1040.2
Steel pipe support782.1 × 1050.3
Concrete cushion252.55 × 1040.2
Retaining pile (equivalent wall)16.361.54 × 1040.2
Table 4. Simulated construction schedule.
Calculation StepConstruction StageConstruction Process
0 Initial stress equilibrium
1 Construction of surrounding buildings
2Stage 1Construction of diaphragm walls
3Dewatering (level 1)
4Excavation (level 1)
5Casting the struts (level 1)
6Dewatering (level 2)
29Stage 2Construction of diaphragm walls
30Dewatering (level 1)
31Excavation (level 1)
32Casting the struts (level 1)
33Dewatering (level 2)
48Stage 3Construction of diaphragm walls
49Dewatering (level 1)
50Excavation (level 1)
51Casting the struts (level 1)
52Dewatering (level 2)
Table 5. The selected construction processes.
Construction StageExcavation Depth
Stage 1–1Pit A is excavated to −15 m.
Stage 1–2Pit A is excavated to −29 m.
Stage 2–1Pit B and Pit C are excavated to −15 m.
Stage 2–2Pit B is excavated to −22 m and pit-in-pit is excavated to −29 m. Pit C is excavated to −23.8 m and pit-in-pit is excavated to −27.7 m.
Stage 3–1Pit D and Pit E are excavated to −15 m.
Stage 3–2Pit D is excavated to −22 m. Pit E is excavated to −23 m. Pit F is excavated to −4.5 m.
Table 6. Different construction sequence.
Scenario No.Construction Sequence
Stage 1Stage 2Stage 3
Scenario 1 (original)Pit APit B, Pit CPit D, Pit E, Pit F
Scenario 2Pit APit D, Pit E, Pit FPit B, Pit C
Scenario 3Pit B, Pit CPit APit D, Pit E, Pit F
Scenario 4Pit B, Pit CPit D, Pit E, Pit FPit A
Scenario 5Pit D, Pit E, Pit FPit APit B, Pit C
Scenario 6Pit D, Pit E, Pit FPit B, Pit CPit A
Disclaimer/Publisher’s Note: The statements, opinions and data contained in all publications are solely those of the individual author(s) and contributor(s) and not of MDPI and/or the editor(s). MDPI and/or the editor(s) disclaim responsibility for any injury to people or property resulting from any ideas, methods, instructions or products referred to in the content.