Abstract
This study aimed to determine the criterion validity of the ADR jumping photocell when compared to a motion capture system and to examine the within-session test–retest reliability of the instrument. Thirteen highly trained female volleyball players performed ten countermovement jumps (CMJ) with two minutes rest in-between trials. Jumps were recorded simultaneously by both devices to compare the outcomes. The main results showed significant mean differences between devices (10.6 cm, p < 0.001; ES = 0.9), high Spearman’s correlations (ρ = 0.95), weak CCC (0.25), and SEE = 0.92 cm. Bland–Altman’s plot indicated high systematic errors (10.5 cm), heteroscedasticity of error (slope = 0.026), and all values included among the limits of agreement. The within-session reliability (internal consistency) was very high (ICC = 0.96; CCC = 0.94; SEM = 1.18 cm; CV = 4.21%). In addition, the sensitivity of the instrument showed values of SWC = 0.33 cm. In conclusion, ADR jumping is a valid instrument for the estimation of CMJ in highly trained female volleyball players. Furthermore, the instrument is shown to be a consistent tool in the measurement of CMJ.
Keywords:
validation; error; countermovement jump; MoCAP; portable devices; infrared barrier; sensitivity; consistency 1. Introduction
Vertical Jump (VJ) performance can be considered one of the most important key factors for success in many sports, especially team sports, where there are numerous technical actions including countermovement vertical jumps [1,2,3]. In addition, the measure of VJ is frequently used to control lower body strength and power levels [4,5,6,7]. Thus, variations in VJ may indicate changes in sporting performance, fitness, or health [8,9,10,11] or may be used as an element for load quantification and fatigue monitoring [12].
Accurate estimation of the vertical jump (VJ) is crucial to prevent errors in exercise analysis, control, and prescription [13]. Jump height is defined as the distance between the center of mass (CoM) during standing and the apex of a jump, and there are various methods for calculating it [14]. These methods include the take-off velocity, impulse–momentum, and work–energy methods, which estimate jump height based on the velocity of the CoM at the instant of takeoff. Another method is the flight time method, which only requires measuring the time in the air between take-off and landing [15]. However, this method assumes that the position of the CoM is the same at takeoff and landing [16]. Motion capture has also been used to calculate CoM displacement during jumping, providing an approximation of the CoM if changes in body configuration occur [17,18]. Force plates are considered a reference element in estimating VJ due to their high resolution and reliability [19,20].
However, both systems have drawbacks that make their practical or ecological value limited due to their high cost, complex calibration processes, as well as the impossibility of measurements outside laboratory conditions. This means that their use is often limited to research and high-performance athletes and sports teams, who can afford these expensive technologies. [12]. In recent years, lower-priced instruments, such as accelerometers, jumping mats, or systems based on video recording, have been developed as an alternative to MoCAP and FP and have enabled physical activity and sports specialists to monitor their athletes [21,22].
Accelerometers can detect accelerations in all axes, allowing for the estimation of jump height through double integration, similar to force plates [23]. Inertial Measurement Units (IMUs) comprise accelerometers and are a convenient device for obtaining real-time data, but the accuracy of the obtained data may be affected by the sensitivity and error of the accelerometers [24]. The estimation of jump height based on flight time (FT) has led to the development of various instruments, such as jump mats and linear position or electronic transducers, but these methods require further processing and may be expensive or not usable on all surfaces [25,26,27,28,29,30,31]. Jump mats are a low-cost and reliable option for estimating jump height from the time between take-off and landing, but they can only be used on specific surfaces, limiting their ecological validity [18,20,32,33,34].
Finally, photocells have traditionally been used for the measurement of in-line speed, but they are also being developed for time-of-flight capture, specifically, and their use has become widespread along with that of FP [35], as their logistics and manageability have significantly improved at cheaper prices [36]. In this way, photocells are shown to be valid instruments for VJ estimation when compared to MoCAP systems and FP [20,37]. The main advantage of these systems is that they allow the acquisition of data from several subjects on the same surfaces where physical activity is to be performed, adding ecological value or content validity to the measurement process [38]. These devices consist of two bars: an emitter and a receiver that can be placed on a variety of grounds [39]. The Optojump photoelectric system is a technology that uses an infrared barrier to estimate VJ height. It has been shown to be valid and reliable for estimating VJ height compared to force plates when flight time is used for estimation [39,40]. However, when estimating jump height from the double integration of reaction forces using force plates as the reference instrument, the system’s validity is limited, and high systematic errors (10.4 cm) have been found [41]. The Wheeler jump photoelectric sensor has been demonstrated to be a valid and reliable device for estimating VJ height based on flight time. It has been found to have high or almost perfect correlations when compared to other methods such as jump mats, mobile applications, and the Optojump infrared barrier [42]. However, the sensor has not been validated against a true gold standard such as a motion capture system or force plates.
The ADR jumping infrared barrier sensor (ADR, Toledo, Spain) is an economical and easy-to-use tool for estimating the vertical jump. It uses a photoelectric barrier and wireless technology to send data directly to a smartphone or tablet. The validity of the ADR jumping was determined against a jump mat, with strong correlations (r = 0.98) for the countermovement jump (CMJ) and high ICC (0.89), determining the device to be valid and reliable. However, there are no studies that compare the values obtained by ADR jumping against a MoCAP or FP [43].
The purpose of this study was twofold: (1) to determine the criterion validity of the ADR jumping infrared barrier when compared to a MoCAP system in the measure of CMJ, and (2) to examine the reliability of the instrument understood as its internal consistency in the within-session test–retest for consecutive attempts. It is hypothesized that the ADR jumping infrared barrier is a valid and reliable instrument when compared to a standard instrument based on motion capture.
2. Materials and Methods
2.1. Participants
Thirteen highly trained female volleyball players [44] from the Spanish Superliga 2 voluntarily participated in this validation study (age 22.2 ± 3.3 y, height 1.72 ± 0.06 m, body mass 64.1 ± 7.3 kg, fat percentage 16.5 ± 2.5%, body mass index 21.6 ± 2.1 kg/m2, training experience 8.8 ± 2.0 y). All participants signed an informed consent document in which they were informed of the characteristics of the intervention, as well as the scientific use of the data obtained in the intervention as specified by the Ethical Principles for Medical Research Involving Human Subjects of 1975 (revised in Fortaleza, Brazil in 2013) in the Declaration of Helsinki of the World Medical Association (WMA). This research was approved by the ethics committee of the University of Alicante (UA-2018-11-17).
All participants met the inclusion criteria, which were defined as: being female; age over 18 years, with at least 3 years of volleyball experience; and being familiar with the CMJ execution. On the other hand, the exclusion criteria that prevented them from being eligible to participate in this study were: presenting a current or previous pathology that would imply a medical contraindication for physical activity, presenting a previous musculoskeletal injury or one acquired during the development of the experimental phase, not participating in all the interventions that make up the study, and ingesting alcohol or doping substances in the 48 h before the performance of the tests.
2.2. Instruments
2.2.1. Optitrack Motion Capture System
The motion capture system (Optitrack motive, Corvallis, OR, USA) was set up with six Optitrack Flex 3 cameras (Optitrack motive, Corvallis, OR, USA), which allow markers to be tracked in 3D. The marker is placed between the L4 and L5 lumbar vertebrae of the subjects, near the center of mass. The marker consists of a reflective sphere capable of reflecting infrared light in the same direction in which it is received. The light is emitted by the 26 light-emitting diodes (LED) surrounding the camera lens (IR 850 nm). All six cameras worked at 100 Hz, with a shutter speed of 20 µs, achieving an overall resolution of 0.001 m. The height of the VJ was determined by the difference in the position on the vertical axis of the marker before the execution of the jump, during the resting phase H2, and at the highest point recorded in the flight phase H1 (Figure 1).
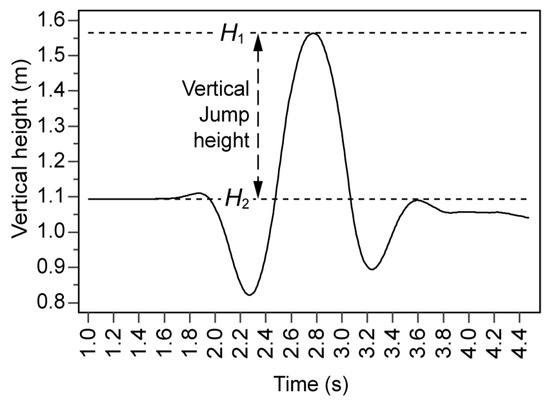
Figure 1.
Determination of jump height from the data obtained by the MoCAP system by the difference between the initial height (H2) and the highest point registered (H1).
The signal was sent via a USB cable connection to a computer where it was collected and interpreted using the Motive Tracker 2 software. This software synchronizes and calibrates the image collection systems, as well as exports the data obtained in the CSV format for subsequent analysis in a spreadsheet to determine the JH through the difference in positions (Figure 1).
2.2.2. ADR Jumping Infrared Barrier
ADR jumping is a photocell consisting of two boxes (12 × 5 cm) connected to each other by a cable. One of the boxes is an emitter of an Infrared (IR) beam, and the second box acts as a receiver. The beam is emitted by a diode with a wavelength of 940 nm and 40 mW of radiation flux, and the ADR includes a filter to avoid interference from other radiation sources. The data recorded by the instrument is sent via Bluetooth to a tablet where it is recorded using the ADR jumping application. The device comprises a liquid crystal display (LCD) screen that allows the data to be observed in real-time, which means that it can be manually annotated if the wireless connection to the application fails. The VJ estimation is performed by determining the take-off and landing instant (moments when the beam is no longer cut and returns to the cut, respectively). This time interval will be considered as the FT and the JH will be estimated from it, according to the equation JH = FT2·g/8, where g is gravity acceleration (9.8 m/s2). In addition to the FT, the application automatically provides the values of jump height, contact time, and the reactive strength index.
2.3. Experimental Procedure
The procedure was carried out in two sessions separated by seven days each in the sports science laboratory of the University of Alicante. All participants performed the tests at the same time of the day to avoid possible effects associated with circadian rhythms, as well as at the same temperature of 23 °C. In the first test session, participants were familiarized with the experimental protocols and anthropometric measurements were taken. In the second test session, the following procedure was performed: first, a standardized warm-up of five minutes of continuous running was performed, followed by three minutes of dynamic range of motion exercises, and then two minutes of familiarization jumps in which subjects were instructed in the initial and final positions of the CMJ. Second, the warm-up was followed by four minutes of rest during which the marker was placed for tracking by the MoCAP system, and the jumping protocols were reviewed. Finally, subjects performed 10 CMJ jumps with two minutes between each attempt to avoid fatigue effects [45].
To avoid displacements in the transverse and frontal plane, the jumps were performed on a bounded surface of 29.2 × 42 cm, meaning that the take-off and landing phases were executed completely within the boundaries. At the lateral ends of the jumping surface, the emitter and receiver boxes were positioned so that the center of the boxes were aligned with the phalanges at the time of take-off and landing (Figure 2).
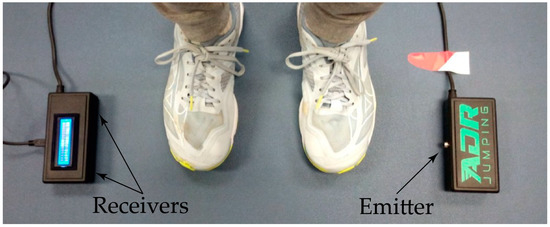
Figure 2.
ADR jumping arrangement with the emitter facing the forefoot.
The CMJs were performed with a quick descent to a depth self-selected for each participant [46,47], followed by the quickest possible ascent to achieve take-off. All tests were performed with hands placed on the iliac crests in the akimbo position [48] to avoid extra variability generated by arm action. Participants were instructed to jump as high as possible on each attempt and to land tiptoe by imitating the position adopted by the ankle joint in the take-off phase to minimize the error produced by variations in the angle of ankle flexion in the landing phase [49]. Jumps were always supervised by an instructor to avoid execution errors. Attempts were considered null if subjects did not land within the established limits, if participants did not land on tiptoe, or if they separated their hands from the iliac crests in any phase of the jump. All records were collected simultaneously by both measuring instruments: the ADR jumping photocell and the MoCAP Optitrack system.
2.4. Statistical Analysis
Descriptive data are shown as mean and standard deviations. Normality was checked using a Kolmogorov–Smirnov test, resulting in a non-normal sample for MoCAP (p = 0.011).
2.4.1. Criterion Validity
To determine the degree of agreement and the presence of systematic error between the two instruments, the Lin’s concordance correlation coefficient (CCC) was calculated. This statistic is expressed as ρc = ρ × Cb, providing information on how close the pairing of the height data in both instruments is (ρ, precision) and how close to ideality the relation is (Cb, accuracy), where a straight-line x = y would be obtained [50]. The results obtained are classified as: ≤ 0.9 (poor), 0.90–0.95 (moderate), 0.95–0.99 (substantial), and ≥0.99 (near perfect) [51]. Spearman’s bivariate correlation coefficient (rs) was also determined in this study as a means of conducting a correlational analysis. The use of this non-parametric equivalent to Pearson’s coefficient is justified due to the small sample size and the non-normal distribution of the sample [52]. For interpretation, the following criteria were used ≤0.1 (trivial), 0.10–0.29 (low), 0.30–0.49 (moderate), 0.50–0.69 (high), 0.70–0.89 (very high), and ≥0.90 (near perfect) [20,53].
For the regression analysis, the Passing and Bablok regression [54] for non-parametric samples was used to test for the existence of a linear relationship between the paired data from both instruments. The relationship was established by the equation y = ax + b, whereby the values of a variable y can be predicted as a function of another variable x, where a represents the slope, in which its ideal value would be 1. This parameter provides information on the proportional differences between the two methods. On the other hand, b is the cut-off point with the x-axis (intercept) in which its ideal value, in this case, would be 0 and represents in a quantifiable way the systematic differences between the two devices. The standard error of estimate (SEE) was also calculated. Low values of SEE indicated that the points were closer to the regression line and, therefore, the magnitude of the estimated error was smaller.
To study the existence of a systematic error, significant differences in the values of the ADR jumping and the criterion instrument were calculated using a Wilcoxon test for paired samples and the effect size (ES) was determined as r = Z/√n [55]. The differences expressed as ES were interpreted according to Hopkins et al. [56]: trivial (<0.19), small (0.2–0.59), moderate (0.6–1.19), large (1.2–1.99), very large (2.0–3.99), and huge (>4.0).
Bland–Altman plots are used to assess the agreement between the height data of the two paired devices, allowing for the visualization of the differences between the two methods, and the extent to which the differences vary depending on the magnitude of the measurement. The limits of agreement (LoA) are defined as the interval within which the differences between the two methods of measurement are expected to fall with 95% confidence. LoA are calculated using the SD of the differences as LoA = ±1.96 × SD and represent the range within which 95% of the observed differences between the two methods of measurement are expected to fall. The maximum allowable differences were calculated from the coefficients of variation (CV) of each method according to the expression (CV2method1 + CV2method2)1/2 [57], interpreting that the methods are not in disagreement if the 95% confidence limits of the upper LoA are below the maximum allowable difference and the lower LoA is above the maximum allowable difference [58].
The magnitude of the error was estimated by calculating the standard error of measurement (SEM); this statistic was calculated as SEM = Sd/√2, where Sd is the standard deviation of the difference of the values [59]. This statistic provides information on the error in absolute terms from the analysis of the dispersion of the values around the true value [60]. Relative reliability was established by the coefficient of variation (CV) calculated from SEM as CV = (SEM/mean).
2.4.2. Reliability
The regression analysis, Bland–Altman, and CCC were used again, in this case, to determine the reliability of the instrument in the measurement of consecutive vertical jump attempts in the same session. In addition, the intraclass correlation coefficient (ICC) was determined to study the intrasession reliability of ADR jumping (taking as a reference that the method is reliable if the ICC > 0.90 and CV < 5%) [61]. Sensitivity was calculated using the smallest worthwhile change (SWC). The SWC allows determining which values represent the minimum improvements that have a practical impact and was calculated from the SEM as 0.2·SEM·√2 [62,63]. Knowing that SWC can determine the signal-to-noise ratio, if the signal-to-noise ratio (SWC/SEM) is greater than 1 then the data can be considered reliable [64].
The sample size was calculated for a statistical power of 80%. A minimum of 250 jumps (α = 0.1, two-tailed) was determined using G*Power (v3.1.9.7, Heinrich-Heine-Universität Düsseldorf, Düsseldorf, Germany). To accomplish this number of jumps without inducing fatigue, the 13 participants performed 10 CMJ, resting 2 min between attempts in two sessions separated by 7 days [65,66], resulting in 260 valid jumps.
Statistical analysis was performed using the MedCalc Statistical Software version 20.100 (MedCalc Software Ltd., Ostend, Belgium) and the validity and reliability analysis spreadsheet developed by W. G. Hopkins [67].
3. Results
3.1. Criterion Validity of the ADR Jumping
Table 1 shows the values of Spearman’s correlation coefficient, Lin’s concordance correlation coefficient, and the results of the Wilcoxon test for paired samples between the ADR jumping photocell and the MoCAP criterion instrument, showing an almost perfect correlation value. In addition, CCC values indicate a weak correlation of concordance. There are also significant differences between the paired data of the heights of both instruments, with a mean difference between the two of 10.6 cm and a moderate ES (0.9).

Table 1.
Mean, the difference of means, significant differences between means and Spearman correlations, and agreement of ADR jumping and MoCAP.
From the analysis carried out through the Passing and Bablok regression (Figure 3), a SEE of 0.92 cm can be observed. In terms of systematic error, the fit equation obtained is expressed as HMoCAP = 10.921 + 0.991·HADR (cm). This equation allows to determine the degree of linear association between ADR jumping and MoCAP. In this case, a very strong positive linear association is observed, since the slope of the line is close to the unit (0.991) that represents the perfect association. Thus, the values of ADR jumping increase or decrease proportionally to those of MoCAP when estimating the VJ. This strong association is supported by the correlation values appreciated, since Spearman’s correlation coefficient was near perfect (rs = 0.95; p < 0.0001), showing no significant difference (p = 0.37) with the linearity condition in the Cusum test [54].
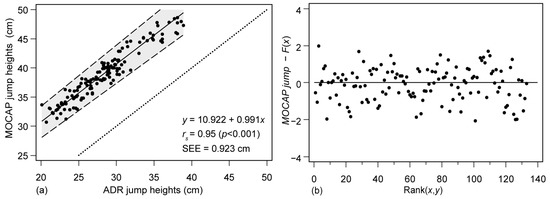
Figure 3.
Correlation analysis between the MoCAP system and the ADR jumping photocell through Passing and Bablok regression and residuals plot. (a) The continuous line represents the regression line; the shaded area represents the confidence intervals for 95% of the regression line; the pointed line is the x = y line; rs which represents Spearman’s correlation coefficient; SEE = Standard Error of Estimate; (b) Residuals plot. No trends are discernible; thus, linearity is assumed.
Observation of the Bland–Altman plot (Figure 4) shows a LoAlow of 7.99 cm (95% CI of 7.61–8.37 cm) and a LoAupper of 13.07 cm (95% CI of 12.69–13.45 cm). The systematic error found is 10.53 cm, with no proportional error provided (slope = 0.026, p = 0.29). The maximum allowable differences were determined as ±19.3 cm, with lower and upper LoA included within this range (not in Figure 4).
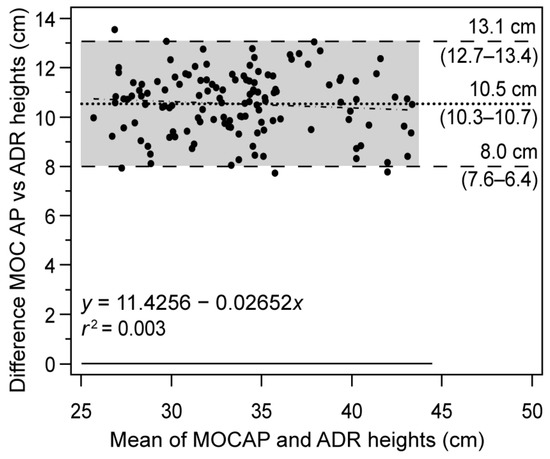
Figure 4.
Bland–Altman plot for the study of the validity of the jump height obtained by the ADR jumping photocell versus a MoCAP Optitrack system. Dotted line: mean of the differences (systematic error); shaded areas: confidence intervals for 95% of the mean and LoA; continuous line: the line of perfect agreement (difference 0); plots and dashed line: the regression line of differences; Mean: mean of differences; SD: standard deviation.
3.2. Reliability of the ADR Jumping
Within-Session Test–Retest Reliability
The test–retest reliability on a single day (internal consistency) [59] was calculated from the data obtained from the first 5 jumps, and corresponding results were produced for consecutive jump pairings (Table 2). The ICC values indicated test–retest correlations that were interpreted as near perfect consistencies (ICC = 0.94–0.98) for the within-session test–retest reliability. On the other hand, the CCC also showed high values of (CCC = 0.97), having very high precision and near perfect accuracy values (ρ = 0.94 and Cb = 0.99). The CVs were similar (4.21%).
Table 2.
Within-session test–retest reliability for the ADR jumping photocell between five trials.
In terms of noise, the SEM values were 1.18 cm (0.70 cm–1.37 cm) on average for the forefoot. Furthermore, the signal-to-noise ratio was less than unity in both cases, implying that the noise was greater than the minimum change in practical interest.
Internal consistency between consecutive attempts was analyzed using the Bland–Altman analysis (Figure 5), which showed that all points were within the upper and lower LoA. The systematic error showed values ranging from −0.7 to 0.04 cm.
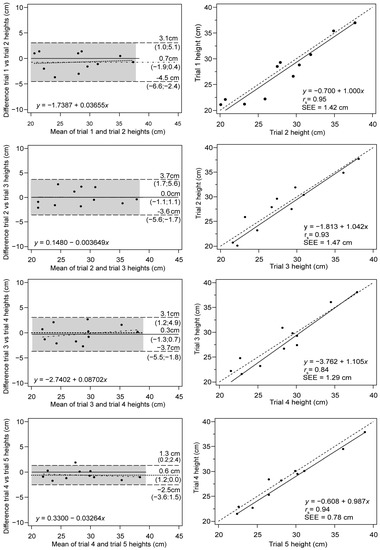
Figure 5.
Within-session consistency for consecutive trials. (Left) Bland–Altman plots for consecutive pairs of jumps between ADR and MoCAP. The pointed line: the mean of the differences (systematic error); dashed lines: the upper and lower LoA (random error); the continuous line: the ideal agreement; the dashed and dotted line: the regression line of the differences (a proportional error); Mean: mean of the differences; SD: standard deviation; dashed area: confidence intervals for 95% of the LoAs and mean. (Right) Passing-Bablock regression for consecutive trials. The dotted line: linear regression; SEE: standard error of the estimate.
On the other hand, the proportionality of the error was negligible as the slopes observed for the fit lines varied from 3.10−3 to 0.08. The observation of regression plots showed very strong and near perfect linear relationships between consecutive trials (0.84–0.95), with slopes very near unity and intercepts ranging from −0.6 to −3.7 cm.
4. Discussion
This study aimed to test the criterion validity of the IR photocell ADR jumping device against a MoCAP system in the estimation of the CMJ, as well as to determine the reliability in the within-session test–retest of the device. To the best of our knowledge, this is the first study to validate the ADR jumping device against a 3D MoCAP system. The main results of this research show that the ADR jumping photocell is a valid instrument for measuring CMJ.
In terms of criterion validity, the Wilcoxon test for paired samples showed significant differences concerning the MoCAP system (10.6 cm), with moderate ES. Likewise, near perfect correlations (rs = 0.95) between the two devices were also observed. The correlations obtained were in the same line as those obtained by other studies comparing photoelectric sensors with jumping mats or force platforms [37,38,42]. Otherwise, the differences obtained in these studies (systematic error) were smaller than those found by Attia et al. and Rago et al. [20,41]. However, these studies did not use MoCAP as a reference system, and, therefore, the comparisons would not be very adequate. Although all the methods have been validated and their reliability tested, a systematic error between the force or jumping platforms and the MoCAP systems was observed [49], which can add to or subtract from that already obtained from other sources. The results of González-Conde et al. (2022) revealed a substantially reduced systematic error of 0.84 cm, compared to the systematic error found in the present study, despite having similar correlation values (r = 0.98) and both studies utilizing the flight-time method to calculate jump height. This could indicate that systematic errors are lower in studies utilizing the flight-time method compared to those utilizing force plate as a criterion instrument [40,68]. Similarly, the degree of validity found is in line with that found for other devices that use FT to estimate VJ height such as jump mats [32,69] or photogrammetry [26,28,70,71]. Regarding the analysis of the Bland–Altman plots, LoA ranging from 8 cm to 13 cm were observed, and all points were within the LoA, indicating a small dispersion in the differences. Furthermore, the LoA were within the maximum allowed differences between methods, and no heteroscedasticity was observed, discarding the existence of proportional error in the measurement.
It should be added that the correlations obtained from the Passing–Bablok regression model between ADR jumping and MoCAP were almost perfect, with random error values of SEE 0.95 cm, which can be quantified as small, according to the standardized SEE of 0.2 [62]. Similarly, a fitting equation was obtained showing an intercept of 10.92 cm (systematic error) and a slope of 0.991, very close to linearity meaning proportional error, similarly to other photocells [32,37]. The CCC values indicated poor correlations (0.25), largely due to the lack of precision (ρ) derived from the systematic error.
The differences found between ADR jumping and MoCAP may be due to the way the two devices perform the estimation. While MoCAP tracks a marker located close to the centre of mass, photocells are based on FT, and, therefore, the detection of the exact landing and take-off point is crucial. Therefore, factors such as horizontal displacement during the flight phase; the flexion of the ankle joint [38,40]; hip or knee in the landing phase; thickness and flexibility of the contact surface [49]; and the angle of incidence of the photocell with the foot, which can cause the signal to continue to be captured after take-off [40], can be sources of error.
Either way, the ADR jumping can be considered, in general terms, as a valid tool, interpreting this criterion validity according to the values observed and the coherent results with other studies carried out on photocells. In any case, the criterion validity may have been affected by the way the emitted infrared beam was cut by the foot, and it would be interesting to study the effect of this variable in future research. The high systematic bias found could imply that the CMJ height measurements were not interchangeable between the ADR jump and the MoCAP system (gold standard). However, in this study, it has been possible to determine the adjustment equation HMoCAP = 10.921 + 0.991·HADR (cm) that allows predicting the MoCAP heights from the ADR jumping values. This equation allows the observed systematic error to be corrected, thus the data obtained by ADR can be easily compared with those obtained by MoCAP.
Focusing attention on the internal consistency of ADR jumping (whithin-session validity), this study has shown high consistency in the measurement for the ADR jumping photocell, observing near perfect ICC values and high CCC values for the mean of consecutive pairs of trials. Additionally, it was observed that the instrument showed near perfect correlations in all pairings (ICC of 0.94–0.98 and CCC of 0.92 to 0.97) and random errors of SEM = 1.18 cm. These results are in agreement to other studies that found near perfect ICC for Optojump photocells (ICC = 0.98; CV = 2.2% and SEM = 2.43 cm) [40], the Wheeler Jump photoelectric sensor (CV = 1.5% and SEM = 1.33 cm) [42], Fijump (ICC = 0.97; CV = 2.3% and SEM = 1.30 cm) [37], or the ADR jumping itself that has ICC values of 0.89 and a SEM of 0.7 cm. On the other hand, the SEE values observed for ADR jumping are larger than those observed for the Fitjump device (1.10–1.60 cm) [37]. In contrast, it should be noted that consistency was examined from data from sessions separated by 7 days (inter-session reliability) in these studies, which may explain the lower ICC observed in other studies [43], as variability may increase due to biological or environmental factors as the time interval between repetitions increases [1,72].
Finally, the sensitivity of ADR jumping showed SWC values of 0.33 cm. As can be seen, the SEM noise is greater than the minimum change in practical interest, thus the reliability of this device may be questioned in those populations in which very small changes affect performance, such as highly trained athletes.
Limitations
The limitation of using a sample of highly trained women only in this study should be considered when extrapolating the results to other populations. Further studies evaluating the criterion validity and reliability of the instrument in diverse populations (including gender, age, and training level variations) are recommended for a more comprehensive understanding of its utility. In addition, jump height was calculated in our study as the difference between the CoM position at the apex of the jump and its position during standing, using a sacral marker in the pelvis as an approximation of the CoM. While a single marker serves as a good approximation of the CoM [73], future studies should aim to enhance the accuracy of CoM tracking. Three-dimensional MoCAP allows calculating the actual CoM by tracking the position and orientation of body segments of the whole body. Alternatively, the use of force plates can determine the vertical jump height through the measurement of reaction forces generated during takeoff. This method provides a more comprehensive understanding of the body’s movements and can greatly improve the accuracy of CoM analysis.
The fact that our results showed a bias of 10.6 cm photocells with respect to motion capture is explained by the different methods used to measure jump height. The flight-time method underestimates jump height by approximately 10 to 12 cm [74,75], compared to methods that more directly determine jump height [15,75,76], such as motion capture. In our study, the ankle extension amplitude was not considered in the calculation of jump height as every athlete was monitored to perform with ankle and knee joints fully extended at take-off and landing. However, jump height was computed as the distance between CoM during standing and the apex of the jump, contrary to the distance between CoM at take-off and the apex [77]. Wade et al. [49] reported that the displacement of heel lift during takeoff influences the jump height measures obtained using the flight-time method, which can account for the observed systematic bias in our study.
5. Conclusions
Our study has shown that the ADR jumping photocell is an accurate method for estimating CMJ in highly trained female volleyball players of the Spanish Superliga 2, as long as the correction equation HMoCAP = 10.921 + 0.991·HADR (cm) is used to address the systematic bias identified. In this simple way, CMJ height data can be obtained interchangeably with MoCAP data, thus users may have jump height values that can be exchanged or compared with MoCAP data. Furthermore, the instrument is shown to be a consistent tool in the measurement of a within-session CMJ.
From a practical point of view, ADR jumping is recommended for use by physical activity and sports specialists as a valid and reliable tool for the assessment and control of CMJ height, considering the relevant fitting equations if the data captured are to be compared with those obtained by other measuring instruments.
Author Contributions
Conceptualization, A.P.-T.; Formal analysis, L.V.-G. and A.P.-T.; Funding acquisition, J.M.J.-O.; Investigation, L.V.-G. and J.O.-C.; Methodology, J.O.-C.; Project administration, A.P.-T. and J.M.J.-O.; Resources, A.P.-T.; Validation, J.O.-C. and J.M.J.-O.; Writing—original draft, L.V.-G. and J.O.-C. Writing—review and editing, L.V.-G. and J.M.J.-O. All authors have read and agreed to the published version of the manuscript.
Funding
This work was supported by Generalitat Valenciana (grant number GV/2021/098).
Institutional Review Board Statement
The study was conducted in accordance with the Declaration of Helsinki and approved by the Institutional Review Board of the University of Alicante (IRB No. UA-2018-11-17).
Informed Consent Statement
Informed consent was obtained from all subjects involved in the study.
Data Availability Statement
The data presented in this study are available on reasonable request from the corresponding author.
Conflicts of Interest
The authors declare no conflict of interest.
References
- Claudino, J.G.; Cronin, J.; Mezêncio, B.; McMaster, D.T.; McGuigan, M.; Tricoli, V.; Amadio, A.C.; Serrão, J.C. The Countermovement Jump to Monitor Neuromuscular Status: A Meta-Analysis. J. Sci. Med. Sport. 2017, 20, 397–402. [Google Scholar] [CrossRef]
- Cronin, J.; Hansen, K. Strength and Power Predictors of Sports Speed. J. Strength Cond. Res. 2005, 19, 349–357. [Google Scholar]
- Ziv, G.; Lidor, R. Vertical Jump in Female and Male Volleyball Players: A Review of Observational and Experimental Studies. Scand. J. Med. Sci. Sports 2010, 20, 556–567. [Google Scholar] [CrossRef] [PubMed]
- Möck, S.; Hartmann, R.; Wirth, K. Vertical Jumping Performance Relates to the One-Repetition Maximum in the Standing Calf Raise and in the Squat. Ger. J. Exerc. Sport Res. 2022, 2022, 1–9. [Google Scholar] [CrossRef]
- Ramirez-Campillo, R.; Castillo, D.; Raya-González, J.; Moran, J.; de Villarreal, E.S.; Lloyd, R.S. Effects of Plyometric Jump Training on Jump and Sprint Performance in Young Male Soccer Players: A Systematic Review and Meta-Analysis. Sport. Med. 2020, 50, 2125–2143. [Google Scholar] [CrossRef] [PubMed]
- Ramirez-Campillo, R.; Andrade, D.C.; Nikolaidis, P.T.; Moran, J.; Clemente, F.M.; Chaabene, H.; Comfort, P. Effects of Plyometric Jump Training on Vertical Jump Height of Volleyball Players: A Systematic Review with Meta-Analysis of Randomized-Controlled Trial. J. Sport. Sci. Med. 2020, 19, 489. [Google Scholar]
- Šarabon, N.; Milinović, I.; Dolenec, A.; Kozinc, Ž.; Babić, V. The Reactive Strength Index in Unilateral Hopping for Distance and Its Relationship to Sprinting Performance: How Many Hops Are Enough for a Comprehensive Evaluation? Appl. Sci. 2022, 12, 11383. [Google Scholar] [CrossRef]
- Bogataj, Š.; Pajek, M.; Hadžić, V.; Andrašić, S.; Padulo, J.; Trajković, N. Validity, Reliability, and Usefulness of My Jump 2 App for Measuring Vertical Jump in Primary School Children. Int. J. Environ. Res. Public Health 2020, 17, 3708. [Google Scholar] [CrossRef]
- Cruvinel-Cabral, R.M.; Oliveira-Silva, I.; Medeiros, A.R.; Claudino, J.G.; Jiménez-Reyes, P.; Boullosa, D.A. The Validity and Reliability of the “My Jump App” for Measuring Jump Height of the Elderly. PeerJ 2018, 2018, e5804. [Google Scholar] [CrossRef]
- Singh, H.; Kim, D.; Kim, E.; Bemben, M.G.; Anderson, M.; Seo, D.I.; Bemben, D.A. Jump Test Performance and Sarcopenia Status in Men and Women, 55 to 75 Years of Age. J. Geriatr. Phys. Ther. 2014, 37, 76–82. [Google Scholar] [CrossRef]
- Villalon-Gasch, L.; Penichet-Tomas, A.; Sebastia-Amat, S.; Pueo, B.; Jimenez-Olmedo, J.M. Postactivation Performance Enhancement (PAPE) Increases Vertical Jump in Elite Female Volleyball Players. Int. J. Environ. Res. Public Health 2022, 19, 462. [Google Scholar] [CrossRef]
- Alba-Jiménez, C.; Moreno-Doutres, D.; Peña, J. Trends Assessing Neuromuscular Fatigue in Team Sports: A Narrative Review. Sports 2022, 10, 33. [Google Scholar] [CrossRef] [PubMed]
- Wade, L.; Needham, L.; McGuigan, M.P.; Bilzon, J.L.J. Backward Double Integration Is a Valid Method to Calculate Maximal and Sub-Maximal Jump Height. J. Sport. Sci. 2022, 40, 1191–1197. [Google Scholar] [CrossRef]
- Linthorne, N.P. Analysis of Standing Vertical Jumps Using a Force Platform. Am. J. Phys. 2001, 69, 1198–1204. [Google Scholar] [CrossRef]
- Buckthorpe, M.; Morris, J.; Folland, J.P. Validity of Vertical Jump Measurement Devices. J. Sport. Sci. 2012, 30, 63–69. [Google Scholar] [CrossRef]
- Bogataj, Š.; Pajek, M.; Andrašić, S.; Trajković, N. Concurrent Validity and Reliability of My Jump 2 App for Measuring Vertical Jump Height in Recreationally Active Adults. Appl. Sci. 2020, 10, 3805. [Google Scholar] [CrossRef]
- McErlain-Naylor, S.; King, M.; Pain, M.T.G. Determinants of Countermovement Jump Performance: A Kinetic and Kinematic Analysis. J. Sport. Sci. 2014, 32, 1805–1812. [Google Scholar] [CrossRef]
- Pueo, B.; Jimenez-Olmedo, J.M.; Lipińska, P.; Buśko, K.; Penichet-Tomas, A. Concurrent Validity and Reliability of Proprietary and Open-Source Jump Mat Systems for the Assessment of Vertical Jumps in Sport Sciences. Acta Bioeng. Biomech. 2018, 20, 51–57. [Google Scholar]
- Conceição, F.; Lewis, M.; Lopes, H.; Fonseca, E.M.M. An Evaluation of the Accuracy and Precision of Jump Height Measurements Using Different Technologies and Analytical Methods. Appl. Sci. 2022, 12, 511. [Google Scholar] [CrossRef]
- Rago, V.; Brito, J.; Figueiredo, P.; Carvalho, T.; Fernandes, T.; Fonseca, P.; Rebelo, A. Countermovement Jump Analysis Using Different Portable Devices: Implications for Field Testing. Sports 2018, 6, 91. [Google Scholar] [CrossRef]
- Rana, M.; Mittal, V. Wearable Sensors for Real-Time Kinematics Analysis in Sports: A Review. IEEE Sens. J. 2021, 21, 1187–1207. [Google Scholar] [CrossRef]
- Seshadri, D.R.; Li, R.T.; Voos, J.E.; Rowbottom, J.R.; Alfes, C.M.; Zorman, C.A.; Drummond, C.K. Wearable Sensors for Monitoring the Internal and External Workload of the Athlete. NPJ Digit. Med. 2019, 2, 71. [Google Scholar] [CrossRef] [PubMed]
- Robertson, D.G.E.; Caldwell, G.E.; Hamill, J.; Kamen, G.; Whittlesey, S.N. Research Methods in Biomechanics, 2nd ed.; Human Kinetics: Champaign. IL, USA, 2013; ISBN 0736093400. [Google Scholar]
- Clemente, F.; Badicu, G.; Hasan, U.C.; Akyildiz, Z.; Pino-Ortega, J.; Silva, R.; Rico-González, M. Validity and Reliability of Inertial Measurement Units for Jump Height Estimations: A Systematic Review. Hum. Mov. 2022, 23, 1–20. [Google Scholar] [CrossRef]
- Gallardo-Fuentes, F.; Gallardo-Fuentes, J.; Ramírez-Campillo, R.; Balsalobre-Fernández, C.; Martínez, C.; Caniuqueo, A.; Cañas, R.; Banzer, W.; Loturco, I.; Nakamura, F.Y.; et al. Intersession and Intrasession Reliability and Validity of the My Jump App for Measuring Different Jump Actions in Trained Male and Female Athletes. J. Strength Cond. Res. 2016, 30, 2049–2056. [Google Scholar] [CrossRef]
- Balsalobre-Fernández, C.; Glaister, M.; Lockey, R.A. The Validity and Reliability of an IPhone App for Measuring Vertical Jump Performance. J. Sport. Sci. 2015, 33, 1574–1579. [Google Scholar] [CrossRef] [PubMed]
- Peter Shaw, M.; Paul Satchell, L.; Thompson, S.; Thomas Harper, E.; Balsalobre-Fernández, C.; James Peart, D. Smartphone and Tablet Software Apps to Collect Data in Sport and Exercise Settings: Cross-Sectional International Survey. JMIR mHealth and uHealth 2021, 9, e21763. [Google Scholar] [CrossRef] [PubMed]
- Pueo, B.; Penichet-Tomas, A.; Jimenez-Olmedo, J.M. Validity, Reliability and Usefulness of Smartphone and Kinovea Motion Analysis Software for Direct Measurement of Vertical Jump Height. Physiol. Behav. 2020, 227, 113144. [Google Scholar] [CrossRef] [PubMed]
- Silva, R.; Rico-González, M.; Lima, R.; Akyildiz, Z.; Pino-Ortega, J.; Clemente, F.M. Validity and Reliability of Mobile Applications for Assessing Strength, Power, Velocity, and Change-of-Direction: A Systematic Review. Sensors 2021, 21, 2623. [Google Scholar] [CrossRef]
- McMaster, D.T.; Tavares, F.; O’Donnell, S.; Driller, M. Validity of Vertical Jump Measurement Systems. Meas. Phys. Educ. Exerc. Sci. 2021, 25, 95–100. [Google Scholar] [CrossRef]
- Peña García-Orea, G.; Belando-Pedreño, N.; Merino-Barrero, J.A.; Jiménez-Ruiz, A.; Heredia-Elvar, J.R. Validation of an Opto-Electronic Instrument for the Measurement of Weighted Countermovement Jump Execution Velocity. Sport. Biomech. 2018, 20, 150–164. [Google Scholar] [CrossRef]
- Pojskic, H.; ver Papa, E.; Wu, S.S.X.; Pagaduan, J.C. Validity, Reliability, and Usefulness of Jump Performance from a Low-Cost Contact Mat. J. Hum. Sport Exerc. 2022, 17, 261–271. [Google Scholar] [CrossRef]
- Pueo, B.; Lipinska, P.; Jiménez-Olmedo, J.M.; Zmijewski, P.; Hopkins, W.G. Accuracy of Jump-Mat Systems for Measuring Jump Height. Int. J. Sport. Physiol. Perform. 2017, 12, 959–963. [Google Scholar] [CrossRef] [PubMed]
- Villalon-Gasch, L.; Penichet-Tomás, A.; Jimenez-Olmedo, J.M.; Espina-agulló, J.J. Reliability of a Linear Sprint Test on Sand in Elite Female Beach Handball Players. J. Phys. Educ. Sport 2022, 22, 1246–1251. [Google Scholar] [CrossRef]
- Contreras-Diaz, G.; Jerez-Mayorga, D.; Delgado-Floody, P.; Arias-Poblete, L. Methods of Evaluating the Force-Velocity Profile through the Vertical Jump in Athletes: A Systematic Review. Arch. Med. Deporte 2018, 35, 333–339. [Google Scholar]
- Castagna, C.; Ganzetti, M.; Ditroilo, M.; Giovannelli, M.; Rocchetti, A.; Manzi, V. Concurrent Validity of Vertical Jump Performance Assessment Systems. J. Strength Cond. Res. 2013, 27, 761–768. [Google Scholar] [CrossRef] [PubMed]
- Yıldız, M.; Fidan, U. The Reliability and Validity of the Fitjump Photoelectric Cell System for Determining Vertical Jump Height. Meas. Phys. Educ. Exerc. Sci. 2020, 24, 56–64. [Google Scholar] [CrossRef]
- Bosquet, L.; Berryman, N.; Dupuy, O. A Comparison of 2 Optical Timing Systems Designed to Measure Flight Time and Contact Time during Jumping and Hopping. J. Strength Cond. Res./Natl. Strength Cond. Assoc. 2009, 23, 2660–2665. [Google Scholar] [CrossRef]
- Condello, G.; Khemtong, C.; Lee, Y.-H.; Chen, C.-H.; Mandorino, M.; Santoro, E.; Liu, C.; Tessitore, A. Validity and Reliability of a Photoelectric Cells System for the Evaluation of Change of Direction and Lateral Jumping Abilities in Collegiate Basketball Athletes. J. Funct. Morphol. Kinesiol. 2020, 5, 55. [Google Scholar] [CrossRef]
- Glatthorn, J.F.; Gouge, S.; Nussbaumer, S.; Stauffacher, S.; Impellizzeri, F.M.; Maffiuletti, N.A. Validity and Reliability of Optojump Photoelectric Cells for Estimating Vertical Jump Height. J. Strength Cond. Res. 2011, 25, 556–560. [Google Scholar] [CrossRef]
- Attia, A.; Dhahbi, W.; Chaouachi, A.; Padulo, J.; Wong, D.; Chamari, K. Measurement Errors When Estimating the Vertical Jump Height with Flight Time Using Photocell Devices: The Example of Optojump. Biol. Sport 2017, 1, 63–70. [Google Scholar] [CrossRef]
- Patiño-Palma, B.E.; Wheeler-Botero, C.A.; Ramos-Parrací, C.A. Validación y Fiabilidad Del Sensor Wheeler Jump Para La Ejecución Del Salto Con Contramovimiento. Apunt. Educ. Física Deportes 2022, 3, 37–44. [Google Scholar] [CrossRef]
- González-Conde, A.; González-Devesa, D.; Suárez-Iglesias, D.; Ayán, C. The Validity and Reliability of a Portable Device (ADR-Jumping) to Estimate Vertical Jump Performance. Proc. Inst. Mech. Eng. P J. Sport. Eng. Technol. 2022. [Google Scholar] [CrossRef]
- McKay, A.K.A.; Stellingwerff, T.; Smith, E.S.; Martin, D.T.; Mujika, I.; Goosey-Tolfrey, V.L.; Sheppard, J.; Burke, L.M. Defining Training and Performance Caliber: A Participant Classification Framework. Int. J. Sport. Physiol. Perform. 2022, 17, 317–331. [Google Scholar] [CrossRef] [PubMed]
- Read, M.M. The Effects of Varied Rest Interval Lengths on Depth Jump Performance; San Jose State University: San Jose, CA, USA, 1997; Volume 15. [Google Scholar]
- Mandic, R.; Jakovljevic, S.; Jaric, S. Effects of Countermovement Depth on Kinematic and Kinetic Patterns of Maximum Vertical Jumps. J. Electromyogr. Kinesiol. 2015, 25, 265–272. [Google Scholar] [CrossRef] [PubMed]
- Pérez-Castilla, A.; Rojas, F.J.; Gómez-Martínez, F.; García-Ramos, A. Vertical Jump Performance Is Affected by the Velocity and Depth of the Countermovement. Sport. Biomech. 2019, 20, 1015–1030. [Google Scholar] [CrossRef] [PubMed]
- López, J.M.; López, J.L. Relevance of the Technique of Immobilizing Arms for the Kinetic Variables in the Countermovement Jump Test. Cult. Cienc. Deporte 2012, 7, 173–178. [Google Scholar] [CrossRef]
- Wade, L.; Lichtwark, G.A.; Farris, D.J. Comparisons of Laboratory-based Methods to Calculate Jump Height and Improvements to the Field-based Flight-time Method. Scand. J. Med. Sci. Sport. 2020, 30, 31–37. [Google Scholar] [CrossRef]
- Lin, L.; Hedayat, A.S.; Sinha, B.; Yang, M. Statistical Methods in Assessing Agreement: Models, Issues, and Tools. J. Am. Stat. Assoc. 2002, 97, 257–270. [Google Scholar] [CrossRef]
- McBride, G.B. A Proposal for Strength-of-Agreement Criteria for Lin’s Concordance Correlation Coefficient. NIWA Client Rep. 2005, HAM2005, 307–310. [Google Scholar]
- Schober, P.; Boer, C.; Schwarte, L.A. Correlation Coefficients. Anesth. Analg. 2018, 126, 1763–1768. [Google Scholar] [CrossRef]
- Lake, J.; Augustus, S.; Austin, K.; Mundy, P.; McMahon, J.; Comfort, P.; Haff, G. The Validity of the Push Band 2.0 during Vertical Jump Performance. Sports 2018, 6, 140. [Google Scholar] [CrossRef]
- Passing, H.; Bablok, W. Comparison of Several Regression Procedures for Method Comparison Studies and Determination of Sample Sizes. Application of Linear Regression Procedures for Method Comparison Studies in Clinical Chemistry, Part II. J. Clin. Chem. Clin. Biochem. 1984, 22, 431–445. [Google Scholar] [CrossRef]
- Tomczak, M.; Tomczak, E. The Need to Report Effect Size Estimates Revisited. An Overview of Some Recommended Measures of Effect Size. Trends Sport Sci. 2014, 1, 19–25. [Google Scholar]
- Hopkins, A.G.; Marshall, S.W.; Batterham, A.M.; Hanin, J. Progressive Statistics for Studies in Sports Medicine and Exercise Science. Med. Sci. Sport. Exerc. 2009, 41, 3–12. [Google Scholar] [CrossRef]
- Petersen, P.H.; Fraser, C.G. Strategies to Set Global Analytical Quality Specifications in Laboratory Medicine: 10 Years on from the Stockholm Consensus Conference. Accredit. Qual. Assur. 2010, 15, 323–330. [Google Scholar] [CrossRef]
- Stöckl, D.; Rodríguez Cabaleiro, D.; van Uytfanghe, K.; Thienpont, L.M. Interpreting Method Comparison Studies by Use of the Bland-Altman Plot: Reflecting the Importance of Sample Size by Incorporating Confidence Limits and Predefined Error Limits in the Graphic. Clin. Chem. 2004, 50, 2216–2218. [Google Scholar] [CrossRef] [PubMed]
- Portney, L.G. Foundations of Clinical Research: Applications to Evidence-Based Practice, 4th ed.; Dean Emerita MGH Institute of Health Professions School of Health and Rehabilitation Sciences, Ed.; F. A. Davis Company: Philadelphia, PA, USA, 2020; ISBN 9780803661134. [Google Scholar]
- Atkinson, G.; Nevill, A.M. Statistical Methods for Assessing Measurement Error (Reliability) in Variables Relevant to Sports Medicine. Sport. Med. 1998, 26, 217–238. [Google Scholar] [CrossRef]
- Hopkins, W.G. Measures of Reliability in Sports Medicine and Science. Sport. Med. 2000, 30, 1–15. [Google Scholar] [CrossRef]
- Jovanovic, M. (Ed.) Bmbstats: Bootstrap Magnitude-Based Statistics for Sports Scientists. Mladen Jovanovic09. 2020. Available online: https://mladenjovanovic.github.io/bmbstats-book/ (accessed on 25 February 2023).
- Bernards, J.R.; Sato, K.; Haff, G.G.; Bazyler, C.D. Current Research and Statistical Practices in Sport Science and a Need for Change. Sports 2017, 5, 87. [Google Scholar] [CrossRef]
- Pueo, B.; Lopez, J.J.; Mossi, J.M.; Colomer, A.; Jimenez-Olmedo, J.M. Video-Based System for Automatic Measurement of Barbell Velocity in Back Squat. Sensors 2021, 21, 925. [Google Scholar] [CrossRef]
- Gruber, M.; Peltonen, J.; Bartsch, J.; Barzyk, P. The Validity and Reliability of Counter Movement Jump Height Measured with the Polar Vantage V2 Sports Watch. Front. Sport. Act. Living 2022, 4, 1013360. [Google Scholar] [CrossRef] [PubMed]
- Watkins, C.M.; Maunder, E.; van den Tillaar, R.; Oranchuk, D.J. Concurrent Validity and Reliability of Three Ultra-Portable Vertical Jump Assessment Technologies. Sensors 2020, 20, 240. [Google Scholar] [CrossRef]
- Hopkins, W.G. Spreadsheets for Analysis of Validity and Reliability. Sportscience 2015, 19, 36–45. [Google Scholar]
- Stanton, R.; Doering, T.M.; Macgregor, C.; Borges, N.; Delvecchio, L. Validity of a Contact Mat and Accelerometric System to Assess Countermovement Jump from Flight Time. Meas. Phys. Educ. Exerc. Sci. 2019, 23, 39–46. [Google Scholar] [CrossRef]
- Tenelsen, F.; Brueckner, D.; Muehlbauer, T.; Hagen, M. Validity and Reliability of an Electronic Contact Mat for Drop Jump Assessment in Physically Active Adults. Sports 2019, 7, 114. [Google Scholar] [CrossRef]
- Montalvo, S.; Gonzalez, M.P.; Dietze-Hermosa, M.S.; Eggleston, J.D.; Dorgo, S. Common Vertical Jump and Reactive Strength Index Measuring Devices: A Validity and Reliability Analysis. J. Strength Cond. Res. 2021, 35, 1234–1243. [Google Scholar] [CrossRef] [PubMed]
- Vieira, A.; Blazevich, A.J.; Souza, A.; Costa, D.A.; Tufano, J.J.; Bottaro, M. Validity and Test-Retest Reliability of the Jumpo App for Jump Performance Measurement. Int. J. Exerc. Sci. 2021, 14, 677. [Google Scholar]
- Clemente, F.M.; Akyildiz, Z.; Pino-Ortega, J.; Rico-González, M. Validity and Reliability of the Inertial Measurement Unit for Barbell Velocity Assessments: A Systematic Review. Sensors 2021, 21, 2511. [Google Scholar] [CrossRef]
- Yang, F.; Pai, Y.C. Can Sacral Marker Approximate Center of Mass during Gait and Slip-Fall Recovery among Community-Dwelling Older Adults? J. Biomech. 2014, 47, 3807–3812. [Google Scholar] [CrossRef]
- Moir, G.L. Three Different Methods of Calculating Vertical Jump Height from Force Platform Data in Men and Women. Meas. Phys. Educ. Exerc. Sci. 2008, 12, 207–218. [Google Scholar] [CrossRef]
- Bobbert, M.F.; van Ingen Schenau, G.J. Coordination in Vertical Jumping. J. Biomech. 1988, 21, 249–262. [Google Scholar] [CrossRef] [PubMed]
- Aragón, L.F. Evaluation of Four Vertical Jump Tests: Methodology, Reliability, Validity, and Accuracy. Meas. Phys. Educ. Exerc. Sci. 2000, 4, 215–228. [Google Scholar] [CrossRef]
- Schwieger, K.; Baca, A. Quantifying the Jump Height in Vertical Jumping with Two Different Evaluation Concepts. Int. J. Perform. Anal. Sport 2017, 2, 44–54. [Google Scholar] [CrossRef]


Disclaimer/Publisher’s Note: The statements, opinions and data contained in all publications are solely those of the individual author(s) and contributor(s) and not of MDPI and/or the editor(s). MDPI and/or the editor(s) disclaim responsibility for any injury to people or property resulting from any ideas, methods, instructions or products referred to in the content. |
© 2023 by the authors. Licensee MDPI, Basel, Switzerland. This article is an open access article distributed under the terms and conditions of the Creative Commons Attribution (CC BY) license (https://creativecommons.org/licenses/by/4.0/).