Article

Large-Scale Identification and Analysis of Factors Impacting Simple Bug Resolution Times in Open Source Software Repositories

Fowler School of Engineering, Chapman University, One University Drive, Orange, CA 92866, USA
*
Author to whom correspondence should be addressed.
Appl. Sci. 2023, 13(5), 3150; https://doi.org/10.3390/app13053150
Submission received: 24 November 2022 / Revised: 20 February 2023 / Accepted: 22 February 2023 / Published: 28 February 2023
(This article belongs to the Section Computing and Artificial Intelligence)

Abstract

:
One of the most prominent issues the ever-growing open-source software community faces is the abundance of buggy code. Well-established version control systems and repository hosting services such as GitHub and Maven provide a checks-and-balances structure to minimize the amount of buggy code introduced. Although these platforms are effective in mitigating the problem, it still remains. To further the efforts toward a more effective and quicker response to bugs, we must understand the factors that affect the time it takes to fix one. We apply a custom traversal algorithm to commits made for open source repositories to determine when “simple stupid bugs” were first introduced to projects and explore the factors that drive the time it takes to fix them. Using the commit history from the main development branch, we are able to identify the commit that first introduced 13 different types of simple stupid bugs in 617 of the top Java projects on GitHub. Leveraging a statistical survival model and other non-parametric statistical tests, we found that there were two main categories of categorical variables that affect a bug’s life; Time Factors and Author Factors. We find that bugs are fixed quicker if they are introduced and resolved by the same developer. Further, we discuss how the day of the week and time of day a buggy code was written and fixed affects its resolution time. These findings will provide vital insight to help the open-source community mitigate the abundance of code and can be used in future research to aid in bug-finding programs.

1. Introduction

The prevention, identification, triage, and correction of bugs is a fundamental part of the software engineering process, which pervades, to some extent, all components of the software development lifecycle (SDLC). Although this is a normal and expected part of any non-trivial development effort, programmers should, and do, aim to minimize the occurrence of defects in code.
In the open-source environment, where developers volunteer their time and efforts to building something large-scale, this effort garners even more attention. Developers work in cohesion, checking each other’s code changes and ensuring that their additions do not impact others’ work. In the past, some have argued that, by nature, open-source software (OSS) should have fewer bugs, and more importantly, fewer safety-critical bugs. This concept is known as Linus’ law. It states, “Given enough eyeballs, all bugs are shallow.” However, research by Synopsys Inc. has found that this may not necessarily be true [1]. Synopsys states that a mere number of bug researchers and project contributors may not be enough to catch all types of bugs, specifically Heartbleed Bugs, which are safety-critical. Due to this, the interest of the research and software development community in studying and formulating automatic bug detection algorithms has grown.
Numerous methods have shown promise by leveraging techniques such as fuzzing [2], Graph Transformations [3], and Conditional Branch Enforcements [4]. Some software-bug-tracking products have also surfaced, such as BackLog [5] and BUgZilla [6]. While these techniques are yet to be widely adopted, developers currently use cutting-edge version control systems VCS and repository hosting services, such as GitHub and Maven, where they employ a combination of branches, patches, and pull requests to mitigate the introduction of bugs to the core software. These VCSs have two primary ways of preventing bugs. First, they allow other developers to review new code before finalizing it into the project, thus moderating its integrity and malicious or buggy code. Second, the VCS keeps a log of authors and their changes, which keeps developers accountable. If a developer consistently submits bugs, whether purposefully or not, they can be held responsible. This type of accountability was recently showcased by the Linux project’s ban on the University of Minnesota [7].
Hence, while offering substantial benefits, using a VCS does not ensure that bugs are never introduced into projects. The work in Ref. [8] showed that roughly one-third of all commits made to 729 top projects across all programming languages on GitHub were for fixing bugs. These findings present an exciting research area: understanding how bugs are introduced and fixed and what factors affect the time it takes to fix them.
In their study analyzing the time taken to fix bugs in Eclipse and Mozilla, two large-scale open source projects, Ref. [9] found that, on average, 61% of all bugs were fixed within three months, while 16.5% took as long as three years. The bugs, in their analysis, were of varying complexities and required varying efforts to fix them. To fully understand the science of bug-fixing in open source projects, a natural place to start is by analyzing simple bugs that can be fixed with a single line of code. Termed as SSTUBs, these bugs are rarely complex and do not require a computationally advanced fix. Studying these SSTUBs, their fix duration, and the factors that determine the fix duration will allow us to look at driving factors beyond the complexity of the language and the bug. A study of this kind on numerous open-source projects will present an opportunity to generalize simple bug fixing practices that developers employ.
Our paper’s objectives are two-fold: creating a process to find how long it takes to fix SSTUBs and analyzing the fix time across different bug types in the main development branch of popular open-source software projects written in Java. For the latter, we set out to answer the following research questions categorized into two different categories:
(A)
Time factors
(1)
Is the time it takes to fix a bug affected by the day of the week in which the bug was written?
(2)
Is the time it takes to fix a bug affected by the time of the day in which it was written?
(B)
Author factors
(1)
Is the time it takes to fix a bug different if the buggy code is authored and committed by different users?
(2)
Is the time it takes to fix a bug different if the same user authored both the initial buggy code and the fix code?
(3)
Is the time it takes to fix a bug affected by the amount of active users in the project?
To answer these questions about time differences accurately, we introduce the Commit Cycle concept. Because open-source projects are of varying size and activity, it would be improper to compare the time it took to fix bugs in smaller, more inactive projects to larger, more active projects. Therefore, instead of using the raw time difference between the initial buggy code and the fixed code, we present time differences in Commit Cycles. This metric takes into account a project’s activity to normalize these time differences across projects. The Commit Cycle is calculated by taking the time difference in minutes between introducing the buggy code and fixing the code and dividing it by the project’s Commit Rate. The Commit Rate is a measure describing the number of commits a project introduces per minute. It is calculated by dividing the number of commits made in the project’s relevant active period by the number of minutes in question.
C o m m i t C y c l e = b u g f i x t i m e i n m i n u t e s C o m m i t R a t e
where
C o m m i t R a t e = t o t a l c o m m i t s i n p e r i o d m i n u t e s i n p e r i o d
This standardization allows us to proportionately compare fix times without having the project size as a confounding variable. We further discuss the Commit Cycle concept in the following data section.

2. Related Works

There has been ample research conducted with the hopes of understanding the introduction of bugs in code [9,10,11]. These studies have used differing open-source projects for their data. They vary by the language the projects are written in and the number of projects included. For example, Ray et al. conducted an analysis on bug fix commits from a smaller subject pool of only 10 projects, all written in Java [12]. Osman et al., on the other hand, used a much larger data pool of 717 open-source projects of no particular language [13]. Most of the studies on analyzing bug fixes required creating an effectual technique to seek out these bugs and identify the commit that fixed them [14]. However, the ManySStubs4J dataset completed these tasks for us. This dataset has been the basis of many prior papers. Peruma et al. used the dataset to steer their research in a divergent direction, focusing on the existence of bugs in test files versus non test files [15]. We decided to expand on the dataset by creating an algorithm to locate key missing pieces of information about each bug, including, most importantly, the commit that introduced them. Using this data, we were able to draw conclusions on how various factors might influence the time it takes to fix a bug. Our dataset provided us with a category for each bug and we conducted an analysis on the fix time for each bug. Pan et al. conducted research on a similar topic by extracting bug fixes from 7 Java projects and finding 27 unique patterns, or bug types, among them [16]. In addition, we also used the data our algorithm generated to pay attention to fix times based on the author. Researchers in the past have gone about this analysis in various ways. Kim et al. created an algorithm to track bug creating changes and used that information to find the rates at which different authors both introduced bugs and fixed them [17]. Cohen et al. conducted a similar analysis on the likelihood of a bug occurring based on the number of developers in a project, who introduced the bug, and the length of time it takes to fix a bug [18]. In addition to the analysis Cohen et al. presented, we analyzed the difference between when a bug is introduced during work hours versus the weekend. Using a more holistic view, our approach showed that a developer will fix bugs at a much higher rate if the bug was introduced by that same developer.

3. Materials and Methods

3.1. Materials

3.1.1. The ManySStuBs4J Dataset

We analyze bugs from 643 open-source projects, provided from the ManySStuBs4J Dataset [19]. This dataset comprises 63,923 simple, one-statement fixes of Java bugs classified into 16 syntactic templates (bug types). Our algorithm analyzes a subset of the data coming from the top 1000 Java Maven projects on GitHub. These projects were ranked by the sum of z-scores of a project’s forks and watchers [20]. However, the ManySStubBs4J dataset only provides information about the commit hash that fixes the bugs and no information on the initial commit, which introduced the bug. The dataset contained several attributes of information per bug [20]. We made use of the following features:
  • Bug Type: Type of bug determined out of the 16 possible bugs;
  • Fix Commit Hash: Identifier of the commit fixing the bug;
  • Bug File Path: Path of the fixed file;
  • Git Diff: Contains the changes that happened when the bug was fixed along with the original buggy code [21];
  • Project Name: in the format of repository_owner.repository_name;
  • Bug Line Number: The line number where the bug existed, in the buggy version of the file;
  • Fix Code: The code that fixed the bug.

3.1.2. Traversal Algorithm

We developed an algorithm to procure the initial buggy commit and related information. The code we created for this process can be found https://github.com/anonsstubs/sstubs. Our algorithm leveraged various git commands as follows [22] (Listing 1):
Listing 1. Git commands used in the traversal algorithm.
1  git clone <project git link> <foldername>
2  git log -1 --format=\%ae\%ai\%ce\%ci --date=iso <commit hash>
3  git log --source --pretty=’\%H’ -S <buggy code>  -- <Bug File Path>
4  git show <possible initial commit hash>  -- <file path to buggy code>
We first cloned every available project with the first git command in Listing 1 in order to be able to run further git commands from within each project. We then gathered all information about the fix commit, including the author’s email, the date the code was authored (author date), the committer’s email, and the day the code was committed (commit date) using the second command in Listing 1. It is important to note that the author and committer do not have to be the same user and often are not. In GitHub, an author is the person who wrote the code, whereas the committer is the user that allows the code into the project. Committers usually have a higher level of privileges and authority within the project. After getting this information, we then used the third command in Listing 1 to find all the potential initial buggy commits, in other words, commits in which the buggy code is found as a change in the specified file. We then looked at each of these potential commits using the fourth command in Listing 1 to find the definite initial commit. We did this by implementing several checks. We first made sure that the author-date for the potential initial buggy commit was before the fix commit author-date. If this test passed, we checked if the buggy code was in the git show file following a ‘+’, indicating that the buggy code was an addition in this commit instead of following a ‘−’ signaling a deletion.
Then, we gathered information about each of the projects. We first started by creating a relevant time frame per project. The purpose behind this is to be able to describe project activity on an individual project basis. By getting the oldest and earliest dates per project present in our results, we constructed a time frame of interest for each project. We padded this time frame by adding a month before the earliest date and a month after the latest date since some projects only had one bug commit fixed in less than a day in the dataset. If kept with the raw time frame, the statistics would not represent the project’s activity around the time of the commit. We then used git commands to grab the number of authors, committers, and commits made in this time frame. These quantities were then used in our calculations for Commit Rate and Commit Cycle from Equations (1) and (2) proposed in the introduction of this chapter, which allow us to gauge how long each bug took to get fixed in proportion to its project’s Commit Rate in the time of interest.
After gathering the available initial buggy commit hashes and project information, we further processed the data to get other attributes. These attributes consisted of the following Boolean columns: whether the same author wrote the initial commit and fix commit, whether the same user authored and committed the initial buggy commit, whether the bug was authored during a standard U.S. weekend (Saturday, Sunday), whether the bug was authored during standard U.S. working hours (9 AM–5 PM), and whether the commit was part of a project with more than 25 active committers or more than 40 active authors. These Boolean attributes allow us to get insight into what factors affect the time it takes to fix Simple Stupid Bugs.
Through our custom traversal algorithm, we were able to obtain the following data for each project:
  • Maximum date: Latest date of the project found in our dataset, padded by one month;
  • Minimum date: Earliest date of the project found in our dataset, padded by one month;
  • Project time frame: Calculated by using the maximum and minimum date;
  • Total commits: The total number of commits made during the project time frame;
  • Active committers: The number of active committers during the project time frame;
  • Active authors: The number of active authors during the project time frame;
  • Commit rate per minute: Commits made per minute calculated as outlined in Equation (1).
In addition, we obtained the following for each bug:
  • The bug type;
  • The code author’s email who fixed the commit;
  • The time and date the code author fixed the bug;
  • The code author’s email who introduced the bug;
  • The time and date the code author introduced the bug;
  • Range of line numbers where the code that introduced the bug was located;
  • The total number of commits made in the project;
  • The number of active committers in the project;
  • The number of authors;
  • Latest date of project;
  • Earliest date of project;
  • Number of minutes it took to fix a bug;
  • Project time frame;
  • Commit rate per minute;
  • Number of Commit Cycles it took to fix each bug.
Out of the 643 projects, 592 projects were available for analysis due to the shortcomings outlined in the following Section 3.1.3. From the 592 projects available, we obtained 36,407 unique commits. Although some bugs showed up multiple times with different bug types, we only counted these once. From the subset of projects available and our algorithm, we discovered that the projects’ activity ranged from 2001 to 2019. The information obtained would be used to answer our research questions, thus allowing us to evaluate factors affecting bug fix times.

3.1.3. Limitations of Data

This method has some limitations. For a few commits, the third git command Listing 1 did not find any potential initial buggy commits. After further investigation, this error was sometimes caused by a substantial difference in whitespace and formatting between the buggy code shown in the git diff field and the actual initial commit. Sometimes, the third git command in Listing 1 would show some initial buggy commits but they did not meet the conditions previously outlined.
The ManySStubBs4J dataset itself caused further limitations. For some projects, the dataset only provided the project name and not the project owner. Figuring out which project was being referenced proved to be an unsolvable problem since multiple top projects were named the same but had different owners. Further, every bug is categorized into one, or multiple, patterns or types. For three of the bug types, the definition was obscure. These types were titled ’DELETE_THROWS_EXCEPTION’, ’ADD_THROWS_EXCEPTION’, and ’CHANGE_MODIFIER’. The buggy code was shown as simple numbers as opposed to code. We could not conclude what these numbers stood for and therefore removed any git commit in these categories of bugs.
The projects themselves added two limitations. First, multiple projects have migrated away from GitHub into separate environments and are therefore unavailable for cloning. Second, some projects have re-indexed their commit hashes so, when searching by the given commit hashes from the ManySStubBs4J dataset, an error was produced. We noticed that one of the projects for which this was the case was a substantial project, apache.jmeter. Because this was such a significant project in the dataset, we parsed through the entire log file for the project and matched the old commit hashes to the new commit hashes. We limited these efforts to this project, but this process can be replicated for projects with a similar issue in the future.

3.2. Methods

To answer our research questions presented in Section 1, we use two non-parametric statistical methods; the Mann–Whitney U Test and the Hodges–Lehmann estimate of location shift. We also leverage a survival analysis method to quantify the effect of each of our factors.

3.2.1. Non-Parametric Tests

First, we examine whether the distribution of Commit Cycles taken to fix a bug is statistically different for each group (A and B) outlined in our research questions in Section 1. We accomplish this by using the Mann–Whitney U test [23]. We chose this test because the distribution of Commit Cycles does not follow a normal distribution, neither when looking at the data as a whole nor when we separate it into respective groups. Further, we have one dependent variable, Commit Cycles, which is measured on a continuous scale. We have one independent variable consisting of two categorical, independent groups and our observations in each group are independent for each question. Therefore, meeting all assumptions for the test [24]. We assume that each group for each question has the same shape as its opposite group, therefore we can answer whether the medians of each group are different. Formally, we ask whether randomly selected values from one group are more probable to be greater than the other group. Therefore, our null hypothesis is that the probability that a randomly selected member of the first population will be greater than a randomly selected member of the second population is 50%. We also calculate the effect size of each test by using the method proposed by Ref. [25], dividing the z score by the square root of N, with N being the sample size.
We further analyzed the difference in medians of the amount of Commit Cycles it took to fix a bug per the different groupings by using the Hodges–Lehmann estimate of location shift as outlined in Ref. [26]. The Hodges–Lehmann median difference is the median of all N1 × N2 paired differences between the observations in two independent samples, where N1 and N2 are the sample sizes of each respective group. We also include the corresponding 95% confidence interval. When the assumption that the distributions have the same shape is met, the Hodges–Lehmann estimate of location shift tells us what the difference in medians is.
With these methods, we can answer the research questions in groups (A) and (B). These methods allow us to answer whether the medians are different between groups. We propose additional techniques to quantify how much each factor affects the number of Commit Cycles it takes to fix a bug.

3.2.2. Survival Analysis

Survival analysis is a statistical methodology used in biostatistics to study the duration of the life of an entity [27]. The approach is based on measurements of events that can occur at any time during a study. For example, survival analysis can be used to model the time until death after a treatment intervention, tumor recurrence, or presence of disease in patients. Survival analysis has already been applied to analyze open-source software development. Aman et al. used commits by new developers as their event to analyze the effects of the introduction of buggy code to a software repository [28]. Canfora et al. used survival analysis to study the effect of different code constructs on the overall resolution time of bugs in open-source software repositories [29]. The event of interest in our analysis is the resolution of a simple stupid bug in the repositories of top Java open source projects.
The Kaplan–Meier (K-M) survival estimator is a widely used method for estimating the survival function [30], where the survival function S ( t ) = P ( T > t ) gives the probability that a subject survives longer than some time t [31]. The K-M estimator produces a curve that approaches the true survival function for the data. This method allows us to compare the survival probabilities of SSTUBs, with different attributes. While the K-M curves give us a visual representation of the bug resolution over time, the Cox Proportional-Hazards (Cox PH) model allows us to fit a regression model to investigate the association between the bug resolution time and key commit attributes. The Cox model uses a hazard function, defined as h ( t ) = h 0 ( t ) · e β X , under the assumption that the baseline hazard function h 0 ( t ) is left unspecified, and the hazards for two subjects, with different covariates (X), are proportional [29]. The β parameters estimate the multiplicative effect of a covariate x i on the risk of the event occurring. The quantity e β is the hazard ratio (HR), which can be defined as the hazard of one subject divided by the hazard of a different subject, distinguished by different covariates. e β i is the HR between the subject X i , with the ith covariate set to 1 and all others set to 0, and the reference subject X 0 , with all covariates set to 0:
h X i ( t ) h X 0 ( t ) = h 0 ( t ) · e β i h 0 ( t ) e β 1 · 0 + β 1 · 0 + , + β n · 0 = e β i
H R > 1 indicates a covariate that is positively associated with the event probability and negatively associated with the duration of the survival. For our analysis, H R > 1 for a commit feature shows that the presence of the feature reduces the resolution time for a bug. H R < 1 indicates the opposite. Alongside the statistical tests carried out earlier, we apply both the K-M estimator and the Cox PH model on the data to estimate the effects of attributes on the resolution time of SSTUBs in open source repositories.

4. Results

In this section we investigate the research questions presented in the introduction. The questions are separated into two groups. Group A examines time factors, and group B dives into author factors. We will first answer these questions through non-parametric tests and will then look further into some using the survival analysis methods described in the previous section.
To answer them we use Mann–Whitney U Tests, Hodges–-Lehmann statistics, summary statistics, and Survival Analysis concepts. All of our questions try to discern what factors affect the fix time of a bug. The fix time is the amount of time between when a bug was introduced and when it was fixed. Fix time is represented with Commit Cycles and not raw time, as established in previous sections.

4.1. Descriptive Statistics

Before we explore the research questions, we will explore the summary statistics of our resulting data. We were able to gather the initial commit (init comit) of 36,407 bugs. However, because some bugs were classified under multiple bug types, our total dataset consists of 47,914 members. The average time to fix a bug (fix time) was 7140.04 Commit Cycles while the median fix time was 304.13. These numbers changed substantially when looking into different groupings, which we will investigate in the rest of this section. The summary statistics for these groupings are shown in Table 1.
To find a time factor, we aimed to find a correlation between the amount of Commit Cycles taken to fix a bug and which hour the programmer introduced the bug. Previous research compared the time it takes to repair a bug to understand the bug-fixing process with the bug’s opening date [10]. Related research also considered the bug-fix times [11,32,33,34], but, to our knowledge, none have aimed to determine a correlation between the time it takes to fix a bug, and the hour, or day, the bug was introduced. Thus, we sought to find a statistical difference between which day of the week the programmer introduced the buggy commit and the commit cycle.
Results from our custom-made algorithm were extracted and categorized into the days of the week and the number of bug-introducing commits introduced in its corresponding day. As illustrated in Figure 1, the initial commits, or buggy commits, were published during a workday, Monday through Friday. The maximum number of commits occurred on Thursday; while, Saturday and Sunday had the minimum number of commits out of the entire week. Further analysis focused on the hour the programmer introduced the fix commit and the buggy commit.
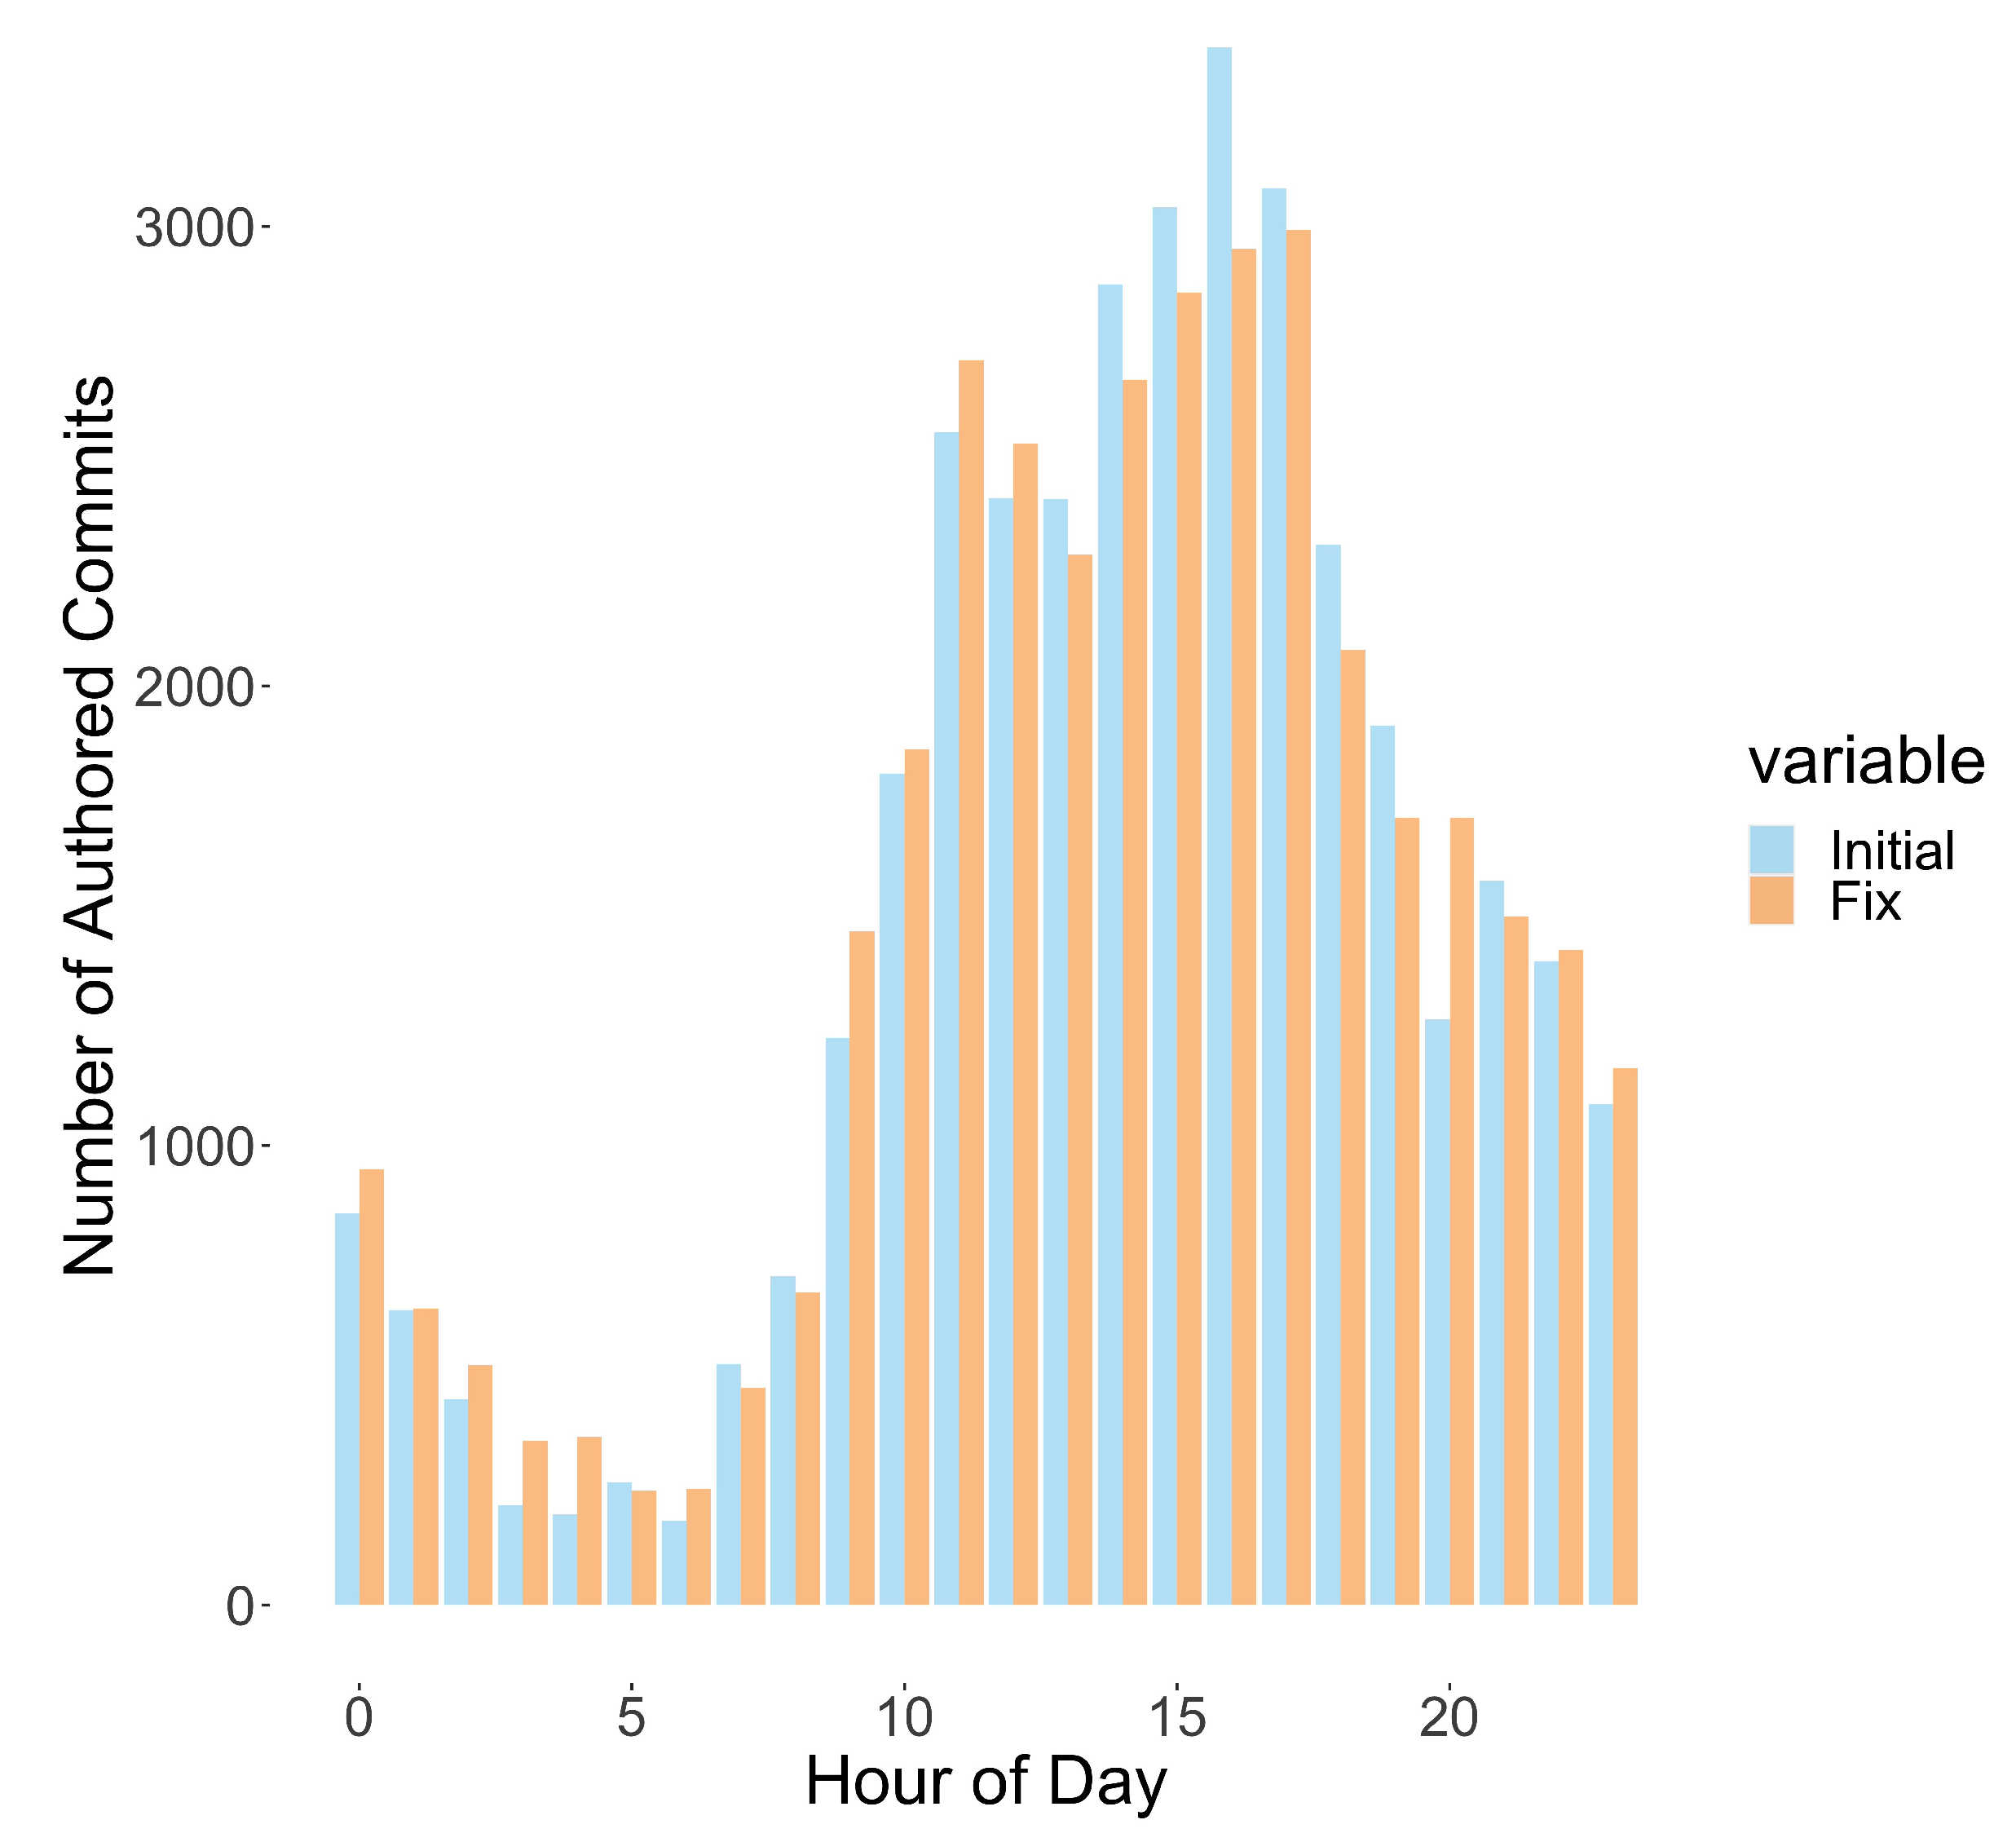
The statistical relationship between the number of bug-introducing commits and fix commits introduced by the programmer each hour was analyzed. Similar to our analysis in the number of commits introduced on each day of the week, we categorized the number of commits made in each hour of the day, in the commits corresponding to a time zone in the 24-h format, as shown in Figure 2. This means that the bug-introducing and fixed commit dates and times were not modified since we wanted to analyze the time from the programmer’s perspective. As shown in Figure 2, programmers published bug-introducing commits between 10 am and 6 pm, during typical working hours. The maximum number of bug-introducing commits occurred at 4 pm; meanwhile, the minimum number of bug-introducing commits were committed to the repository at 6 am. Figure 2 further demonstrated that most of the fix commits were published between 10 am and 6 pm. The maximum number of bug-repairing commits, or fix commits, were published at 4 pm, and the minimum number was published at 5 am.
Although all of our groupings were statistically different according to the Mann–Whitney U Test Statistic, it is important to talk about the effect sizes. According to Cohen’s rules of thumb for interpreting effect sizes, an effect size of 0.1 or less is considered to be small, an effect size of 0.3 is considered medium, and an effect size of 0.5 or greater is considered large [18]. When looking at our results in Table 2, most of our effect sizes are less than or around 0.1 with the exclusion of same vs. different author. This suggests that, although these factors create statistically different groups, the effect of these factors is not large. We conclude that having the same user both introducing and fixing the bug is the most important factor from our groups. The next most influential factor is how big the project is. We also conclude that the rest of the factors do not significantly affect the duration of a bug’s life.
The Hodges–-Lehmann results outlined in Table 3 further corroborate that, although different, most of the groupings are not very different. This is, again, with the exception of the three groups we highlighted previously. We can see that having the same author who created a bug fix it seems to be a good indicator that a bug will be shorter-lived.

4.2. KM Curves

4.2.1. Bugs Introduced during Work Hours

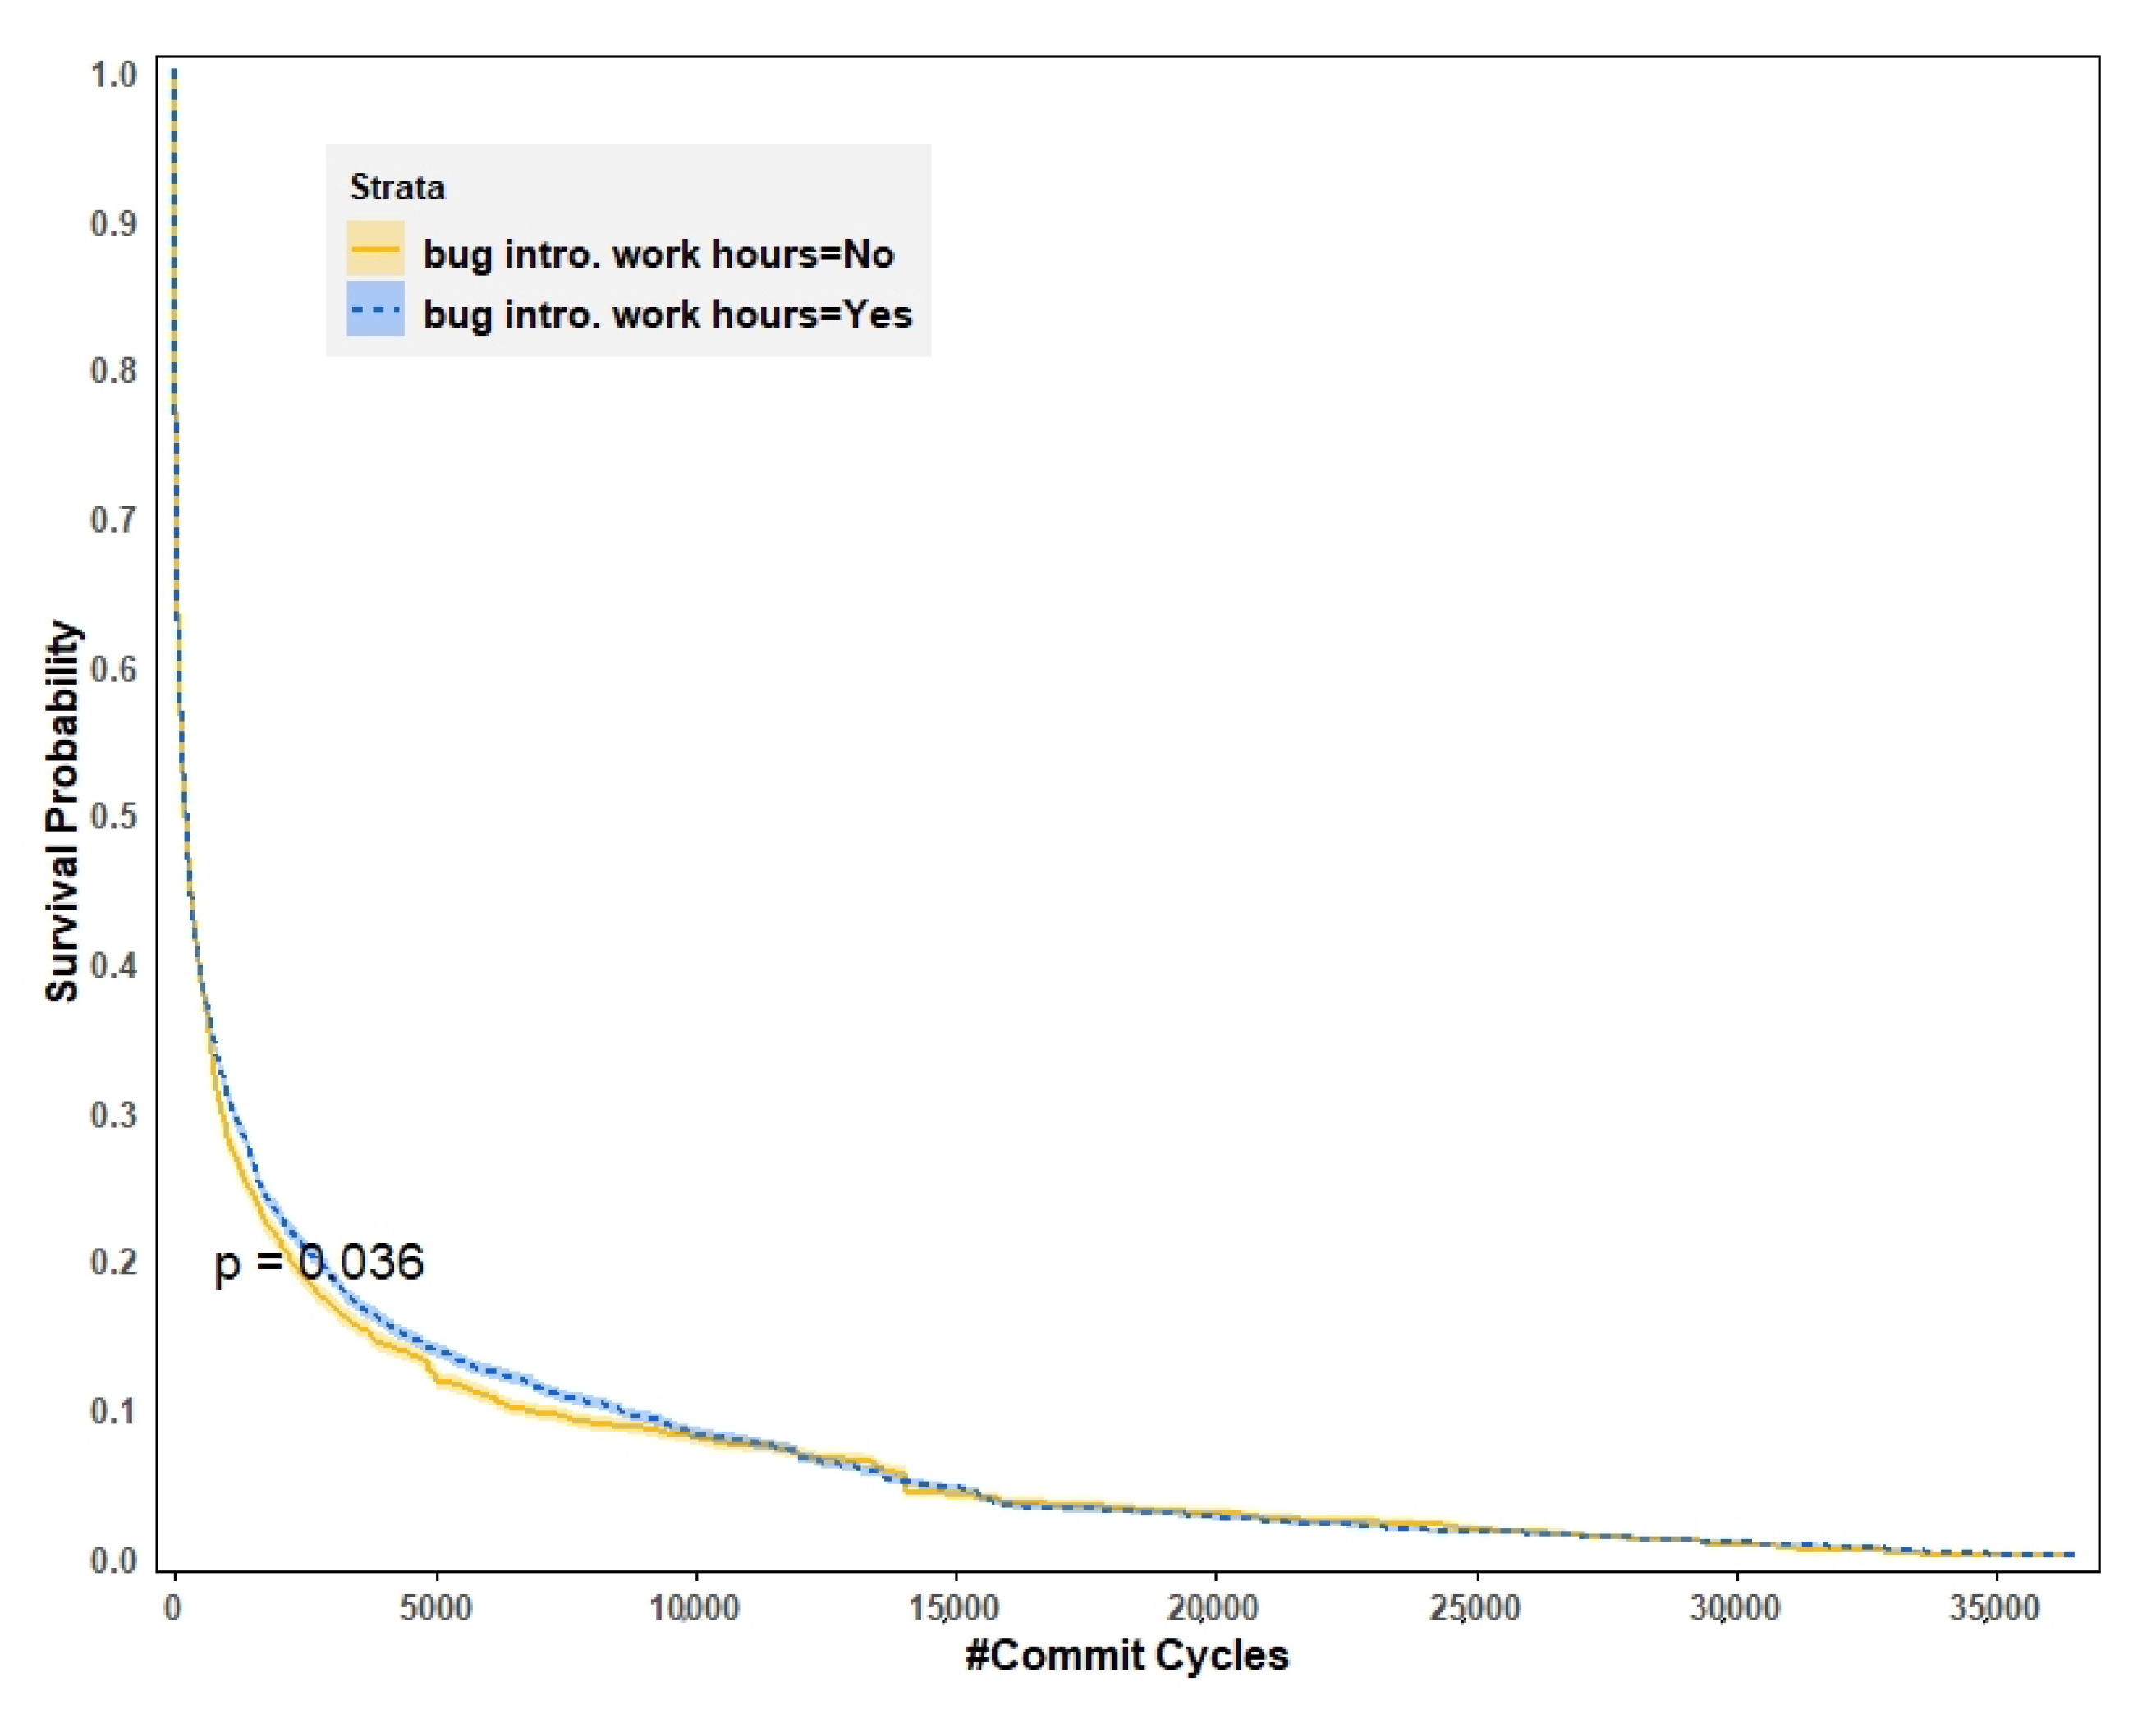
Figure 3 shows the survival probabilities of a bug when grouped on whether it was introduced during work hours or not using a Kaplan–Meier (K-M) curve. It also shows the p-value from the log-rank test. We find that the resolution time of an SStuB is not affected by what hour the bug was introduced in, and the output itself is not statistically significant (p = 0.036).

4.2.2. Bugs Introduced during Weekend

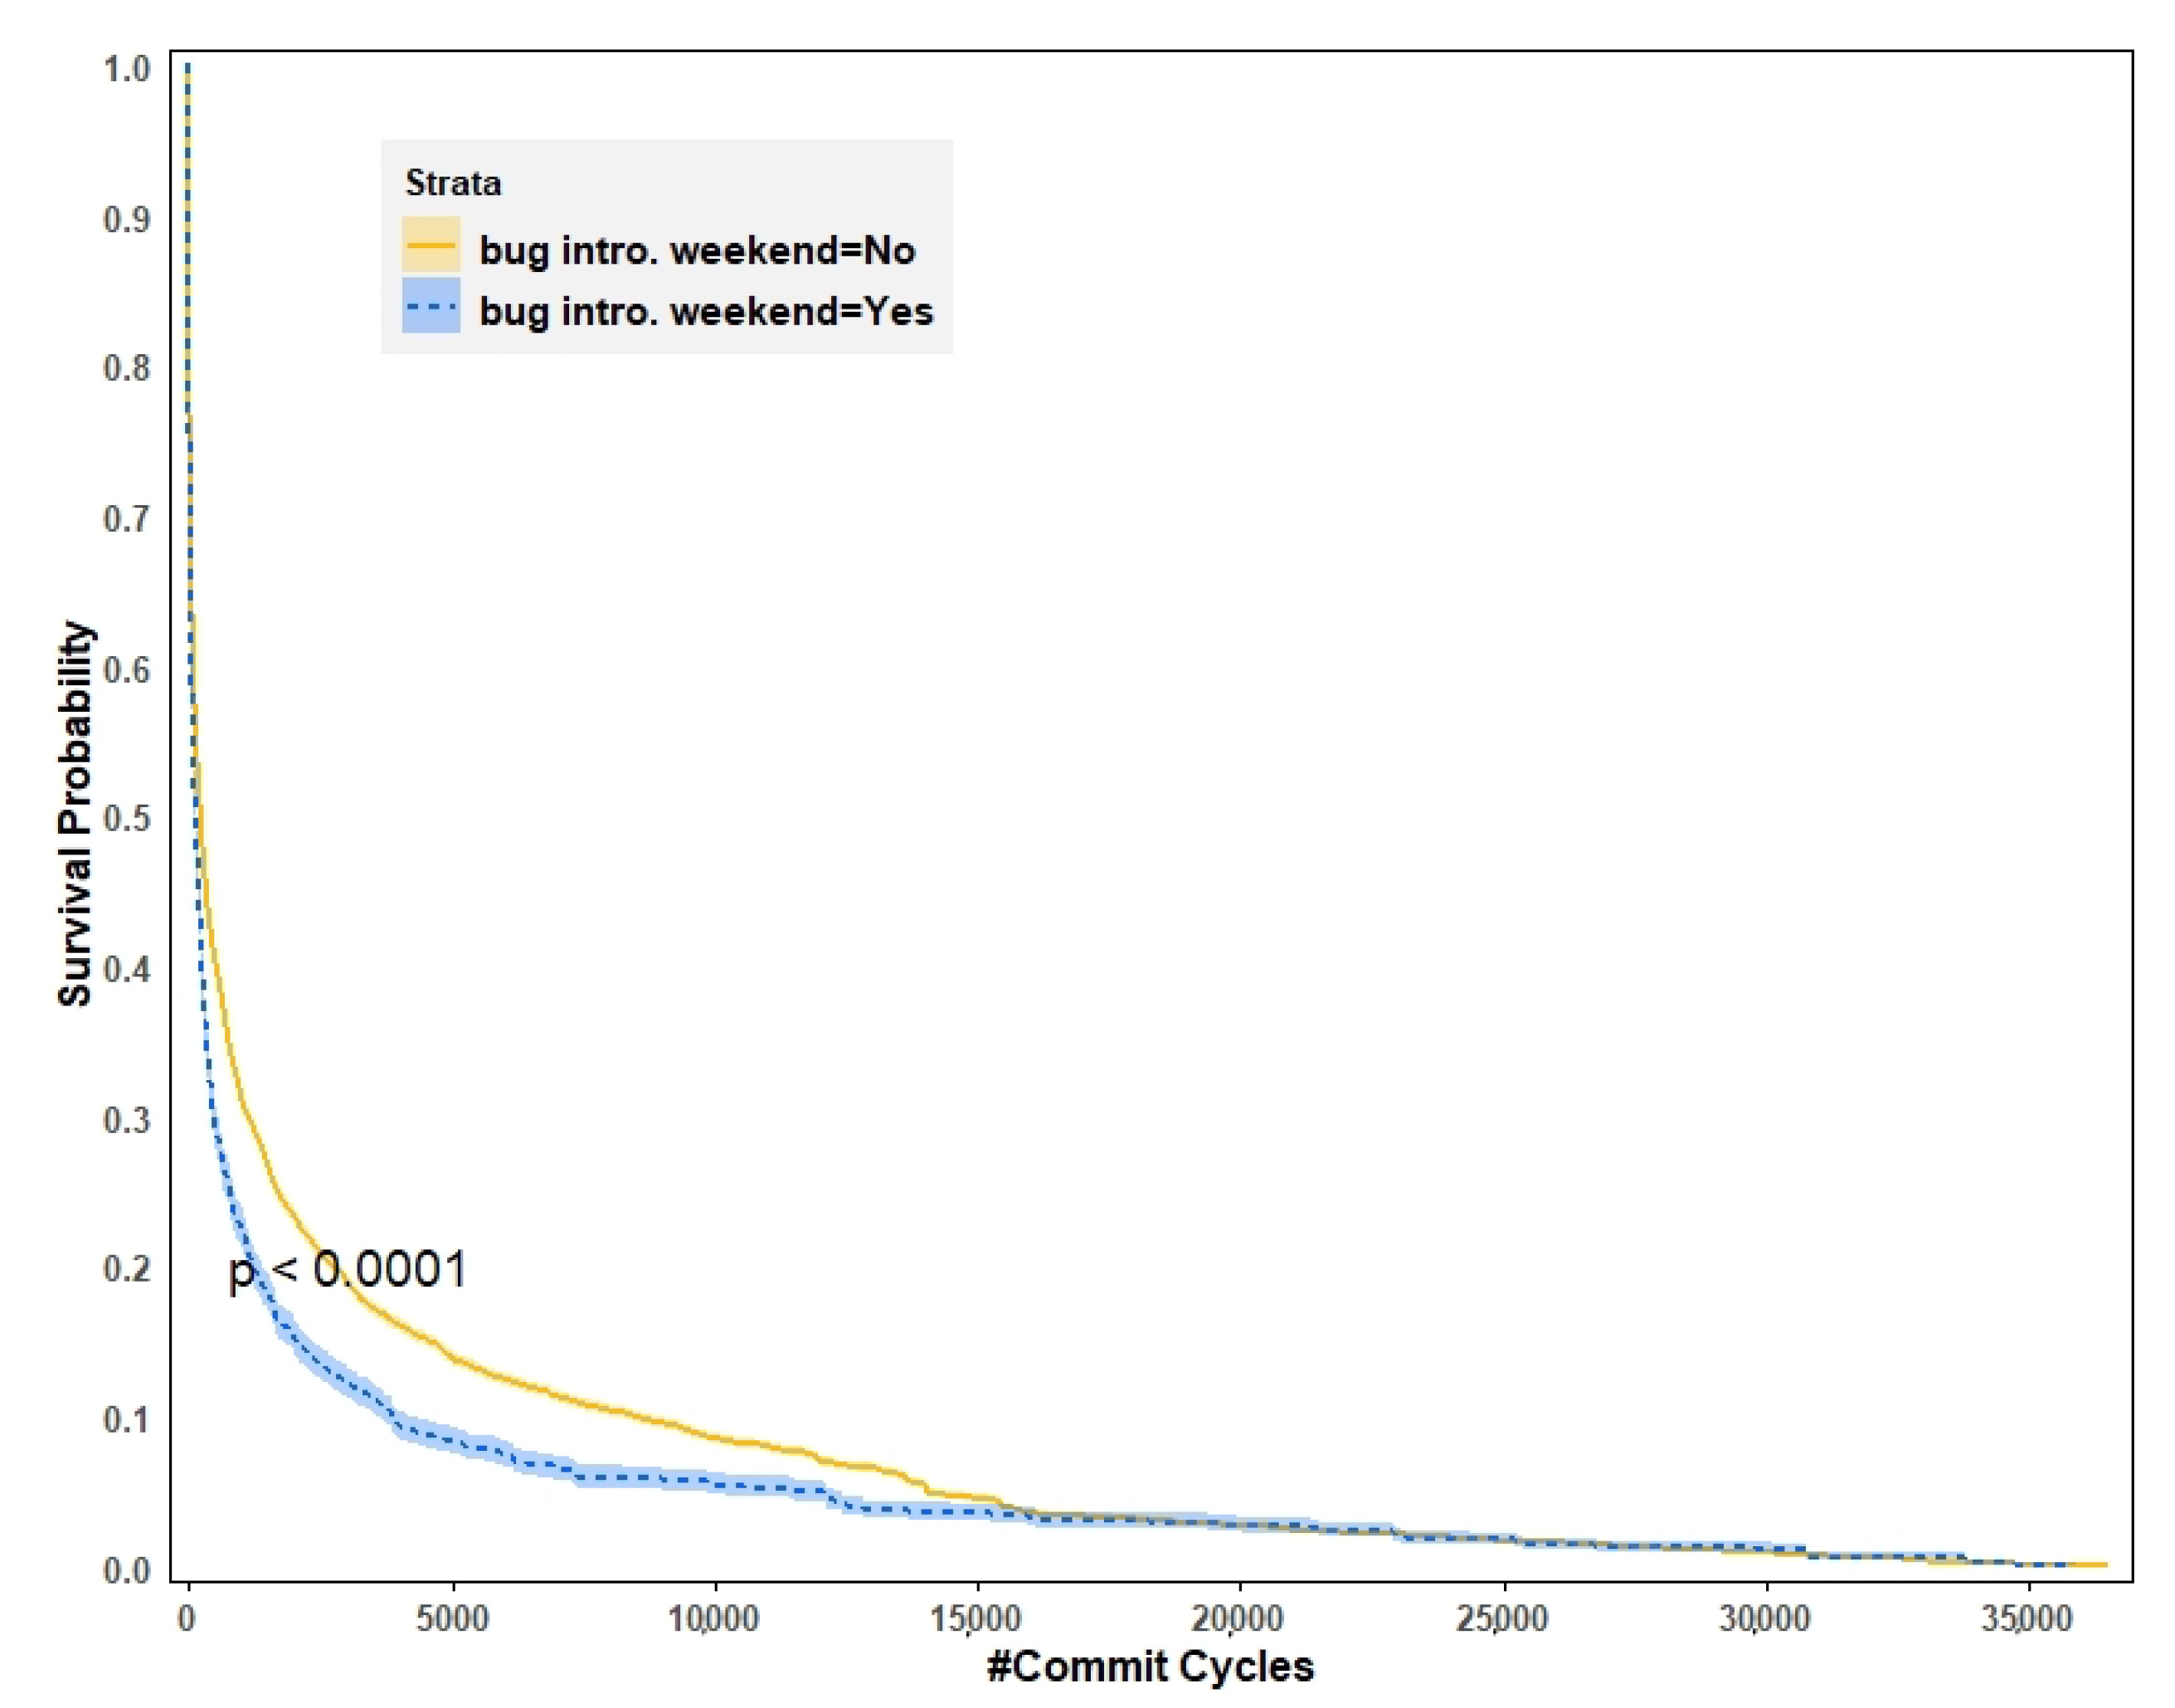
Figure 4 shows the K-M curve for when the survival probabilities of a bug are grouped on whether it was introduced during the weekend or not. We note that SStuBs introduced during the weekend were resolved significantly earlier than their counterpart but the difference in the commit cycles of the two groups at 25% survival rate was below 1000.

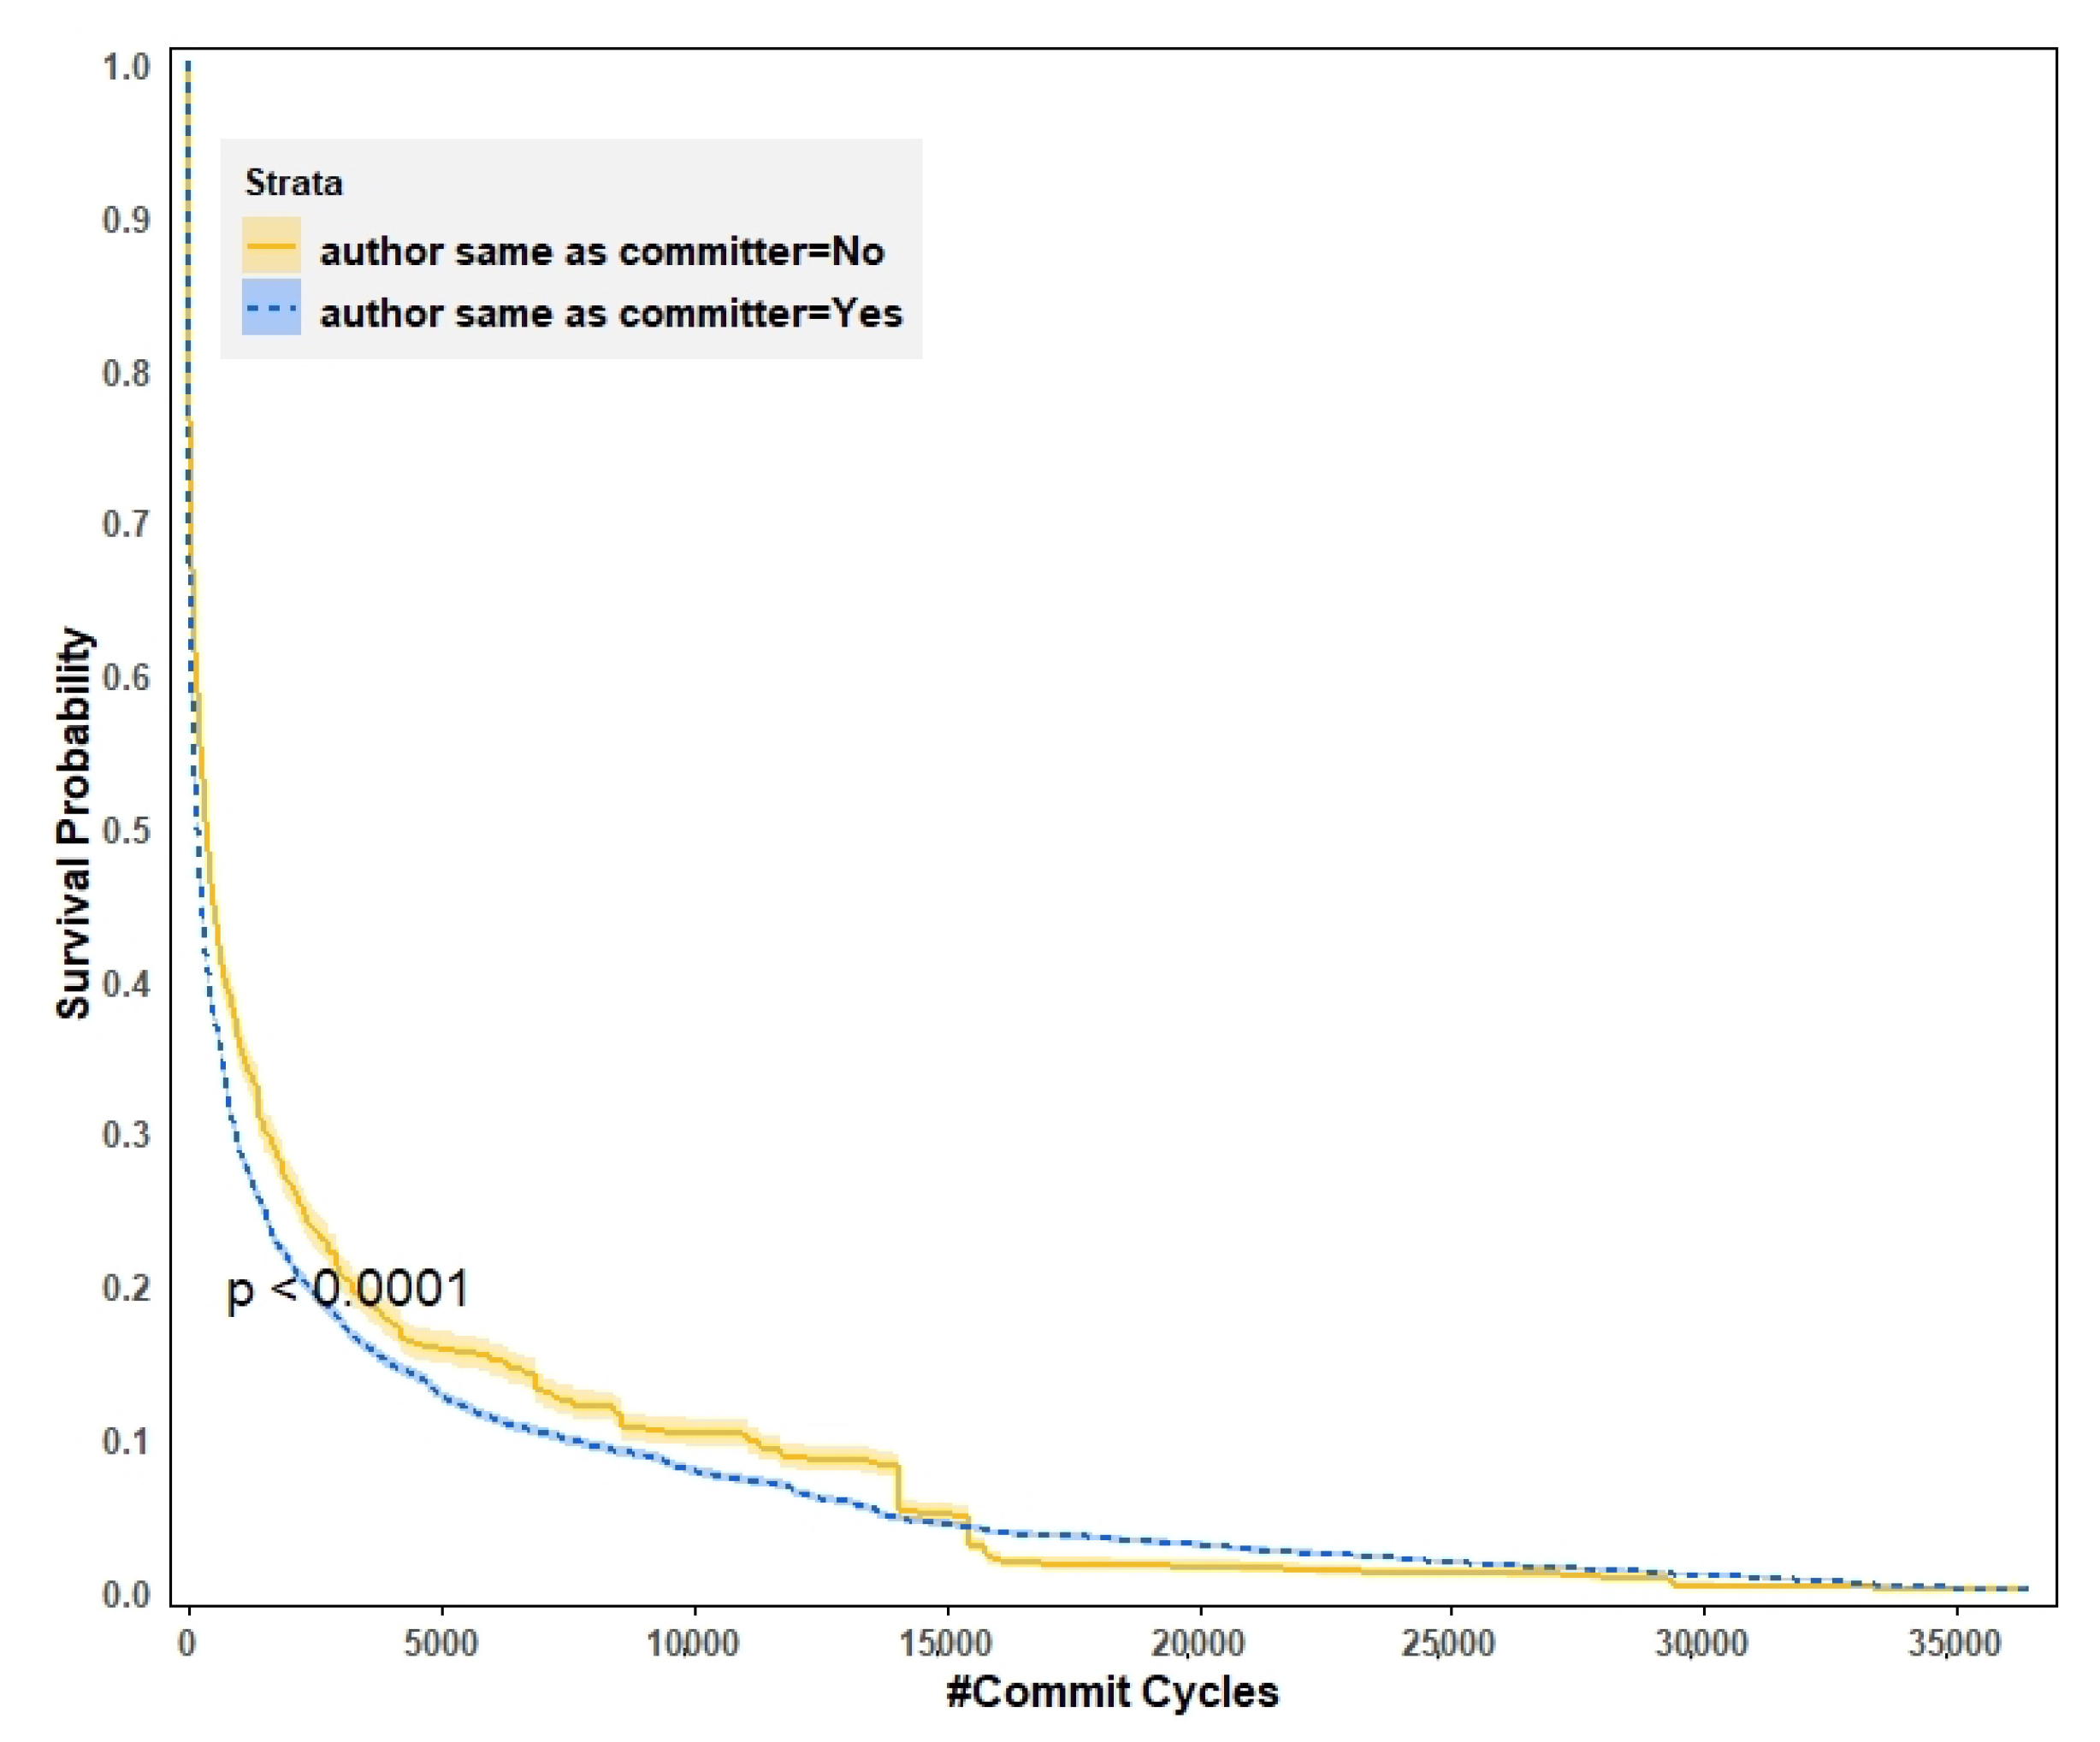
4.2.3. Bugs Introduced and Fixed by the Same Developer

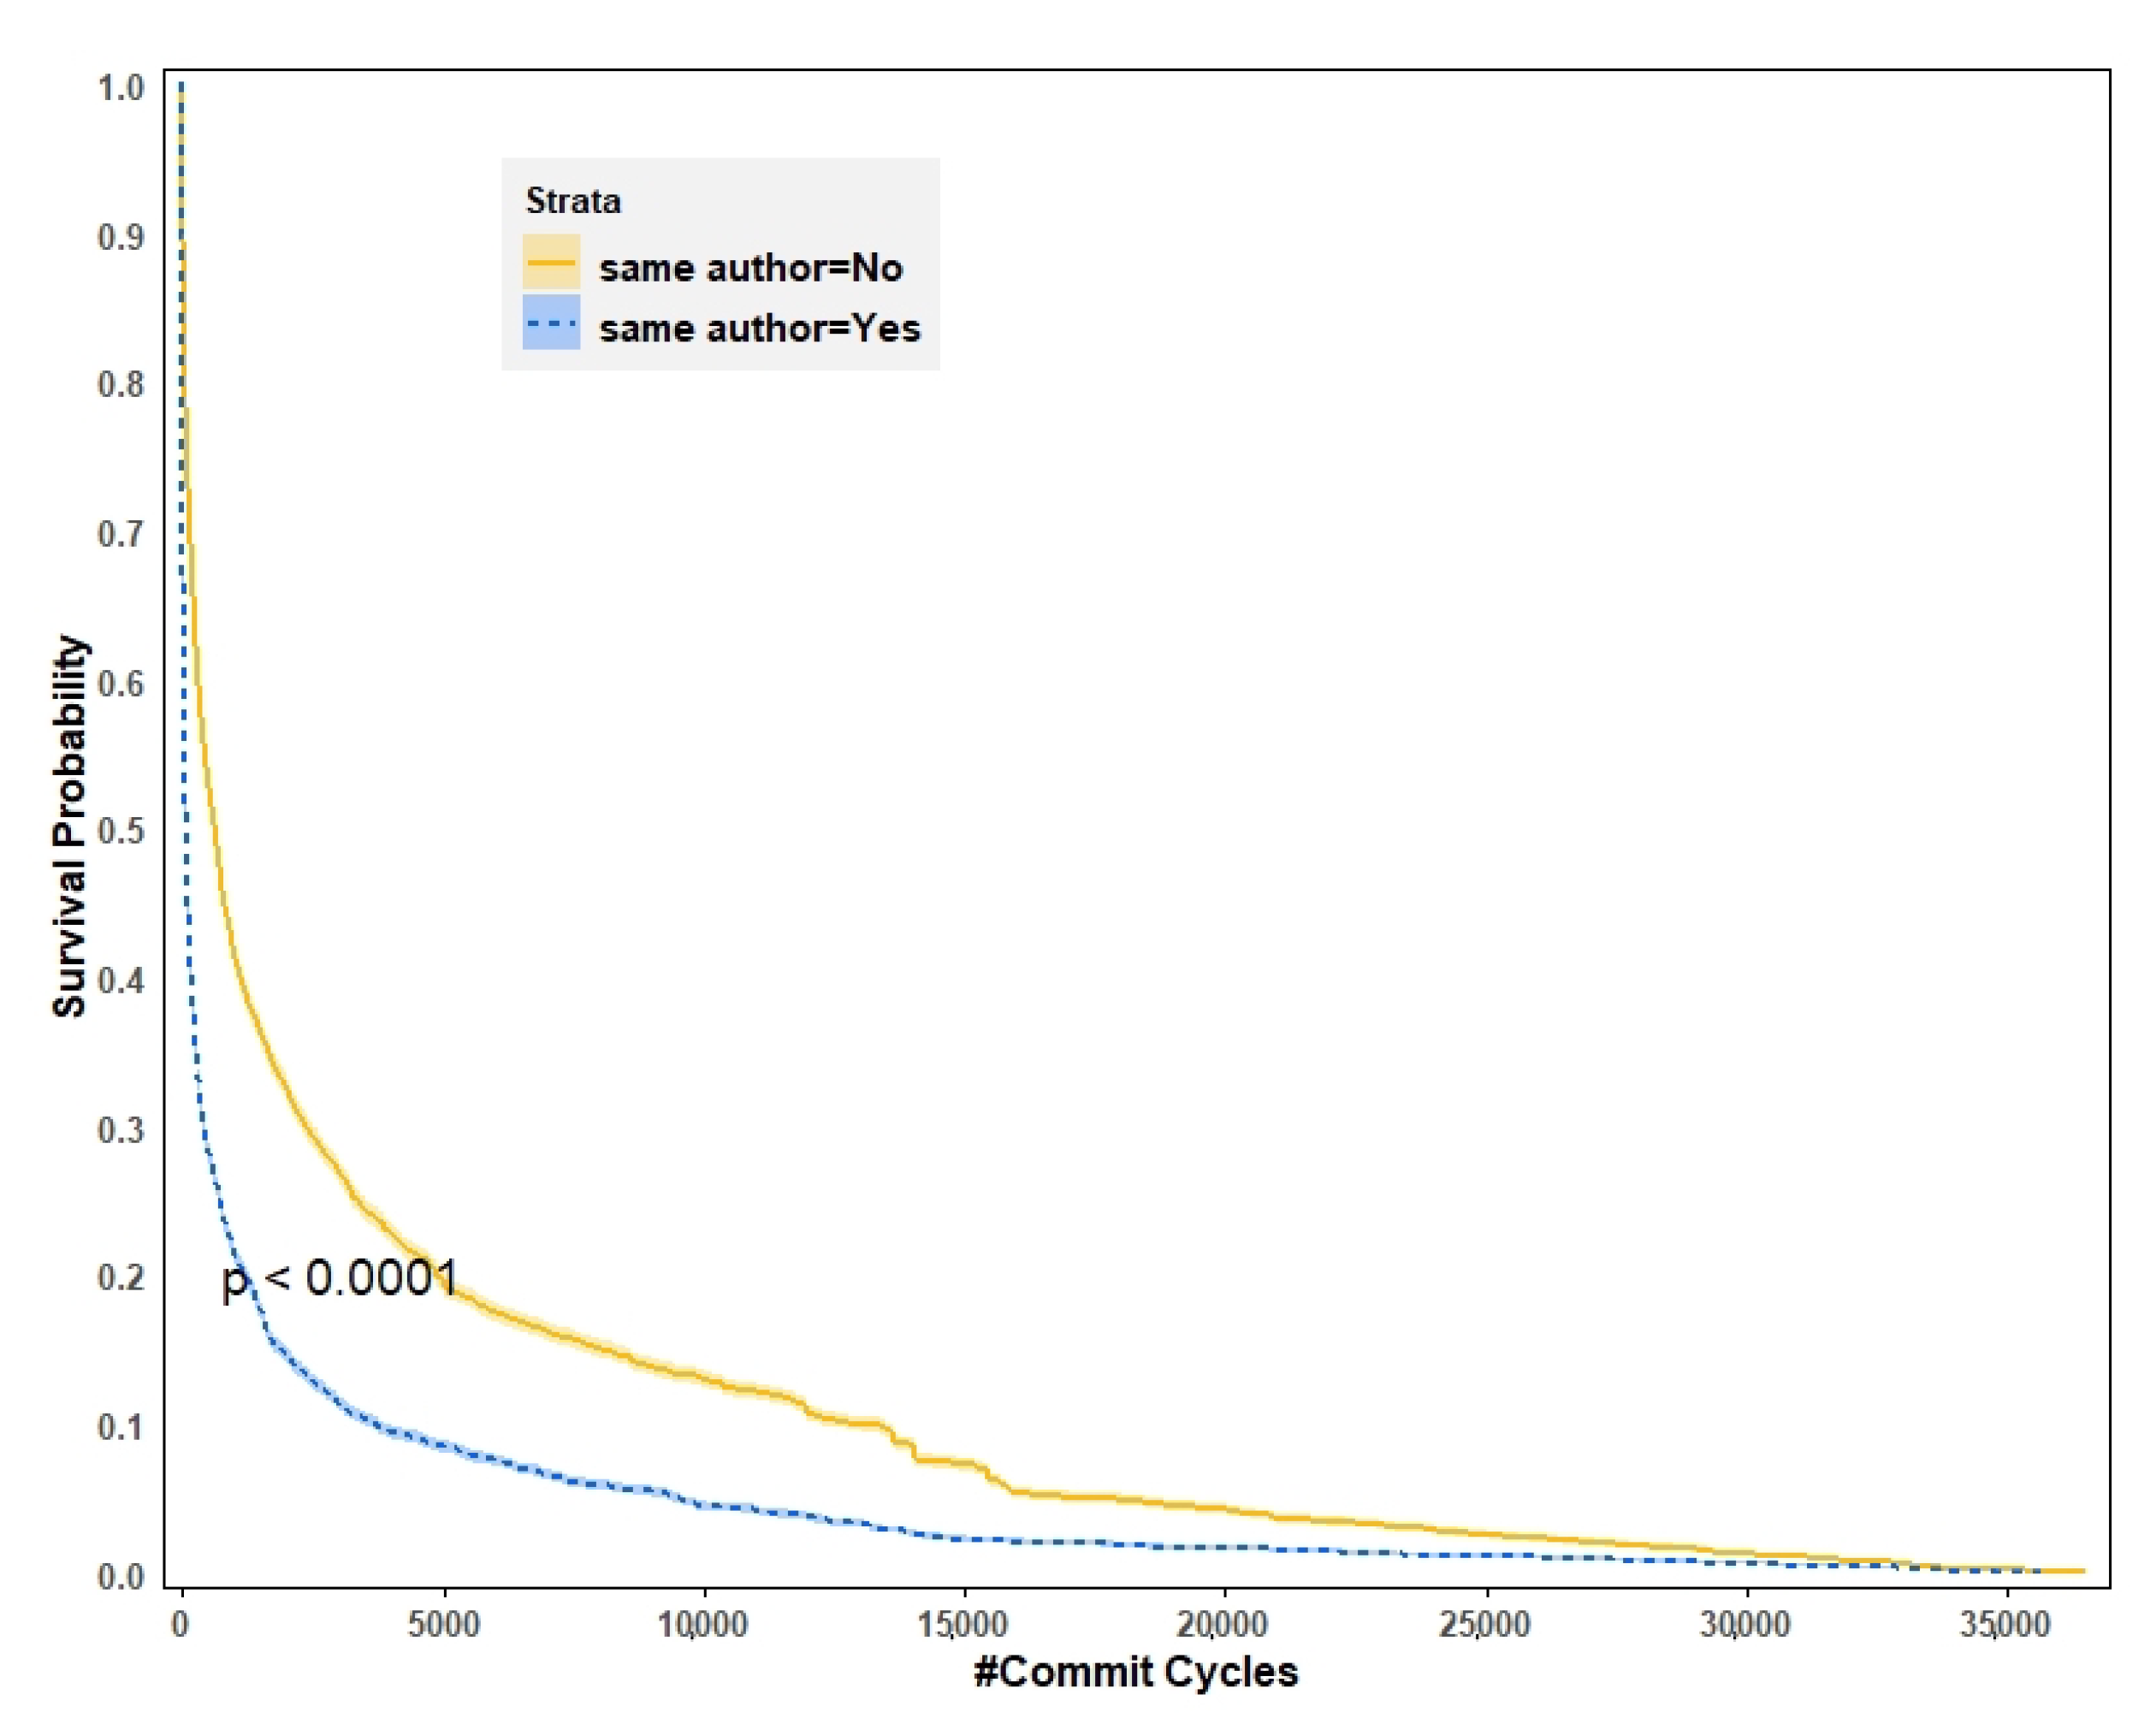
Figure 5 shows the K-M curve for the scenario when bugs are fixed by the developers who also introduced them. We see that SStuBs are resolved much quicker if they are fixed by the same developer who also introduced them. We further explore this scenario when we discuss our findings from the Cox Proportional-Hazards models.

4.2.4. Buggy Code Authored and Committed by the Same Developer

Figure 6 shows the K-M curve for the scenario when bugs are authored and committed by same developer. We see that bugs that were both authored and committed by the same developer were resolved slightly quicker. In our data, 85.2% of the bugs were initially committed by the developers who also authored the buggy code. However, the curve seems to show that, while significant, the difference in the survival probabilities for the two bug groups does not warrant further investigation.

4.3. Cox Proportional-Hazards Model

We fit the categorical attributes that we used in the earlier analyses to a Cox Proportional-Hazards model to estimate the effect of these attributes on the resolution times of SStuBs in open source repositories. While the Kaplan–Meier curves show a statistically significant difference in resolution times based on the presence and absence of these attributes, quantifying the differences can further aid in establishing which attributes impact the resolution times the most. Ali et al. applied the Cox Proportional-Hazards model to good effect and used it to quantify the impact of the number of releases, developer count, and hosting services used, on the overall health of an open-source project [35]. Liu et al. used Cox models to determine the characteristics of cloned code that have the highest impact on software defects when analyzing ArgoUML and Ant systems [36]. Because the Cox Proportional-Hazards model is adept in quantifying hazard for recurrent events, it is suitable for determining the effects on SStuB resolution times in an ever-evolving software repository where multiple bugs are introduced and fixed over time.
In survival analysis, a hazard ratio describes the measure of the effect of some intervention, on the outcome of an event, over time. For our project, the intervention is the attributes associated with a bug commit and the outcome is the bug resolution time. We use the ratios generated after fitting our data with the Cox PH model to explain the impact of each attribute. All confidence intervals are statistically significant. Table 1 gives the confidence interval for the ratio per attribute. Here, we are interested in how bugs introduced during work hours, on the weekends, and scale of the project, affect the overall resolution time. We also measure how the resolution times change if the developer who first introduced the bug is also the one to fix it. This scenario is represented by the "same author" attribute. As shown in Table 4, we find that bugs are fixed 1.71 times faster across all projects if they are fixed by the developers who originally introduced those bugs as well.
For open-source projects, developers work on their copy of a project branch and commit their changes periodically [37]. Fixing bugs introduced by another developer’s code change would require one to analyze the change description, the quality of which has been shown to affect how developers understand the code change [38]. In the 2019’s Stack Overflow Developer Survey, 68.8% of responders said that they do code review for work and see value in it [39]. The result from the model builds on this confidence in the code review process and the data shows that SStuBs were found to have been fixed more than 100 days quicker, normalized by project size, when the developers were fixing their own mistakes.
The “bug intro. work hours” and “bug intro. weekend” attributes shown in Table 4 focus on a developer’s committing patterns in these repositories. Open source software development involves a significant amount of volunteer work and it can be the case that developers make their contributions either after their work hours or over the weekend. We compare buggy commits that were introduced between 9 AM and 5 PM versus those that were not, and compare bugs introduced between Monday and Friday against those introduced on Saturday and Sunday. In our data, 12% SStuBs were submitted over the weekend and 63% of all SStuBs were introduced during work hours. The Cox PH model finds that SStuBs introduced during work hours are fixed slightly slower and those introduced over the weekend are fixed slightly faster. Even though the results are significant, the impact measured is not big enough to conclude that bugs introduced during work hours or over the weekend are more likely to remain unfixed for a longer period of time. That is, the software development ecosystem is built to not discriminate when bugs are introduced and instead, the deviation from an average resolution time is more likely from other factors.
We further compared small versus large scale software projects through the “code authors > 40” and “code committers > 25” attributes. Open-source projects can have a varying number of developers contributing to them based on the scale of the project. Based on the project hierarchy, all developers can make modifications to preexisting code or add new code to the repository but only a few developers may perform actual code commits. We found that in our data, the median number of code authors per project was 40 while the median number of code committers was 25. We also found that the dataset is heavily skewed towards commits from larger projects (those with a higher number of code authors and committers). While these top projects are equally split between those with authors and committers higher and lower than the median, only 4.9% of the SStuB commits are from projects with less than 40 unique code authors, through the duration of our analysis timeline. Furthermore, just 2.1% of the SStuBs belong to projects with fewer than 25 code committers. This brings in light the significance of a project’s scale in how simple stupid bugs can become abundant. The Cox PH model shows that developers were significantly slow in fixing SStuBs for projects with more than 40 code authors (HR = 0.57) and more than 25 code committers (HR = 0.60). This alludes to the notion that large scale projects will have a significantly larger code footprint and commits with tiny bugs are added to the repository with lower scrutiny. In terms of the average number of days taken to fix SStuBs, when normalized for project size, small scale projects fixed a bug around 20 days quicker than large scale projects. Usually, bug resolution times are analyzed for large scale projects only [40,41], so the comparison of these two attributes does provide new insight into the research of bug fixing times.

5. Conclusions

By leveraging the ManySStuBs4J Dataset, we present a traversal algorithm to search for the commit that first introduced a bug into open-source projects hosted on GitHub. We then gather data about both the initial buggy code and fix code and their author, and committer. The concept of a Commit Cycle is introduced in order to normalize time difference values across projects. We then use this data to answer questions regarding what affects the time that a bug takes to be fixed. By leveraging the Mann–Whitney U Tests and Hodges–Lehman Median Difference estimates we find that the differences in the times it takes to fix a bug are statistically significant across our groups in question.
We further investigate our research questions by using Survival Analysis methods and find that bugs are fixed 1.71 times faster across all projects if they are fixed by developers who originally introduced those bugs. The Cox PH model also finds that SStuBs introduced during work hours are fixed slightly slower and those introduced over the weekend are fixed slightly faster. Further, when looking at how the size of projects affects this difference we find that developers were significantly slower in fixing SStuBs for projects with more than 40 code authors and more than 25 code committers. The introduction of buggy code is inevitable, especially for bigger projects. However, we aim to contribute to the field by presenting these results, which show what factors significantly affect the time that it takes to fix bugs.
Our results show that the best bet to have short-lived bugs is having the same people who created the bugs fix them, suggesting that programmers should reduce their focus to only some pieces of code at a time. These results also demonstrate the importance of programmers doing code reviews of their work. We also show that the opposite of Linus’ law is true. The law states that ”given enough eyeballs, all bugs are shallow.” We offer this to be false because the projects with more active users seem to have longer-lived SSTUBs.

Author Contributions

E.E.-L., R.H.A. and G.P. constructed the procedure for cleaning the data, finding the bug’s origin, and conducting the analysis. E.L. and J.A. assisted in organizing the research questions. E.E.-L., R.H.A. and G.P. contributed to developing the article’s framework and focus. E.L. provided the guidance needed for conducting the analysis. All authors have read and approved the final manuscript.

Funding

This research received no external funding.

Institutional Review Board Statement

Not applicable.

Informed Consent Statement

Not applicable.

Data Availability Statement

This study used the ManySStuBs4J Dataset, which is available at https://zenodo.org/record/3653444 (accessed on 8 February 2020).

Acknowledgments

The authors would like to acknowledge HireRight for providing student scholarships to support undergraduate research at Chapman University.

Conflicts of Interest

The authors declare no conflict of interest.

Abbreviations

The following abbreviations are used in this manuscript:
K-MKaplan–Meier
HRHazard Ratio
Cox PHCox Proportional-Hazards
SSTUBSimple Stupid Bugs

References

  1. Llaguno, M. 2017 Coverity Scan Report. Available online: https://www.synopsys.com/blogs/software-security/2017-coverity-scan-report-open-source-security/ (accessed on 23 April 2021).
  2. Chen, C.; Cui, B.; Ma, J.; Wu, R.; Guo, J.; Liu, W. A systematic review of fuzzing techniques. Comput. Secur. 2018, 75, 118–137. [Google Scholar] [CrossRef]
  3. Dinella, E.; Dai, H.; Li, Z.; Naik, M.; Song, L.; Wang, K. Hoppity: Learning Graph Transformations to Detect and Fix Bugs in Programs. In Proceedings of the International Conference on Learning Representations, New Orleans, LA, USA, 6–9 May 2019. [Google Scholar]
  4. Sidiroglou-Douskos, S.; Lahtinen, E.; Rittenhouse, N.; Piselli, P.; Long, F.; Kim, D.; Rinard, M. Targeted Automatic Integer Overflow Discovery Using Goal-Directed Conditional Branch Enforcement. In Proceedings of the Twentieth International Conference on Architectural Support for Programming Languages and Operating Systems, ASPLOS ’15, Istanbul, Turkey, 14–18 March 2015; Association for Computing Machinery: New York, NY, USA, 2015; pp. 473–486. [Google Scholar] [CrossRef] [Green Version]
  5. Nulab. Backlog. 2021. Available online: https://backlog.com/bug-tracking-software/ (accessed on 23 April 2021).
  6. Foundation, M. Bugzilla. 2021. Available online: https://www.bugzilla.org/ (accessed on 23 April 2021).
  7. Kroah-Hartman, G.; Pakki, A. Linux-NFS Archive on lore.kernel.org. 2021. Available online: https://lore.kernel.org/linux-nfs/YH%2FfM%[email protected]/ (accessed on 23 April 2021).
  8. Padhye, R.; Mani, S.; Sinha, V.S. A study of external community contribution to open source projects on GitHub. In Proceedings of the 11th Working Conference on Mining Software Repositories, Hyderabad, India, 31 May–7 June 2014; pp. 332–335. [Google Scholar]
  9. Marks, L.; Zou, Y.; Hassan, A.E. Studying the Fix-Time for Bugs in Large Open Source Projects. In Proceedings of the 7th International Conference on Predictive Models in Software Engineering, Promise ’11, Banff, AB, Canada, 20–21 September 2011; Association for Computing Machinery: New York, NY, USA, 2011. [Google Scholar] [CrossRef]
  10. Francalanci, C.; Merlo, F. Empirical analysis of the bug fixing process in open source projects. In Proceedings of the IFIP International Conference on Open Source Systems, Milan, Italy, 7–10 September 2008; Springer: Berlin/Heidelberg, Germany, 2008; pp. 187–196. [Google Scholar]
  11. Kim, S.; Whitehead, E.J., Jr. How long did it take to fix bugs? In Proceedings of the 2006 International Workshop on Mining Software Repositories, Shanghai, China, 22–23 May 2006; pp. 173–174. [Google Scholar]
  12. Ray, B.; Hellendoorn, V.; Godhane, S.; Tu, Z.; Bacchelli, A.; Devanbu, P. On the “Naturalness” of Buggy Code. arXiv 2015, arXiv:1506.01159. [Google Scholar]
  13. Osman, H.; Lungu, M.; Nierstrasz, O. Mining frequent bug-fix code changes. In Proceedings of the 2014 Software Evolution Week—IEEE Conference on Software Maintenance, Reengineering, and Reverse Engineering (CSMR-WCRE), Antwerp, Belgium, 3–6 February 2014; pp. 343–347. [Google Scholar] [CrossRef] [Green Version]
  14. Rodriguez Perez, G.; Zaidman, A.; Serebrenik, A.; Robles, G.; González-Barahona, J. What if a bug has a different origin? Making sense of bugs without an explicit bug introducing change. In Proceedings of the 12th ACM/IEEE International Symposium on Empirical Software Engineering and Measurement, ESEM ’18, Oulu, Finland, 11–12 October 2018; Association for Computing Machinery, Inc.: New York, NY, USA, 2018. [Google Scholar] [CrossRef] [Green Version]
  15. Peruma, A.; Newman, C.D. On the Distribution of “Simple Stupid Bugs” in Unit Test Files: An Exploratory Study. arXiv 2021, arXiv:2103.09388. [Google Scholar]
  16. Pan, K.; Kim, S.; Whitehead, E.J. Toward an Understanding of Bug Fix Patterns. Empirical Softw. Engg. 2009, 14, 286–315. [Google Scholar] [CrossRef] [Green Version]
  17. Kim, S.; Zimmermann, T.; Pan, K.; Whitehead, E.J., Jr. Automatic Identification of Bug-Introducing Changes. In Proceedings of the 21st IEEE/ACM International Conference on Automated Software Engineering (ASE’06), Tokyo, Japan, 18–22 September 2006; pp. 81–90. [Google Scholar] [CrossRef] [Green Version]
  18. Cohen, J. Statistical Power Analysis for the Behavioral Sciences; Academic Press: Cambridge, MA, USA, 2013. [Google Scholar]
  19. Karampatsis, R.; Sutton, C. ManySStuBs4J Dataset. Zenodo 2020. [Google Scholar] [CrossRef]
  20. Karampatsis, R.M.; Sutton, C. How often do single-statement bugs occur? The ManySStuBs4J dataset. In Proceedings of the 17th International Conference on Mining Software Repositories, Seoul, Republic of Korea, 29–30 June 2020; pp. 573–577. [Google Scholar]
  21. Chacon, S.; Long, J. Git-Diff Documentation. 2021. Available online: https://git-scm.com/docs/git-diff (accessed on 23 April 2021).
  22. Chacon, S.; Long, J. Git-Log Documentation. 2021. Available online: https://git-scm.com/docs/git-log (accessed on 23 April 2021).
  23. Mcknight, P.E.; Najab, J. Mann-Whitney U Test. Corsini Encycl. Psychol. 2010. [Google Scholar] [CrossRef]
  24. Nachar, N. The Mann-Whitney U: A Test for Assessing Whether Two Independent Samples Come from the Same Distribution. Tutorials Quant. Methods Psychol. 2008, 4, 13–20. [Google Scholar] [CrossRef] [Green Version]
  25. Fritz, C.; Morris, P.E.; Richler, J.J. Effect size estimates: Current use, calculations, and interpretation. J. Exp. Psychol. Gen. 2012, 141, 2–18. [Google Scholar] [CrossRef] [PubMed] [Green Version]
  26. Conover, W.J. Practical Nonparametric Statistics; John Wiley & Sons, Inc.: Hoboken, NJ, USA, 1999. [Google Scholar]
  27. Sentas, P.; Angelis, L.; Stamelos, I. A statistical framework for analyzing the duration of software projects. Empir. Softw. Eng. 2008, 13, 147–184. [Google Scholar] [CrossRef]
  28. Aman, H.; Amasaki, S.; Yokogawa, T.; Kawahara, M. A survival analysis of source files modified by new developers. In Proceedings of the International Conference on Product-Focused Software Process Improvement, Innsbruck, Austria, 29 November–1 December 2017; Springer: Berlin/Heidelberg, Germany, 2017; pp. 80–88. [Google Scholar]
  29. Canfora, G.; Ceccarelli, M.; Cerulo, L.; Di Penta, M. How long does a bug survive? An empirical study. In Proceedings of the 2011 18th Working Conference on Reverse Engineering, Limerick, Ireland, 17–20 October 2011; pp. 191–200. [Google Scholar]
  30. Efron, B. Logistic regression, survival analysis, and the Kaplan-Meier curve. J. Am. Stat. Assoc. 1988, 83, 414–425. [Google Scholar] [CrossRef]
  31. Samoladas, I.; Angelis, L.; Stamelos, I. Survival analysis on the duration of open source projects. Inf. Softw. Technol. 2010, 52, 902–922. [Google Scholar] [CrossRef]
  32. Bhattacharya, P.; Ulanova, L.; Neamtiu, I.; Koduru, S.C. An empirical analysis of bug reports and bug fixing in open source android apps. In Proceedings of the 2013 17th European Conference on Software Maintenance and Reengineering, Genova, Italy, 5–8 March 2013; pp. 133–143. [Google Scholar]
  33. Lamkanfi, A.; Demeyer, S. Filtering bug reports for fix-time analysis. In Proceedings of the 2012 16th European Conference on Software Maintenance and Reengineering, Szeged, Hungary, 27–30 March 2012; pp. 379–384. [Google Scholar]
  34. Vijayakumar, K.; Bhuvaneswari, V. How much effort needed to fix the bug? A data mining approach for effort estimation and analysing of bug report attributes in Firefox. In Proceedings of the 2014 International Conference on Intelligent Computing Applications, Coimbatore, India, 6–7 March 2014; pp. 335–339. [Google Scholar]
  35. Ali, R.H.; Parlett-Pelleriti, C.; Linstead, E. Cheating Death: A Statistical Survival Analysis of Publicly Available Python Projects. In Proceedings of the 17th International Conference on Mining Software Repositories, Seoul, Republic of Korea, 29–30 June 2020; pp. 6–10. [Google Scholar]
  36. Liu, Z.; Li, M.; Hua, Q.; Li, Y.; Wang, G. Identification of an eight-lncRNA prognostic model for breast cancer using WGCNA network analysis and a Cox-proportional hazards model based on L1-penalized estimation. Int. J. Mol. Med. 2019, 44, 1333–1343. [Google Scholar] [CrossRef] [PubMed] [Green Version]
  37. Bird, C.; Rigby, P.C.; Barr, E.T.; Hamilton, D.J.; German, D.M.; Devanbu, P. The promises and perils of mining git. In Proceedings of the 2009 6th IEEE International Working Conference on Mining Software Repositories, Vancouver, BC, Canada, 16–17 May 2009; pp. 1–10. [Google Scholar]
  38. Tao, Y.; Dang, Y.; Xie, T.; Zhang, D.; Kim, S. How do software engineers understand code changes? An exploratory study in industry. In Proceedings of the ACM SIGSOFT 20th International Symposium on the Foundations of Software Engineering, Cary, NC, USA, 11–16 November 2012; pp. 1–11. [Google Scholar]
  39. Developer Survey Results 2019. Available online: insights.stackoverflow.com/survey/2019 (accessed on 23 April 2021).
  40. Zhang, H.; Gong, L.; Versteeg, S. Predicting bug-fixing time: An empirical study of commercial software projects. In Proceedings of the 2013 35th International Conference on Software Engineering (ICSE), San Francisco, CA, USA, 18–26 May 2013; pp. 1042–1051. [Google Scholar]
  41. Hu, H.; Zhang, H.; Xuan, J.; Sun, W. Effective bug triage based on historical bug-fix information. In Proceedings of the 2014 IEEE 25th International Symposium on Software Reliability Engineering, Naples, Italy, 3–6 November 2014; pp. 122–132. [Google Scholar]
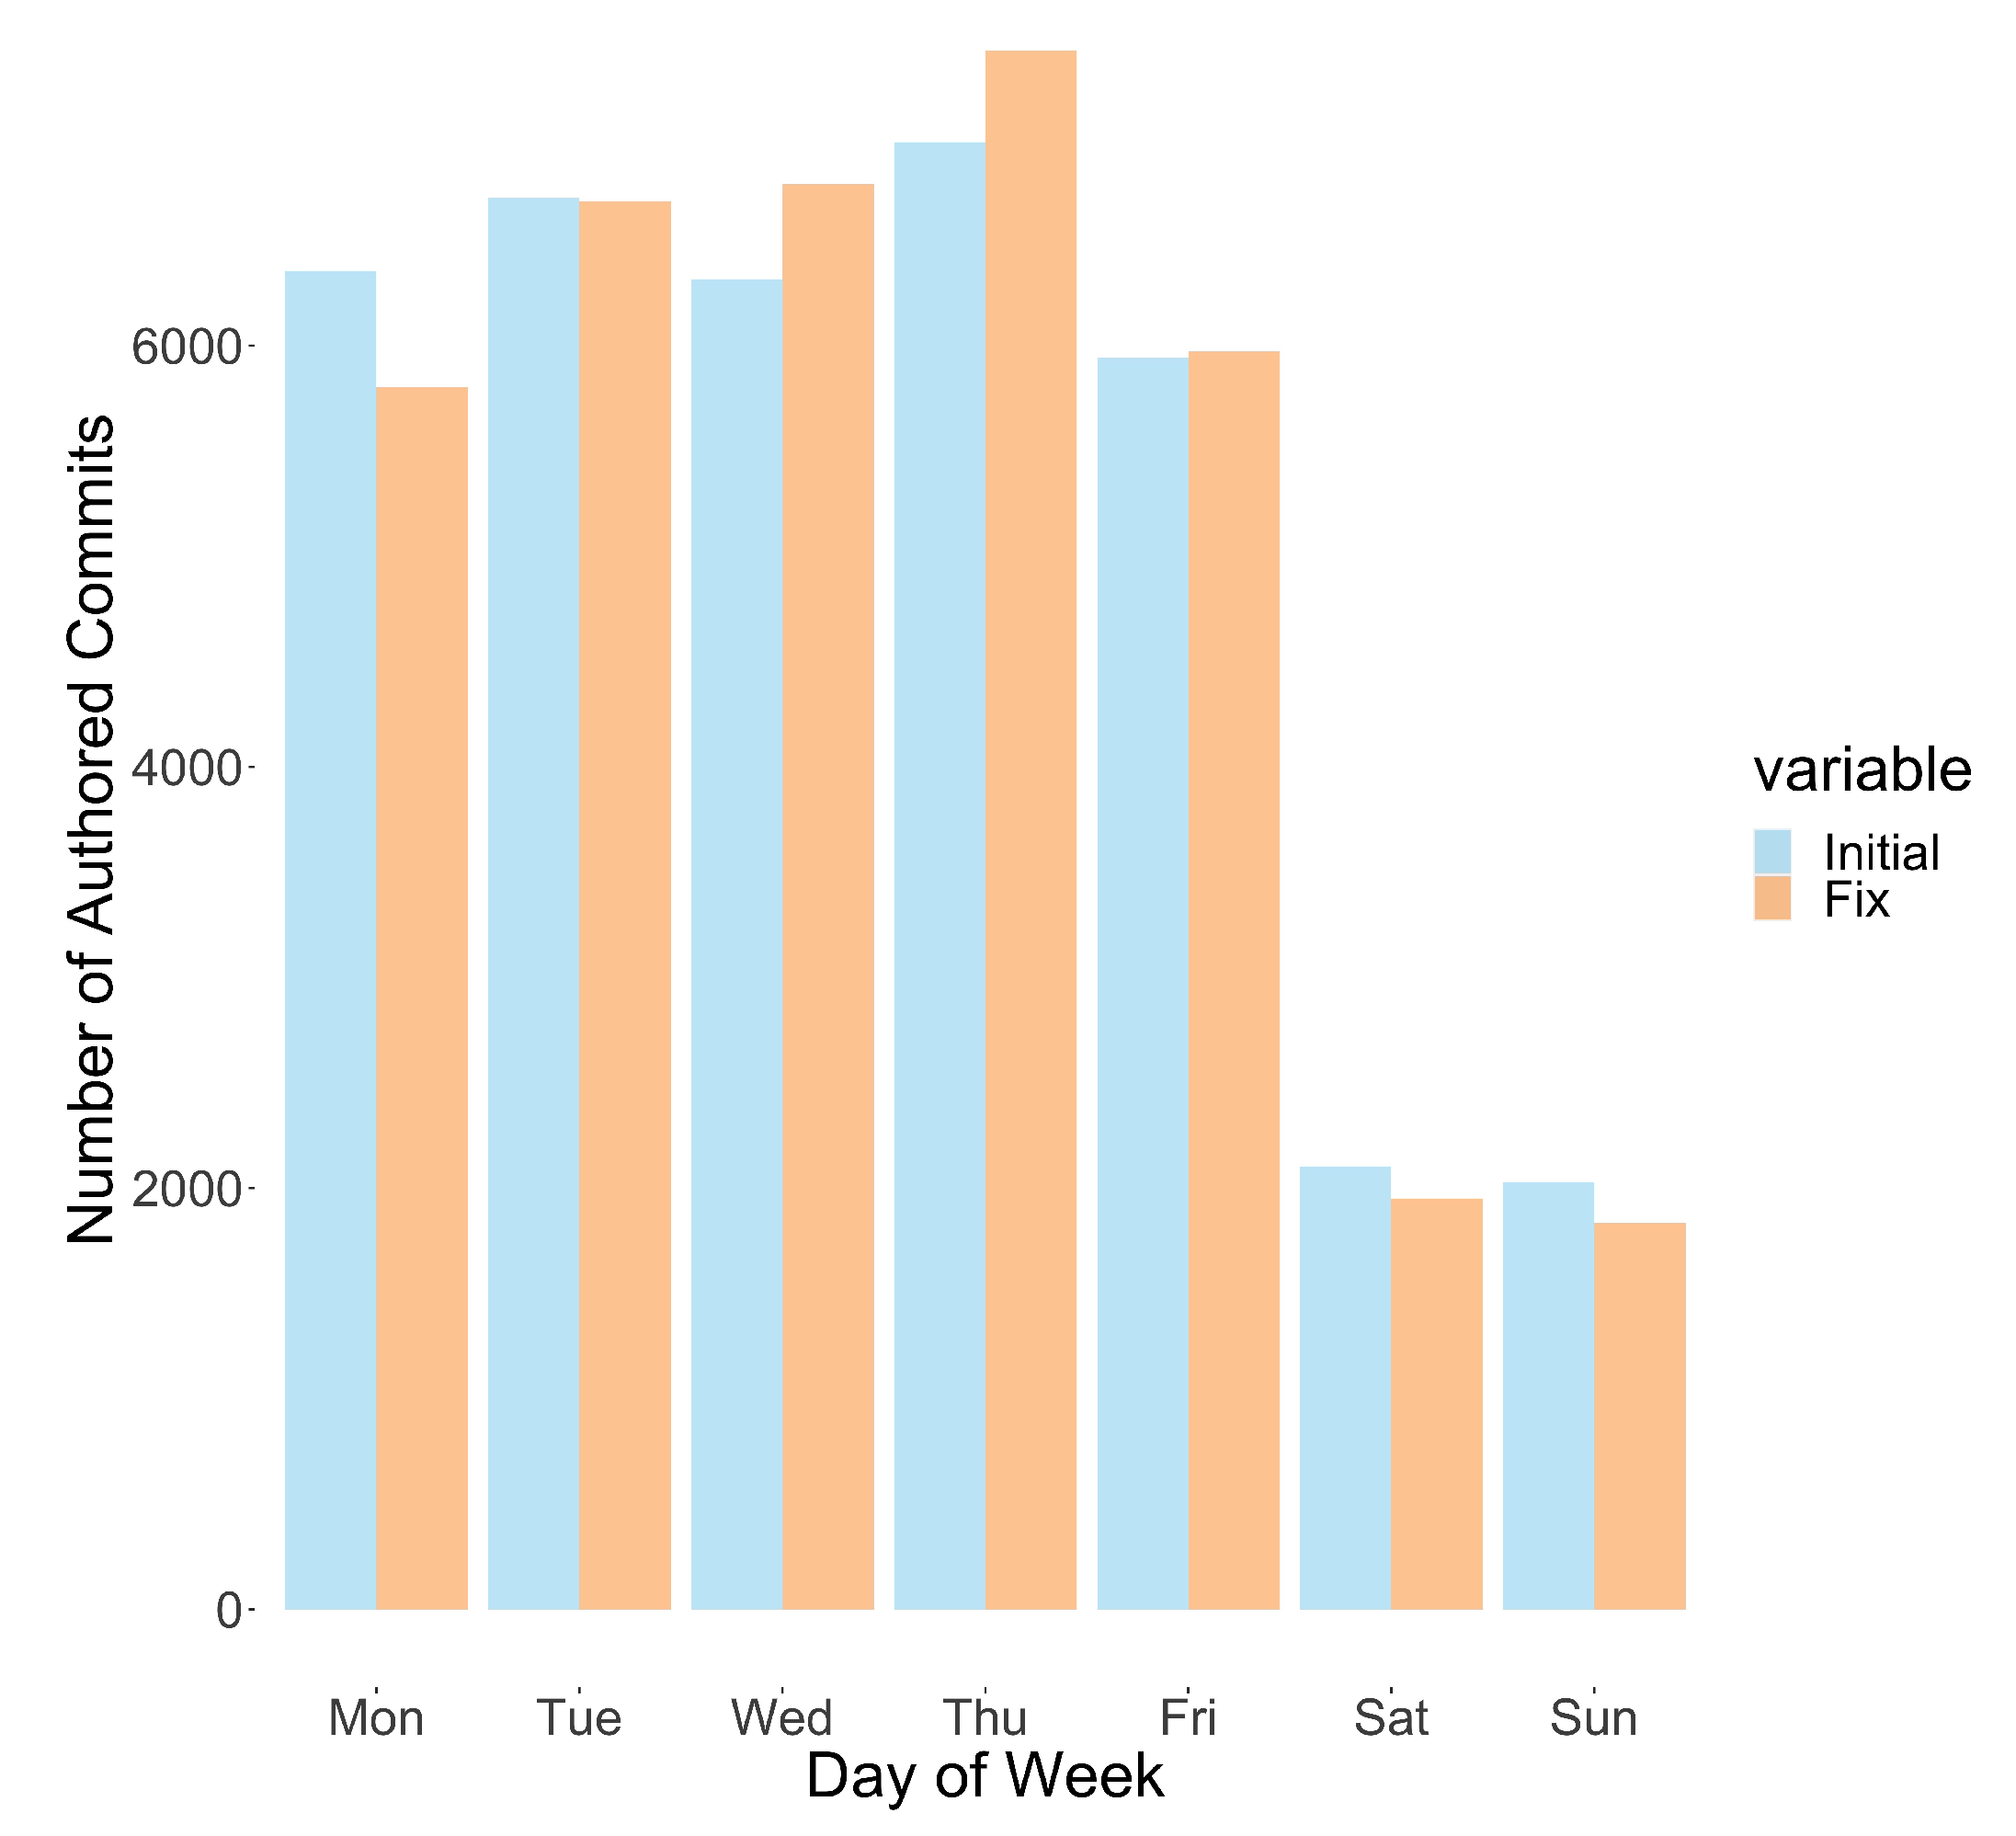
Figure 1. Buggy commits made per day of the week.
Applsci 13 03150 g001
Figure 2. Buggy commits made per hour.
Applsci 13 03150 g002
Figure 3. Kaplan–Meier estimations of the survival function for the scenario when bugs are introduced during work hours and vice versa.
Applsci 13 03150 g003
Figure 4. Kaplan–Meier estimations of the survival function for the scenario when bugs are introduced during the weekend and vice versa.
Applsci 13 03150 g004
Figure 5. Kaplan–Meier estimations of the survival function for the scenario when bugs are fixed by developers who also introduced them and vice versa.
Applsci 13 03150 g005
Figure 6. Kaplan–Meier estimations of the survival function for the scenario when bugs are authored and committed by the same developer.
Applsci 13 03150 g006
Table 1. Summary statistics per research question.
GroupCountMeanStandard DeviationMedian
Research Questions (A)
Initial Buggy Commit on Weekday32,2767611.2526,156.3330.392661
Initial Buggy Commit on Weekend41313458.43113,390.04160.079725
Initial Buggy Commit Work Hours22,8006396.58321,265.25287.917833
Initial Buggy Commit not Work Hours13,6078385.78730,359.9329.574957
Research Questions (B)
Same Author Bug Fix18,2012489.8169565.71672.961409
Different Author Bug Fix18,20611,788.9933,501.36987.887367
Same User is Author Committer31,3597651.33726,528.25280.848463
Different User is Author Committer50483963.78912,250.26431.233376
More than 25 Committers34,6887485.94925,635.98344.932187
Less than 25 Committers1719159.916434.132921.776339
More than 40 Authors34,5347504.61925,690.44343.853362
Less than 40 Authors1873418.03251404.52625.125066
Table 2. Mann–Whitney U test results per research question.
 GroupMann–Whitney U
Test Statistic
Asymptotic Sig.
(2-Sided Test)
 Effect Size
Research Questions (A)
Initial Buggy Commit on Weekday–
Initial Buggy Commit not on Weekend
58954258 0 × 10 0 0.0635463
Initial Buggy Commit Work Hours–
Initial Buggy Commit not Work Hours
151804794 6.33 × 10 4 0.0179076
Research Questions (B)
Same Author Bug Fix–
Different Author Bug Fix
95107772 0 × 10 0 0.3688948
Same User is Author and Committer–
Different User is Author and Committer
73798999 1.15 × 10 14 0.0404673
More than 25 Committers–
Less than 25 Committers
43675871 0 × 10 0 0.17079872
More than 40 Authors–
Less than 40 Authors
45870631 0 × 10 0 0.16006322
Table 3. Hodges–Lehmann Median difference results per research question.
   GroupIndependent-Samples
Hodges–Lehmann
Median Difference Estimate
   95 % Confidence
Interval
Research Questions (A)
Initial Buggy Commit on Weekday–
Initial Buggy Commit not on Weekend
35.330461(24.620914, 48.102542)
Initial Buggy Commit Work Hours–
Initial Buggy Commit not Work Hours
1.320736(0.272528, 3.068727)
Research Questions (B)
Same Author Bug Fix–
Different Author Bug Fix
543.990805(506.822835, 578.456770)
Same User is Author and Committer–
Different User is Author and Committer
14.924(9.481,23.603)
More than 25 Committers–
Less than 25 Committers
−262.823369(−304.192357, −226.864087)
More than 40 Authors–
Less than 40 Authors
−225.802457(−261.235513, −193.823217)
Table 4. Hazard Ratio (HR) of categorical attributes of projects with count and confidence intervals for ratios.
AttributeValueNRatio
same authorNo13,795reference (1)
Yes17,9581.71 (1.67–1.74) ***
bug intro. work hoursNo11,726reference
Yes20,0270.96 (0.94–0.98) ***
bug intro. weekendNo27,839reference
Yes39141.12 (1.08–1.15) ***
code authors > 40No1546reference
Yes30,2070.57 (0.53–0.61) ***
code committers > 25No692reference
Yes31,0610.60 (0.54–0.62) ***
*** p < 0.001.
Disclaimer/Publisher’s Note: The statements, opinions and data contained in all publications are solely those of the individual author(s) and contributor(s) and not of MDPI and/or the editor(s). MDPI and/or the editor(s) disclaim responsibility for any injury to people or property resulting from any ideas, methods, instructions or products referred to in the content.