Abstract
During drilling operations, stuck pipe occurs from time to time due to various reasons such as continuous changes of the formation lithology, failure to return the drill cuttings in time, shrinkage or collapse caused by soaking the formation with drilling fluid, and steps in the well wall caused by the drill-down. After the stuck pipe, the identification of the stuck pipe type can only be guessed by manual experience due to the jamming of the drill stem downhole, which lacks a scientific basis. Moreover, there is a lack of studies on the stuck pipe type. Therefore, scientific and accurate identification of the stuck pipe type is of great significance for timely unsticking and resuming drilling. In this paper, based on the friction torque rigid rod model of a3D well track, we obtained the degree of deviation of measured parameters from the normal trend, which can scientifically evaluate the degree of stuck pipe. Based on the SAX morphological symbolic aggregation approximation method, we obtained the changing trend of measured parameters during the stuck pipe, which can accurately describe the change laws of characteristic parameters during the stuck pipe. Based on the statistical characterization laws of different stuck pipe types in Sichuan and Chongqing, we established the knowledge graph of stuck pipe types, which can correlate with the complex knowledge of different stuck pipe types. The stuck pipe type can be identified according to the degree of stuck pipe, the changing trend of the characteristic parameters of stuck pipe, and the knowledge graph of stuck pipe types. The results show that the method can combine digital twins and the knowledge graph to accurately identify the stuck pipe type and provide a basis for taking targeted deconstruction measures.
1. Introduction
Due to the uncertainty of the geological environment during the drilling process, there are phenomena such as falling blocks in the well wall and creep of stratum, which further deform the well and narrow the well diameter, thus easily resulting in falling block stuck pipe, diameter-shrinkage stuck pipe, and differential pressure stuck pipe. In addition, due to the influence of engineering factors, drilling operations such as pulling out, drill-down, and drafting processes can cause the drilling tool to step in the inclined section of the well, forming the key seat stuck pipe. Moreover, too fast drilling time and too short circulation time make rock chips gradually accumulate, thus forming the cutting-bed stuck pipe. According to the drilling company’s statistics of the stuck pipe types in Sichuan and Chongqing in 2020–2021, the main stuck pipe types are falling block stuck pipe, collapse stuck pipe, followed by keyway stuck pipe and differential pressure stuck pipe, with a total of stuck pipe of more than 40 wells. The identification of the stuck pipe type only relies on the experience of field engineers, which lacks standardization and scientific basis and is difficult to ensure the accuracy of identification, and cannot make full use of the data of pulling out, drill-down, and circulation before the stuck pipe. In addition, the studies on stuck pipe are mostly for early warning, and there is a lack of studies related to the identification of stuck pipe types. Therefore, we strengthen the research on the identification of stuck pipe types by combining a physical model and data analysis, which not only helps to take correct unblocking measures after the stuck pipe on the spot but also helps to study the early warning of different stuck pipe types.
The physical model for the identification of sticking began to develop from the soft string model put forward by Johansick [1] for calculation of frictional torque. The model was a simple solution and could meet the calculation requirements under general conditions. The rigid rod model [2,3] put forward by He improved the calculation precision and was capable of coupling with the curved interval with a large curvature change and drill collar and heavy weight drill pipe with a large rigidity. Most of the subsequent calculation models of frictional torque develop and improve based on these two models and provide frictional torque board chart in the site to assist the monitoring of sticking [4,5]. As the monitoring technology of sticking gradually becomes automatic and intelligent, SVM, LSTM, clustering analysis, Bayesian network and particle swarm are used to analyze the data trend of sticking in a supervised or unsupervised way in some studies [6,7], improving the accuracy of complex accident identification, while the analysis on sticking only in a data-driven way is not comprehensive and the normal trend of change of frictional torque presented by the model is ignored. The misdeclaration of sticking occurs very easily, so the research about early warning of sticking gradually develops to digital twin, namely taking full advantage of the 3D well track, well cleanliness, drilling tool assembly, real-time logging data and derived data of frictional torque model calculation model, and hydraulic calculation model for automatic real-time monitoring of well drilling [8,9,10], improvement of safety and reduction of costs via digital twin technology to accurately analyze the probability of sticking from the angle of mechanics, and data change. For example, the frictional torque roadmap simulated is used to monitor the hanging load for pulling out of the hole, the hanging load when running in hole, and the idling hookload [11] subject to real-time measurement to identify the sticking.
With the development of digital twin technology, the combination of physical model and intelligent algorithm has become the trend of current engineering technology. As for the specific engineering problem, using the physical model, basic data, and intelligence algorithm at the same time has become the main technology for monitoring and identifying complex faults. The PAA is a classical similarity analysis and pattern recognition algorithm in which the dimensionality reduction technology is used to create a simplified signal representation. Firstly, as for the PAA proposed by Keogh et al. [12], the dimensions of the data were reduced by taking an average on the equally spaced frame. The SAX was first put forward by Lin and Keogh [13], with such advantages as quick dimensionality reduction, high recognition precision, and high robustness. The SAX can be used to aggregate the time series segmentations into symbol, with similarity between the whole curve and the contrast curve obtained by calculating the distance between symbols and was developed by extension based on PAA. The good results were obtained by it in terms of fault identification [14], ECG signal recognition [15], and anomaly detection [16], and it has been widely used for the digital twin domain in all industries.
The knowledge graph is an emerging knowledge representation method. Through the expression of the triad “entity-relationship-entity”, a knowledge graph containing documents and expert experience on stuck drill type identification can be constructed to correlate the complex knowledge of different stuck pipe types. The unstandardized manual identification method can be replaced by compiling the knowledge graph into software to identify stuck pipe types, thus improving the accuracy of stuck pipe type identification. The knowledge graph is a representation of concepts and relationships in the form of nodes and edges, which can be constructed in various ways using resources such as pre-existing databases or text. It can represent a huge number of subject–object relationships, thus forming a knowledge graph with searchable and mineable effective information. For example, the knowledge graph is used to construct the specific knowledge graph in the oil exploration and development field. The intelligent search and Q&A system for petroleum exploration and development is formed by the natural language processing based on assembly of multi-source heterogeneous data and construction of one million nodes [17]. A good effect is embodied in terms of knowledge service. The large-scale integration and intelligent application of big data in the petroleum exploration and development field is accelerated. The knowledge graph has been widely used in various fields. For example, a good effect is obtained in the medical aspect [18,19,20], semantic recognition [21,22], railway flow optimization [23], smart city [24], natural language processing [25,26], and digital twin technology in the manufacturing industry [27].
On the basis of previous studies, the measured data are compared with the simulation results based on the rigid rod model for frictional torque of 3D well track to obtain the deviation degree of the measured parameter from the normal trend, the intelligence algorithm is used to analyze the trend of measured data changes in the process of sticking, the knowledge graph for the type of sticking is established based on the law of representation of different types of sticking, and the diagnosis on the type of sticking is realized according to physical model, intelligent method, and knowledge graph in this paper. The method proposed in this paper can be used to quickly identify the type of sticking in the site based on the digital twin and knowledge graph, providing the basis for scientific and accurate formulation of free stick measures.
2. Materials and Methods
2.1. Identification of Sticking Degree Based on Physical Model and Particle Swarm Optimization Algorithm
2.1.1. Physical Model of Hookload and Torque Based on 3D Borehole
In a three-dimensional curved well section, the well deviation and orientation are always changed. The bending of the pipe string element is a spatial curve, and its force is a spatial force system. According to the spatial geometric approximation, Figure 1 shows that the force and deformation of the pipe string element can be decomposed into two upper planes f, and finally solved according to the principle of force superposition.
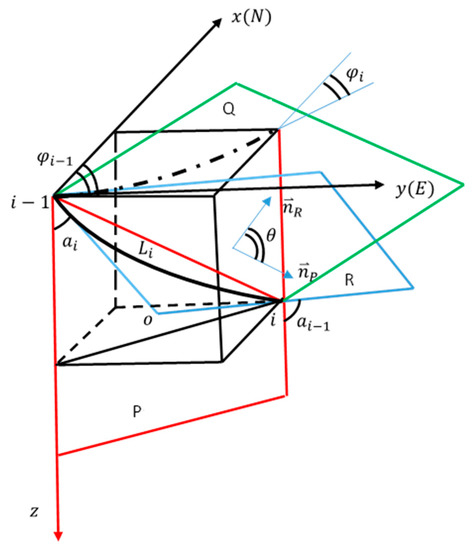
Figure 1.
Relationship among R, P, Q planes of a 3D curved well section.
Firstly, the stress and deformation of the drill string element are decomposed into two planes, the first vertical plane consisting of chord and Z axis is the P plane, and its normal vector is ,
The second plane is a plane composed of , and , called R plane, which is the dogleg angle plane defined by Rubinski. Its normal vector is .
Angle between P plane and R plane is .
Unit Dog leg angle is :
If the curved well section is an angle building well section, the “±” item in the above formula is taken as “−”, and if it is a drop-off interval section, it is taken as “+”. For the force balance analysis of the unit, the mechanical model of the pipe string unit is established as follows:
If the string is lifted, the “±” item in the above formula is taken as “+”; if the string is lowered, it is taken as “−”. The radial support force on the unit of section i is :
Angle building well section , drop-off interval section , P plane and R plane radial support force , are as follows
If the curved well section is an angle building well section, the “±” item in the above formula is taken as “−”, and if it is a drop-off interval section, it is taken as “+”. Shear force difference between upper and lower ends of the unit:
If the string is lifted, the “±” item in the above formula is taken as “+”; if the string is lowered, it is taken as “−”.
If the curved well section is an angle building section, the “” item in the above formula is “+”, and if it is a drop-off interval section, it is “−”, including:
The torque calculation expression formula is:
—Elastic modulus of drill string stiffness (); —Moment of inertia of unit (—Floating weight of drill pipe in drilling fluid (); —Unit length of section I (); —Axial tensile force (N) on both ends of the element at the ith section; —Torque load at both ends of section i unit (—Bending moment (N⋅m) on both ends of the element at the ith section on the plane P; ——Bending moment at both ends of segment i element on R plane (—Bending moment (N⋅m) on both ends of the element at the ith section on the plane P; —Well deviation angle at both ends of the unit of section i and its increment and average value (rad); —Friction coefficient, dimensionless; —Circumferential friction coefficient, dimensionless; —Curvature radius of the i segment element on P plane and R plane (—Dog leg angle and azimuth angle at both ends (rad).
The model can simulate the value of hookload with different friction coefficient varying with well depth. It can help to identify the degree of sticking pipe. Take a horizontal well in Sichuan as an example for calculation. The M well trajectory data are shown in Table 1. The current bottom hole assembly (BHA) for the open hole are shown in Table 2 and the drilling fluid performance and drilling parameters are shown in Table 3.

Table 1.
Well trajectory data for well M.

Table 2.
Current bottom hole assembly (BHA) for well M open hole.

Table 3.
Drilling fluid performance and drilling parameters for well M.
The above parameters are used to simulate the friction and torque of M well. Figure 2 shows the distribution of hookload with depth, and simulates the POOH hookload with friction coefficient of 0.5, 0.45, 0.4, 0.35, 0.3, 0.25, 0.2, 0.15, 0.1 and the RIH hookload with friction coefficient of 0.1, 0.15, 0.2, 0.25, 0.3, 0.35, 0.4, 0.45, 0.5. Combined with the measured POOH and RIH hookload value, the approximate deviation degree of the sticking pipe can be obtained. The orange scatter points in Figure 2 indicate the measured POOH hookload of the well, which is generally distributed along the tripping hanging weight line with a friction coefficient of 0.3. According to the well M drilling log, there is no resistance in the well during tripping, indicating that tripping is safe. If there is a stuck phenomenon, the measured hookload of the well will gradually distribute to the friction coefficient of 0.4 or more.
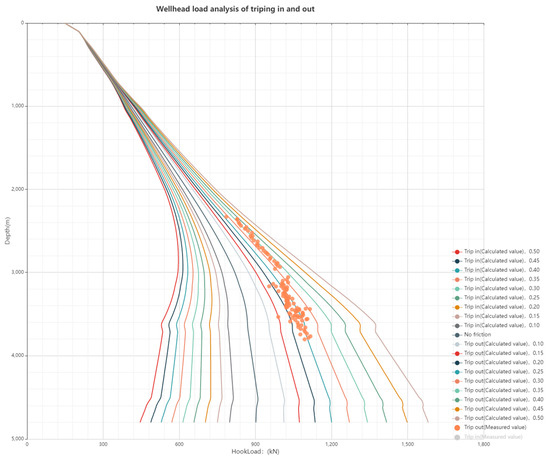
Figure 2.
Distribution of calculated hookload and measured POOH value for well M.
2.1.2. Identification Method of Sticking Degree Based on Particle Swarm Optimization and Physical Model of Hookload
Supposing that the problem is solved in D-dimensional search space. The population consists of m particles, that is to say that the position vector of the ith particle in the search space at the time k represents a possible solution to the problem. . The velocity vector corresponding to the particle represents the motion of the particle in each dimension of space. . The velocity and position of the ith particle in the d dimension at the time k + 1 are calculated as shown in Equation and Equation.
wherein,—Current position of the particles; —Velocity of movement of the particles; —Optimal value of the individual position of particles; —Optimal population position; w—Inertia factor; k—iterations; m—Population particle number; —Accelerated factor; —Random number; D—Space dimensionality.
(1) As for the population size m, a small number of particles is sufficient for general problems. m is generally 10–30 to reduce the computing cost; as for complex search spaces or specific types of problems, m can be 100–200, and even larger. (2) As for adjustable control parameters (including inertia factor w and acceleration factor c1 and c2), the inertia factor w is used to control the influence of the particle’s previous velocity on the current velocity, and its value is generally between (0,1). The acceleration factors c1 and c2 represent the acceleration weight of each particle moving towards the individual optimal position and the global optimal position, and their values influence the convergence and velocity of the particle. The appropriate control parameters can effectively enhance the particle optimization ability and convergence speed. (3) The initialization of particle space depends on the concrete problems, such as random initialization and linear initialization. Reasonable selection of particle initialization space can shorten the search time and improve the efficiency of the algorithm.
The particle swarm optimization is used to solve the problem of distance between two curves to set one point on the curve as a particle. N particles on each curve are taken, and the given curve is set as: , . Take N particles on each curve. Each example is represented by geometric position x_i (I = 1, 2, ⋯, N) and velocity vector of points v . The point is shifted along the velocity direction to the collection position of the new point . The points on the two curves are matched with and . The distance between them is . The shortest distance between the points N is . In the subsequent iteration process, and constantly change. The shortest distance and in the history is called as the individual optimal position of the ith pair, and the in the history is called as the population optimal position. The optimal position of the population is used as the shortest distance approximate value between curves. The distance between curves can be obtained by constantly updating the individual optimal position and the population optimal position by iteration.
is stuck pipe degree, is distance between measured value and calculated value during the process of pipe sticking, is distance between measured value and calculated value before stuck pipe, is number of stuck point sequences, and is number of point sequences before stuck pipe.
Figure 3 shows the measured POOH hookload value during the process of drill pipe sticking. The orange scatter points in the figure indicate the measured POOH hookload of the well, which gradually deviates to the route with high friction coefficient, the approximate deviation degree of the sticking pipe can be obtained by Figure 4 and Figure 5.
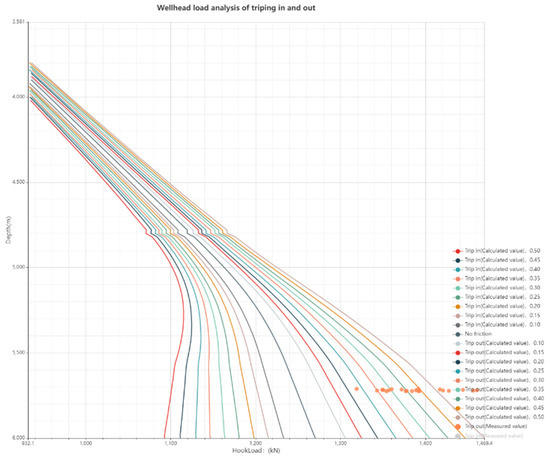
Figure 3.
Distribution of measured hookload for stuck pipe well.
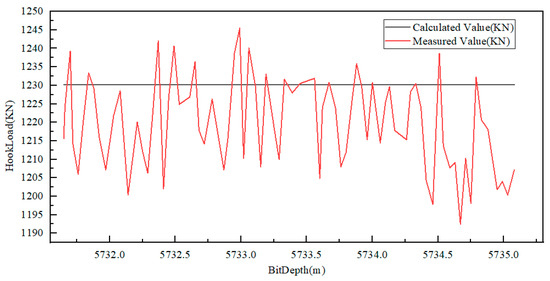
Figure 4.
Distribution of measured and calculated POOH hookload before stuck pipe.
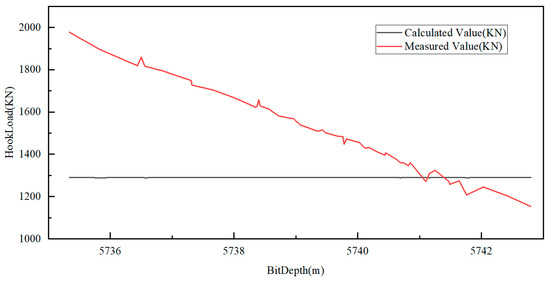
Figure 5.
Distribution of measured and calculated POOH hookload while sticking.
We combine Figure 4 and Figure 5, PSO and Hookload model to obtain the degree of stuck pipe. The results are shown in Table 4.

Table 4.
Degree of stuck pipe for well M.
2.2. Recognition of Sticking Rules Based on SAX Morphology Aggregation Method
2.2.1. Mechanism and Rule of Different Types of Sticking
Sticking is mainly divided into sticking due to cuttings bed, fall-block, differential pressure, hole shrinkage, collapse, and key seat [28].
Mechanism of different types of sticking:
Sticking due to key seat: A cylindrical groove is produced on the well wall (called key seat) due to long-term contact between the drill string and the well wall, rotary friction, and the scratching of large drilling tool at the time of pulling out of the hole/running in hole in the place with a large change in hole drift angle and azimuth angle. The dogleg key seat is generally smaller in diameter than the drill bit, and slightly larger in diameter than the joint. At the time of pulling out of the hole, the drill bit or large drilling tool will get stuck in the key seat, resulting in sticking due to the key seat. The thick shale is found to be mixed with sandstone under some special stratum conditions. After well drilling, the shale collapse causes the hole diameter to expand, while the sandstone maintains the original well diameter. When the drill string leans to the lower edge of the hole, it is supported laterally only by the protruding sandstone and the key seat is formed by the protruding greywacke. At the moment of pulling out of the hole, the drill pipe joint is prone to getting stuck in the greywacke key seat.
Sticking due to differential pressure: At the time of normal drilling, the solid particles in the mud gradually accumulate on the well wall to form mud cake, thus the pore pressure of the mud cake can be considered to be the same as that of the drilling fluid column at the same depth. When the drilling stops, the drill string in the horizontal section of the horizontal well will lie flat on the well wall and the moisture in the mud cake will be gradually pushed into the stratum by the drill string, causing the pore pressure of mud cake gradually decreases until being the same as the stratum pressure. However, the stratum pore pressure gradient is inconsistent in the same open hole section, the fluid column pressure must be able to balance the maximum formation pressure in the interval, the positive differential pressure will be formed in the stratum with low pressure gradients, and the drilling tool will be gradually pressed into the mud cake by the pressure difference, making the sticking due to differential pressure more serious.
Sticking due to cuttings bed: If the drilling cuttings fail to be taken out of the drill pipe in a timely manner when the displacement and the drilling rate do not match the well at the time of drilling rapidly in the horizontal section, the rock debris will settle to the lower edge of the horizontal section to form the cuttings bed. At the moment of drilling, the cuttings bed will increase the revolving resistance of the drill string and the torque, resulting in sticking. At the time of pulling out of the hole and running in hole, the large diameter tools (such as stabilizer and drill pipe joint) will push the rock debris in one direction for extrusion like a “bulldozer”, very easily giving rise to sticking. The principal factors of forming the cuttings bed can be summed up as follows: ① The cuttings bed is formed because the drilling fluid does not circulate for a long time and the rock debris particles gradually sink to the horizontal section. ② The cuttings bed is gradually formed because the rock debris is formed quickly at the time of drilling quickly and the displacement fails to meet the well cleanliness standard. ③ When the drilling fluid returns to some intervals with a large hole diameter, the rock debris tends to accumulate here. When a certain angle is reached, the rock debris will collapse and migrate to the bottom of the horizontal well, burying the lower drilling tool and forming the cuttings bed.
Sticking due to collapse: ① Geological factor: Original crustal stress: After the well has been drilled through, the stress field around the well is resolved anew. When the hydrostatic column pressure cannot balance the stratum lateral force, the stratum will collapse. Rock property: The stability of sedimentary rocks varies due to the different cementation degree, burial time, and depositional environment of sedimentary rocks, so the well wall collapse will easily occur when drilling the glutenite with poor cementation, the shale with joint development, and the crush zone formed by a fault. ② Physical and chemical factors: The hydrostatic pressure, hydration expansion, and capillary action are the main factors incurring the well wall collapse. When the drilling fluid filtrate immerses into the shale (clay) interior, the pore pressure, expansion pressure, etc. will be produced, with the structure of the clay weakened and linear decrease in its strength, resulting in collapse. ③ Drilling fluid factor: When the return velocity of drilling fluid in the annulus is high, it will be under the turbulent condition, which will cause impact on the well wall, giving rise to well wall collapse. Reducing the drilling fluid density to improve the drilling rate will cause the hydration expansion of the stratum, resulting in well collapse. At the moment of increasing the drilling fluid density to make the well wall stable, the stratum will be easily fractured, so the density design of drilling fluid is very important for well wall stability.
Sticking due to hole shrinkage: ① The moisture of the stratum creep shale fails to be discharged in a timely manner under the action of surrounding environment in the process of sedimentation, so the state of under-compaction exists in the compacting process. When drilling the stratum, the shale with water will creep rapidly towards the well due to the influence of the overlying strata pressure, resulting in hole shrinkage. ② The drilling fluid is capable of balancing the drill pipe pressure and keeping the well wall stable. When the drilling fluid density is low, the well wall will collapse or creep toward the center of the drill pipe, resulting in sticking due to hole shrinkage. When the density of drilling fluid increases, the hole shrinkage deformation rate of the well will gradually decrease, thus the critical value of drilling fluid density can be known by the curve of drilling fluid density and hole shrinkage deformation rate. If the drilling fluid density configured is greater than the critical density, sticking due to hole shrinkage can be avoided to a great extent.
Sticking due to fall-block: The mudstone section is very stratified, with slow drilling rate and long construction period, and the immersion of the open-hole section by the drilling fluid for a long time results in well wall instability. Once the large upper well wall fall-block is stuck between the bottom drill pipe joint and the lower well wall, the unsmooth local circulation will result in accumulation of rock debris, quickly causing the fall-block to get stuck between the drill string and the well wall. The essential reason of the fall-block is the slight well wall instability.
The following sticking laws and characteristics are obtained by the statistics of sticking laws in Sichuan and Chongqing. Mechanism and rule of different types of sticking are shown in Table 5.

Table 5.
Mechanism and rule of different types of sticking.
2.2.2. Curve Recognition Based on SAX Morphological Aggregation Approximation
In the literature on sticking types, there are variation trends for describing various parameters at the moment of sticking (such as gradual rising, gradual lowering, sudden rising, and sudden lowering), but the specific quantification fails. The SAX method is used to identify curve rules from the aspect of morphology and mean value to improve the identification accuracy, with monitoring by the moving window in this article. The quantity of logging parameters monitored and parameters calculated each time reaches 100. Move to the next window to continue monitoring after the analysis is completed. After Z-Score standardization of 100 data, the average of the Z values of 100 points will be obtained to obtain the mean characteristics of every five segments in the 20 points.
The normal distribution probability density function is calculated. The calculation formula is as follows:
The integration is conducted. The calculation formula is as follows:
The mean of u is 0 and the variance is in the formula. The probability integral results are divided into six equal parts to obtain six equally divided probability intervals: [−3, −0.962], [−0.962, −0.427], [−0.427, 0], [0, 0.427], [0.427, 0.962], and [0.962, 3]. σ. The corresponding aggregation symbols cover a, b, c, c, d, and e.
As for the slope aggregation method, the Z values of 20 points are subject to curve fitting pursuant to the least square method to obtain the slope of every 5 segments in 100 points (namely curve morphological characteristics) after Z-Score standardization of 100 data.
The slope calculation formula is as follows:
In the formula, k is the number of original data points observed. There five 5 sections and i refers to the time sequence number (i = 1, 2, 3, 4, 5). Because the quantity of observed data is 100 (20 in a group), there are five time sequences.
J is the serial number of the observation point, with j0 = k (I − 1) + 1 which refers to the aggregated slope value of the ith time sequence. Qj refers to original data value of observation, including calculation and monitoring parameters and logging while drilling parameters, .
To symbolize the slope, it is necessary to convert the slope domain to the mean domain, namely multiplying the slope by the time sequence span and multiplying the interval of S94 by 2 to obtain the interval value: [−6, −1.924], [−1.924, −0.854], [−0.854, 0], [0, 0.854], [0.854, 1.924], and [1.924, 6].
The corresponding aggregation symbols cover a, b, c, c, d, and e.
The polymerization approximation symbolization is used to represent the results and five given time series (slow increase, continuous increase, slow decrease, continuous decrease, and continuous stability) for the calculation of similarity measure. According to the calculation result, the change trend of logging while drilling data and calculation and monitoring parameters in the moving window is judged.
The given symbol sequences (ccddd, bbddd, bbcdd, and abcde) are specified as slow decrease sequences, the given symbol sequences (aaeee, aacee, aaeee, and bbeee) are specified as sudden decrease sequences, the given symbol sequences (ccccc, ccdcc, ccbcc, and cbccc) are specified as the continuous stability sequence, the given symbol sequences (ddaaa, ddcaa, eeaaa, and eecaa) are specified as the sudden increase sequences and the given symbol sequences (ccaaa, bbaaa, caaaa, and edcba) are specified as the slow increase sequences.
The metric calculation formula of symbolic distance is as follows:
m refers to the length of time series and is 20, and w refers to the dimension which is 1 in the formula. The observed series are divided into mean observation series and morphological observation series, and the given symbol sequence is divided into mean observation sequence and morphological observation sequence (namely slope coefficient). The MINDIST is the minimum distance value of two time series. After the measured mean and morphological sequence are obtained, they are calculated together with the given symbol sequences by the given minimum distance calculation method. The one with the smallest distance is similar to the corresponding given symbol sequence to obtain the trend judgment result of the sequence.
As for the traditional SAX symbolized character distance calculation method, the intervals corresponding to a, b, c, c, d, and e are [−,−0.97], [−0.97,−0.43], [−0.43, 0], [0, 0.43], [0.43, 0.97], and [0.97, +] upon calculation. The distance calculation method is the upper bound of symbol minus the lower bound of symbol. The calculation formula is as follows:
The calculation result between symbol distances are shown in Table 6:

Table 6.
SAX method symbol distance calculation results.
Use the SAX algorithm described in the previous section to calculate the symbol distance between the given symbol sequences and the trend time series to be judged to determine the trend of stuck pipe data. Figure 6 illustrates the flow of stuck data trend recognition based on the SAX method.
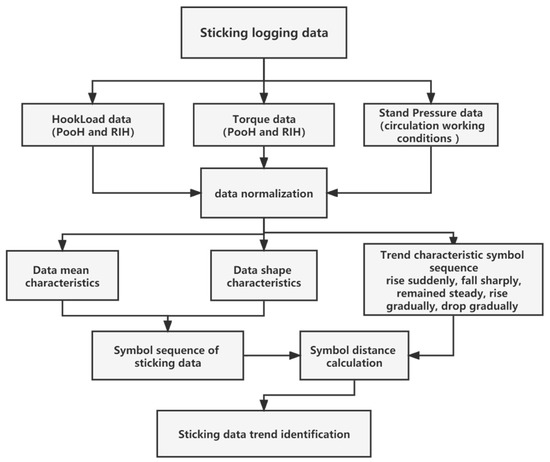
Figure 6.
Flow of stuck data trend recognition based on SAX method.
2.3. Recognition System of Stuck Pipe Type Knowledge Map Based on Digital Twin
2.3.1. The Construction of Knowledge Graph of Stuck Pipe Types Based on Digital Twins
The knowledge graph consists of an ontology library and an entity library, which are represented by three cells, where nodes and relations are represented as G = (node A, relation, node B), where G is three cells, the node represents a single node, and relation represents the relationship type between node A and node B. In order to improve the efficiency and quality of entity construction, we adopted a manual construction method in the combination of the existing expert experience to correlate the data features extracted in the previous section, the degree of stuck pipe, the log of the well, and other multi-source information with the stuck pipe type, thus constructing the knowledge graph of the stuck pipe type, which is shown in Figure 7.
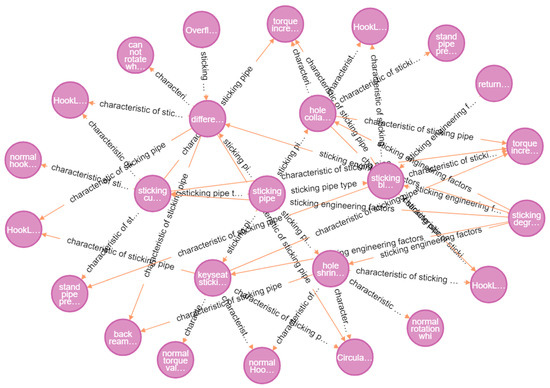
Figure 7.
Knowledge graph of stuck pipe types based on digital twins.
2.3.2. Recognition System of Stuck Pipe Type Based on Knowledge Graph
The intelligent recognition system of stuck pipe type was established by constructing a question-answering system, and the technical principle is shown in Figure 8. The physical model in the previous section, the SAX analysis model of the data trend, and the statistical query of some information such as the log section of the case well were used to describe the incident characteristics of the case well, which then were automatically converted into the query commands of the knowledge graph through the software. After that, based on these characteristics, we used the software to provide some questions, which were made to locate the corresponding concepts and entities in the knowledge graph. In other words, we can search for whether there are relevant stuck pipe types in the knowledge graph, thus achieving the identification of stuck pipe types.
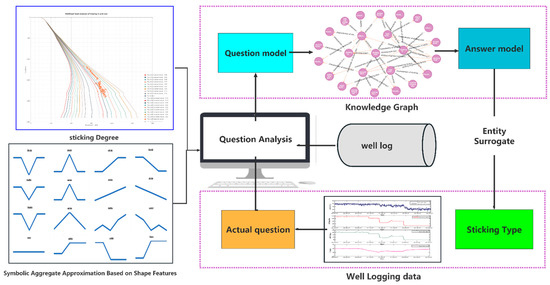
Figure 8.
Recognition flow of stuck drill type using knowledge graph and digital twins.
For example, if the degree of stuck pipe at the pulling out exceeds 30%, the back reaming torque and the back reaming hookload gradually increase, the reaming torque and the reaming hookload gradually decrease, and the standpipe pressure increases during the circulation process. The above features can be input into the graph for identification to achieve a matched stuck pipe type, that is cutting-bed stuck pipe.
3. Results and Discussion
3.1. Results
The trajectory data of well N in Moxi, Sichuan are shown in Table 7. The current bottom hole assembly (BHA) for the open hole are shown in Table 8 and the drilling fluid performance and drilling parameters are shown in Table 9.

Table 7.
Well trajectory data for well N.

Table 8.
Current bottom hole assembly (BHA) for well N open hole.

Table 9.
Drilling fluid performance and drilling parameters for well N.
Drill log: the quiet lifting and lowering were normal after proactive reaming to well depth of 5040.03 m, the original hanging load was 1000 KN, the normal lifting friction was 300 KN, the normal lowering friction was 150 KN, and the reaming torque was 7–9 KN.m at 00:00–04:55, which at the time of pumping and lowering to the well depth of 5013.49 m at 04:55, the hanging load decreased from 850 KN to 800 KN, with blocking when lifting to the hanging load: 1350 KN as well as the top drive was rotated and the torque increased to 10KN.m with standpipe pressure: 14.9–16.2 MPa and displacement: 752–780 L/min when lowering to the hanging load: 1000 KN. At 04:55–06:40, the drilling tool was moved at the hanging load: 1000–2100 KN, with intermittent torque: 15–18 KN.m, standpipe pressure: 15.9–16.3 MPa and displacement: 780–803 L/min and no free stick. At 06:40–08:00, the drilling tool was moved at the hanging load: 1000–1600 KN, with no free stick, but standpipe pressure: 16.4–16.9 MPa and displacement: 790–829 L/min. It is judged as key seat stuck-type.
According to the basic data and the Logging data as shown in Figure 9, we could obtain the deviation of the tripping out measured value when the drill is stuck and the deviation of the tripping out measured value when the drill is not stuck. as shown in Figure 10 and Figure 11. It can be seen from the figure that before the occurrence of pipe sticking, the scatter value is still in the road map. After the occurrence of pipe sticking, the scatter value deviates from the road map and the pipe sticking occurs, which is the same as the description in the drilling log.
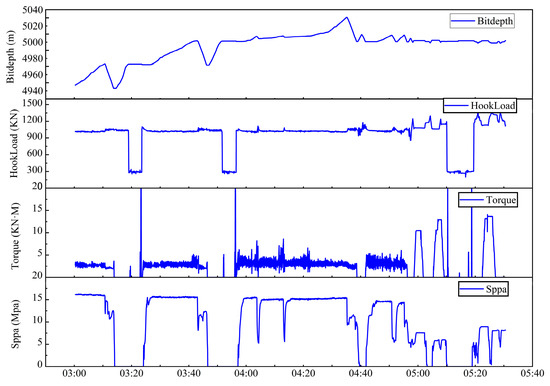
Figure 9.
Stuck well logging data for well N.
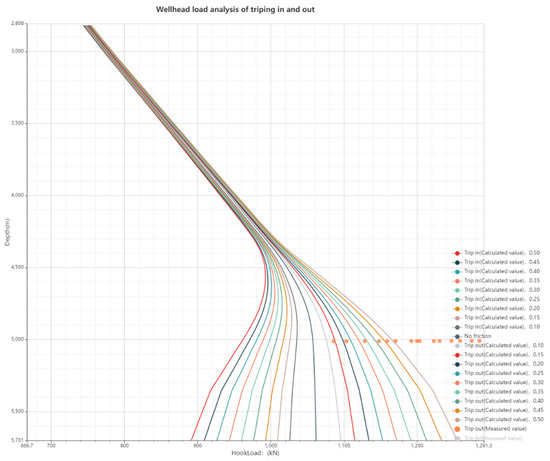
Figure 10.
The deviation of the measured POOH hookload value after stuck for well N.
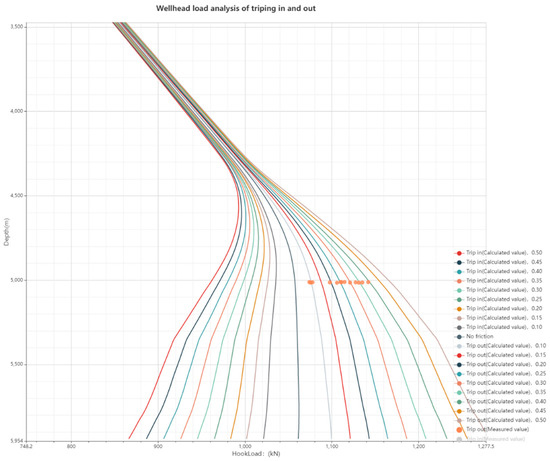
Figure 11.
The deviation of the measured POOH hookload value before stuck for well N.
Combining Table 7, Table 8 and Table 9 and recorded data, the hookload data at the pulling out and drill-down before the stuck pipe and after the stuck pipe were extracted. According to the calculation method of the degree of stuck pipe and Figure 11, Figure 12, Figure 13 and Figure 14, the degree of stuck pipe was calculated as 92.4%, the result is shown in Table 10 indicating that the drill stem was stuck during the pulling out, while the RIH hookload and torque behaved normally without abnormal changes after the stuck pipe. According to the drilling log, the stuck pipe time was identified as 4:55 to 5:05. The trend analysis of the stuck pipe data was performed by the SAX method, which showed that after the stuck pipe, the hookload and the torque at the pulling out gradually increased after the stuck pipe, the RIH hookload and the RIH torque were all normal, and the pump pressure was normal under the circulation conditions. The trend identification results of the stuck pipe data are shown in Table 11. The above features were input into the knowledge graph for identification to achieve a matched stuck pipe type, that is, the keyway stuck pipe. The judgment result is consistent with the drilling log.
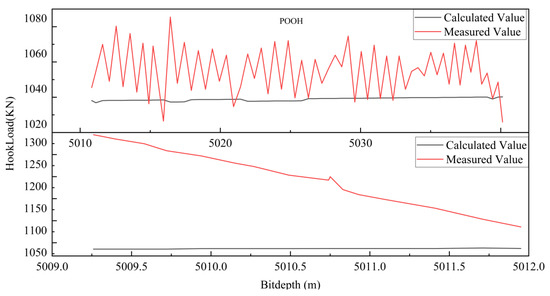
Figure 12.
Stuck degree of POOH data for well N.
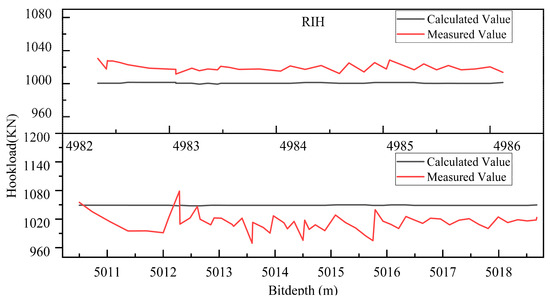
Figure 13.
Stuck degree of RIH data for well N.

Figure 14.
Circulation data for well N.

Table 10.
Degree of stuck pipe for well N.

Table 11.
Recognition results of the stuck data from 4:55 to 5:05 using SAX method.
3.2. Discussion
At present, the stuck pipe type is guessed based on the field engineer’s experience, and the available data cannot be fully utilized. This paper can make full use of the data of well structures, drilling tool assembly, well track, and comprehensive logging data before and after the stuck pipe to analyze the stuck pipe type. By extracting the calculation results of the hookloads before and after the stuck pipe, and the friction torque model, we scientifically evaluated the degree of stuck pipe after the stuck pipe. By identifying the changing trend of the characteristic parameters of the stuck pipe through the SAX method, we accurately described the change laws of the characteristic parameters of the stuck pipe. By combining the characteristic laws of different stuck pipe types with expert experience, we constructed a knowledge graph for identifying the stuck pipe type, which can correlate with the complex knowledge of different stuck pipe types. Finally, we perform an integrated analysis on the analyzable degree of stuck pipe and the trend of characteristic parameters through the knowledge graph to achieve accurate identification of the stuck pipe type, which is fast, accurate, and avoids misjudgment of the stuck pipe type.
4. Conclusions
- (1)
- The variation of hookload and torque along the depth of the well during the pulling out and drill-down process was simulated and analyzed based on the friction torque rigid rod model of 3D well bore. The degree of stuck pipe of the measured stuck pipe data was evaluated by the particle swarm algorithm.
- (2)
- The SAX morphology aggregation approximation algorithm was used to identify the variation trends of measured hookload, torque, and standpipe pressure gradually rising, gradually falling, suddenly rising, suddenly falling, and continuously stable. It can assist in identifying the curve change pattern of different stuck pipe types.
- (3)
- The knowledge graph can make use of the expression of the triad “entity-relationship-entity” to complete the association of knowledge of different stuck pipe types. The method of identifying stuck pipe types through a stuck pipe knowledge graph can make full use of the analysis results of digital twins to analyze the stuck pipe types, instead of the manual experience to discriminate the stuck pipe types.
- (4)
- The knowledge graph of stuck pipe types constructed by using digital twins and expert experience can effectively improve the accuracy of model identification. The field calculation example shows that the method can identify the stuck pipe type based on real-time surface measurement parameters and provide a basis for taking targeted deconstruction measures.
Author Contributions
Conceptualization, Q.L., J.W. and H.Y.; methodology, J.W.; software, J.W.; validation, J.W., H.Y. and Q.L.; formal analysis, J.W.; investigation, Q.L.; resources, Q.L.; data curation, J.W.; writing—original draft preparation, J.W.; writing—review and editing, J.W.; visualization, J.W.; supervision, J.W.; project administration, Q.L.; funding acquisition, Q.L. All authors have read and agreed to the published version of the manuscript.
Funding
This work was supported by the China National Key Research and Development Project (2019YFA0708302).
Institutional Review Board Statement
Not applicable.
Informed Consent Statement
Not applicable.
Data Availability Statement
Not applicable.
Conflicts of Interest
The authors declare no conflict of interest.
References
- Johancsik, C.A.; Friesen, D.B.; Dawson, R. Torque and Drag in Directional Wells-Prediction and Measurement. J. Pet. Technol. 1984, 36, 987–992. [Google Scholar] [CrossRef]
- Ho, H.S. General Formulation of Drillstring under Large Deformation and Its Use in BHA Analysis. In Proceedings of the SPE Annual Technical Conference and Exhibition, New Orleans, LA, USA, 5–8 October 1986. [Google Scholar]
- Ho, H.S. An Improved Modeling Program for Computing the Torque and Drag in Directional and Deep Wells. In Proceedings of the SPE Annual Technical Conference and Exhibition, Society of Petroleum Engineers, Houston, TX, USA, 2–5 October 1988. [Google Scholar]
- Miyoshi, M.H.; de Rosso, N.; Negrao, C.O.R. A mathematical model for the pull-out of a drill string immersed in a cuttings bed. J. Pet. Sci. Eng. 2022, 216, 110706. [Google Scholar] [CrossRef]
- Ding, Y.; Wang, H.; Yang, D. Determination of Effective Drag Forces and Torques for Jam Release During Drilling and Workover Operations in Directional Wells. J. Energy Resour. Technol. 2022, 144, 013002. [Google Scholar] [CrossRef]
- Zhao, J.; Shen, Y.; Chen, W.; Zhang, Z.; Johnston, S. Machine Learning–Based Trigger Detection of Drilling Events Based on Drilling Data. In Proceedings of the Spe Eastern Regional Meeting, Lexington, KY, USA, 4–6 October 2017. [Google Scholar]
- Cayeux, E.; Daireaux, B.; Dvergsnes, E.; Sælevik, G. Early Symptom Detection Based on Real-Time Evaluation of Downhole Conditions: Principles and Results from several North Sea Drilling Operations. In Proceedings of the Society of Petroleum Engineers SPE Intelligent Energy International, SPE Intelligent Energy International, Utrecht, The Netherlands, 27 March 2012. [Google Scholar]
- Salminen, K.; Cheatham, C.; Smith, M. Stuck Pipe Prediction Using Automated Real-Time Modeling and Data Analysis. J. Pet. Technol. 2016, 68, 72–73. [Google Scholar]
- Zhu, S.; Song, X.; Zhu, Z.; Yao, X.; Liu, M. Intelligent Prediction of Stuck Pipe Using Combined Data-Driven and Knowledge-Driven Model. Appl. Sci. 2022, 12, 5282. [Google Scholar] [CrossRef]
- Rommetveit, R.; Mayani, M.G.; Nabavi, J.; Helgeland, S.; Hammer, R.; Råen, J. Automatic Realtime Monitoring of Drilling Using Digital Twin Technologies Enhance Safety and Reduce Costs. In Proceedings of the Abu Dhabi International Petroleum Exhibition & Conference, Abu Dhabi, Dubai, 11–14 November 2019. [Google Scholar]
- Ugochukwu, O.; Verity, S. Using Robust Torque and Drag Modelling Software for Efficient Well Planning and Operations Monitoring. Paradigm Sysdrill for OML 126 Wells—A Case Study. In Proceedings of the SPE Nigeria Annual International Conference and Exhibition, Lagos, Nigeria, 5–7 August 2014. [Google Scholar]
- Koegh, E.; Chakrabati, K.; Pazzani, M.; Mehrotha, S. Dimensionality Reduction for Fast Similarity Search in Large Time Series Databases. Knowl. Inf. Syst. 2001, 3, 263–286. [Google Scholar] [CrossRef]
- Lin, J.; Keogh, E.; Wei, L.; Lonardi, S. Experiencing SAX: A novel symbolic representation of time series. Data Min. Knowl. Discov. 2007, 15, 107–144. [Google Scholar] [CrossRef]
- Gallimore, M.S.; Bingham, C.M.; Riley, M. Validating and estimating the benefits of introducing urban traffic control systems. In Proceedings of the IEEE International Symposium on Applied Machine Intelligence & Informatics, Herl’any, Slovakia, 26–28 January 2017. [Google Scholar]
- Bountrogiannis, K.; Tzagkarakis, G.; Tsakalides, P. Distribution Agnostic Symbolic Representations for Time Series Dimensionality Reduction and Online Anomaly Detection. arXiv 2021. [Google Scholar] [CrossRef]
- Tamura, K.; Sakai, T.; Ichimura, T. Time series classification using MACD-Histogram-based SAX and its performance evaluation. In Proceedings of the IEEE International Conference on Systems, Budapest, Hungary, 9–12 October 2016. [Google Scholar]
- Tang, X.; Feng, Z.; Xiao, Y.; Wang, M.; Ye, T.; Zhou, Y.; Meng, J.; Zhang, B.; Zhang, D. Construction and application of an ontology-based domain-specific knowledge graph for petroleum exploration and development. Geosci. Front. 2022, 101426. [Google Scholar] [CrossRef]
- Nicholson, D.N.; Greene, C.S. Constructing knowledge graphs and their biomedical applications. Comput. Struct. Biotechnol. J. 2020, 18, 1414–1428. [Google Scholar] [CrossRef] [PubMed]
- Harnoune, A.; Rhanoui, M.; Mikram, M.; Yousfi, S.; Elkaimbillah, Z.; El Asri, B. BERT based clinical knowledge extraction for biomedical knowledge graph construction and analysis. Comput. Methods Programs Biomed. Update 2021, 1, 100042. [Google Scholar] [CrossRef]
- Sakor, A.; Jozashoori, S.; Niazmand, E.; Rivas, A.; Bougiatiotis, K.; Aisopos, F.; Iglesias, E.; Rohde, P.D.; Padiya, T.; Krithara, A.; et al. Knowledge4COVID-19: A semantic-based approach for constructing a COVID-19 related knowledge graph from various sources and analyzing treatments’ toxicities. J. Web Semant. 2023, 75, 100760. [Google Scholar] [CrossRef] [PubMed]
- García, R.; López-Gil, J.M.; Gil, R. Rhizomer: Interactive semantic knowledge graphs exploration. SoftwareX 2022, 20, 101235. [Google Scholar] [CrossRef]
- Krause, S.; Hennig, L.; Moro, A.; Weissenborn, D.; Xu, F.; Uszkoreit, H.; Navigli, R. Sar-graphs: A language resource connecting linguistic knowledge with semantic relations from knowledge graphs. J. Web Semant. 2016, 37, 112–131. [Google Scholar] [CrossRef]
- Zeng, J.; Tang, J. Combining knowledge graph into metro passenger flow prediction: A split-attention relational graph convolutional network. Expert Syst. Appl. 2023, 213, 118790. [Google Scholar] [CrossRef]
- Ahmed, U.; Srivastava, G.; Djenouri, Y.; Lin, J.C.-W. Knowledge graph based trajectory outlier detection in sustainable smart cities. Sustain. Cities Soc. 2022, 78, 103580. [Google Scholar] [CrossRef]
- AlMousa, M.; Benlamri, R.; Khoury, R. A novel word sense disambiguation approach using WordNet knowledge graph. Comput. Speech Lang. 2022, 74, 101337. [Google Scholar] [CrossRef]
- Dessí, D.; Osborne, F.; Recupero, D.R.; Buscaldi, D.; Motta, E. SCICERO: A deep learning and NLP approach for generating scientific knowledge graphs in the computer science domain. Knowl. Based Syst. 2022, 258, 109945. [Google Scholar] [CrossRef]
- Meyers, B.; Van Noten, J.; Lietaert, P.; Tielemans, B.; Hristov, H.; Maes, D.; Gadeyene, K. Knowledge Graphs in Digital Twins for Manufacturing-Lessons Learned from an Industrial Case at Atlas Copco Airpower. IFAC-PapersOnLine 2022, 55, 13–18. [Google Scholar] [CrossRef]
- Xiwen, J. Drilling Accidents and Complex Problems; Petroleum Industry Press: Beijing, China, 2006; pp. 10–90. [Google Scholar]
Disclaimer/Publisher’s Note: The statements, opinions and data contained in all publications are solely those of the individual author(s) and contributor(s) and not of MDPI and/or the editor(s). MDPI and/or the editor(s) disclaim responsibility for any injury to people or property resulting from any ideas, methods, instructions or products referred to in the content. |
© 2023 by the authors. Licensee MDPI, Basel, Switzerland. This article is an open access article distributed under the terms and conditions of the Creative Commons Attribution (CC BY) license (https://creativecommons.org/licenses/by/4.0/).