Abstract
Taking the multi-component perspective in Predictive Maintenance (PdM) is one promising approach to improve prediction quality. Therefore, detection and modeling of interdependencies within systems are important, especially as systems become more complex and personalized. However, existing solutions in PdM mostly focus on a single-component perspective, neglecting the dependencies between components, even if interdependencies can be found between most components in the real world. The major reason for this lost opportunity is the challenge of identifying and modeling interdependencies between components. This paper introduces a framework to identify interdependencies and explain their impact on PdM within a Multi-Component System (MCS). The contribution of this approach is two-fold. First, it shows the impact of modeling interdependencies in predictive analytics. Second, it helps to understand which components interact with each other and to which degree they affect the deterioration state of corresponding components. As a result, our approach can identify and explain the existence of interdependencies within components. In particular, we demonstrate that time from last change of component is a valuable feature to quantify interdependencies. Moreover, we show that taking into account the interdependencies provides a statistically significant improvement of f1-score by 7% on average compared to the model where interdependencies are neglected. We expect that our findings will improve maintenance scheduling in the industry while improving prediction models in general.
1. Introduction
Predictive maintenance (PdM) is one of the core use cases in Industry 4.0 that enables maintenance actions at the optimal time, hence preventing machine failures and unexpected breakdowns. But digitization also imposes shorter product life cycles and fosters the customization of machines resulting in products composed of many different components. This poses a particular challenge to employees, as they do not know all characteristics of their machines in detail for the planning of maintenance actions [1]. In the literature, data-driven PdM approaches rely on the Single Component Systems (SCS) perspective, mostly neglecting interdependencies between components [2,3,4] and thus this new complexity. So far, the PdM results are acceptable; however, production lines and their configuration are changing more frequently, or different variants of one machine can be found in practice. All these challenges and limitations lead to the need for new approaches that could help to facilitate PdM. MCS’s perspective toward PdM can help to address these challenges and, at the same time, offers better prediction quality.
An MCS is a system that consists of multiple components that interact with each other [5]. In existing research, MCS approaches are generally applied in maintenance research fields, such as corrective maintenance and preventive maintenance, but rarely in PdM [4]. However, the availability of condition monitoring data due to various embedded sensors within manufacturing systems provides a solid basis to consider data-driven PdM in the context of MCS. Moreover, existing research works in the field of MCSs towards PdM assumed and showed that interdependencies between components could be found [2,3,4]. In practice, the interdependencies are described and modeled based on domain knowledge. In real-world scenarios where an old worn-out, and a newly changed component are coupled within a complex system, the deterioration rate of the new component and the system might accelerate due to the effect of the old worn-out component. In this case, the degree of interdependencies evolves faster, which might diverge from the description provided in the service manual. In many cases, the manufacturer is unwilling to share details that describe interdependencies between components due to the sensitivity and business-critical knowledge they contain [6]. Further, understanding and describing all interdependencies from experience in a highly customized product is much more challenging. Therefore, it is crucial to identify and model the interdependencies entirely from data in an accurate way to provide suitable decision support [7]. This could provide different benefits, such as increasing predictive results or improving model explainability, thus, optimizing maintenance scheduling and providing more realistic solutions, which are applicable in real complex systems [2,4,8,9]. However, to the best of our knowledge, the impact of modeling interdependencies in predictive models is not demonstrated so far.
Cardoso and Ferreira [10] introduced a common PdM use case application in an industrial setting. This work aims to predict component failures using sensor and maintenance data. In particular, the usage time of a specific component is included under the assumption that this information helps to predict the failures of this component. This behavior is known as the intrinsic effect in literature [2], which assumes and considers the existence of own dependency concerning the corresponding component. However, the interdependencies between components are not assumed. Therefore, in this work, we aim to demonstrate that along with intrinsic dependency, the interdependencies between components are critical while building a predictive model. Whereby, we extend the PdM approach based on Machine Learning (ML) tools introduced in [10] toward MCSs perspective, thus, illustrating the impact of MCS interdependencies within the PdM approach and improved interpretation of the black-box predictive model. Note that the focus of this work is only on showing the impact of interdependencies within an MCS, which provides valuable knowledge to improve predictive results, and the maintenance scheduling is beyond the scope of this paper.
This paper shows the benefits of the MCS perspective toward PdM. In this case, we demonstrate the impact of interdependencies on predictive results. This provides an awareness of the importance of understanding and modeling interdependencies. Moreover, a new encoding way of interdependencies suitable for predictive models is defined. Furthermore, explainable AI (XAI) approaches are used to explain interdependencies and their effect within a predictive model. As a result, this can improve prediction quality, model transparency, and system performance in general.
2. Background
2.1. Predictive Maintenance
Recently, with the emergence of Industry 4.0, PdM has become one of the most effective solutions to address smart manufacturing and industrial big data with respect to fault diagnosis and remaining life assessment [11]. Maintenance management approaches in manufacturing can be grouped into three main categories: corrective maintenance or run-to-failure, preventive maintenance, and PdM [11,12,13]. First, corrective maintenance considers the maintenance performed only after the occurrence of failures. In other words, corrective maintenance is a reactive approach. Second, preventive maintenance goes a step further and aims to react proactively. In this case, the maintenance is performed according to a planned schedule based on time or process iterations. The advantage of this approach is that failures are usually avoided. However, unnecessary maintenance often is performed due to planned actions. Third, PdM is a proactive approach, which performs maintenance based on the monitoring status of the system and components. In this approach, the core aspect needed for decision-making is the estimation of the system’s health status or components. This can be performed due to the available historical data of the machines and ML or statistical approaches [14].
The process of data-driven PdM can be divided into five stages: (1) operational assessment, (2) data acquisition, (3) feature engineering, (4) modeling, and (5) maintenance scheduling [8,11,15]. PdM is effectively applied in a wide range of different topics, such as bearings, blades, or driving motors [13]. This indicates that the PdM is focused on different fields of manufacturing, such as the electronics industry, semiconductors manufacturing [16], or additive manufacturing [17]. Furthermore, the health state of the system/components is successfully evaluated in different types of sensors, such as vibration [16,18] temperature [13], electrical signal [13], or even from log data [19]. For instance, vibration analysis can be used for the detection and identifying problems that are directly related to the vibration patterns of the health system [20]. Last but not least, both ML and deep learning approaches are widely applied for PdM solutions [17]. For instance, Nguyen and Medjaher [21] introduced a novel dynamic data-driven PdM framework based on the LSTM approach. This framework covers the entire PdM process, from data-driven prognosis using the LSTM to maintenance decisions. The LSTM model is trained using multivariate time series data to predict the probability of system failure. This work also discusses the impact of imperfect prognosis information on maintenance decisions. On the other hand, Chen et al., [22] proposed an enhanced dynamic PdM framework based on LSTM, which aims to predict failure moments and to determine the exact timing for long-term reliable maintenance decision-making.
In the digital age, PdM approaches are widely applied in manufacturing. However, predicting failures or maintenance actions of MCS can be very challenging due to the complexity of these systems as a result of the existence of interdependencies and the influence of other environmental conditions [2,3]. For instance, a complex system consists of components that last up to some years and components that have a shorter lifespan. In this context, components with a shorter lifespan will be replaced more often, leading to the scenario where newly replaced components are coupled with old worn-out components. The old worn-out component might affect the deterioration rate of the new component, leading to the accelerated rate of the new component and the whole system. Therefore, the lifespan of the newly replaced component and the system may not fit the exact description provided in the equipment manual. Hence, PdM approaches neglecting interdependencies can lead to imprecise or even erroneous estimation or predictive results, as well as reliable decision support in such a complex system [23,24]. As a result, accurate identification and modeling of interdependencies are required to help model and understand the deterioration process in a realistic way. To tackle these challenges, considering the MCS perspective seems promising.
2.2. Multi Component Systems
Machines are complex systems that consist of a variety of sub-systems and components. Furthermore, the sub-systems and components are required to interact with each other to provide smooth operation of these machines. Moreover, the environmental conditions and context highly affect the machine operation state and production results. All these factors directly influence the deterioration rate of machines, sub-systems, and components (see Figure 1-Section B). In literature, MCS models focus exactly on these challenges as they consider a higher degree of complexity and dynamic behavior of the environment. An MCS is defined as a system that consists of multiple components, and these components strongly interact with each other [25,26]. In other words, dependencies between sub-systems or components can be modeled and considered for analytical tasks.
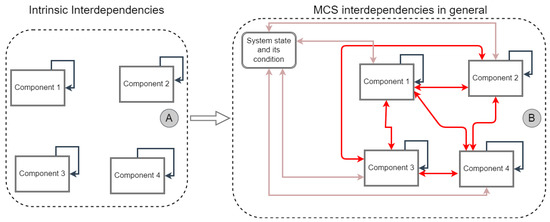
Figure 1.
In section A, the intrinsic interdependencies on the components are shown. This type of interdependencies is assumed and taken into account in referenced research work [10]. Whereby, in section B, along with intrinsic interdependencies, also interdependencies with other components and system state and its condition are shown.
In existing research work, interdependencies are grouped into four categories: economic, structural, stochastic, and resource-based interdependencies [5,27,28,29]. Economic interdependencies focus on the cost relationships between components. The main assumption is that the maintenance of a group of components at once leads to different costs compared to separate maintenance for each component [5]. Structural dependencies focus on the structural dependency between components, which could impact the maintenance process in a way that maintenance on failed components implies maintenance on the components that structurally are dependent [5]. Third, stochastic interdependencies consider the deterioration process of one component, which is possibly influenced by the deterioration state of other components, or other way around [5]. In particular, the condition state of a component depends not only on the current state of the system and its operating conditions but also on the current state of other components that interact with it [2,3,4]. Finally, resource-based interdependencies [4,30] model the dependency between components and required resources for maintenance of, e.g., spare parts. Maintenance workers are also considered within this group. This research work focuses only on stochastic interdependencies or deterioration influences between components rather than economic or structural interdependencies.
Components within an MCS are subject to continuous deterioration, depending on the past deterioration, which is described as an intrinsic effect in literature [2]. The intrinsic dependency is depicted in Figure 1-Section A. However, the deterioration state of a component within an MCS depends not only on intrinsic dependency but also on the system operation state and the deterioration state of other components that are interacting with, i.e., stochastic interdependencies (see Figure 1-Section B). Modeling stochastic interdependencies provides many advantages in practice: the opportunity to understand better and explain the dynamic system behavior, provide more accurate Remaining Useful Life (RUL) predictions, and thus more reliable decision support and maintenance scheduling results. In the current age of the manufacturing industry, the system is becoming more complex due to the need for high customization to fit specific expectations. Moreover, various components with mostly different purposes and life spans are coupled together within a system. These challenges make the identification of the model health indicators more challenging. However, these indicators are crucial to build reliable predictive models and thus are mandatory input [31]. Therefore, modeling stochastic interdependencies seems promising to tackle these effects, thus, providing more reliable results.
2.3. Visual Analytics and XAI
Visual analytics is an important method to explore data-sets in an easy and faster way. Hence, this method helps identify hidden patterns and analyze the root cause of failures and faults. Recently, visual analytics has been applied in many complex industrial settings [32], such as PdM, condition monitoring, anomaly, or fault detection, where the aim is to explore and understand large data-sets [33,34]. In particular, visual analytics shows promising results when combining machine intelligence with human intelligence aiming to gain new insights from data, thus, performing informed decision-making support in complex scenarios [32]. In general, visual analytics for MCS as a complex topic is less explored. However, Gashi et al. [9] evaluated different visualization approaches aiming to identify interdependencies using a crowd-sourced study. As a result, the multi-line approach outperformed other approaches in this regard. A drawback of this study is that the methods were evaluated using synthetic data. Therefore, we aim to use and analyze this approach using data from a real industrial use case.
The identified interdependencies can be considered new knowledge that can be used as an input for the predictive models. This could help to enhance the PdM process further. However, the lack of transparency of predictive models, e.g., black-boxes, is a growing concern that requires to be handled. As a result, XAI as a new approach was introduced in 2004 [35], which helps to make black-box models understandable and interpretable. Current works in XAI focuses on two perspectives aiming for explainability: (1) global interpretability and (2) local interpretability [36]. The former focuses on explaining the model behavior, thus, extracting the whole logic of the model. The latter aims to understand the model’s decision-making on specific instances, i.e., predictions. XAI has shown good results so far in different application domains, such as healthcare [37,38], legal [39], or defect prediction [40].
Recently, extensive research on the topic of global interpretation has been conducted. Usually, the interpretation of models within this topic is performed either by ranking the model features (e.g., permutation feature importance) based on prediction importance or by analyzing the interdependencies between features (e.g., partial dependency plot). In contrast, SHAP approach [41] based on game theoretical optimal Shapely Values [42] estimates feature importance and interaction between features, as well as the feature contribution toward prediction using Shapely values. Moreover, SHAP is the only XAI method based on solid theory (Shapely value). Initially, SHAP explains the prediction of a specific instance by estimating the contribution of each feature using Shapley values from coalitional game theory [42]. Shapley value is a method to estimate each player’s contribution in a coalition game. In particular, players corporate on a coalition and receive a certain profit from this cooperation. In the case of ML, the game is the prediction task, whereby the profit is the actual prediction minus the average prediction for all instances. The players are the feature values of the instance. The feature ranking is estimated as the absolute average of features across the data, formally stated as [43] where represents each contribution (noted as j) of feature i whereas N denotes the number of all instance values of the feature i. The global impact of the features can be estimated for all predicted classes as shown in Figure 6, with the features at the top being the most important. The contribution of a feature to each predicted class is shown in colors (noted in legend) within the horizontal bar. The global impact can be estimated for single classes (e.g., prediction of a specific component) as shown in Figure 7, where the SHAP values represented as dots (each specific instance) are plotted horizontally, with the color indicating the value of that feature, from low (blue) to high (red). Note that the contribution could be positively or negatively towards the target value, as shown in the x-axis. To the best of our knowledge, XAI approaches for PdM in the context of MCS are not applied so far. In particular, we apply SHAP to analyze and understand the contribution of single features toward the prediction of component failures. The extracted knowledge is used to understand and explain the interdependencies between components.
3. Materials and Methods
3.1. Data Set and Problem Definition
The availability of public data-sets suitable for MCS analysis is very scarce due to the level of detail required to explain an MCS and the sensitivity of the data or business competitiveness. This work is an extension of the results shown in [10], where the aim is to predict component failures based on various data sources, such as condition monitoring and maintenance logs. In this work, [10], a comprehensive public data-set provided by Microsoft [44] is used to apply the PdM concept in terms of ML. This data-set is collected in the semi-conductor industry [16] and is suitable for the MCS topic and consists of the following data sources: machine conditions and usage data (telemetry records), error logs, maintenance logs, failure logs, and machine metadata.
Machine conditions and usage data (i.e., telemetry data) include sensor data, such as voltage, rotation, pressure, and vibration from 100 machines aggregated on an hourly basis (see Table 1). This data are collected in the year 2015 and included 8761 records. Furthermore, 761 failures of the components were collected within the corresponding year. A failure leads to a crash of the component. Additionally, error logs and maintenance data are collected. An error presence does not cause a crash or force the machine to stop, therefore errors are not considered as failure. Maintenance data includes all the maintenance activities on the components. These different types of data are described in Table 2. Information concerning components and errors is anonymized by data-set’s publisher and is therefore not available. It is important to note that feature engineering is also conducted, where statistical features are estimated from telemetry data by aggregating the data into 3 and 24 h to catch both short-term and long-term knowledge. Moreover, the categorical error data are transformed to numerical values by counting the errors for the time window of 3 h. Finally, the usage time of the each component is extracted from maintenance data, thus extracting the information concerning the time from the last replacement for the corresponding components. In general, the data-set description and the feature engineering/selection process are completely replicated based on the previous research works [10,44]; therefore details are not included in this section to avoid redundancy.

Table 1.
An example of machine conditions and usage date i.e., telemetry which includes information about time (“Datetime”), machine (“machineID”), and the sensors data consisting of voltage (“Volt”), rotation (“Rotate”), pressure (“Pressure”) and vibration (“Vibration”).
Table 2.
This table describes the considered dataset to conduct the experiments within this research work. For more details concerning data engineering/selection process, please refer to previous research work [10].
This research works is based and extends the previous research work [10], which considers the intrinsic dependency as important information to improve predictive results. However, current research work demonstrates that intrinsic dependency is important information; however, the interdependencies between components is another information that is actually impacting the predictive results significantly. The relation to the previous research work and the focus of current research work is highlighted in Figure 2. In the aforementioned referenced work [10], time from last replacement of the corresponding component is considered as valuable information to improve predictive results of the component failures. This information was considered and modeled based on the assumption that the usage time of each component helps to predict failures of this component, i.e., intrinsic dependency (see Figure 1-Section A). Consequently, the interdependencies between components are not taken into account in the referenced work [10]. Therefore, in this work, we aim to demonstrate that along with intrinsic dependency, the interdependencies between components can be used to improve predictive models. Building on the previous works with this data-set also allows us to compare the results of our MCS model with the SCS-models other scholars used.
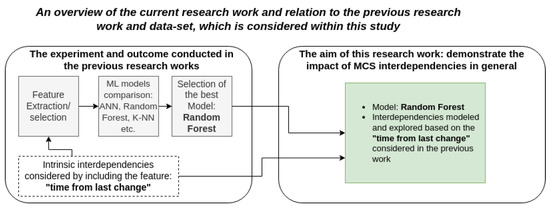
Figure 2.
This Figure shows the relation of this research to the previous research work, which considers intrinsic (self-dependency) interdependencies. Furthermore, it highlights the focus of this research work which in addition to intrinsic dependency, demonstrates also the impact of interdependencies between components (i.e., MCS interdependencies).
In this work, we focus only on the Random Forest (RF) classifier, which is ranked as one of the best models in the aforementioned reference work [10]. In our case, the focus is to explore and show the importance of interdependencies rather than to compare various ML models. Therefore, considering only the RF model is sufficient to accomplish our experiments. RF is an ensembled method based on decision tree (DT) approach. To be more accurate, RF generate multiple uncorrelated DT models. This models usually considere different subsets of features selected in a random way. Finally, all this models are used for prediction/classification and a majority voting is used to decide the outcome. The advantage of operating as a committee helps to outperform any of the individual models (e.g., DT).
A critical challenge within this use case is imbalanced data. In addition to suitable scores for imbalance data provided in reference work [10], we employed the SMOTEENN approach [45], which is a hybrid approach. This approach takes advantage of both under-sampling and over-sampling techniques. In other words, under-sampling method is used to remove redundant records in the majority class aiming to balance the data distribution over the classes. On the other hand, over-sampling method aims to generate new records on the minority class aiming to balance the distribution of these classes. As a results SMOTEENN combines this two techniques to balance the distribution of the data. To be more accurate, Synthetic Minority Over-sampling Technique (SMOTE) [46] is the over-sampling method and Edited Nearest Neighbours (ENN) [47] is used to remove/clean redundant records in the majority class. Finally, by considering the aforementioned methods, we were able to replicate predictive results successfully, as shown in Table 3. Moreover, we employed the 3-Fold time series cross-validator introduced in [48]. This approach is valuable to avoid over-fitting in time-series data while evaluating ML models.
Table 3.
Replicated predictive results using RF classifier. Results show that RF classification reach superior results in terms of classifying the failed components.
3.2. Proposed Framework
In Figure 3 the concept of MCS interdependencies toward PdM is shown. The goal of the presented framework is twofold. First, we want to identify interdependencies between components based on a data-driven solution that requires to perform three consecutive steps: visual inspection of interdependencies (see Figure 3-step 1), the modeling (see Figure 3-step 2), and the plausibility check based on SHAP approach [41]), which is a suitable XAI method to explain the effect of various features intuitively (see Figure 3-step 3). Combining these methods provides an opportunity to analyze the interdependencies into different levels of detail, starting with high-level analysis using visual inspection and then drilling down to more details by comparing predictive models and employing the SHAP approach. The acquired knowledge from this process can be used to extract and include interdependencies in a predictive model. Second, visual inspection and the SHAP approach can be used to explain predictive models later in the process. This could be used during the decision-making process to help the shop floor workers make reliable decisions. They will be able to track predictive decisions that are, for instance, directly affected by interdependencies.
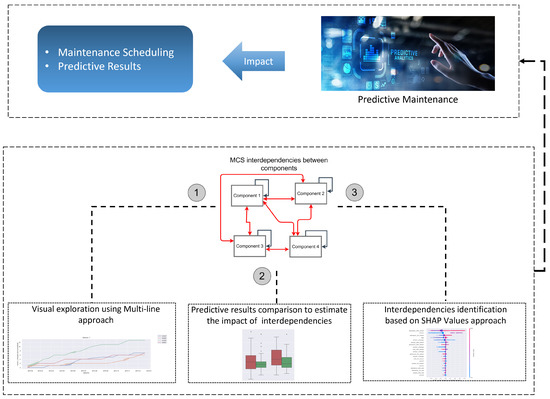
Figure 3.
Framework overview to identify and show the impact of interdependencies in the context of predictive maintenance. (1) visual inspection based on multi-line chart to explore interdependencies, (2) predictive model comparison to show the impact of interdependencies, and (3) SHAP visualization to explain the component interactions.
Visual inspection is considered as it provides an easy and fast way to recognize new knowledge [49], thus, providing an opportunity to save time and effort in complex tasks such as interdependencies analyzes. For this purpose, we employed a multi-line approach, which has shown promising results on visual recognition of interdependencies within MCS [9]. This approach allows visualization of data over time, where each line represents the information regarding a specific component (e.g., accumulated sum of performed maintenance actions for each component). In this context, we aim to see if the replacement in one component affects the other components, thus, indicating the possible existence of interdependencies between these components.
The effect of interdependencies in predictive results is quantified by comparing predictive models, including interdependencies against predictive models that excluded the information (i.e., features) about interdependencies. However, interdependencies are not trivial information to acquire; therefore, we have to be careful while we define the features that relate to interdependencies. In our case, the time from the last replacement of components (e.g., usage time) is considered as an essential feature to encode interdependencies. This feature has information over time in use for a specific component. Therefore, the effect of this feature on the prediction of the failures for other components is an indicator that the interdependencies of the components can be found. To analyze and compare the distribution of data, we used a box-and-whiskers chart, as well as statistical approaches, such as the chi-square test [50]. Whereby the chi-square test as a non-parametric approach includes its robustness concerning data distribution and ease of computation. Moreover, a box-and-whiskers chart provides a faster and more reliable way to compare data distribution visually.
As the definition of interdependencies (feature engineering) is complex and sensitive, we consider XAI approaches, such as global contribution analyzes based on the SHAP approach to assure and explain the presence of interdependencies between components. Global interpretation based on the SHAP approach provides an opportunity to intuitively understand and interpret the multi-class predictive models. In our case, we analyzed the influence of features on predictive performance (i.e., feature importance). Along with feature importance, global SHAP results show how much each feature contributes, either positively or negatively, to the target variable (component failure) (see Figure 7-Model explainability). In this case, a positive contribution indicates that the feature contributes toward the prediction of the component failure. Whereby, negative values indicate that the feature contributes more to predicting the component’s healthy state, and 0 specifies a neutral contribution. This approach is helpful in understanding the degree of interdependencies between components.
4. Experimental Results
4.1. Visual Exploration of Interdependencies
Figure 4 shows the accumulated sum of performed maintenance actions (component replacements) over time. Each line in the multi-line chart represents the maintenance status of a single component. The results of the multi-line approach indicate that interdependencies between components can be found. As we can see in Figure 4 in sections A1 and A2, component 1 strongly interacts with components 2 and 3. The results indicate that a worn-out state of components 2 and 3 will accelerate the deterioration rate of component 1. To be more accurate, the horizontal line over time shows that a specific component has not been changed over time. In this case, the corresponding component/-s will contain considerable amount of usage time. Simultaneously, over the same period of time other components show an increase of the accumulated sum of changes, which indicates that the components have been replaced more often. This is a strong indicator of potential interdependencies as an old worn-out components impacts and accelerate the worn-out process of other components that is interacting with. This can be confirmed by background knowledge and research [2].
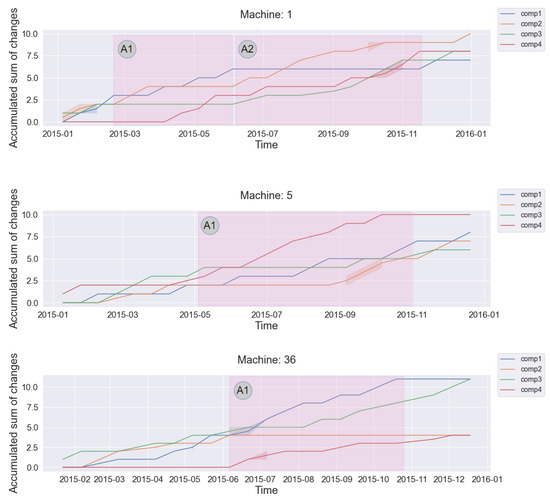
Figure 4.
Visual inspection of interdependencies using multi-line charts. Each chart shows the interdependencies between components of a particular machine. In sections A1 and A2 interactions between components can be found. For example, machine 1-section A1 shows that component 1 strongly interacts with other components.
In general, the multi-line approach provides an easy and fast way to understand the existence of interdependencies within the system. The knowledge acquired using visual inspection provides a sound basis for considering interdependencies while building a predictive model.
Therefore, an evaluation of predictive results and explainability of the interdependencies in a more comprehensive way is shown in the following subsections. This will help to better understand the effect and behavior of interdependencies, thus increasing the plausibility of the results.
4.2. Interdependencies Impact on Predictive Results
Figure 5 shows a comparison of predictive results with respect to the interdependencies effect between components. The results show that the interdependencies effect on the prediction of component 1 is statistically significant. The difference in model prediction is estimated using chi-square with a p < 0.01. Moreover, the effect of interdependencies is noticeable in component 3. In component 4, the interdependencies are not obvious in predictive results. However, the variance increases when interdependencies are not taken into account. Consequently, component 2 shows no obvious effect concerning interdependencies.
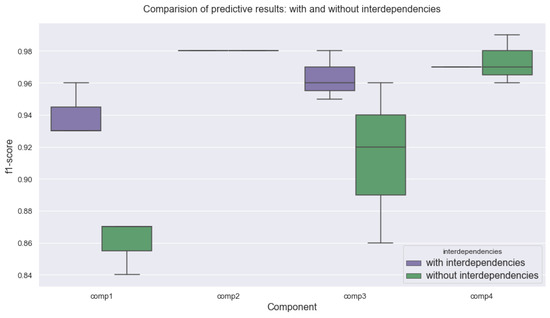
Figure 5.
Estimation of interdependencies effect between components through comparison of predictive results. In purple are shown predictive results including interdependencies. Whereby, in green the predictive results excluding interdependencies are presented. Significant interdependencies are visible in components 1 and 3.
In general, results highlight two important aspects. First, the interdependencies are not found at every component within the system. Although, in these cases, neglecting this aspect could lead to poorer predictive results, e.g., component 4. Therefore, it is important to clearly identify components subject to interdependencies and consider this information accordingly. Second, modeling interdependencies on the identified components is crucial to improve predictive results. In our use case, components 1 and 3 demonstrate the significant effect of interdependencies on predictive results. In general, identifying interdependencies is crucial to achieving the best results while building predictive models.
4.3. Interdependencies Exploration Using SHAP
Interdependencies exploration based on feature importance with feature effects on prediction of all component failures using SHAP is shown in Figure 6. In particular, we focus on the features containing information about the time from the last replacement of specific components, e.g., comp1_change, comp2_change, comp3_change, comp4_change. Interestingly, the contribution on failure prediction of component 1 from other components, e.g., comp2_change, comp3_change, and comp4_change, is obvious (as shown in Figure 6-section A, B, and E). On the other hand, component 1 shows no significant contribution toward the prediction of the failure of other components (e.g., Figure 6-section D). In addition, the contribution toward the prediction of component 3 failure from component 4 is recognized as shown in Figure 6-section C. In general, the results indicate no interdependencies effect on the prediction of failures for components 2 and 4. These results explain and provide valuable insights regarding the prediction outcome shown in the previous section.
For a better overview, global interpretation based on SHAP for every target value (component) is shown in Figure 7. The features are ordered by feature importance, with the most important features being listed first. For each feature, the contribution based on the Shapley value estimated for every instance is shown on the x-axis. Whereby a higher Shapley value indicates a more substantial contribution toward the prediction of the component failure. Moreover, the raw value of the instances is colored from red to blue, whereby red represents the highest value and blue represents the lowest value. Every plot of SHAP visualization represents the results for a specific component.

Figure 6.
Estimation of feature importance with feature effects on prediction of all components ordered by feature importance in the y-axis and on the x-axis by Shapley value. Features comp1_change, comp2_change, comp3_change, comp4_change show the contribution of corresponding time from last change of these components on the prediction of components failures (e.g., blue color shows the contribution of this feature on prediction of the failures for component 1).

The results show that features representing the time from the last replacement (e.g., comp1_change) for components are especially important while predicting single components. For instance, Figure 7a-Component 1 shows that the time from the last replacement of component 2 is especially important for the prediction of component 1 failures. The importance of this information provides a good basis to prove that the deterioration process of a specific component depends not only on the current state of the component and the operation conditions of the system but also on the current state of other components that are interacting with it. Moreover, based on the color of Shapley values, we can see that the contribution toward predicting the failures of component 1 is higher while the usage time of other components increases (see Figure 7a-Component 1 in section A, B, and C). This fits perfectly with the intuition behind the description of interdependencies within an MCS, where a worn-out component will accelerate the wear rate of other components that it is interacting with. Moreover, the interdependencies of component 1 with components 4 and 3 are also obvious based on these results. In general, similar behavior is present in the results shown in the analyzes of component 3 ( see Figure 7c).

Figure 7.
Model explainability for every single component using SHAP. The results show the presence of interdependencies between components altogether with the positive/negative impact with respect to the value magnitude. For instance, concering the component 1 failure prediction (section (a)) it is visible that that an worn out of component 2 contributed more on prediction of the failures, respectively a newly changed component 2 contributed otherwise.

5. Discussion
In the existing literature, it has been highlighted that modeling MCS interdependencies is crucial while aiming to improve predictive results and maintenance scheduling [2,4]. In particular, modeling MCS interdependencies will help to enhance predictive results, which again facilitates the decision of whether or not to carry out maintenance. Motivated from these conclusions, we analyzed and considered interdependencies between components while aiming for improved PdM solutions.
5.1. Theoretical Contributions
Our work has two main contributions. First, we showed the benefit of applying MCS to PdM. In this case, we show the importance of understanding and modeling interdependencies. In particular, we demonstrated that time from last replacement of component is a valuable feature to quantify interdependencies between components. Second, we illustrated that visual approaches and XAI could identify and explain interdependencies.
Regarding our first contribution, we demonstrate the positive impact of interdependencies on predictive models by comparing the trained model with/without taking the interdependencies into account. To the best of our knowledge, we are the first to demonstrate how modeling interdependencies within a predictive model could facilitate prediction quality. Last but not least, we demonstrated that time from last replacement of components provides valuable information to quantify the interdependencies between components. In future research, we plan to explore other valuable features, respectively, the aggregation of this information with other features aiming to encode interdependencies between components. Data-driven PdM is a complex framework consisting of five consecutive steps, as shown in the background section. In this work, maintenance scheduling which includes planning, scheduling, and decision-making, is not considered; thus, we focused only on the facilitation of the predictive results with respect to the interdependencies knowledge. In the future, we plan to build a complete data-driven PdM process and evaluate it on a real use case that could help understand the real impact in the field of the MCS perspective.
Regarding our second contribution, we showed that the identification of interdependencies requires a certain level of domain knowledge, and thus visual and XAI approaches are suitable. We showed that the multi-line approach as visual inspection helps to identify interdependencies between components. An advantage of this approach is that it provides a faster and better way of understanding data [49]. The previous studies aiming to improve maintenance scheduling in the context of MCS showed that the interdependencies between components within a system could be found [2,4]. Similarly, we demonstrate the existence of interdependencies between components, e.g., between components 1 and 2, which was not obvious in the initial research work [10]. Moreover, we demonstrate that SHAP is a valuable tool to identify and analyze interdependencies. Employment of SHAP in the context of MCSs is a novel application. In literature, the main intuition behind the description of interdependencies within an MCS is that the worn-out component will accelerate the wear rate of other components that are interacting with each other [2,3,4]. Similarly, we demonstrate the same effect (e.g., see Figure 7-Component 1 in section A) using the SHAP results. However, we plan to explore other XAI approaches aiming to explain feature interaction analysis, respectively, feature contribution concerning the RUL.
5.2. Implications for Practice
Failure prediction of components depends on the quality of the data. In practice, massive volumes of data are usually collected, and the failures are sparse compared to this data. This leads to the challenge of imbalanced data [8,51,52]. This challenge was addressed in [10] by using suitable scores. Using suitable scores helps to catch the effect of the imbalance challenge on predictive results. However, we employed the SMOTEENN method to handle this challenge, which combines both over-sampling and under-sampling, providing many advantages. Moreover, in [10] the results are evaluated based on one fold approach, where the data are split into training and test data. However, to increase the plausibility of the results, we employed the time series cross-validator introduced in [48]. Last but not least, the feasibility of the introduced framework could motivate the application of the MCS perspective into PdM, which could help enhance research results on the topic. However, an evaluation in this regard remains as future work.
5.3. Limitations and Future Research Direction
We deployed an approach that is completely based on the knowledge acquired from data. In this case, we use a public data set where information is anonymized, e.g., components, and thus domain expert’s knowledge is prohibited. For instance, a system layout could help to increase plausibility regarding conclusions for the interdependencies found between components. In future research, the application of this approach in a use case where access to domain experts is feasible should be considered. In particular, the application of this framework requires to perform three steps: visual identification of interdependencies, the modeling, and the plausibility check (XAI) to assure and understand the existence of components; thus, this is not a straightforward process and needs user feedback (interaction). Moreover, the replicated approach considered the 24 h lags to catch long-term information and 3 h lags to catching short-term information. Results are acceptable, but the optimization of time lags could help to improve results further. Moreover, the SHAP approach proposed within the framework helps to increase the plausability of the achieved results in terms of demonstrating the impact of interdependencies on predictive models, although this is not a causal analysis (see [53] for an overview). Therefore, quantifying the impact of components altogether with the direction through causal analysis, such as causal impact analysis remains as future work. Last but not least, our approach considers visualization techniques such as the multi-line approach or the visual-based representation of Shapley values. This valuable concept could be integrated into an interactive dashboard that would further facilitate the exploration of the interdependencies with respect to interdependencies.
6. Conclusions
This paper proposes a framework to identify and understand interdependencies within an MCS. Our framework helps to quantify the impact of interdependencies on predictive results and thus provides valuable decision support. We showed that interdependencies significantly improve predictive results. Additionally, a multi-line approach was considered for visual inspection while identifying interdependencies. We illustrate that XAI approaches are valuable techniques to understand the effect and behavior of interdependencies within a system. Overall, this paper is an important milestone in promoting MCS for PDM as it demonstrates the advantages and potential of MCS and shows an important avenue how to improve the predictive quality for PDM.
Author Contributions
Conceptualization, M.G. and S.T.; methodology, M.G.; software, M.G.; validation, M.G., B.M. and S.T.; resources, M.G.; data curation, M.G.; writing—original draft preparation, M.G.; writing—review and editing, M.G., B.M. and S.T.; visualization, M.G. and B.M.; supervision, S.T.; project administration, M.G. All authors have read and agreed to the published version of the manuscript.
Funding
This work has been supported by the FFG, Contract No. 881844: Pro2Future is funded within the Austrian COMET Program Competence Centers for Excellent Technologies under the auspices of the Austrian Federal Ministry for Climate Action, Environment, Energy, Mobility, Innovation and Technology, the Austrian Federal Ministry for Digital and Economic Affairs and of the Provinces of Upper Austria and Styria. COMET is managed by the Austrian Research Promotion Agency FFG.
Institutional Review Board Statement
Not applicable.
Informed Consent Statement
Not applicable.
Data Availability Statement
Predictive Maintenance Modelling Guide Data Sets can be found on https://gallery.azure.ai/Experiment/Predictive-Maintenance-Implementation-Guide-Data-Sets-1 (accessed on 12 August 2021).
Acknowledgments
The authors acknowledge the financial support by the University of Graz.
Conflicts of Interest
The authors declare no conflict of interest.
References
- Thalmann, S.; Fessl, A.; Pammer-Schindler, V. How large manufacturing firms understand the impact of digitization: A Learning Perspective. In Proceedings of the 53rd Hawaii International Conference on System Sciences, Maui, HI, USA, 7–10 January 2020. [Google Scholar]
- Assaf, R.; Do, P.; Scarf, P.; Nefti-Meziani, S. Wear rate-state interaction modelling for a multi-component system: Models and an experimental platform. IFAC-PapersOnLine 2016, 49, 232–237. [Google Scholar] [CrossRef]
- Bian, L.; Gebraeel, N. Stochastic framework for partially degradation systems with continuous component degradation-rate-interactions. Nav. Res. Logist. (NRL) 2014, 61, 286–303. [Google Scholar] [CrossRef]
- Gashi, M.; Thalmann, S. Taking Complexity into Account: A Structured Literature Review on Multi-component Systems in the Context of Predictive Maintenance. In Proceedings of the Information Systems-16th European, Mediterranean, and Middle Eastern Conference, EMCIS 2019, Dubai, United Arab Emirates, 9–10 December 2019; Springer: Cham, Switzerland, 2020; pp. 31–44. [Google Scholar]
- Van Horenbeek, A.; Pintelon, L. A dynamic predictive maintenance policy for complex multi-component systems. Reliab. Eng. Syst. Saf. 2013, 120, 39–50. [Google Scholar] [CrossRef]
- Kaiser, R.; Thalmann, S.; Pammer-Schindler, V. An investigation of knowledge protection practices in inter-organisational collaboration: Protecting specialised engineering knowledge with a practice based on grey-box modelling. VINE J. Inf. Knowl. Manag. Syst. 2020, 51, 713–731. [Google Scholar] [CrossRef]
- Thalmann, S.; Gursch, H.G.; Suschnigg, J.; Gashi, M.; Ennsbrunner, H.; Fuchs, A.K.; Schreck, T.; Mutlu, B.; Mangler, J.; Kappl, G.; et al. Cognitive decision support for industrial product life cycles: A position paper. In Proceedings of the 11 th International Conference on Advanced Cognitive Technologies and Applications, Venice, Italy, 5–9 May 2019; pp. 3–9. [Google Scholar]
- Gashi, M.; Ofner, P.; Ennsbrunner, H.; Thalmann, S. Dealing with missing usage data in defect prediction: A case study of a welding supplier. Comput. Ind. 2021, 132, 103505. [Google Scholar] [CrossRef]
- Gashi, M.; Mutlu, B.; Lindstaedt, S.; Thalmann, S. Decision support for multi-component systems: Visualizing interdependencies for predictive maintenance. In Proceedings of the 55rd Hawaii International Conference on System Sciences, Maui, HI, USA, 4–7 January 2022. [Google Scholar]
- Cardoso, D.; Ferreira, L. Application of Predictive Maintenance Concepts Using Artificial Intelligence Tools. Appl. Sci. 2021, 11, 18. [Google Scholar] [CrossRef]
- Zhang, W.; Yang, D.; Wang, H. Data-driven methods for predictive maintenance of industrial equipment: A survey. IEEE Syst. J. 2019, 13, 2213–2227. [Google Scholar] [CrossRef]
- Susto, G.A.; Schirru, A.; Pampuri, S.; McLoone, S.; Beghi, A. Machine learning for predictive maintenance: A multiple classifier approach. IEEE Trans. Ind. Inform. 2014, 11, 812–820. [Google Scholar] [CrossRef]
- Selcuk, S. Predictive maintenance, its implementation and latest trends. Proc. Inst. Mech. Eng. Part B J. Eng. Manuf. 2017, 231, 1670–1679. [Google Scholar] [CrossRef]
- Thalmann, S.; Mangler, J.; Schreck, T.; Huemer, C.; Streit, M.; Pauker, F.; Weichhart, G.; Schulte, S.; Kittl, C.; Pollak, C.; et al. Data analytics for industrial process improvement a vision paper. In Proceedings of the 2018 IEEE 20th Conference on Business Informatics (CBI), Vienna, Austria, 11–13 July 2018; IEEE: Piscataway, NJ, USA, 2018; Volume 2, pp. 92–96. [Google Scholar]
- Pech, M.; Vrchota, J.; Bednář, J. Predictive Maintenance and Intelligent Sensors in Smart Factory. Sensors 2021, 21, 1470. [Google Scholar] [CrossRef] [PubMed]
- King, R.; Curran, K. Predictive Maintenance for Vibration-Related failures in the Semi-Conductor Industry. J. Comput. Eng. Inf. Technol. 2019, 8, 1. [Google Scholar]
- Dogan, A.; Birant, D. Machine learning and data mining in manufacturing. Expert Syst. Appl. 2020, 166, 114060. [Google Scholar] [CrossRef]
- Durbhaka, G.K.; Selvaraj, B. Predictive maintenance for wind turbine diagnostics using vibration signal analysis based on collaborative recommendation approach. In Proceedings of the 2016 International Conference on Advances in Computing, Communications and Informatics (ICACCI), Jaipur, India, 21–24 September 2016; IEEE: Piscataway, NJ, USA, 2016; pp. 1839–1842. [Google Scholar]
- Sipos, R.; Fradkin, D.; Moerchen, F.; Wang, Z. Log-based predictive maintenance. In Proceedings of the 20th ACM SIGKDD International Conference on Knowledge Discovery and Data Mining, New York, NY, USA, 24–27 August 2014; pp. 1867–1876. [Google Scholar]
- Gashi, M.; Gursch, H.; Hinterbichler, H.; Pichler, S.; Lindstaedt, S.; Thalmann, S. MEDEP: Maintenance Event Detection for Multivariate Time Series Based on the PELT Approach. Sensors 2022, 22, 2837. [Google Scholar] [CrossRef] [PubMed]
- Nguyen, K.T.; Medjaher, K. A new dynamic predictive maintenance framework using deep learning for failure prognostics. Reliab. Eng. Syst. Saf. 2019, 188, 251–262. [Google Scholar] [CrossRef]
- Chen, C.; Wang, C.; Lu, N.; Jiang, B.; Xing, Y. A data-driven predictive maintenance strategy based on accurate failure prognostics. Eksploat. I Niezawodn. 2021, 23, 387–394. [Google Scholar] [CrossRef]
- Sun, Y.; Ma, L.; Mathew, J.; Wang, W.; Zhang, S. Mechanical systems hazard estimation using condition monitoring. Mech. Syst. Signal Process. 2006, 20, 1189–1201. [Google Scholar] [CrossRef]
- Lindley, D.V.; Singpurwalla, N.D. Multivariate distributions for the life lengths of components of a system sharing a common environment. J. Appl. Probab. 1986, 23, 418–431. [Google Scholar] [CrossRef]
- Bektas, O.; Jones, J.A.; Sankararaman, S.; Roychoudhury, I.; Goebel, K. A neural network filtering approach for similarity-based remaining useful life estimation. Int. J. Adv. Manuf. Technol. 2019, 101, 87–103. [Google Scholar] [CrossRef]
- Feng, Q.; Jiang, L.; Coit, D.W. Reliability analysis and condition-based maintenance of systems with dependent degrading components based on thermodynamic physics-of-failure. Int. J. Adv. Manuf. Technol. 2016, 86, 913–923. [Google Scholar] [CrossRef]
- Nguyen, K.A.; Do, P.; Grall, A. Multi-level predictive maintenance for multi-component systems. Reliab. Eng. Syst. Saf. 2015, 144, 83–94. [Google Scholar] [CrossRef]
- Nicolai, R.P.; Dekker, R. Optimal maintenance of multi-component systems: A review. In Complex System Maintenance Handbook; Springer: London, UK, 2008; pp. 263–286. [Google Scholar]
- Alaswad, S.; Xiang, Y. A review on condition-based maintenance optimization models for stochastically deteriorating system. Reliab. Eng. Syst. Saf. 2017, 157, 54–63. [Google Scholar] [CrossRef]
- Keizer, M.C.O.; Flapper, S.D.P.; Teunter, R.H. Condition-based maintenance policies for systems with multiple dependent components: A review. Eur. J. Oper. Res. 2017, 261, 405–420. [Google Scholar] [CrossRef]
- Yin, S.; Ding, S.X.; Zhou, D. Diagnosis and prognosis for complicated industrial systems—Part I. IEEE Trans. Ind. Electron. 2016, 63, 2501–2505. [Google Scholar] [CrossRef]
- Zhou, F.; Lin, X.; Liu, C.; Zhao, Y.; Xu, P.; Ren, L.; Xue, T.; Ren, L. A survey of visualization for smart manufacturing. J. Vis. 2019, 22, 419–435. [Google Scholar] [CrossRef]
- Liu, S.; Cui, W.; Wu, Y.; Liu, M. A survey on information visualization: Recent advances and challenges. Vis. Comput. 2014, 30, 1373–1393. [Google Scholar] [CrossRef]
- Gashi, M.; Mutlu, B.; Suschnigg, J.; Ofner, P.; Pichler, S.; Schreck, T. Interactive Visual Exploration of defect prediction in industrial setting through explainable models based on SHAP values. In Proceedings of the IEEE VIS 2020, Salt Lake City, UT, USA, 25–30 October 2020. [Google Scholar]
- Van Lent, M.; Fisher, W.; Mancuso, M. An explainable artificial intelligence system for small-unit tactical behavior. In Proceedings of the National Conference on Artificial Intelligence, San Jose, CA, USA, 25–29 July 2004; AAAI Press: Menlo Park, CA, USA; MIT Press: Cambridge, MA, USA; London, UK, 1999; pp. 900–907. [Google Scholar]
- Adadi, A.; Berrada, M. Peeking inside the black-box: A survey on explainable artificial intelligence (XAI). IEEE Access 2018, 6, 52138–52160. [Google Scholar] [CrossRef]
- Caruana, R.; Lou, Y.; Gehrke, J.; Koch, P.; Sturm, M.; Elhadad, N. Intelligible models for healthcare: Predicting pneumonia risk and hospital 30-day readmission. In Proceedings of the 21th ACM SIGKDD International Conference on Knowledge Discovery and Data Mining, Sydney, Australia, 10–13 August 2015; pp. 1721–1730. [Google Scholar]
- Holzinger, A.; Biemann, C.; Pattichis, C.S.; Kell, D.B. What do we need to build explainable AI systems for the medical domain? arXiv 2017, arXiv:1712.09923. [Google Scholar]
- Tan, S.; Caruana, R.; Hooker, G.; Lou, Y. Detecting bias in black-box models using transparent model distillation. arXiv 2017, arXiv:1710.06169. [Google Scholar]
- Jiarpakdee, J.; Tantithamthavorn, C.; Dam, H.K.; Grundy, J. An empirical study of model-agnostic techniques for defect prediction models. IEEE Trans. Softw. Eng. 2020, 48, 166–185. [Google Scholar] [CrossRef]
- Lundberg, S.M.; Lee, S.I. A unified approach to interpreting model predictions. In Proceedings of the 31st International Conference on Neural Information Processing Systems, Long Beach, CA, USA, 4–9 December 2017; pp. 4768–4777. [Google Scholar]
- Shapley, L.S.; Kuhn, H.; Tucker, A. Contributions to the Theory of Games. Ann. Math. Stud. 1953, 28, 307–317. [Google Scholar]
- Lundberg, S.M.; Erion, G.G.; Lee, S.I. Consistent individualized feature attribution for tree ensembles. arXiv 2018, arXiv:1802.03888. [Google Scholar]
- Predictive Maintenance Modelling Guide Data Sets. Available online: https://gallery.azure.ai/Experiment/Predictive-Maintenance-Implementation-Guide-Data-Sets-1 (accessed on 12 August 2021).
- Batista, G.E.; Bazzan, A.L.; Monard, M.C. Balancing Training Data for Automated Annotation of Keywords: A Case Study. In Proceedings of the WOB, Macaé, RJ, Brazil, 3–5 December 2003; pp. 10–18. [Google Scholar]
- Chawla, N.V.; Bowyer, K.W.; Hall, L.O.; Kegelmeyer, W.P. SMOTE: Synthetic minority over-sampling technique. J. Artif. Intell. Res. 2002, 16, 321–357. [Google Scholar] [CrossRef]
- Wilson, D.L. Asymptotic properties of nearest neighbor rules using edited data. IEEE Trans. Syst. Man Cybern. 1972, SMC-2, 408–421. [Google Scholar] [CrossRef]
- Buitinck, L.; Louppe, G.; Blondel, M.; Pedregosa, F.; Mueller, A.; Grisel, O.; Niculae, V.; Prettenhofer, P.; Gramfort, A.; Grobler, J.; et al. API design for machine learning software: Experiences from the scikit-learn project. In Proceedings of the ECML PKDD Workshop: Languages for Data Mining and Machine Learning, Prague, Czech Republic, 23–27 September 2013; pp. 108–122. [Google Scholar]
- Keim, D.A.; Mansmann, F.; Stoffel, A.; Ziegler, H. Visual analytics. In Encyclopedia of Database Systems; Springer: Berlin/Heidelberg, Germany, 2009; pp. 3341–3346. [Google Scholar]
- Tallarida, R.J.; Murray, R.B. Chi-square test. In Manual of Pharmacologic Calculations; Springer: Berlin/Heidelberg, Germany, 1987; pp. 140–142. [Google Scholar]
- Leevy, J.L.; Khoshgoftaar, T.M.; Bauder, R.A.; Seliya, N. A survey on addressing high-class imbalance in big data. J. Big Data 2018, 5, 1–30. [Google Scholar] [CrossRef]
- Kumar, A.; Shankar, R.; Choudhary, A.; Thakur, L.S. A big data MapReduce framework for fault diagnosis in cloud-based manufacturing. Int. J. Prod. Res. 2016, 54, 7060–7073. [Google Scholar] [CrossRef]
- Vukovic, M.; Thalmann, S. Causal discovery in manufacturing: A structured literature review. J. Manuf. Mater. Process. 2022, 6, 10. [Google Scholar] [CrossRef]


Disclaimer/Publisher’s Note: The statements, opinions and data contained in all publications are solely those of the individual author(s) and contributor(s) and not of MDPI and/or the editor(s). MDPI and/or the editor(s) disclaim responsibility for any injury to people or property resulting from any ideas, methods, instructions or products referred to in the content. |
© 2023 by the authors. Licensee MDPI, Basel, Switzerland. This article is an open access article distributed under the terms and conditions of the Creative Commons Attribution (CC BY) license (https://creativecommons.org/licenses/by/4.0/).