Abstract
(1) Background: In the past, sound design was focused on the minimization of the emitted sound, understanding that the lower the sound, the better. Nowadays, this concept is outdated; in addition to the sound pressure level, many more aspects of the sound are considered to fulfil the subjective satisfaction of clients. Thus, a new concept called sound quality has emerged to reach more facets of the sound. In refrigeration systems, the recommendations of European Union are aimed at reducing greenhouse emissions by means of the replacement of the hydrochlorofluorocarbons gases with other less pollutant gases. The refrigeration systems are designed to be used with a specific refrigeration gas, and the noise emitted by these systems is certificated using this refrigeration gas. However, the regularizations have changed, and new refrigerant gases should be used. Considering that these new refrigeration gases work at different pressures, it is possible that the noise could be different with these gases. Moreover, the study of sound quality is very important for the manufacture as the perception and therefore the annoyance could change with the use of new gases. (2) Methods: Two different gases, R-449A and R-134A, have been studied. An acoustic camera has been used to measure and identify the sound quality in the refrigeration systems. (3) Results: The results have shown R-134A has better sound quality than R-449A. (4) Conclusions: This study shows that R-449A and R-134A could be a substitute for R-404A in terms of noise level.
1. Introduction
The use of refrigeration is very extensive throughout both domestic applications and industrial processes. Most of industrial refrigeration consists of facilities destined to supply the demand of refrigerating chambers and cooling tunnels, among other things. From the beginning of industrial refrigeration, different substances have been used to improve the efficiency of the process, such as ammonia (R-717), sulphur dioxide, and carbon dioxide, which are highly toxic gases. For this reason, the research related to refrigeration has been focused on the development of new alternative refrigerant gases that are less toxic and harmful to the environment. Thomas Midgley [1] developed the chlorofluorocarbon gases (CFC), including Freon (R-12). However, in the 1980s, the destruction of the ozone layer and the greenhouse effect were related to the presence of these gases in the atmosphere. Consequently, the Montecarlo Treaty, signed in 1987, restricted the manufacture and use of these gases. Afterwards, hydrochlorofluorocarbons became the most popular alternative, due to their lower aggressivity toward the ozone layer (Freon 22 or R-22). In most countries, these gases were employed as the main refrigerants in commercial devices until the 2010s. Since the 2010s, however, hydrofluorocarbons (HFCs) have progressively been introduced into the market. They are more friendly with the ozone layer, as chlorine was substituted by hydrogen atoms. These gases include refrigerants such as R-134A, R-404A, R-407C, or R-410A, which are currently the most used gases in industrial application and scientific community. Recently, the European Union [2] established the replacement of refrigerant gases (HFC) in industrial freezers and refrigerating chambers with a potential for global warming (PGW) of 2500 in 2020 and of 150 in 2022.
Although the European Union controls the emissions from F-gases, including HFCs, noise regularization is not included. In fact, there are no European regularization of this; the noise emission in refrigeration systems is established by the local council in each city. In this sense, the choice of the best refrigeration gas involves efficiency and low energy consumption, but also environmental issues such as low noise emission. Although there are many studies about the efficiency and gas emissions of refrigeration gases, there is not much research on noise emission [3]. A brief bibliometric study including previous works about noise in refrigeration gases has been carried out. As can be seen, since 1997, there was a minimum level of documents published, though this has increased since 2018, confirming the importance and growing interest in this field. This fact draws attention to the importance of the lack of information on the behavior of refrigeration gases in terms of noise emissions.
Regarding the publications related to noise in refrigeration using different gases, there are 1178 research papers listed when the keywords of “refrigeration gas” and “noise” are used in Web of Science (Clarivate) “All Databases” search tool. These manuscripts belong to “Engineering” (1.007) and “Physics” (516) categories (some of them belong to both). China is leading this research, with 333 manuscripts, followed by USA (249 manuscripts). In Web of Science (Clarivate) “Core Collection” had only been found 33 research documents, mainly belonging to “Thermodynamics” (14) and “Engineering” (11), China (11) and USA (8) being the main countries leading this research area. Figure 1 shows the main topics found on noise in refrigeration using different gases for Web of Science (Clarivate) “All Databases”.
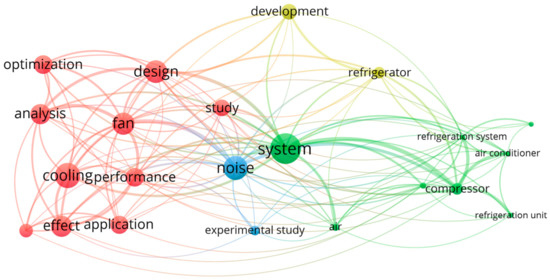
Figure 1.
Main topics found about noise in refrigeration using different gases for Web of Science “Core Collection”.
Due to the lack of literature on noise emissions in refrigeration systems using different gases, the increase in these last years of these systems, and the new regularizations that force the changing of these gases to other less polluting ones, the study on noise emission replacing refrigerant gases in these systems seems to be justified. Additionally, the study of the acoustic and vibrations are important in helping the quality of life of the neighbors, especially at night. This is an important environmental issue due to the increase of in air conditioner and refrigeration sectors, with these devices being used for almost 24 h. Jang et al. [4] analyzed the noise emitted by a rotary compressor in a domestic air conditioner. The fluid–structure interaction analysis was made to simulate the noise generation mechanism of a rotary compressor in an air conditioner. They concluded that the main factor which has influence in the generation of noise is the internal pressure wave when the discharge valve is opened. Thus, the refrigerant generated the noise during the discharge line, and when the speed of the compressor was higher. Venkatappa et al. [5] analyzed two different types of refrigerant, HFC-134a and HFO-1234yf, in order to check the noise induced in an automotive air conditioning system. The authors could demonstrate that there were remarkable differences in the noise generated by the different refrigerants. The noise and vibration produced by the flow was considerably higher in HFO-1234yf compared to HFC-134a. Zhilong et al. [6] (REF) studied the structural characteristics of the experimental compressor to implement a new noise reduction strategy. The authors achieved a reduction in the noise level of more than 10 dBA with this noise reduction scheme. Rodolfo et al. [7] (REF) investigated the effect of the isobutane contaminated with non-condensable gases in the thermal-acoustic behavior of household refrigerators. Noise was measured with an accelerometer, and the noise was increased when the mass flow rate was raised.
A study carried out in China [8] established that the financial losses caused from the return of the refrigeration system due to a high noise level were over 20 million yuan [8]. In other report [9], the author performed a cost-benefit analysis on the reduction in noise emission in the EU. It is clear that the benefits exceed the cost of the noise reduction for all types of equipment, due to these having a medium-to-high environmental impact. Moreover, these direct costs are usually supported by the purchaser or end user. However, there are others indirect costs in terms of sleep disturbance, concentration loss, fatigue, annoyance, and stress which are demonstrated to have consequences on health, and thus, medical costs.
In recent years, the number of complaints about noise coming from air conditioner has increased. Following this, local councils have regularized their use during certain times, as in the case in Spain, and the York Council in the United Kingdom (UK), who has established that noise levels from refrigeration should be kept below 5 dB [10]. In New York City, the council has a website to report noise annoyance from an air conditioner, ventilation equipment, or exhaust devices [11]. Since 1976, the Environmental Protection Agency in United Stated (US) designed a program to provide consumers with information about noise emission in new products [12]. In 1999, the Institute of Noise Control Engineering made a survey in which several countries participated (UK, US, Japan, Norway, Turkey, Belgium, and Brazil), discussing how each country was labeling the noise of their products [13]. One year later, the European Union (EU) approved the Directive 2000/14/EC [14], relating to noise emissions in the environment caused by outdoor equipment by mandating noise labels for consumer and industrial products. This directive established the label with the indication of the guaranteed sound power level including the pictogram. Moreover, if the noise could change under some circumstances, this should be modified. Although this directive has been amended by Regulation EC 219/2009 [15] and recently by Regularization EU 2019/1243 [16], these aspects have been kept. In this sense, changing the refrigerant gas could change the noise emission of the refrigeration equipment as the pressures of the gases are different, and subsequently the behavior of the compressor could be modified.
Noise Emission in Refrigeration
The main source of noise and vibration in a refrigeration system is the compressor. Noise could be classified into pressure pulsation of the refrigerant and structural vibration. During the operation of the compressor, the refrigerant and the internal structure of the compressor strongly interact each other. Reducing the noise emission could be achieved by reducing the dynamic forces transmitted from the compressor to the casing. In the case of the hermetic compressors, the vibration is induced by discharge gas pulsation, so the cavity is excited by both the refrigerant gas discharge and the vibrating hermetic shell. This vibration is completely related with the noise emission. Improving the shell housing structure has been studied as a method for reducing the high frequency noise. The compressor design and control algorithm could also reduce the noise emission. The correlation between noise emissions using different refrigerant gases has been studied, but the identification of noise source was not clearly established. For this purpose, the study of the compression process is very important. It consists of four stages: expansion, suction, compression, and discharge, depending on the piston position or crank angle. At the beginning, high-pressure refrigerant gas expands quickly when the piston starts to move from top dead center (TDC) to the bottom dead center (BDC). At this point, the cylinder pressure drops, being lower than external pressure, and the suction valve opens up. The low-pressure refrigerant gas flows into the cylinder until the piston arrives at the BDC. The compression of the refrigerant gas happens through cylinder volume reduction due to the piston movement until the TDC (REF). Now, high-pressure refrigerant gas is produced when the discharge valve is opened, and a small amount of refrigerant gas stays in the top clearance space. This residual gas is the origin of the next expansion step, repeating the compression process again. Therefore, depending on the type of refrigeration gas, it is possible to assume that the pressures of work for the compression cycle are different, and this could vary the emitted noise.
The main aim of this paper is the study of sound quality emitted by refrigeration gases with different PGW as R-134 and R-449A After the prohibition of the R-404A through the Directive F-gas (ref), the replacement of this gas in refrigeration due to maintenance should be studied in terms of noise emissions. The results of this preliminary study have been extrapolated to predict noise emissions in the University of Córdoba. There are more than 161 refrigerators on their campus (University of Córdoba) using R-404A. Therefore, if the level of sound is reduced using R-134A or R-449A instead of R-404A, it could be said that the annoyance due to noise in the campus could be also improved.
2. Materials and Methods
2.1. Experimental Setup
A refrigeration chamber will be used to measure the noise emissions and the sound quality using different refrigeration gases under control conditions. The experimental system was designed on a refrigerating chamber including a semi-hermetic compressor model A 0.5 4Y (Frascold). Different operating points of the compressor have been evaluated at corresponding working pressures. Table 1 shows the specifications of the refrigerating system. The experimental rig of the refrigeration system can be seen in Figure 2. Each refrigerant tested was charged with the same mass, 1500 g, and previously, the compressor was also purged with nitrogen. All experiments were developed in a stable laboratory environment with a constant outside temperature of 25 °C.

Table 1.
Specification of the refrigerating systems.
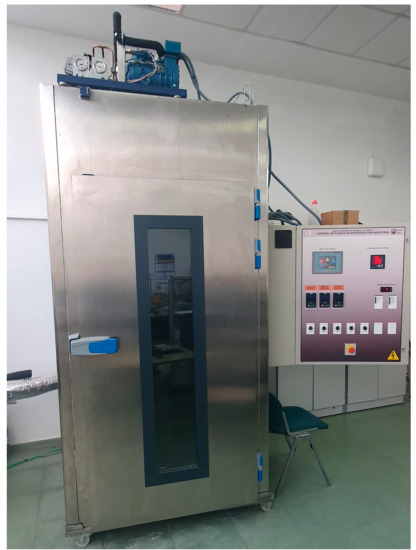
Figure 2.
Refrigerating chamber.
The installation, whose diagram is shown in Figure 3, consists of a simple vapor compression circuit, specially designed and built for the analysis and diagnosis of its behavior in a wide range of operating conditions. The installation is fully instrumented, and thus has sensors to measure the main variables such as pressure, temperature, and rotational speed, among others. The circuit consists of the four basic components: compressor, condenser, expansion valve, and evaporator. Likewise, the installation was adapted to work with different refrigerants.
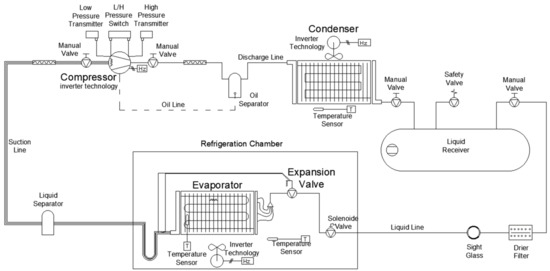
Figure 3.
Diagram of the refrigeration system.
The complete installation is basically made up of three interrelated systems that make up the actual operation of an installation. Thus, they are distinguished as follows:
- Simple vapor compression refrigeration circuit;
- Refrigeration area to be cooled;
- Control system.
The systems have particular characteristics, and these are described in depth below.
2.1.1. Single Refrigerant Circuit
The complete refrigeration circuit is shown in Figure 4, a graphic representation of the main components linked by their respective connection lines. The circuit has a mounted 1/2 CV semi-hermetic reciprocating compressor, which has a flexible electrical supply by means of a variable speed driver that allows it to work at different compressor rotational speeds.
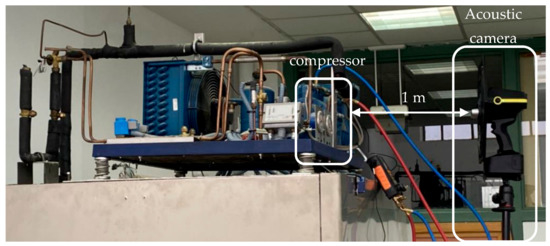
Figure 4.
Noise measurement set up.
When the superheated steam is compressed, it is led directly to the condenser. This heat exchanger is made of copper tubes and helical-type aluminum fins, using air as a cooling element to condense the refrigerant by means of a fan with a frequency variator and release heat to the environment. In the condenser, the refrigerant from the compressor where it is desuperheater discharges to a saturated condition for subsequent condensation and subcooling. It then circulates through a filter drier until it reaches the thermostatic expansion valve. After expansion, the refrigerant is introduced to the evaporator, which is also made of copper tubes and aluminum fins of the helical type, using a fan with a frequency variator to recirculate the air inside the enclosure, giving heat to the refrigerant. The refrigerant leaves the evaporator with a certain degree of overheating and is finally sent to the compressor, thus closing the refrigeration circuit.
2.1.2. Refrigerated Enclosure
The compartment to be cooled has been designed with optimum dimensions for its location within the laboratory, being a basic premise for the construction of the plant and following techniques typical of industrial plants. Its measurements are 1.20 m × 1.20 m × 2.50 m, and it consists of a 0.90 m × 2.00 m door with a climalit glass viewer in order to observe the interior of the enclosure without accessing it while experiments are being rehearsed. The set is supported on a base with wheels to facilitate its transfer. The material used for its construction is 75 mm thick sandwich-type modular panels formed on the inside with pre-lacquered sheet metal with an epoxy resin finish, with expanded polyurethane-based insulation on the inside and a stainless steel sheet on the outside. The modular panels are tongue and groove, reinforcing their union with hooks to guarantee their tightness.
2.1.3. Control System
The normal operation of the system is required to consist of two well-identified systems, which work in parallel and are the following:
- Refrigeration circuit system:
It is mainly composed of the compressor, the evaporator, the condenser, the expansion valve, the solenoid valve, the liquid collection container and the refrigerant. It commands the flow of the latter through the pipes and its mission is to control the interior temperature of the enclosure, extracting heat from it through exchange in the evaporator.
This system is designed so that it can work in two different ways: ON-OFF mode, regulated mode by PLC and speed driver in compressor, condenser fan, and evaporator fan.
- Defrost system:
It is responsible for detecting as closely as possible when enough ice has been produced in the evaporator to cut off the operation of the refrigeration circuit system before eliminating it to avoid performance losses. In this case, the defrost system melts the ice using electrical resistors.
The characteristics of all these components are described in Table 1.
2.2. Refrigerants
In this study, R-134A and R-449A refrigerants were used. R-134A or 1,1,1,2 tetrafluoroetano is a refrigerant used in a great variety of applications such air conditioners in vehicles, domestic freezers, or refrigerated transports. This is highly energy efficient at positive and medium temperatures. Since 2015, this refrigerant gas is prohibited in new vehicles, although it is possible to recharge the older refrigeration systems. R-449A could be used as substitute for R-404A in refrigeration chambers and other commercial refrigeration applications for medium and low temperatures. Table 2 shows the environmental and physical properties of tested refrigerants for the refrigerant gases used in this research.
Table 2.
The environmental and physical properties of tested refrigerants.
To measure temperatures in the refrigeration systems, two Testo 115i clamp thermometers were used connected to digital manifold Testo 550s. Moreover, the high and low pressures were measured with a Testo 549i gauges at digital manifold Testo 550s.
2.3. Noise Measurement
Noise emissions and sound quality were measured using an acoustic camera from Gfai Tech GmbH model Mikado 2D (Berlin, Germany), with 96 MEMS microphone array and NoiseImage software used for sound analysis in post-processing. The acoustic camera was placed at 1 m distance from the block of compressor in identification of sound sources, see Figure 4. The noise was measured in front side. The aim of the acoustic camera is the identification of the sound source in the compressor. For this, the acoustic camera generates acoustic images based on imaging beamforming 2D.
2.4. Sound Quality Metrics
Psychoacoustics indicators constitute an interesting way to measure how nice or disturbing a sound is for human beings. The number of indicators to objectively classify the sound quality is huge, including loudness, sharpness, roughness, boom, fluctuation strength, and tonality. Some metrics, such as loudness, are defined following international standards [17]. The selection of a metric to define sound quality depends on the application. Loudness was evaluated in this study. The unit of loudness is sone. Sones are different than decibels due to the fact that these take into account the frequency and level-dependent nature of human hearing. Decibels only quantify the amplitude of a sound, so they do not accurately represent how a sound can be perceived as loudness.
Additionally, the points of the refrigeration system with more sound pressure level and loudness were identified with a 2D systems.
3. Results
The first tests carried out used R-134A. The acoustic camera was placed at 1 m in front of the refrigeration system. Noise emission was measured without the control system working; after that, the control systems was active in measuring the noise emission. Then, the refrigeration gas was replaced by R-449A, and the same tests without and with the activation of the control system were carried out. All experiments were made at the same conditions of temperature and humidity.
Figure 5 shows the loudness for both refrigeration gases with and without regulation system (Figure 5c,d and Figure 5a,b respectively). It is possible to observe how the level of loudness is lower using 134A refrigerant as well as when the system of control is working for both kinds of refrigerant. Moreover, the sound source in the refrigeration systems was identified close to the suction nozzle.
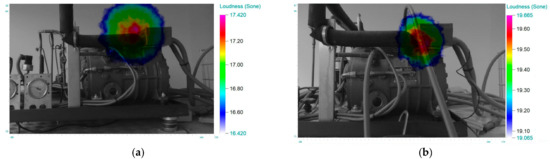
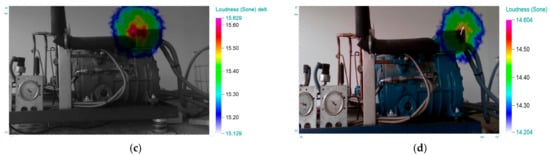
Figure 5.
Identification of the sound source: (a) R-134A without control system, (b) R-449A without control system, (c) R-134A with control system, and (d) R-449A with control system.
It is possible to observe that the maximum average spectrum (red continuous line in the spectrum) is achieved by R-449A (Figure 6). Additionally, the content of low frequencies is higher using this kind of gas, which could increase the annoyance. When the control system is working, the effect of the variable frequency drive (VFD) can be seen in the spectrum due to the peak of frequency at 8 kHz, 12.5 kHz, and 16 kHz corresponding to the working frequency of VFD.
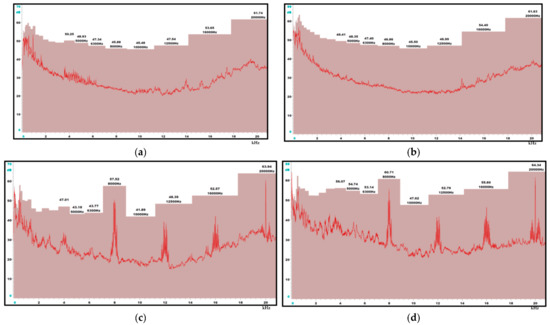
Figure 6.
One third octave band spectrum: (a) R-134A without control system, (b) R-449A without control system, (c) R-134A with control system, and (d) R-449A with control system.
From Figure 7, it is also possible to see the effect of the control system. When the regulation is applied to the refrigeration system, the loudness dropped more than 3 sones. Moreover, the differences of the emitted loudness between R-134A and R-449A can be appreciated. This is almost 3 sones without control systems and 2 sones when the VFD are working.
Figure 7.
Loudness for R-449A and R-134A refrigerant gases with and without control system.
The working pressures for R-449A and R-134A refrigerant gases can be seen in Figure 8. It is possible to see the relationship between both working pressures and loudness. Loudness is represented by bubbles; the higher the loudness, the higher the size of bubbles. Both low and high frequencies seem to be more constant for R-134A than R-449A, as well as loudness. In the case of R-449A, it is possible to observe that the loudness increases when the pressures rise, and the trend of the loudness is almost linear.
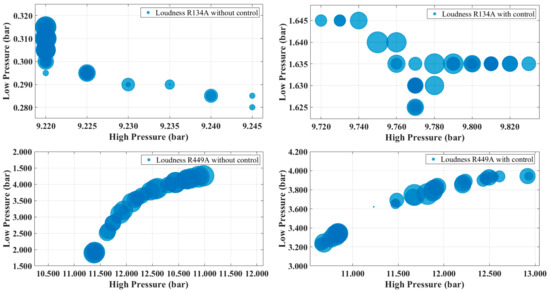
Figure 8.
Relationship between loudness and working pressures for R-449A and R-134A refrigerant gases.
A Spearman correlation test was carried out to determine associations between pressures, control system, type of gas, and loudness. According to Table 3, it is possible to observe that there is a correlation between loudness and the other variables. The correlation results show that loudness was linked with the type of gas and, therefore, with the working pressures. Loudness was also improved, which means that it was lower when the control system was active, and the VFD was working compared to without the control system.
Table 3.
Statistical results of Pearson’s correlation.
4. Discussion
As can be seen in Table 2, the fact that refrigerants R-449A and R-134A, which are one alternative to R404A, have low hydrocarbon content by weight, which makes these refrigerants have a low flammability. Additionally, the used refrigerants do not need to change the type of lubricant, and there are not major differences in the coefficient of performance (COP/EER) (w/w), 2.32 and 2.42 for R--134A and R-449A, obtained from Frascold software selection 3 v.1.21.0. The main source of noise and vibration in a compressor is the cavitation level inside the compressor. When the flow rate increases, the cavitation level rises and the vapor bubbles proliferate due to the lower fluid pressure than vapor pressure. This increase in pressure fluctuations due to cavitation in the compressor causes more noise and vibration. For this reason, the gas pressures are important [18,19,20]. This correlation can be seen in Table 3, where there is a correlation between loudness and the low and high pressures.
Another important factor mentioned above is the COP. This is an indicator of the refrigeration system performance. The higher the COP, the higher the efficiency of the refrigeration system. Both substitute gases of R-404A have better COP than this (2.28 w/w (COP/EER)) [21]. Moreover, Cingiz et al. [22] found that there is a correlation between the COP and noise and vibration of the refrigerant gases. The higher the COP value, the lower the noise values. In our study, both R-134A and R-449A have a higher COP than R-404A; thus, these could be the best alternative to R-404A. The effect of the VFD used to manipulate the rotational speed of the compressor also has an impact on noise emitted (Figure 7). Similar results were found by some authors [23] using VFD as an alternative to improve the efficiency of the compressor and reduce the noise emission. The VFD controls the motor speed of the compressor and, therefore, the cycle times of the piston. The compressor improves its mechanical efficiency by reducing the energy consumption and reducing loudness by up to 5 sones (Figure 7). For both refrigerant gases studied, the behavior shown with the use of VFD regarding the working pressures and noise is more linear than when VFD is not used (Figure 8).
5. Conclusions
The most important design parameter to reduce the noise emitted by the refrigeration compressors can be by reducing the pressures and, therefore, the forces transmitted from the compressor to the casing. In this research, different refrigerant gases with different operating pressures have been studied with the aim to be an alternative to R-404A and reduce noise emissions. It was observed that noise and loudness levels vary depending on the kind of refrigerant used. The refrigeration gases have different working pressures that have an influence on noise emission. Compressor noise is partially affected by the refrigerant change in the system. From this research, it is possible to notice that the noise component is deeply related to the compression process of refrigerant gas due to the fact that pressures gases are different for each gas. This study shows that both R-134A and R-449A could be a substitute to R-404A in terms of noise level. However, R-134A has a lower noise emission and better sound quality than R-449A. Additionally, these refrigerant gases have similar thermodynamic parameters to R-404A, and these could be used interchangeably without any change in the system.
This alternative can be combined with other techniques to reduce the noise emission. For example, attenuators can reduce the aerodynamic noise of the compressor or constructive parameters of the compressor.
Based on the current investigation, further research is designed to correlate the noise emitted using more different refrigeration gases and the pressure of the gases. This correlation will be achieved using artificial neural network.
Author Contributions
Conceptualization, R.D.R.-C. and F.V.-S.; methodology, R.D.R.-C., A.J.C.-A. and M.D.R.-M.; validation, R.D.R.-C., F.V.-S., A.J.C.-A. and M.D.R.-M.; formal analysis, R.D.R.-C.; investigation, R.D.R.-C. and M.D.R.-M.; writing—original draft preparation, R.D.R.-C.; writing—review and editing, M.D.R.-M.; supervision, M.D.R.-M. and F.V.-S. All authors have read and agreed to the published version of the manuscript.
Funding
This research received no external funding.
Data Availability Statement
Not applicable.
Conflicts of Interest
The authors declare no conflict of interest.
References
- Midgley, T.; Henne, A.L., Jr. Organic Fluorides as Refrigerants 1. Ind. Eng. Chem. 1930, 22, 542–545. [Google Scholar] [CrossRef]
- European Union. Regulation (eu) No 517/2014 of the European Parliament and of the Council of 16 April 2014 on Fluorinated Greenhouse Gases and Repealing Regulation (EC) No 842/2006.2014; European Union: Brussels, Belgium, 2014. [Google Scholar]
- Serdar, C.C.N. Emmanuel, Studies on the flow-induced noise at the evaporator of a refrigerating system. Appl. Therm. Eng. 2011, 31, 2485–2493. [Google Scholar]
- Jang, S.; Choung, H.; Park, S.; Lee, S. Investigation on noise of rotary compressors using fluid-structure interaction. J. Mech. Sci. Technol. 2019, 33, 5129–5135. [Google Scholar] [CrossRef]
- Venkatappa, S.; Koberstein, M.; Liu, Z. NVH Challenges with Introduction of New Refrigerant HFO-1234yf. In Proceedings of the WCX™ 17: SAE World Congress Experience, Detroit, MI, USA, 5–6 April 2017; pp. 1–5. [Google Scholar]
- He, Z.; Li, D.; Han, Y.; Zhou, M.; Xing, Z.; Wang, X. Noise Control of a Twin-Screw Refrigeration Compressor. Int. J. Refrig. 2021, 124, 30–42. [Google Scholar] [CrossRef]
- Espíndola, R.S.; Knabben, F.T.; Melo, C.; Hermes, C.J. Performance evaluation of household refrigerators running with R600a contaminated with non-condensable gases. Int. J. Refrig. 2020, 111, 86–93. [Google Scholar] [CrossRef]
- Xia, Y.; Liu, Y.; Liu, Y.; Ma, Y.; Xiao, C.; Wu, T. Experimental study on reducing the noise of horizontal household freezers. Appl. Therm. Eng. 2014, 68, 107–114. [Google Scholar] [CrossRef]
- Navrud, S. The Economic Value of Noise Within the European Union—A Review and Analysis of Studies. Acta Acust. 2004, 89, 14–17. [Google Scholar]
- York Council. Air Conditioning Units and Refrigeration Noise. 2022. Available online: https://www.york.gov.uk/AirConditioningNoise (accessed on 1 January 2022).
- Council of New York. Noise from Air Conditioner of Ventilation Equipment. 2022. Available online: https://portal.311.nyc.gov/article/?kanumber=KA-01933 (accessed on 1 January 2022).
- Environmental Energy Agency. EPA Establishes New Noise Label Program. 2022. Available online: https://www.epa.gov/archive/epa/aboutepa/epa-establishes-new-noise-label-program.html (accessed on 1 January 2022).
- Berry, B.F. The work of I-INCE Technical Study Group 2 on noise labels for consumer and industrial products. Noise Health 2003, 5, 21–24. [Google Scholar] [PubMed]
- Europena Union. Directive 2000/14/EC of the European Parliament and of the Council of 8 May 2000 on the Approximation of the Laws of the Member States Relating to the Noise Emission in The Environment by Equipment for Use Outdoors; European Union: Brussels, Belgium, 2000. [Google Scholar]
- European Union. Regulation (EC) No 219/2009 of the European Parliament and of the Council of 11 March 2009 Adapting a Number of Instruments Subject to the Procedure Referred to in Article 251 of the Treaty to Council Decision 1999/468/EC with Regard to the Regulatory Procedure with Scrutiny; European Union: Brussels, Belgium, 2009. [Google Scholar]
- European Union. Regulation (EU) 2019/1243 of the European Parliament and of the Council of 20 June 2019 Adapting a Number of Legal Acts Providing for the Use of the Regulatory Procedure with Scrutiny to Articles 290 and 291 of the Treaty on the Functioning of the European Union; European Union: Brussels, Belgium, 2019. [Google Scholar]
- ISO532-1 2017; Acoustics—Methods for Calculating Loudness—Part 1: Zwicker Method. ISO: Geneva, Switzerland, 2017.
- Al-Obaidi, A.R.; Towsyfyan, H. An Experimental Study on Vibration Signatures for Detecting Incipient Cavitation in Centrifugal Pumps Based on Envelope Spectrum Analysis. J. Appl. Fluid Mech. 2019, 12, 2057–2067. [Google Scholar] [CrossRef]
- Al-Obaidi, A.R.; Mishra, R. Experimental Investigation of the Effect of Air Injection on Performance and Detection of Cavitation in the Centrifugal Pump Based on Vibration Technique. Arab. J. Sci. Eng. 2020, 45, 5657–5671. [Google Scholar] [CrossRef]
- Al-Obaidi, A. Experimental Comparative Investigations to Evaluate Cavitation Conditions within a Centrifugal Pump Based on Vibration and Acoustic Analyses Techniques. Arch. Acoust. 2020, 45, 541–556. [Google Scholar]
- Wu, H.; Shen, Y.; Liang, M.; Liu, J.; Wu, J.; Li, Z. Performance Research and Optimization of Sound Insulation Hood of Air Compressor Unit. Appl. Sci. 2021, 11, 10364. [Google Scholar] [CrossRef]
- Cingiz, Z.; Katircioğlu, F.; Saridemir, S.; Yildiz, G.; Yusuf, Ç.A.Y. Experimental investigation of the effects of different refrigerants used in the refrigeration system on compressor vibrations and noise. Int. Adv. Res. Eng. J. 2021, 5, 152–162. [Google Scholar] [CrossRef]
- Peñarrocha, I.; Llopis, R.; Tárrega, L.; Sánchez, D.; Cabello, R. A new approach to optimize the energy efficiency of CO2 transcritical refrigeration plants. Appl. Therm. Eng. 2014, 67, 137–146. [Google Scholar] [CrossRef]


Disclaimer/Publisher’s Note: The statements, opinions and data contained in all publications are solely those of the individual author(s) and contributor(s) and not of MDPI and/or the editor(s). MDPI and/or the editor(s) disclaim responsibility for any injury to people or property resulting from any ideas, methods, instructions or products referred to in the content. |
© 2023 by the authors. Licensee MDPI, Basel, Switzerland. This article is an open access article distributed under the terms and conditions of the Creative Commons Attribution (CC BY) license (https://creativecommons.org/licenses/by/4.0/).