Abstract
Building an adaptative, flexible, resilient, and reliable inventory management system provides a reliable supply of cross-border e-commerce commodities, enhances supply chain members with a flow of products, fulfills ever-changing customer requirements, and enables e-commerce service automation. This study uses an e-commerce company as a case study to collect intensive inventory data. The key process of the AI approach for an intensive data forecasting framework is constructed. The study shows that the AI model’s optimization process needs to be combined with the problems of specific companies and information for analysis and optimization. The study provides optimization suggestions and highlights the key processes of the AI-predicting inventory model. The XGBoost method demonstrates the best performance in terms of accuracy (RMSE = 46.64%) and reasonable computation time (9 min 13 s). This research can be generalized and used as a useful basis for further implementing algorithms in other e-commerce enterprises. In doing so, this study highlights the current trend of logistics 4.0 solutions via the adoption of robust data-intensive inventory forecasting with artificial intelligence models for cross-border e-commerce service automation. As expected, the research findings improve the alleviation of the bullwhip impact and sustainable supply chain development. E-commerce enterprises may provide a better plan for their inventory management so as to minimize excess inventory or stock-outs, and improve their sales strategies and promotional and marketing activities.
1. Introduction
An established efficient and reliable inventory management system guarantees the reliable supply of cross-border e-commerce commodities, provides supply chain members with a flow of products, and meets the ever-changing requirement of fulfilling various customer demands [1]. Additionally, precise and robust inventory forecasting is essential for replenishment automation and e-commerce service automation. Lau and Mazaheri [2] proposed that inventory management is one of the key decisions in supply chain management in response to globalization. The five fundamental supply chain management sectors are planning, purchasing, manufacturing, distribution, and return. Supply chain management refers to the scientific management method of product manufacturing, transportation, distribution, and sales that effectively organize suppliers, manufacturers, warehouses, distributors, and retailers to minimize the entire supply chain systemwide cost and maximize customer service level. However, in the supply chain planning process, the traditional demand forecasting method is limited by scientific and technological factors as well as data volume and variety. Machine learning models can be used to classify various data based on product past sales volume in the supply chain. Through mining, integrating, and analyzing all kinds of necessary data of products, they can extract key data features and find complex dependency relationships in data. Nevertheless, these data are usually very intensive and difficult to handle.
The advancement of technological development, empowered consumers, e-commerce, and globalization have facilitated the growth of electronic supply chain management in the 21st century. As such, electronic supply chain management and logistics 4.0 will be the new trend of supply chain development in the coming years. The outbreak of the COVID-19 pandemic induced governments to adopt ‘lockdown’ policies, tight social distancing measures, quarantine, and rigorous anti-infection measures (i.e., human-to-human; human-to-cargo). Clearly, the enhancement of electronic supply chain management is the only way to mitigate the risks to the supply chain and sustain the competitiveness of supply chain management due to COVID-19 [3]. As expected, high-speed internet access would integrate enterprises, customers, and suppliers into the electronic supply chain and exchange vital information and real-time data promptly. The rapid, transparent, and integrated information flow can respond to real customer demand in time through the Internet and other new, innovative technologies. To this end, firms would achieve prompt responses to final customer requirements, reduce inventory costs, improve efficiency, promote traceability, and enhance technical sustainability for building resilient supply chains [4].
With the continuous development of networks, artificial intelligence (AI), machine learning, blockchain technology, and database technology, research has started to use complicated computer modelling and systematic analysis tools for forecasting and inventory prediction applications. AI has been widely adopted in the real applications of many disciplines such as logistics, healthcare [5,6], water quality [7], hydro informatics problems [8], etc. In logistics services, Tang et al. [9] proposed the use of the AI model to forecast economic recession through logistics industries. Recently, blockchain technologies [10] were applied to the inventory management of a large-scale company in the aviation industry. To enhance supply chain quality management, various critical factors were considered by Chau et al. [11], and the fuzzy approach was adopted in Yung et al. [12] for inventory classification in order to enable enhanced logistics management and decision-making. A relevant integration model was established through supply chain big data collection and analysis to encourage enterprises to use quantitative analysis and forecast future supply chain situations. In fact, machine learning and AI approaches are critically important in the development of logistics service automation. In logistics service automation, AI algorithms have not only been adopted in driving the automation of robotic processes [13,14] in a smart warehouse and manufacturing but have also been adopted to measure the data flow to form digital twin models [15], as well as in an automated trading system [16] and in automating the return on investment [17] in an enterprise.
In the future, supply chain management will rely more on big data and models. In addition, the information between each link of the supply chain will be more transparent, and adjustments will accordingly be more rapid. The problems to be discussed in our study mainly focus on cross-border supply chain inventory forecasting. Through conducting a thorough literature review, the authors have identified that most of the quantitative analysis of supply chain inventory forecasting has been inclined toward the manufacturing, industrial, and agricultural fields. Relevant research studies of the supply chain are under-researched because conducting research on the supply chain using artificial intelligence requires a large amount of business and inventory data. In reality, big data is one of a company’s core assets. Big data is not only very intensive for computation, but also difficult for researchers to obtain.
This study addresses the main research problems (RPs) as follows.
RP1: The accuracy of the traditional time series model in inventory forecasting is low.
RP2: Some commonly used models are inefficient in inventory forecasting due to the underutilization of a complete set of data-intensive data.
RP3: Quantitative research using AI associated with inventory forecasting analysis of cross-border e-commerce is insufficient.
Thus, this research aims to study the key research questions of exploring the AI models that are suitable for performing supply chain inventory forecasting in a cross-border e-commerce company. We also explore how AI approaches can be efficiently employed to handle huge amounts of data to facilitate companies to produce more accurate inventory forecasts.
This paper is organized into six main sections. The current section (Section 1) provides the research background, settings, and objectives. Section 2 provides a comprehensive literature review including: inventory forecasting methods of the supply chain; the concept, influence, and development of cross-border e-commerce; supply chain and logistics management of cross-border e-commerce; and inventory optimization development of cross-border e-commerce. Section 3 illustrates the approaches for data preprocessing and the key AI model adopted in this study. In Section 4, inventory problem analysis and inventory forecasting optimization are also presented. The findings are discussed and concluded in Section 5 and Section 6, respectively.
2. Literature Review
2.1. Inventory Forecasting for Supply Chains
To reduce waste in the supply chain and to lower costs, inventory forecasting and replenishment automation are important. However, replenishment automation remains very challenging because it is hard to predict sales and demand patterns in industries, and this requires a large amount of data. To eliminate waste, Praveen et al. [18] developed a neural network model and further used it in the discipline of inventory forecasting. On the other hand, business processes and decision-making practices usually determine the value of big data in supply chain management. Wong et al. [19] conducted a research study focused on integrating AI technology with crucial decision points in the textile supply chain. The study explains how knowledge and conceptual ideas such as neural networks, genetic algorithms, and fuzzy set theory can be appropriately applied to a sustainable textile supply chain in the textile and apparel industry.
To make sure of the normal operation of product supply, enterprises need to review and evaluate the key performance indicators (KPIs) of suppliers regularly. In response, the research by Chan [20] mainly concentrated on recognizing and determining the assessment criteria for suppliers, in which relevant factors (e.g., price, delivery, quality assurance controls, management, financial conditions, capacity management, claims to handle controls, environmental conditions, available transportation modalities, technical support, etc.) need to be selected to critically evaluate the performance of suppliers. This is an important step in managing a pool of pre-qualified or preferred suppliers. Recently, Kerravala [21] and Yu and Deng [22] demonstrated the feasibility of artificial intelligence algorithms in the supply chain, notably inventory forecasting activity. This implies that additional supplier selection may need to include their technological abilities, which may influence the factors of inventory forecasting and delivery date [23].
Supply chain risk management (SCRM) includes various strategies designed to identify, assess, and mitigate risk monitoring for contingencies that may have an impact (mainly adverse) on any part of the supply chain. Baryannis et al. [24] defined the concepts of various risks and uncertainties of the supply chain. Globalization, supply chain complexity, product complexity, suppliers’ selection, constant changes in demand and cost, human-made and natural disasters, and the bullwhip effect significantly increase the risks and uncertainties of the supply chain. To minimize the risks and uncertainties of the supply chain, firms may analyze the supply chain risks, design and implement robust supplier assessment, develop an information hub, and produce products of lower complexity.
2.2. Cross-Border E-Commerce
In the development of cross-border e-commerce, it is inevitable that various problems related to consumers are encountered, among which e-commerce disputes are the primary sources. Zheng [25] assessed the current and potential role of Online Dispute Resolution (ODR) in resolving e-commerce disputes, identified the legal robust framework and legal barriers to the transformation of the ODR, and drew on the latest international legislation in e-commerce law and dispute resolution to provide constructive recommendations for ODR design in the coming years.
In addition to the aforementioned external factors, internal factors are also significant for contributing to the development of cross-border e-commerce. Epstein [26] put forward that information systems, enterprise strategy, leadership, and organizational structure are the four key elements that affect the successful development of cross-border e-commerce enterprises. With these four main elements, cross-border e-commerce can become an essential approach for enterprises to create value. In order to produce a comprehensive cross-border e-commerce master plan, companies must first assess the internal and external environmental factors that drive organizational change. Cross-border e-commerce also needs to evaluate the investments of competitors’ e-commerce and technical capabilities, as well as their suppliers’ abilities and customers’ expectations. Such assessments are critical in determining the e-business plan to be implemented. Such research helps enterprises evaluate their existing situation from all aspects before entering the international market and encourages enterprises to decide whether they can meet the conditions for keen competition in the market in all aspects, as well as focusing more on the internal strategic arrangements of enterprises. It emphasizes the investigation of cross-border e-commerce enterprises at both the technical and strategic levels. Indeed, enterprises need to explore cultural factors in the cross-border e-commerce market. Suppose that cross-border e-commerce enterprises prefer to sell their products to foreign users. In doing so, they need to have an in-depth investigation and understanding of a foreign culture so only products and services that fulfill user cultures and habits can secure the market competition more favorably. Sinkovics et al. [27] comprehensively investigated 100 cross-border e-commerce websites in Germany, the United States, the United Kingdom, and Latin America to analyze the key cultural differences in cross-border e-commerce websites from the perspective of cultural value. The research proposed that cultural differences play a significant role in the enhancement of cross-border e-commerce.
Further, in cross-border trade, the cost of trade-related cross-language boundaries has dramatically increased. Hongfei et al. [28] concentrated on the impact of cultural differences between China and the West on cross-border consumption behavior when they studied the importance of cultural value to cross-border e-commerce. Interestingly, Westerners are more concerned about protecting their privacy, so, they are often more reluctant to share their personal valuable experiences, families, and unique living conditions with others. These main differences may make it easier for Chinese people to be asked personal questions about family or work when making cross-border purchases. Until now, many foreigners perceived this an invasion of their privacy. Some potential customers may become extremely frustrated and the deal will be cancelled. Therefore, researchers believe that adhering to cultural norms is a vital part of a successful cross-border e-commerce strategies.
2.3. Supply Chain and Logistics Management for Cross-Border E-Commerce
Today, due to the broad geographical spread and the rapid development momentum of cross-border e-commerce, there is an increasing trend in small and medium-sized manufacturing enterprises beginning to explore the adoption of cross-border e-commerce. Jiang et al. [29] explored various key factors determining the service quality of cross-border e-commerce logistics. The research results showed that the enterprise’s asset scale, number of employees, financial status, emphasis on logistics business, and convenience are considered as the key metrics affecting cross-border e-commerce logistics’ service quality. The research further clarified the interaction between cross-border e-commerce and modern logistics operations. As such, the study found various logistics factors affecting the service quality of cross-border e-commerce logistics, which had a promising role in guiding enterprises to optimize the supply chain and in promoting the advancement of the cross-border e-commerce industry.
While improving the efficiency of product development, inventory, and distribution management, management systems can effectively collect, store, and analyze consumer preferences and behavior big data, promote enterprise comprehensive data analysis, and develop resilience in the supply chain. Ramanathan et al. [30] focused on analyzing consumer buyer data and then further employed the data analysis results to optimize the supply chain. Shi et al. [31] addressed inventory data analysis, forming a good complement to cross-border e-commerce enterprises. Min et al. [32] discussed the relationships between suppliers and retailers. It was pointed out that in the supply chain of cross-border e-commerce transactions, information sharing can coordinate the close relationships between node companies, facilitate long-term cooperation, and maximize the supply chain’s overall benefits.
Additionally, recommender systems for e-commerce firms have received wide attention from researchers and industrial practitioners. In general, most of the current recommender systems adopt only information from e-commerce to give recommendations, for instance, rating scores of purchased commodities or consumer purchased history log. In response to smart customization, mass personification, and the COVID-19 pandemic, the forthcoming recommender systems may need to integrate with various social platforms. Also, sufficient information on social networks to increase recommendation accuracy [33]. To facilitate data-driven decision-making and the digitalization of logistics processes, advanced levels of technological intelligence (i.e., Logistics 4.0 solutions) such as the Internet of Things, big data analytics, cloud computing, blockchain, robotics process automation, and intelligent transport systems, may need to be adopted in cross-border e-commerce [34]. As expected, e-commerce has encouraged the digitization of consumers and businesses and generated effective and efficient digital processes [35].
2.4. Research on Inventory Optimization for Cross-Border E-Commerce
Inventory management is an essential part of supply chain management, and the level of inventory management is also a crucial embodiment of enterprise coordination in the supply chain. From the viewpoint of supply chain management, inventory management can be divided into traditional and modern inventory management. Seifbarghy and Gilkalayeh [36] focused on the analysis and elaboration of Retailer Managed Inventory (RMI), a typical representative of the traditional Inventory model. It also made a comparative analysis of Vendor Managed Inventory (VMI), representing the modern inventory management mode. The research study encouraged cross-border e-commerce enterprises to evaluate whether their inventory management mode has a clear definition.
Bieniek [37] investigated two consignment modes of retailer-managed consignment inventory (RMCI) and vendor-managed consignment inventory (VMCI). The research provided the optimal solutions for retail price, service level, and consignment price, to maximize both retailers’ and suppliers’ expected profit in the collaboration. To a certain extent, the research provided a clear concept and optimal solution for an inventory cooperation model between suppliers and retailers. The former research focused on the external inventory cooperation mode of cross-border e-commerce enterprises and did not start from internal inventory management. Zhu [38] constructed an internal inventory analysis model for the supply chain to solve demand forecasting and planning, and proposed methods to improve inventory management according to the analysis results. Grob [39] engaged in after-sales support of supply chain management in a large German automobile company and was mainly responsible for the functional development of the inventory planning system of the spare parts business. In the inventory management of multilevel networks, the study proposed optimizing the inventory in the planned distribution network from the whole supply chain’s perspective to optimize inventory security at different levels in the supply chain.
3. Methodology
In this section, we reveal the key methodology for inventory forecasting using an AI model. We propose that the process of AI approach for intensive data forecasting framework consists of five key steps: data preprocessing, feature extraction, selection of AI model, parameter settings and modeling training, and results from the evaluation. Figure 1 illustrates the overall workflow of the proposed data-intensive inventory forecasting models for cross-border e-commerce enterprises. To further elaborate on the methodology, the key process for handling intensive data and the proposed AI model for inventory forecasting, i.e., the Extreme Gradient Boosting (XGBoost), are illustrated. In the beginning, the intensive data are handled through a series of processes which are widely illustrated in the literature [40]. The details are described in Section 3.1. Then the parameters of the AI models are set, and the model is trained for inventory forecasting based on the intensive data. The details of the XGBoost model used for the investigation are elaborated on in Section 3.2.
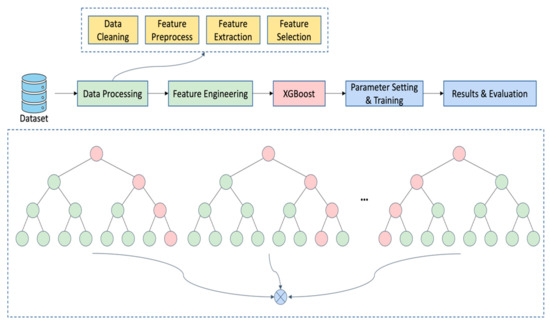
Figure 1.
The process of the proposed data-intensive inventory forecasting models for cross-border e-commerce enterprises.
3.1. Data Collection and Preprocessing
In the beginning, the intensive data are the inventory data collected from a case study e-commerce company. The raw data consist of several data files including goods and SKU relation, inventory data, sales data, etc. The data are combined into the matrix format using Python. To handle the data set, we propose that it should be divided into a number of data series and fields. In this investigation, the data types are classified into nine data series. Table 1 illustrates the details of the data series and the fields of the data. A detailed description of the meaning of the data series is illustrated in Table 2.

Table 1.
Data series of the product.
Table 2.
The description of series.
After the data series are categorized, data processing is performed by four major processes, namely data cleaning, feature preprocessing, feature extraction, and feature selection. Feature extraction is to extract feature fields from the original data and convert the data into a specific format, while the feature selection screens out the better feature sets in order to achieve better performance of the model. In general, there are five common approaches for feature selection, namely weight by Gini index, weight by chi-square, hierarchical variable clustering, weight by correlation, and weight by information gain ratio. In this study, we adopted the weight by Gini index for feature selection. The Gini coefficient over 0.5 is used for feature selection in order to ensure a better training model [41]. In order to implement the AI algorithm, the data set should be free of missing data. Due to a variety of noise and interference effects that exist in the data, Kalman filtering [42] is used for cleaning the data set. Data filtering is an advanced data processing technique to remove noise and restore real data. Kalman filtering can estimate the state of a dynamic system from a series of data with measurement noise when the measurement variance is known. The features of the data are first extracted to perform feature preprocessing. The feature extraction aims to transform the dimensions of the data and conduct feature preprocessing. Some of the common key features for the e-commerce enterprise and the techniques for filling in the missing data such as filling in zero, calculating the mean, constructing the sum, etc. are based on the data feature. Some features with consistent statistical distribution are selected for modelling to improve the model’s operating efficiency and accuracy and reduce noise in the data set [43]. For the training and validation, 70% of the data set is used as the training set to train model parameters, 25% of the data set is used as the validation set to validate the model and adjust and optimize parameters, and 5% of the data were used as the testing set to test the accuracy of the model’s prediction.
3.2. Extreme Gradient Boosting (XGBoost)
Nowadays, there are a number of AI models for implementing inventory forecasting. These models include the last-value forecasting model, simple averaging forecasting model, moving average forecasting model, weighted moving average model, multiple linear regression forecasting model, ridge/lasso linear regression forecasting model, and random forest regression forecasting model. Our study is based on the Extreme Gradient Boosting (XGBoost) model developed by Chen and Guestrin [44]. It is used in the investigation not only due to the advantage that the algorithm can make use of the Graphical Processing Unity (GPU) to speed up the training, but its performance is also suitable for handling the data-intensive big data that predict the expected inventory and forecasting. Suppose a data set labelled y has n rows and m indices. Including , the regression tree model predicted values might be defined as:
where K represents the number of trees and shows the number K tree, and represents the set of regression trees. The scores of each leaf node were calculated, and the set constructed by the scores of all nodes was shown in table. represents the function that maps R to T, and T represents the leaf tag set.
The XGBoost target function L is defined as follows:
Among them, i represents residual error function between the and , and Ω means to prevent excessive fitting the regularization of the problem.
where is the regularization parameter, is the leaf node weight. is generally a constant term used to describe the penalty coefficient of the weight , and T is the number of leaf nodes.
XGBoost brings the predicted value closer to the actual value by increasing the number of tree nodes. The goal is to find an that minimizes the target function L. Data through theoretical derivation, expressed in , are divided into the left subtree of the sample label set; the parent node label set with is described, including said right subtree label sets, so there are:
Among them, respectively represent loss function after times of iteration, the predicted value in the first derivative and second derivative. segmentation is caused by the loss function change, after for new leaf node to join the price’s complexity.
4. Results
To illustrate the experimental results of the inventory forecasting for the data-intensive data, XGBoost was first applied and is illustrated in Section 4.1. The algorithm was then compared with other several common AI forecasting models in Section 4.2. The accuracy of the prediction results was compared based on the root mean square error.
4.1. Inventory Forecasting with the XGBoost
In this experiment, the intensive data of the case study company was preprocessed by cleaning, feature extraction, and preprocessing. The model was trained and compared based on different settings of the parameters in the AI model of the algorithm. The parameters were set based on the highest accuracy of the search target. The parameters were updated until the extreme value of the accuracy was obtained.
The model prediction accuracy was compared with the actual data of the case study company. The accuracy was calculated based on the root mean square error for comparison. The root means square error (RMSE) was the square root of the deviation between the predicted value and the actual value and the ratio of the number of observations N. It describes the error range between the predicted value and the actual value. The smaller the RMSE, the smaller the prediction error. The relevant equation is given by:
Table 3 illustrates the inventory forecasting results in four consecutive weeks. The results were comprised of a 158,189 × 6 matrix corresponding to the 158,189 different goods and commodity items in the case study company. The second column represents the ID of each item, while the last four columns represent the RMSE of the prediction results by using XGBoost. The results were determined after training the model, processing the data, and using the best parameter settings.
Table 3.
Inventory forecasting results over four weeks.
4.2. Comparison with Other Inventory Forecasting Models
In this section, we compare the prediction results with various AI models for inventory forecasting [45,46]. At the beginning of the investigation, the parameter settings for each model were firstly determined. The parameter settings for each AI model are summarized in Table 4, determined based on the results of the lowest RMSE.
Table 4.
Parameter settings for each AI model.
Table 5 summarizes the results of different inventory forecasting models in terms of the RMSE and the computation time. The results revealed that the XGBoost Method achieved the lowest error compared with other algorithms. The RMSE was approximately 1.4-times better than the second-best AI model, random forest regression, in which the last-value method achieved the lowest accuracy but the fastest computation time among the other algorithms. The computation time of the XGBoost method is approximately the median of other algorithms. To better compare the capabilities of different forecasting methods, Figure 2 presents the graphical results of different algorithms based on the accuracy and computation time. The x-axis is 1/RMSE, which means that a higher value shows a better computation accuracy, while the y-axis refers to the computation time of the algorithm. The results revealed that that the inventory forecasting method can be basically divided into four groups. The worst group, including lasso linear regression, multiple linear regression, and ridge linear regression models, has the lowest computation efficiency and computation accuracy. The second group, including the last value, weighted moving average, simple average, and moving average method, has the highest computation efficiency, but the computation accuracy is the lowest. The third group is the random forest regression method, which has average computation efficiency and good accuracy. The last group is the XGBoost method, which demonstrated the highest accuracy and average computation efficiency. In this study, the training parameters including learning rate, maximum depth, etc. were defined by referring to the related research by Wang and Ni [47].
Table 5.
The comparison table of different forecasting methods’ computation time and accuracy.
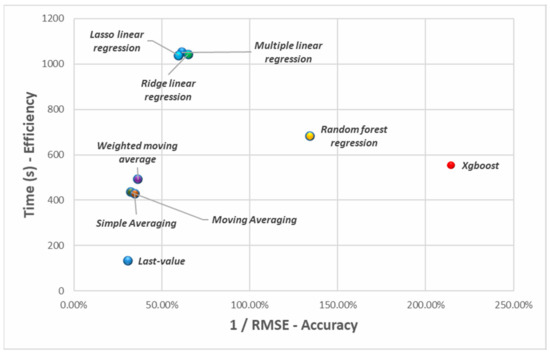
Figure 2.
Graphical representation of the computation efficiency and accuracy for various forecasting models.
5. Discussion
This inventory forecasting model has highlighted that traditional models fail to provide impressive forecasting results in a complex cross-border e-commerce business environment. The forecasting accuracy of the AI model is generally higher than that of time series models, mainly due to the AI model using enterprises’ intensive multi-dimensional supply chain data instead of being limited to single time-series data. Compared with other models, the AI model can make full use of data to construct a large number of features, and automatically mine the rules between features and predict the target inventory. The AI forecasting model XGBoost shows the highest predictive accuracy and dramatically improves the inventory forecasting accuracy compared with other models in the case company. Considering forecast accuracy, efficiency, and cost, XGBoost is clearly better than other models and better suited for inventory forecasting in the supply chain.
This research demonstrates the ability of AI models in handling intensive data in a case study of cross-border e-commerce. This study provides a theoretical basis and useful case reference for cross-border e-commerce companies to apply an effective AI model for inventory forecasting. Nevertheless, the AI model’s optimization process needs to be combined with specific companies’ problems and information for analysis and optimization. This research can be used as a useful reference for further implementing the algorithms in other e-commerce enterprises.
Despite this article conducting a pilot study on the use of machine learning approaches to handle intensive data for cross-border e-commerce, the focus of the study is primarily on common AI algorithms. We argue that these approaches are rapidly available for most existing enterprises, and the investigation first evaluated the effectiveness of cross-border e-commerce. Thus, this pilot study is practical for many of the related service enterprises for service automation. However, other state-of-the-art approaches can be considered in the future to determine the feasibility and accuracy of the latest algorithms for service enterprises. In addition, other measurement metrics such as the confusion matrix, mean average precision (MAP), etc. can be used for further analyzing and comparing the accuracy of the approaches [48].
6. Conclusions
This study revealed that the artificial intelligence model XGBoost performs more accurately and efficiently than other time series models and linear regression models in forecasting cross-border e-commerce inventory through a mixed method (i.e., quantitative and qualitative analysis) of a case company. This research is based on the existing XGBoost model and is further extended in investigating cross-border e-commerce enterprises. In the form of quantitative analysis, this model’s feasibility in cross-border e-commerce is proven using intensive data. At the same time, it is also compared with other typical models.
Nevertheless, deep learning models were not included in this study’s comparison due to the research hardware limitations. In the future, deep learning models can be applied to compare the difference with other forecasting models and determine the applicability of deep learning algorithms for improving the inventory forecasting of cross-border e-commerce, particularly in the ability to handle intensive data in the industry. In addition, this study adopts an e-commerce company as a case study to gather intensive inventory data. In the future, we may conduct a large-scale study to collect data from other companies so as to explore common elements and factors. Lastly, the premise for applying the AI model is having intensive business data because a small amount of data will lead to the training of the prediction model being imprecise. For generally small cross-border e-commerce companies, this method may not be suitable if it is unable to accumulate a considerable amount of data. Other data augmentation algorithms may be required to enhance the data volume for such cases. In conclusion, this study performed pilot research on inventory forecasting of data-intensive data for e-commerce enterprises.
Author Contributions
Y.M.T. and Z.Z. collected and analyzed the data; Y.M.T. and Z.Z. wrote the manuscript. K.Y.C. and Y.-y.L. edited and revised the paper. All authors have read and agreed to the published version of the manuscript.
Funding
This research received no external funding.
Institutional Review Board Statement
Not applicable.
Informed Consent Statement
Not applicable.
Data Availability Statement
Not applicable.
Conflicts of Interest
The authors declare no conflict of interest.
References
- Tejesh, B.S.S.; Neeraja, S. Warehouse inventory management system using IoT and open source framework. Alex. Eng. J. 2018, 57, 3817–3823. [Google Scholar] [CrossRef]
- Lau, Y.-Y.; Mazaheri, A. A Vendor Managed Inventory with FIFO and LIFO Plans. J. Res. Sci. Eng. Technol. 2020, 8, 43–59. [Google Scholar] [CrossRef]
- Yui-Yip, L.; Zhang, J.; Ng, A.K.; Roozbeh, P. Implications of a Pandemic Outbreak Risk: A Discussion on China’s Emergency Logistics in the Era of Coronavirus Disease 2019 (COVID-19). J. Int. Logist. Trade 2020, 18, 127–135. [Google Scholar]
- Wong, S.; Yeung, J.K.W.; Lau, Y.-Y.; So, J. Technical Sustainability of Cloud-Based Blockchain Integrated with Machine Learning for Supply Chain Management. Sustainability 2021, 13, 8270. [Google Scholar] [CrossRef]
- Li, W.; Tang, Y.M.; Yu, K.M.; To, S. Slc-gan: An automated myocardial infarction detection model based on generative adversarial networks and convolutional neural networks with single-lead electrocardiogram synthesis. Inf. Sci. 2022, 589, 738–750. [Google Scholar] [CrossRef]
- Saberi-Movahed, F.; Najafzadeh, M.; Mehrpooya, A. Receiving More Accurate Predictions for Longitudinal Dispersion Coefficients in Water Pipelines: Training Group Method of Data Handling Using Extreme Learning Machine Conceptions. Water Resour. Manag. 2020, 34, 529–561. [Google Scholar] [CrossRef]
- Najafzadeh, M.; Homaei, F.; Farhadi, H. Reliability assessment of water quality index based on guidelines of national sanitation foundation in natural streams: Integration of remote sensing and data-driven models. Artif. Intell. Rev. 2021, 54, 4619–4651. [Google Scholar] [CrossRef]
- Najafzadeh, M.; Oliveto, G. Riprap incipient motion for overtopping flows with machine learning models. J. Hydroinform. 2020, 22, 749–767. [Google Scholar] [CrossRef]
- Tang, Y.-M.; Chau, K.-Y.; Li, W.; Wan, T. Forecasting economic recession through share price in the logistics industry with artificial intelligence (AI). Computation 2020, 8, 70. [Google Scholar] [CrossRef]
- Ho, G.; Tang, Y.M.; Tsang, K.Y.; Tang, V.; Chau, K.Y. A blockchain-based system to enhance aircraft parts traceability and trackability for inventory management. Expert Syst. Appl. 2021, 179, 115101. [Google Scholar] [CrossRef]
- Chau, K.-Y.; Tang, Y.M.; Liu, X.; Ip, Y.-K.; Tao, Y. Investigation of critical success factors for improving supply chain quality management in manufacturing. Enterp. Inf. Syst. 2021, 15, 1418–1437. [Google Scholar] [CrossRef]
- Yung, K.L.; Ho, G.T.S.; Tang, Y.M.; Ip, W.H. Inventory classification system in space mission component replenishment using multi-attribute fuzzy ABC classification. Ind. Manag. Data Syst. 2021, 121, 637–656. [Google Scholar] [CrossRef]
- Wewerka, J.; Reichert, M. Robotic process automation—A systematic mapping study and classification framework. Enterp. Inf. Syst. 2021, 17, 1986862. [Google Scholar] [CrossRef]
- Wirtz, J.; Kunz, W.H.; Paluch, S. The Service Revolution, Intelligent Automation and Service Robots, The European Business Review. 2021. Available online: https://www.europeanbusinessreview.com/the-service-revolution-intelligent-automation-and-service-robots/ (accessed on 21 February 2023).
- Ebel, H.; Riedelsheimer, T.; Stark, R. Enabling automated engineering’s project progress measurement by using data flow models and digital twins. Int. J. Eng. Bus. Manag. 2021, 13. [Google Scholar] [CrossRef]
- Huang, B.; Huan, Y.; Xu, L.D.; Zheng, L.; Zou, Z. Automated trading systems statistical and machine learning methods and hardware implementation: A survey. Enterp. Inf. Syst. 2019, 13, 132–144. [Google Scholar] [CrossRef]
- De Reanzi, S.R.; Thangaiah, P.R.J. A survey on software test automation return on investment, in organizations predominantly from Bengaluru, India. Int. J. Eng. Bus. Manag. 2021, 13. [Google Scholar] [CrossRef]
- Praveen, U.; Farnaz, G.; Hatim, G. Inventory management and cost reduction of supply chain processes using AI based time-series forecasting and ANN modeling. Procedia Manuf. 2019, 38, 256–263. [Google Scholar] [CrossRef]
- Wong, W.K.; Guo, Z.X.; Leung, S. Optimizing Decision Making in the Apparel Supply Chain Using Artificial Intelligence (AI): From Production to Retail; Elsevier: Amsterdam, The Netherlands, 2013. [Google Scholar]
- Chan, F. Logistics and Supply Chain Management with Artificial Intelligence Techniques—Part 1; Emerald Publishing Limited: Bradford, UK, 2004. [Google Scholar]
- Kerravala, Z. Cisco Challenge Winners Use AI, IoT to Tackle Global Problems. 2020. Available online: https://www.networkworld.com/article/3569142/cisco-challenge-winners-use-ai-iot-to-tackle-global-problems.html (accessed on 15 March 2022).
- Yu, H.; Deng, J. A partial robust optimization approach to inventory management for the offline-to-online problem under different selling prices. J. Syst. Sci. Syst. Eng. 2017, 26, 774–803. [Google Scholar] [CrossRef]
- Tsai, J.-F.; Wang, C.-P.; Lin, M.-H.; Huang, S.-W. Analysis of Key Factors for Supplier Selection in Taiwan’s Thin-Film Transistor Liquid-Crystal Displays Industry. Mathematics 2021, 9, 396. [Google Scholar] [CrossRef]
- Baryannis, G.; Validi, S.; Dani, S.; Antoniou, G. Supply chain risk management and artificial intelligence: State of the art and future research directions. Int. J. Prod. Res. 2019, 57, 2179–2202. [Google Scholar] [CrossRef]
- Zheng, J. Online Resolution of E-Commerce Disputes; Springer International Publishing: New York, NY, USA, 2020. [Google Scholar]
- Epstein, M.J. Implementing successful e-commerce initiatives. Strateg. Financ. 2005, 86, 22. [Google Scholar]
- Sinkovics, R.R.; Yamin, M.; Hossinger, M. Cultural adaptation in cross border e-commerce: A study of German companies. J. Electron. Commer. Res. 2007, 8, 221–235. [Google Scholar]
- Liu, H.; Yu, L.; Tian, R. Cultural Implications for Cross-border E-commerce: The Case of China’s Belt and Road. J. Appl. Bus. Econ. 2020, 22, 51–62. [Google Scholar]
- Jiang, P.; Jiang, H.; Hu, Y.-C.; Liang, C.; Wang, S. Identification of Key Factors Affecting Logistics Service Quality of Cross-border E-commerce. In Proceedings of the International Conference on Human-Computer Interaction, Copenhagen, Denmark, 19–24 July 2020. [Google Scholar]
- Ramanathan, R.; George, J.; Ramanathan, U. The role of logistics in e-commerce transactions: An exploratory study of customer feedback and risk. In Supply Chain Strategies, Issues and Models; Springer: Berlin/Heidelberg, Germany, 2014; pp. 221–233. [Google Scholar]
- Shi, Y.; Wang, T.; Alwan, L.C. Analytics for Cross-Border E-Commerce: Inventory Risk Management of an Online Fashion Retailer. Decis. Sci. 2020, 51, 1347–1376. [Google Scholar] [CrossRef]
- Zhao, M.; Xi, M.; Dai, D. Research on game strategy of information sharing in cross-border e-commerce supply chain between manufacturers and retailers. In Proceedings of the International Conference on Intelligent and Interactive Systems and Applications, Bangkok, Thailand, 28–30 June 2019. [Google Scholar]
- Zhao, J.; Su, B.; Rao, X.; Chen, Z. A cross-platform personalized recommender system for connecting e-commerce and social network. Future Internet 2023, 15, 13. [Google Scholar] [CrossRef]
- Dawson, P.G.; Lewandowska, K.W.; Kolinska, K.; Kolinski, A. Impact of market drivers on the digital maturity of logistics processes in a supply chain. Sustainability 2023, 15, 3120. [Google Scholar] [CrossRef]
- Pech, M.; Vrchota, J. The product customization process in relation to industry 4.0 and digitalization. Processes 2022, 10, 539. [Google Scholar] [CrossRef]
- Seifbarghy, M.; Gilkalayeh, A.P. Supply Chain Integration under Vendor Managed Inventory Mode of Operation Considering Stockout. Econ. Comput. Econ. Cybern. Stud. Res. 2012, 46, 197–218. [Google Scholar]
- Bieniek, M. Vendor and retailer managed consignment inventory with additive price–dependent demand. Optim. Lett. 2019, 13, 1757–1771. [Google Scholar] [CrossRef]
- Zhu, K. New Approaches to Inventory Management. Ph.D. Thesis, Stanford University, Stanford, CA, USA, 2002. [Google Scholar]
- Grob, C. Inventory Management in Multi-Echelon Networks: On the Optimization of Reorder Points; Springer: Berlin/Heidelberg, Germany, 2018; Volume 128. [Google Scholar]
- Ridzuan, F.; Zainon, W.M.N.W. A Review on Data Cleansing Methods for Big Data. Procedia Comput. Sci. 2019, 161, 731–738. [Google Scholar] [CrossRef]
- Dalal, S.; Onyema, E.M.; Malik, A. Hybird XGBoost model with hyper parameter tuning for prediction of liver disease with better accuracy. World J. Gastroenterol. 2022, 28, 6551–6563. [Google Scholar] [CrossRef] [PubMed]
- Chui, C.K.; Chen, G. Kalman Filtering: With Real-Time Applications, 4th ed.; Springer: Berlin/Heidelberg, Germany, 2009. [Google Scholar] [CrossRef]
- Cheema, J.R. A Review of Missing Data Handling Methods in Education Research. Rev. Educ. Res. 2014, 84, 487–508. [Google Scholar] [CrossRef]
- Chen, T.; Guestrin, C. XGBoost: A Scalable Tree Boosting System. In Proceedings of the ACM International Conference on Knowledge Discovery and Data Mining, San Francisco, CA, USA, 13–17 August 2016;–17; Volume 13, pp. 785–794. [Google Scholar]
- Saberi-Movahed, F.; Mohammadifard, M.; Mehrpooya, A.; Rezaei-Ravari, M.; Berahmand, K.; Rostami, M.; Karami, S.; Najafzadeh, M.; Hajinezhad, D.; Jamshidi, M.; et al. Decoding Clinical Biomarker Space of COVID-19: Exploring Matrix Factorization-based Feature Selection Methods. Medrxiv Prepr. Serv. Health Sci. 2021. [Google Scholar] [CrossRef] [PubMed]
- Najafzadeh, M.; Ghaemi, A.; Emamgholizadeh, S. Prediction of water quality parameters using evolutionary computing-based formulations. Int. J. Environ. Sci. Technol. 2019, 16, 6377–6396. [Google Scholar] [CrossRef]
- Wang, Y.; Ni, X.S. A XGBoost risk model via feature selection and Bayesian hyper-parameter optimization. Int. J. Database Manag. Syst. 2019, 11, 1–17. [Google Scholar] [CrossRef]
- The Council of Supply Chain Management Professionals. Supply Chain Management and Logistics Management Definition. 2007. Available online: https://cscmp.org/CSCMP/Educate/SCM_Definitions_and_Glossary_of_Terms.aspx (accessed on 21 February 2023).


Disclaimer/Publisher’s Note: The statements, opinions and data contained in all publications are solely those of the individual author(s) and contributor(s) and not of MDPI and/or the editor(s). MDPI and/or the editor(s) disclaim responsibility for any injury to people or property resulting from any ideas, methods, instructions or products referred to in the content. |
© 2023 by the authors. Licensee MDPI, Basel, Switzerland. This article is an open access article distributed under the terms and conditions of the Creative Commons Attribution (CC BY) license (https://creativecommons.org/licenses/by/4.0/).