1. Introduction
Pulsed thermography (PT) has gained widespread popularity as a Non-Destructive Evaluation (NDE) method in the past few years, due to its high accuracy and speed. It is especially suitable for detecting near-surface defects in materials such as metal, Carbon Fiber Reinforced Polymers (CFRP), and Polyvinyl Chloride (PVC). Its application spans several industries, including aerospace and automotive. However, the high complexity of PT data, which often contains noise, artifacts, and inconsistencies, makes its inspection challenging. Therefore, the application of deep learning methods in processing PT data is an important research topic. By using deep learning models, the efficiency and accuracy of defect detection within the PT data can be significantly improved. This is crucial for ensuring the reliability and safety of various engineering systems. Thus, the development of accurate and efficient deep-learning-based techniques for PT data processing can greatly enhance the capabilities of NDE for various industrial applications.
In recent years, deep learning algorithms have made remarkable progress in various image processing tasks such as image classification [
1,
2,
3], object detection [
4,
5,
6], image segmentation [
7,
8,
9], and video understanding [
10,
11]. To evaluate the performance of these algorithms, commonly used publicly available datasets, such as ImageNet [
12], PASCAL [
13], COCO [
14] for image classification and Cityscapes [
15], ADE20K [
16] for image segmentation, play a crucial role. These datasets serve as benchmarks for different deep learning methods. However, collecting such datasets in the NDE field presents several challenges. One of the main challenges is dealing with imbalanced datasets [
17], where the majority of components being tested are free of defects or damage, while only a small proportion of them are defective. This can render an artificial intelligence (AI) model ineffective if proper data preprocessing is not conducted. In addition to the imbalanced dataset challenge, the limited availability of data is another challenge in the NDE field. In particular, obtaining PT data is more difficult than obtaining normal images, as it requires specialized equipment and expertise to perform experiments in a dedicated laboratory. Furthermore, the labeling of PT data presents a multi-faceted challenge. Accurately analyzing PT data and labeling it requires skilled expertise. Additionally, validating the absence or presence of defects can be a challenging task, as defects are often hidden beneath the surface of the object. Achieving accurate validation may require destructive testing or CT scanning, both of which can be costly or damaging to the testing object.
In the field of NDE, deep learning methods for data segmentation have been applied to defects defection [
18,
19,
20]. However, access to publicly available datasets is often limited due to internal regulations. This paper addresses this issue by providing a well-designed yet relatively simple PT dataset that can facilitate future research in evaluating AI algorithms. The dataset can be found at
https://www.kaggle.com/datasets/ziangwei/irtpvc (accessed on 23 February 2023). Additionally, we have experimented with several popular deep learning models for instance segmentation on this dataset. In summary, this work makes several contributions. Firstly, a publicly available and carefully designed PT dataset for PVC components with defects of various sizes and depths is developed. This dataset can serve as a benchmark for training deep learning models and further research in the field. Secondly, the study includes experiments and results comparison using several popular encoder-decoder based defect segmentation models on the developed dataset. Finally, the efficiency of the models has been improved through the use of appropriate data transform methods and employing a frames selection method on the PT data. Overall, this work provides a valuable resource for researchers and engineers seeking to improve the accuracy and efficiency of deep learning based methods for defects detection within PT data.
2. Related Work
2.1. Pulsed Thermography
Pulsed thermography is an active thermographic method that involves the use of a heat source to stimulate an object with a heat pulse. An infrared camera then records a video of the object to measure the cooling process on the object’s surface, which can be described, using a 1D formulation, by the following Equation [
21,
22,
23]:
where
is the thermal diffusivity of the sample.
k is the sample’s thermal conductivity.
is the heat capacity of the sample.
e denotes the material’s thermal effusivity. It describes the materials’ capability of exchanging thermal energy with their surroundings.
z is the depth. At the surface of the sample where
z is zero, the equation can be simplified to:
Since the sound region has homogeneous materials, its thermal diffusivity and conductivity are similar. However, the material of the defective area has different parameters, resulting in a distinct thermal behavior. This difference forms the theoretical basis for PT as a method for non-destructive testing. PT has been applied to a range of materials, including CFRP and glass fiber reinforced materials, as well as used for the inspection of spot welds and in the protection of cultural heritage [
19,
24,
25,
26].
2.2. Deep-Learning-Based Methods Used in Thermography for NDE
In recent years, the use of deep-learning-based methods has shown significant improvement in data classification and segmentation for PT data. In [
20], Mask-RCNN has been applied to a synthetic experimental PT dataset to detect abnormal regions. In [
19], authors have employed an U-Net model to segment the defect regions on curved CFRP samples using PT technique. In [
27], Faster-RCNN models with Inception V2 and Inception Resnet V2 architectures are trained to identify defects within composite materials using thermographic images. Average precision is used to assess the models’ performance. The results show that the model with Inception V2 outperforms the one with Inception Resnet V2. A hydrogen deep neural network that incorporates temporal and spatial information on the infrared data to detect the defects in composite and coating material is proposed in [
28]. In [
29], the authors use PT to detect the impact damage within the composite samples. They employ a support vector machine to classify the defective areas from the healthy area. They report the classification results ranging from 78.7 % to 93.5 %. In [
30], recurrent neural networks and feed-forward neural networks are investigated to detect defects within non-planar CFRP specimens. The results indicate that a long short-term memory neural network outperforms a feed-forward neural network when dealing with time-dependent information. A feed-forward neural network to classify the defects into different categories is proposed [
31]. Two models are trained on raw data and Thermographic Signal Reconstruction (TSR) coefficients, respectively. The model using TSR coefficients outperforms the other using raw data.
As the use of generative adversarial networks (GANs) has become increasingly popular, they have also been applied to processing thermographic data. A GAN-based thermal image argumentation method is applied to thermographic data to enhance the visibility of defects in CFRP components in [
32]. In [
33], the authors introduce IRT-GAN, which is trained on a large augmented numerical thermographic dataset. The dataset is fully simulated for composite materials with different defect types, sizes, and depths. The model takes TSR coefficients as input and is able to produce images for defect segmentation.
2.3. Public Available Thermographic Dataset
Infrared imaging and video datasets have been widely used in various applications, such as PTB-TIR [
34] for pedestrian tracking and LLVIP [
35] for low-light vision. However, most of the existing datasets are not designed specifically for NDE tasks. In a recent study, a PT dataset was introduced that contains composite material samples made of carbon and glass fiber-reinforced plastic [
36]. However, this dataset is not publicly accessible and lacks annotations for machine learning applications. In [
37], the authors describe the infrared measurement databases from Laval University, which include various materials such as composite materials, plexiglass, steel, aluminum, etc. The focus of this study is on defect segmentation in single infrared images and does not take into account the temporal information between thermal images. To the best of our knowledge, there is currently a lack of well-documented, publicly available PT datasets for defect segmentation that consider both spatial and temporal information within the thermal image sequences.
3. Data Preparation and Preliminaries
3.1. Specimens’ Information and Data Acquisition
In this study, we introduce the PVC-Infrared dataset, which is a deep learning dataset that consists of 19 thermal image sequences for 19 PVC specimens. Each specimen has a dimension of 100 mm × 100 mm × 5 mm, with cylindrical holes of varying sizes and depths created on the bottom side to simulate subsurface defects, as depicted in
Figure 1. The diameter of the cylindrical holes ranges from 2 mm to 10 mm, and the depth ranges from 2.5 mm to 4.5 mm from the bottom surface.
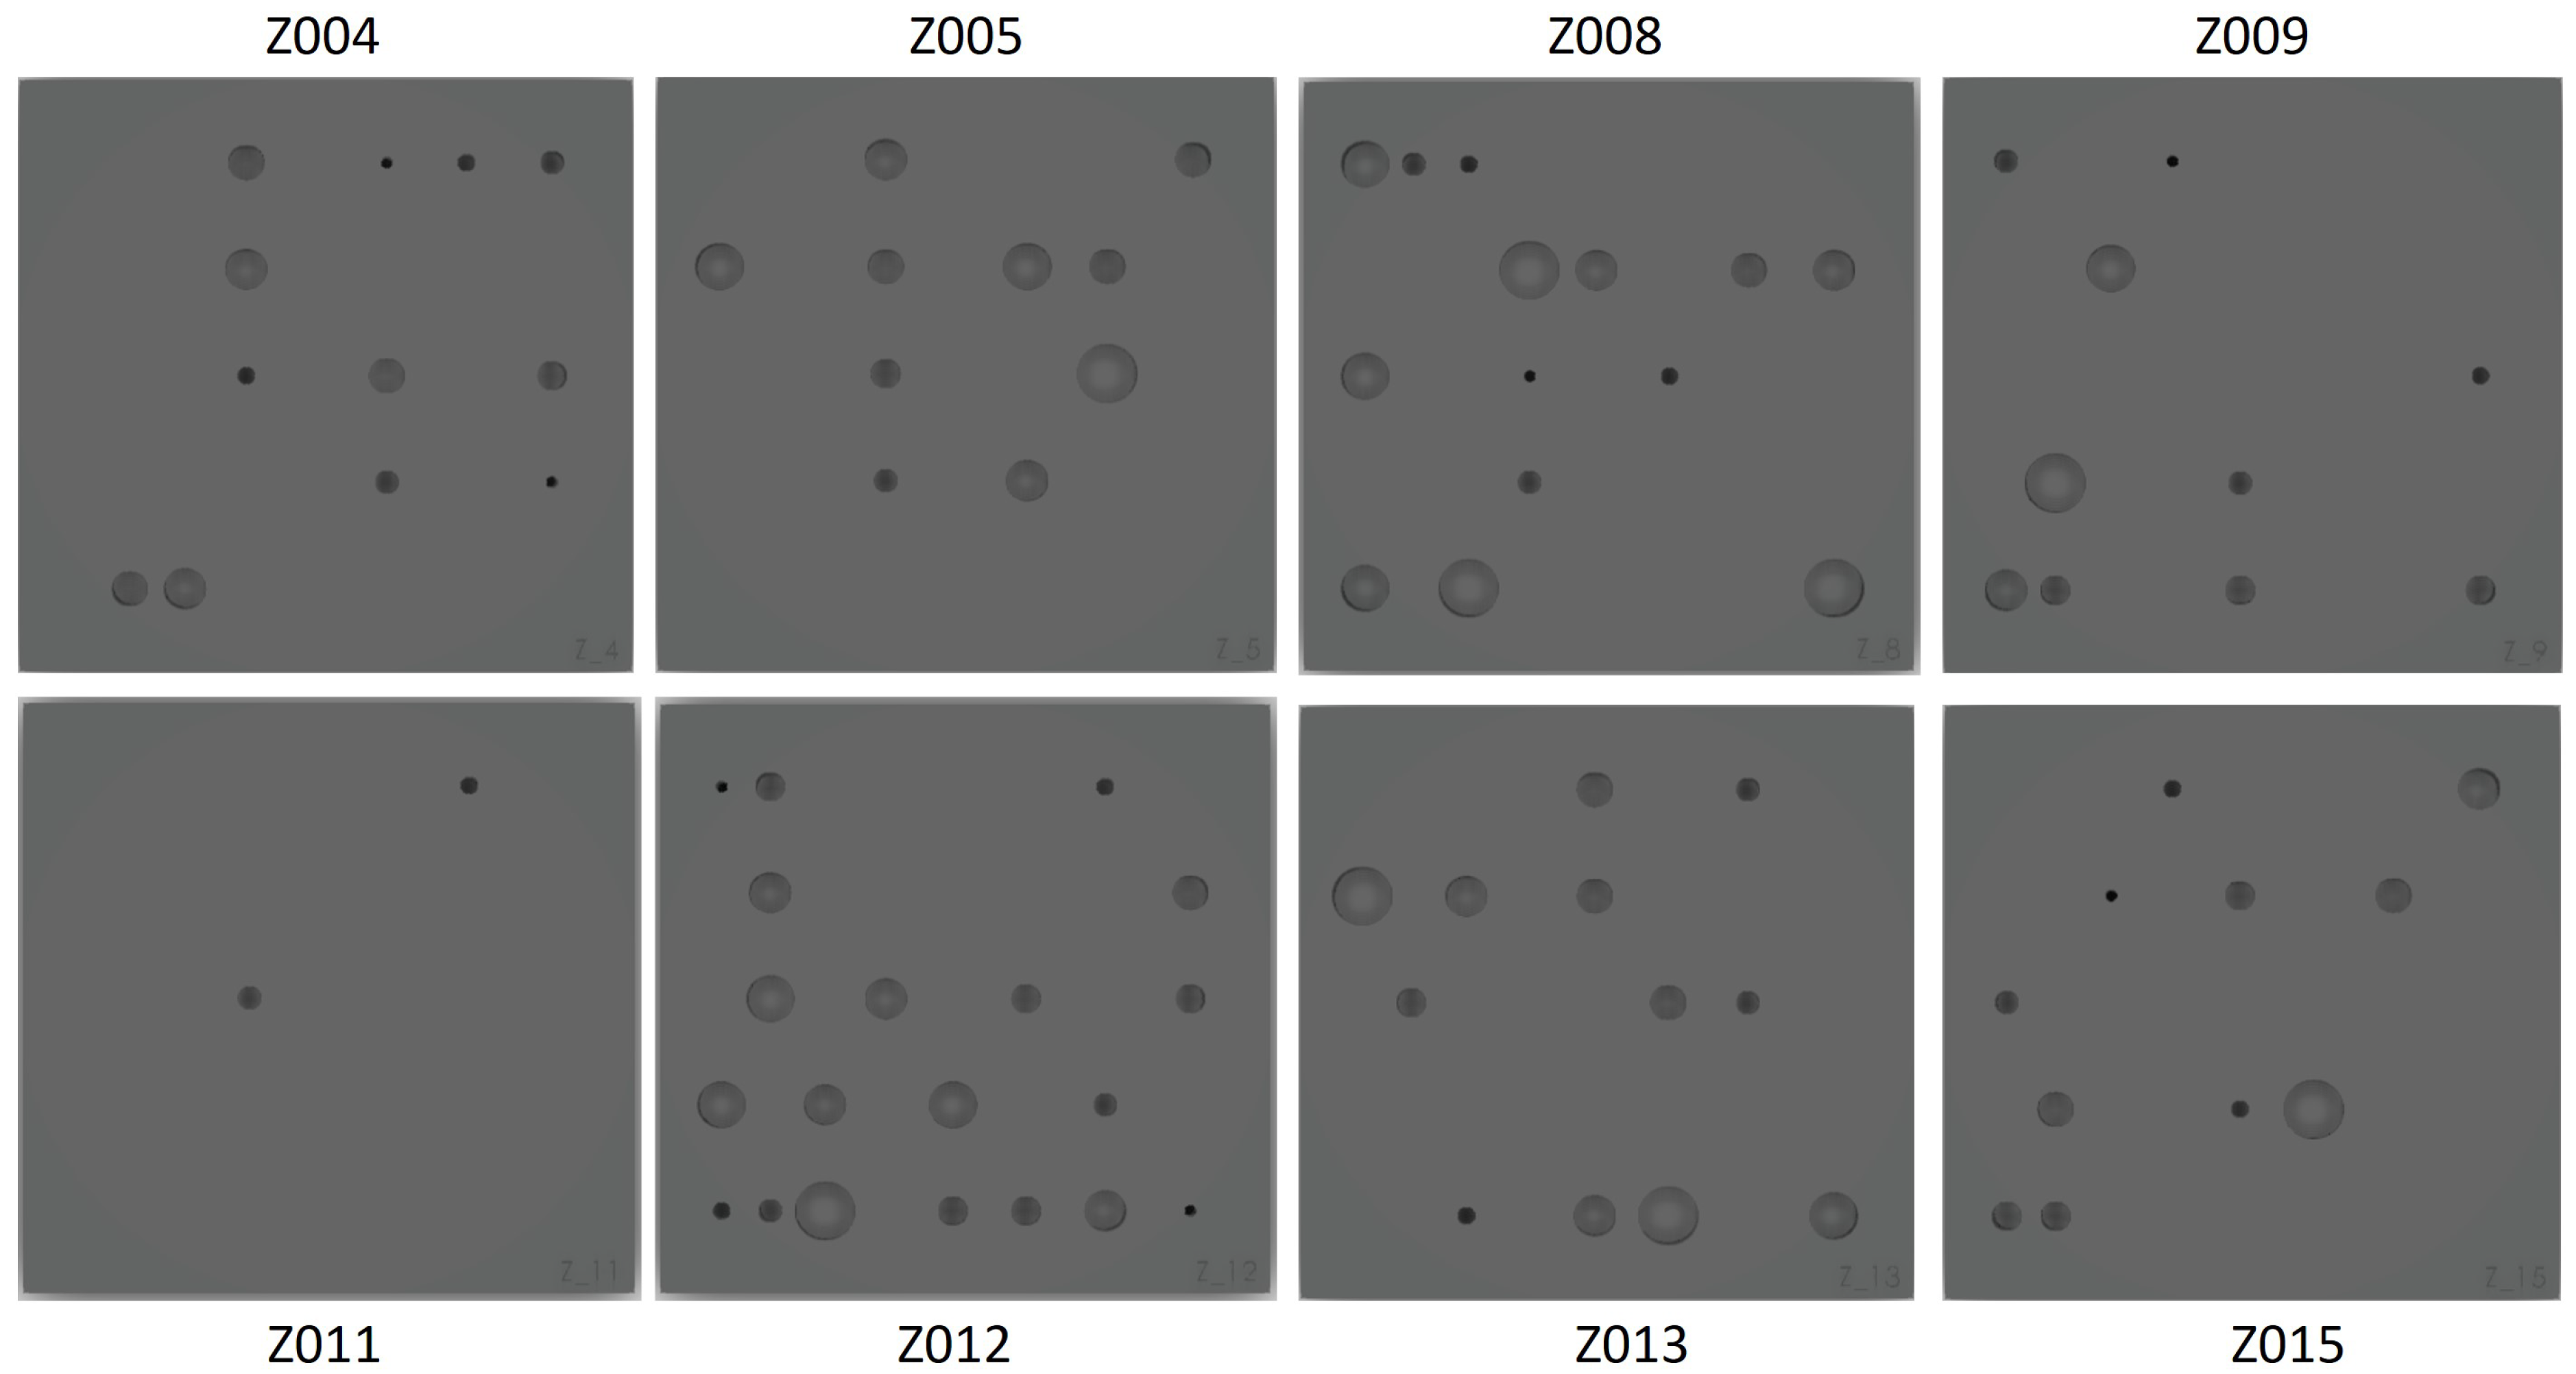
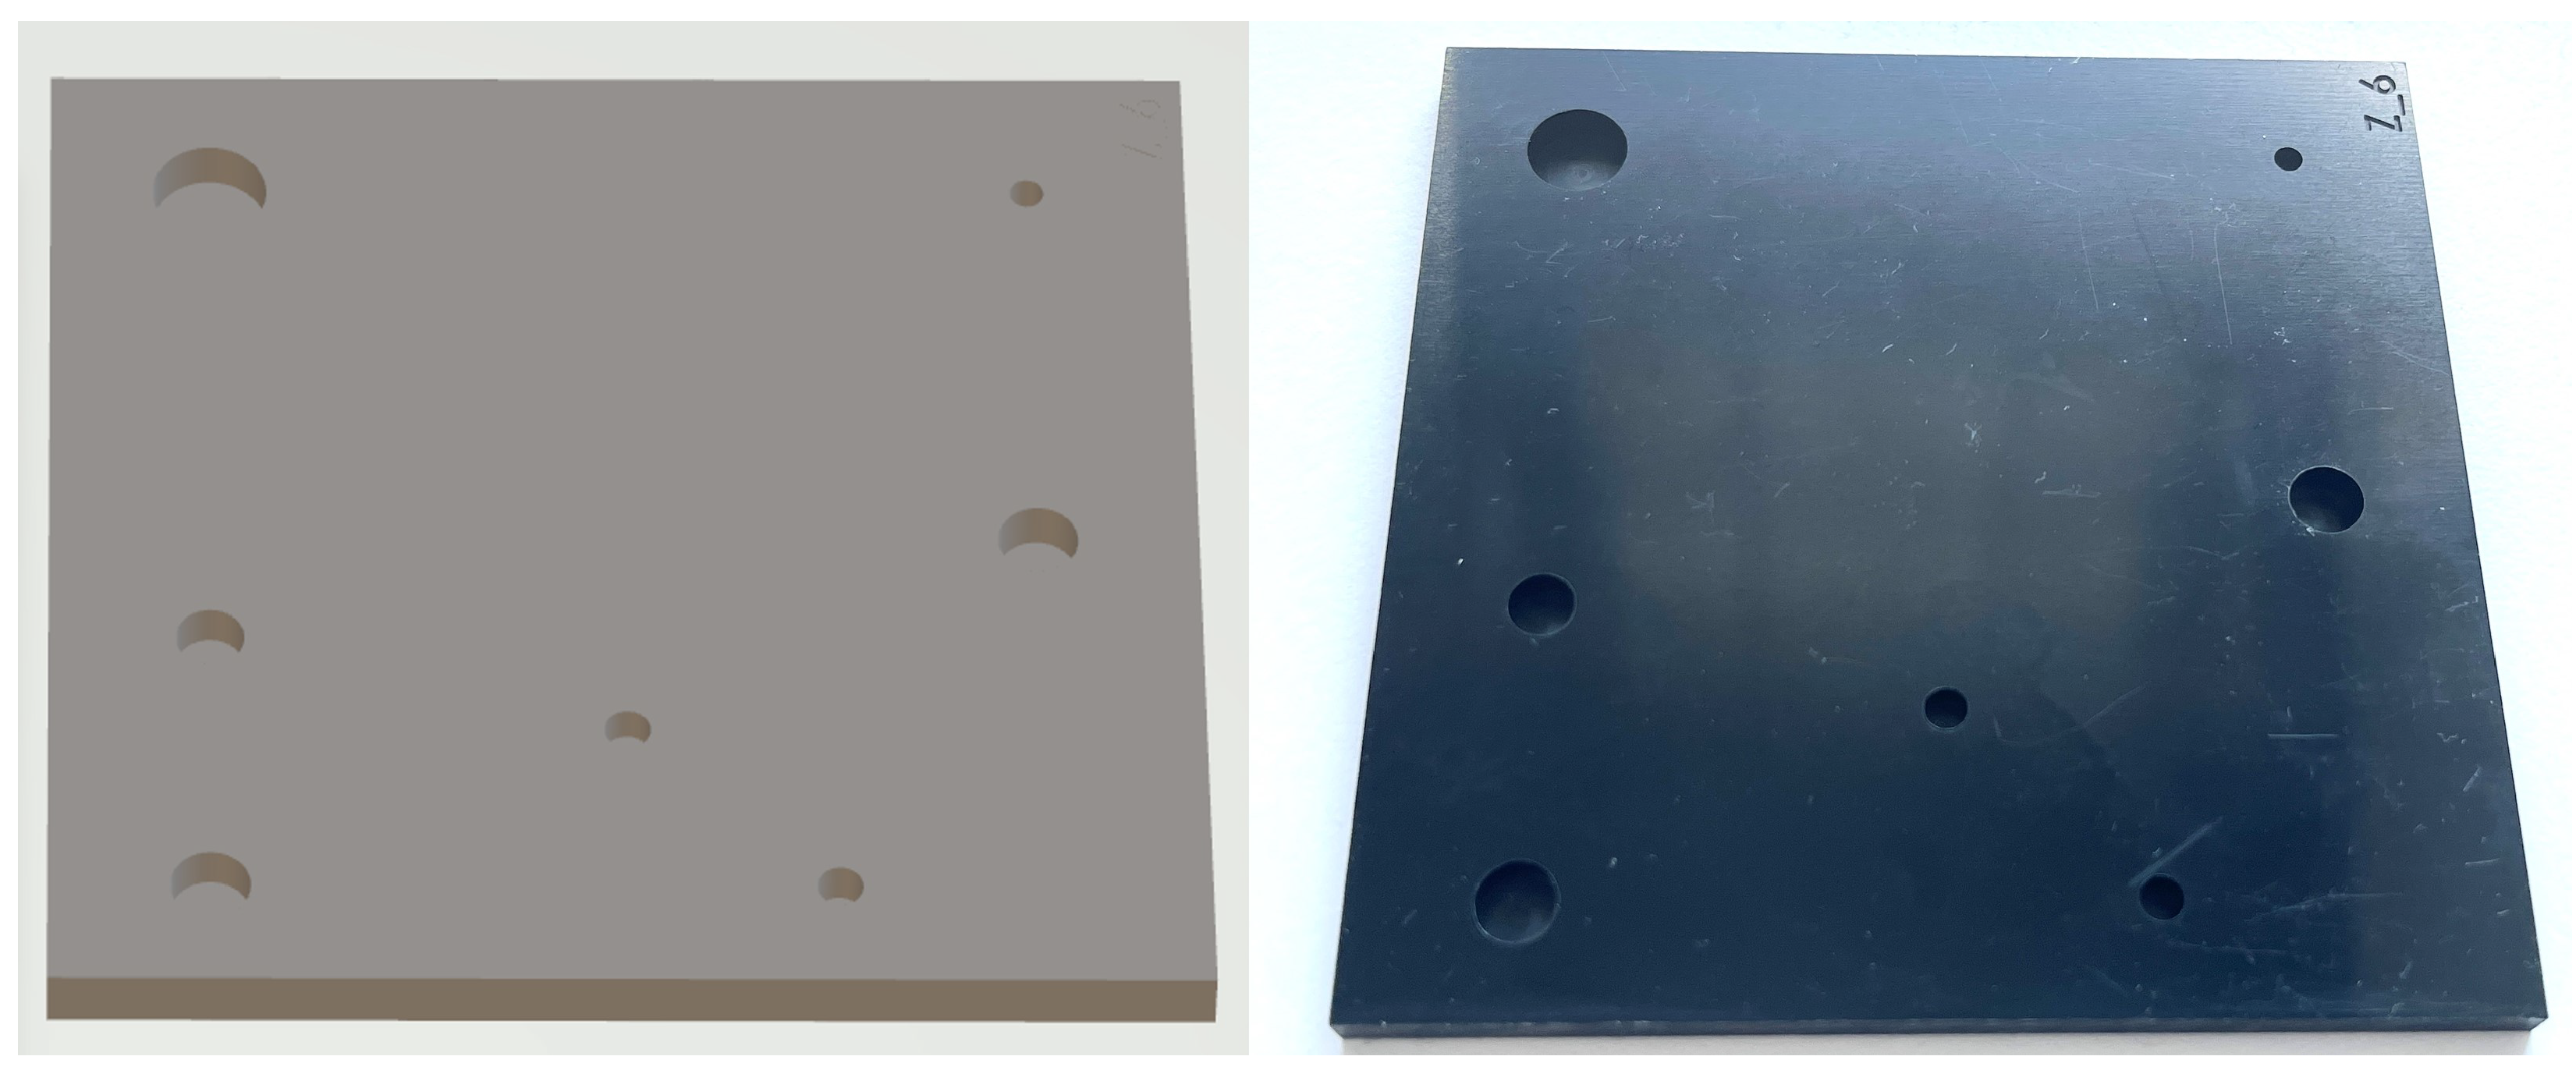
Figure 2 provides CAD images of eight specimens viewed from the bottom, while
Figure 3 illustrates a comparison of a CAD image and an optical image of a single specimen.
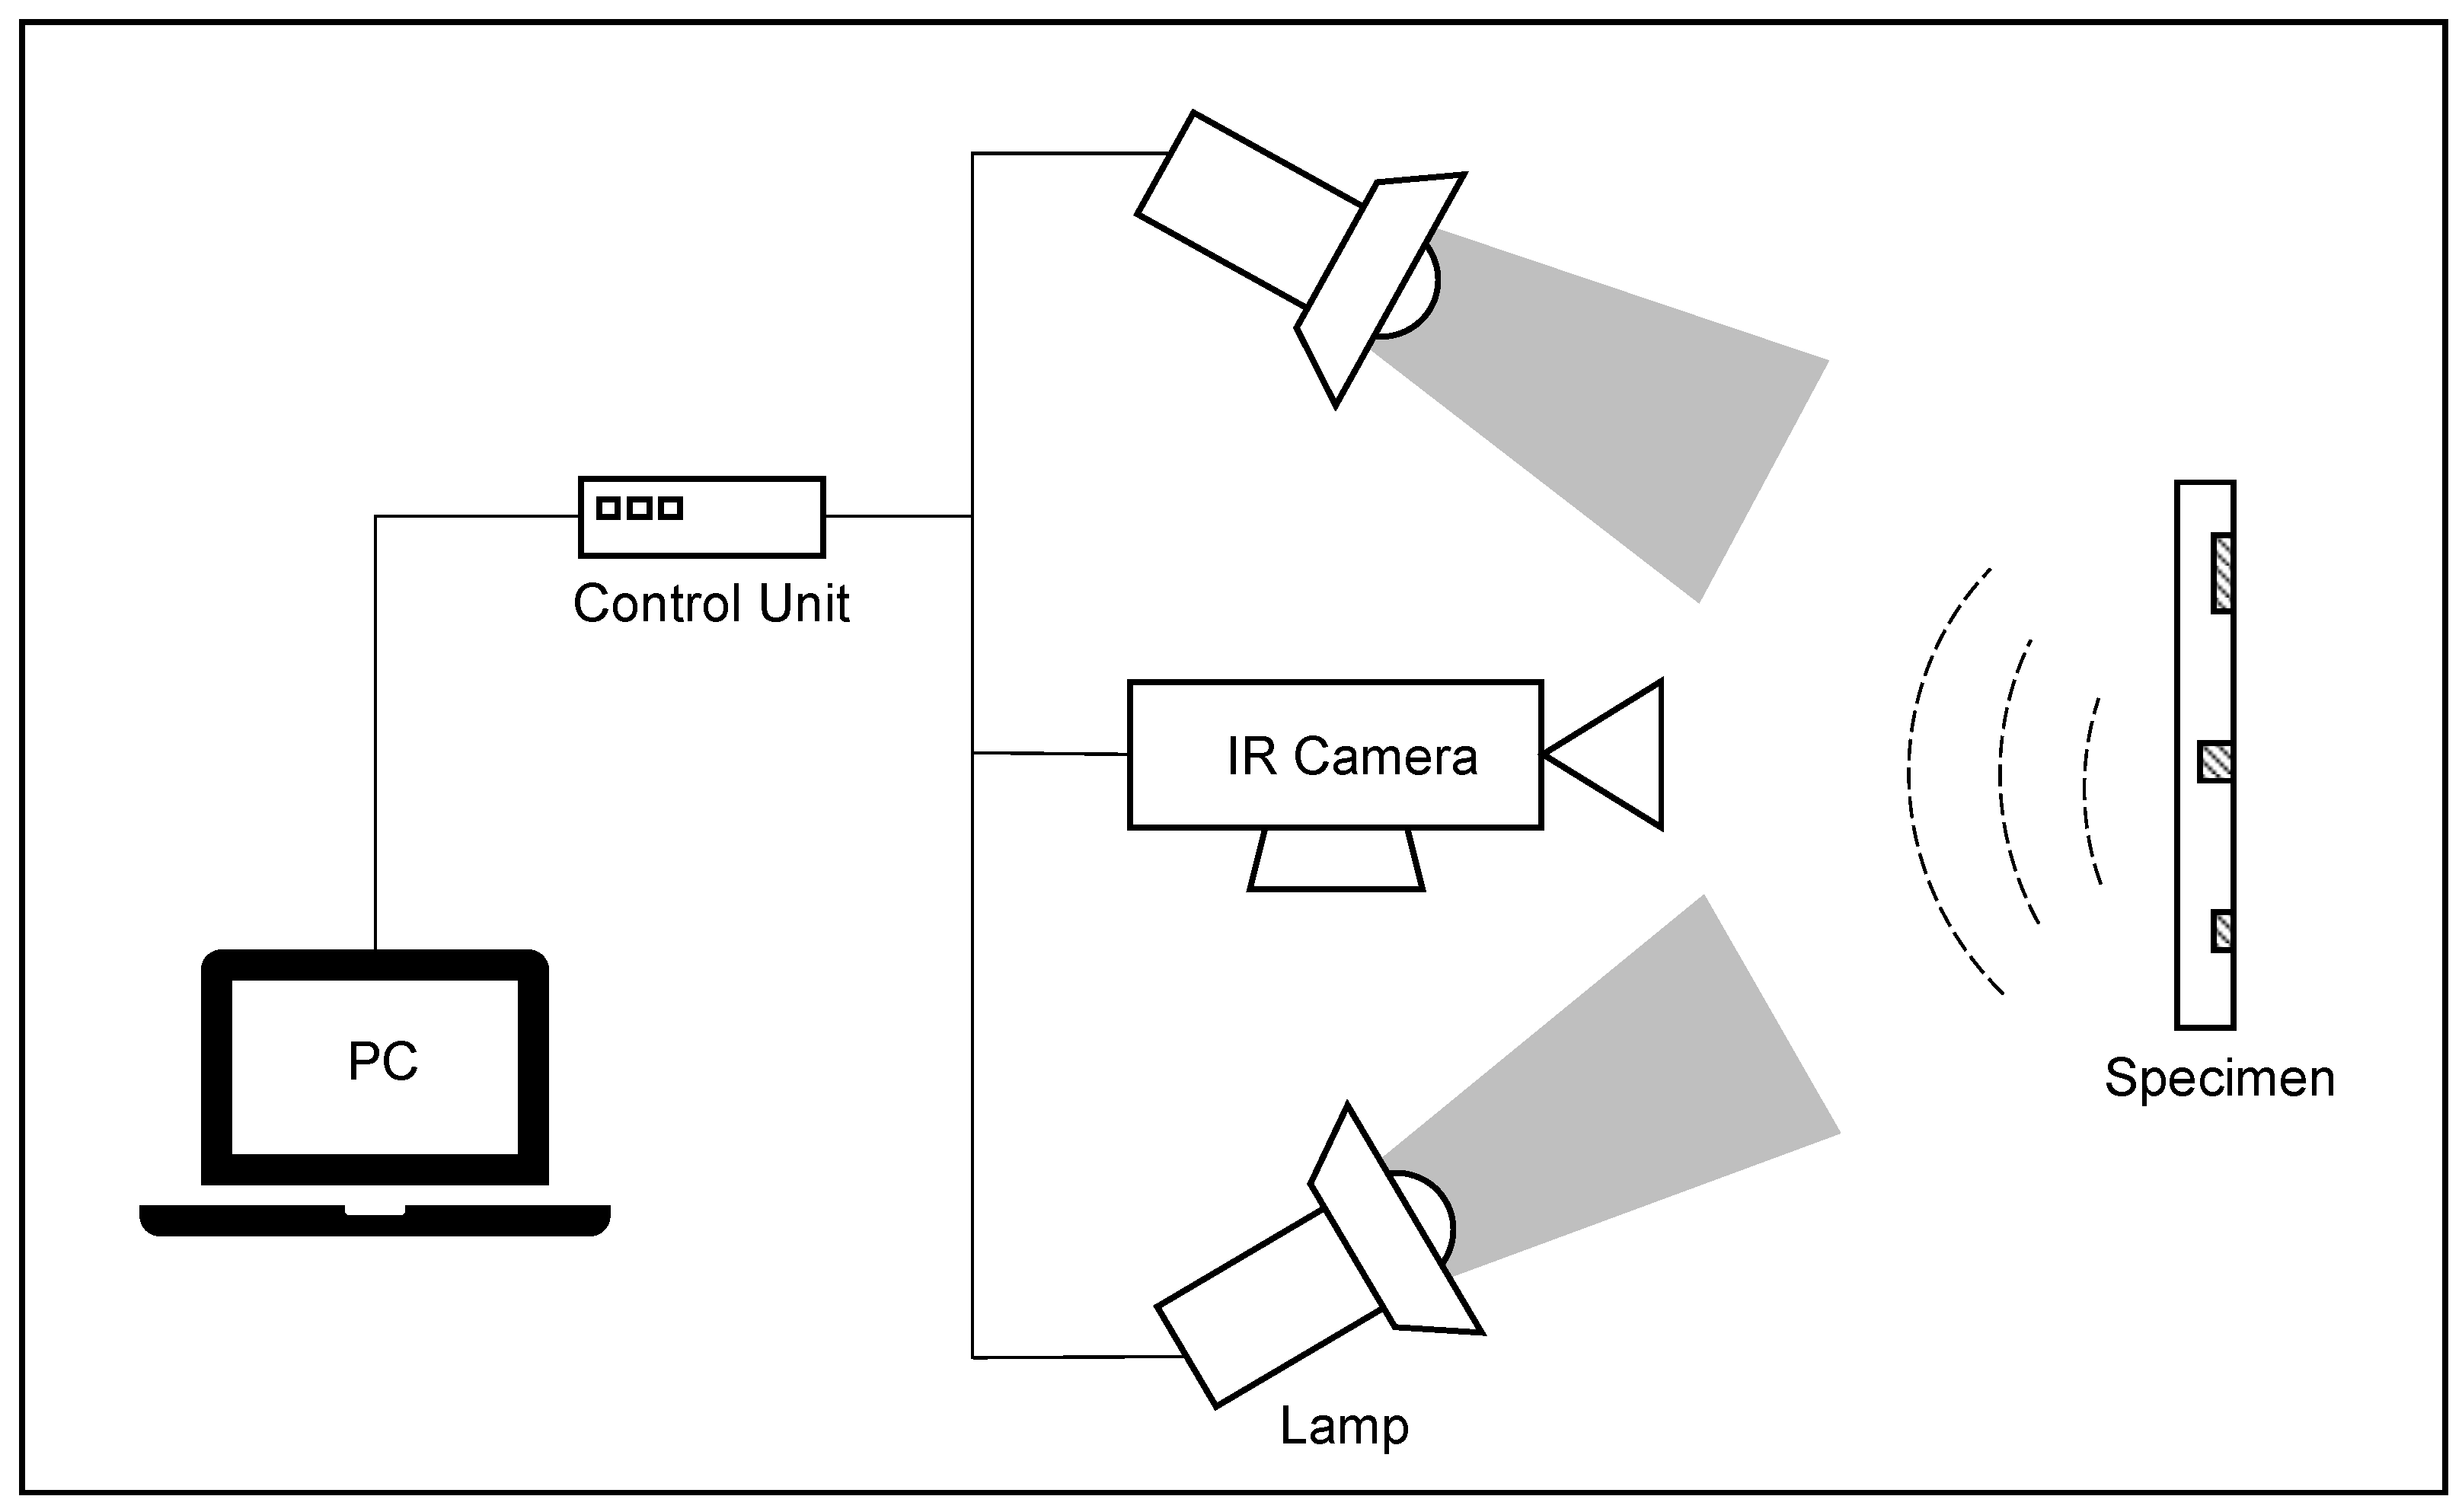
The experimental setup is demonstrated in
Figure 4. The FLIR SC5000 infrared camera and lamps were controlled by a computer through a control unit to ensure synchronization. The recording process began with the trigger signal sent to the camera, which started recording after a pre-defined overall recording time. The lamps were then triggered to flash. In this experiment, two Broncolor lamps with a power of 6.4 KJ were used as heat sources for warming the specimens. The camera captured the infrared video with a resolution of 320 × 256 and recorded it for 181 seconds at 10 Hz, resulting in a video with a dimension of 320 × 256 × 1810 for each measurement.
3.2. Pulsed Phase Thermography
Pulsed Phase Thermography (PPT) is a thermal image sequence processing that is proposed in [
38,
39]. The method involves the calculation of the phase of a thermal image sequence using a Discrete Fourier Transform (DFT). The DFT of a pixel value
at image frame
n is calculated as:
where
and
denote the real and imaginary parts of the DFT, respectively. The phase
and amplitude
of the DFT can be calculated using:
Phase images of DFT results typically exhibit better contrast of abnormal regions, making them a preferred choice for further analysis. Usually, the initial 5 to 10 phase images provide an adequate representation of the raw thermal image sequence.
3.3. Principal Component Thermography
Principal Component Thermography (PCT) is introduced in [
40]. This method applies Singular Value Decomposition (SVD) to the thermal image sequences. The 3D thermal video, with dimensions
, is first reshaped to
by a raster-like operation. The SVD of the reshaped raw data matrix
X is then performed using:
where X is the
raw data matrix.
U is a
matrix.
is a
matrix, and
is the transpose of an
matrix. When matrix A is arranged so that its columns contain time variations and its rows contain spatial variations, the columns of matrix U contain the Empirical Orthogonal Functions (EOFs). Typically, only the first few EOFs are used for further analysis.
3.4. PPT and PCT Images
Figure 5 shows the PPT images and PCT images for four specimens. The CAD images of these specimens are presented in
Figure 2. However, the images in
Figure 2 are horizontally flipped in comparison to the images in
Figure 5, as the former shows a bottom view while the latter exhibits a top view. It is noteworthy that, qualitatively, the majority of defects are clearly identifiable in both PPT and PCT images, with good contrast. However, certain defects exhibit better contrast in PCT images than in PPT images, as indicated by the green arrows in
Figure 5. Thus, PCT images are utilized for data labeling.
3.5. Data Labeling
The data labeling process is conducted manually on PCT images. The first 10 PCT images (EoFs) are visually inspected to identify the one with the best contrast of the defects. Manual labeling is then performed by placing circles on the selected PCT image. The labels are considered reliable as all defects are known and can be directly validated by viewing the bottom side of the specimens.
4. Experiments with Deep Models for Defect Segmentation
4.1. U-Net
Introduced in [
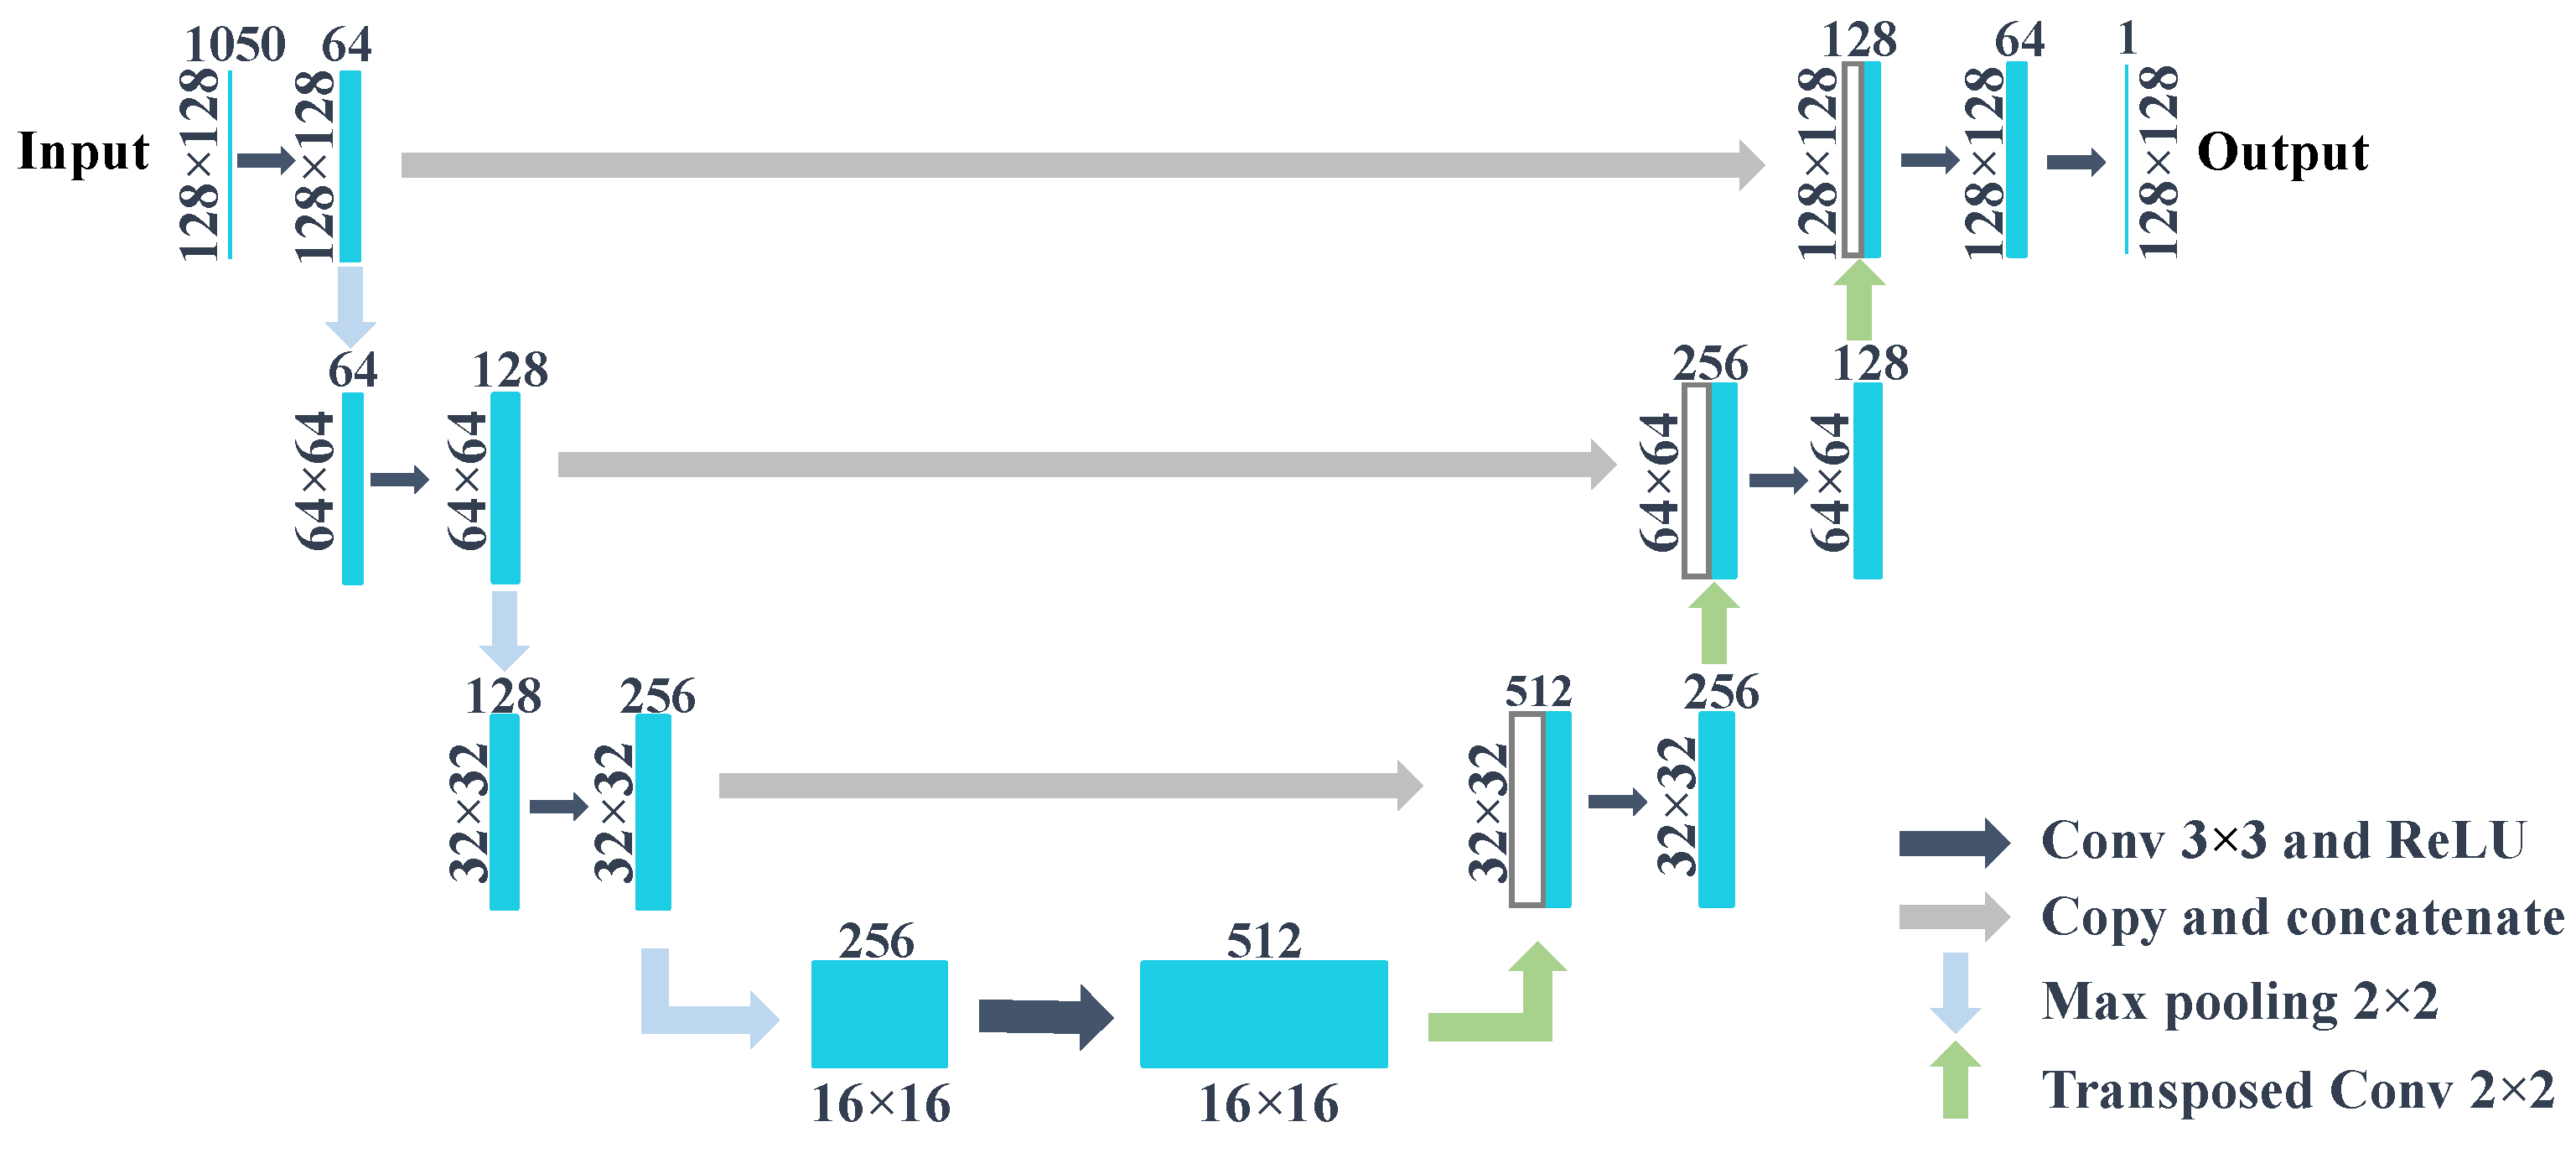
7], U-Net is a popular and effective neural network approach for biomedical image segmentation. It is composed of two key components: the encoding stage and the decoding stage. The encoding stage involves several consecutive blocks of convolutional neural network operations, each followed by a max pooling operation. The decoding stage is comprised of an equal number of transposed convolution blocks to upsample the output back to the same dimensions as the input data. Importantly, U-Net also includes skip connections, which facilitate the transfer of high-resolution information from the encoding stage to the decoding stage by performing copy and concatenation of feature maps. In this work, we employ a lightweight version of U-Net, with a single convolutional layer used as an operation block, as shown in
Figure 6.
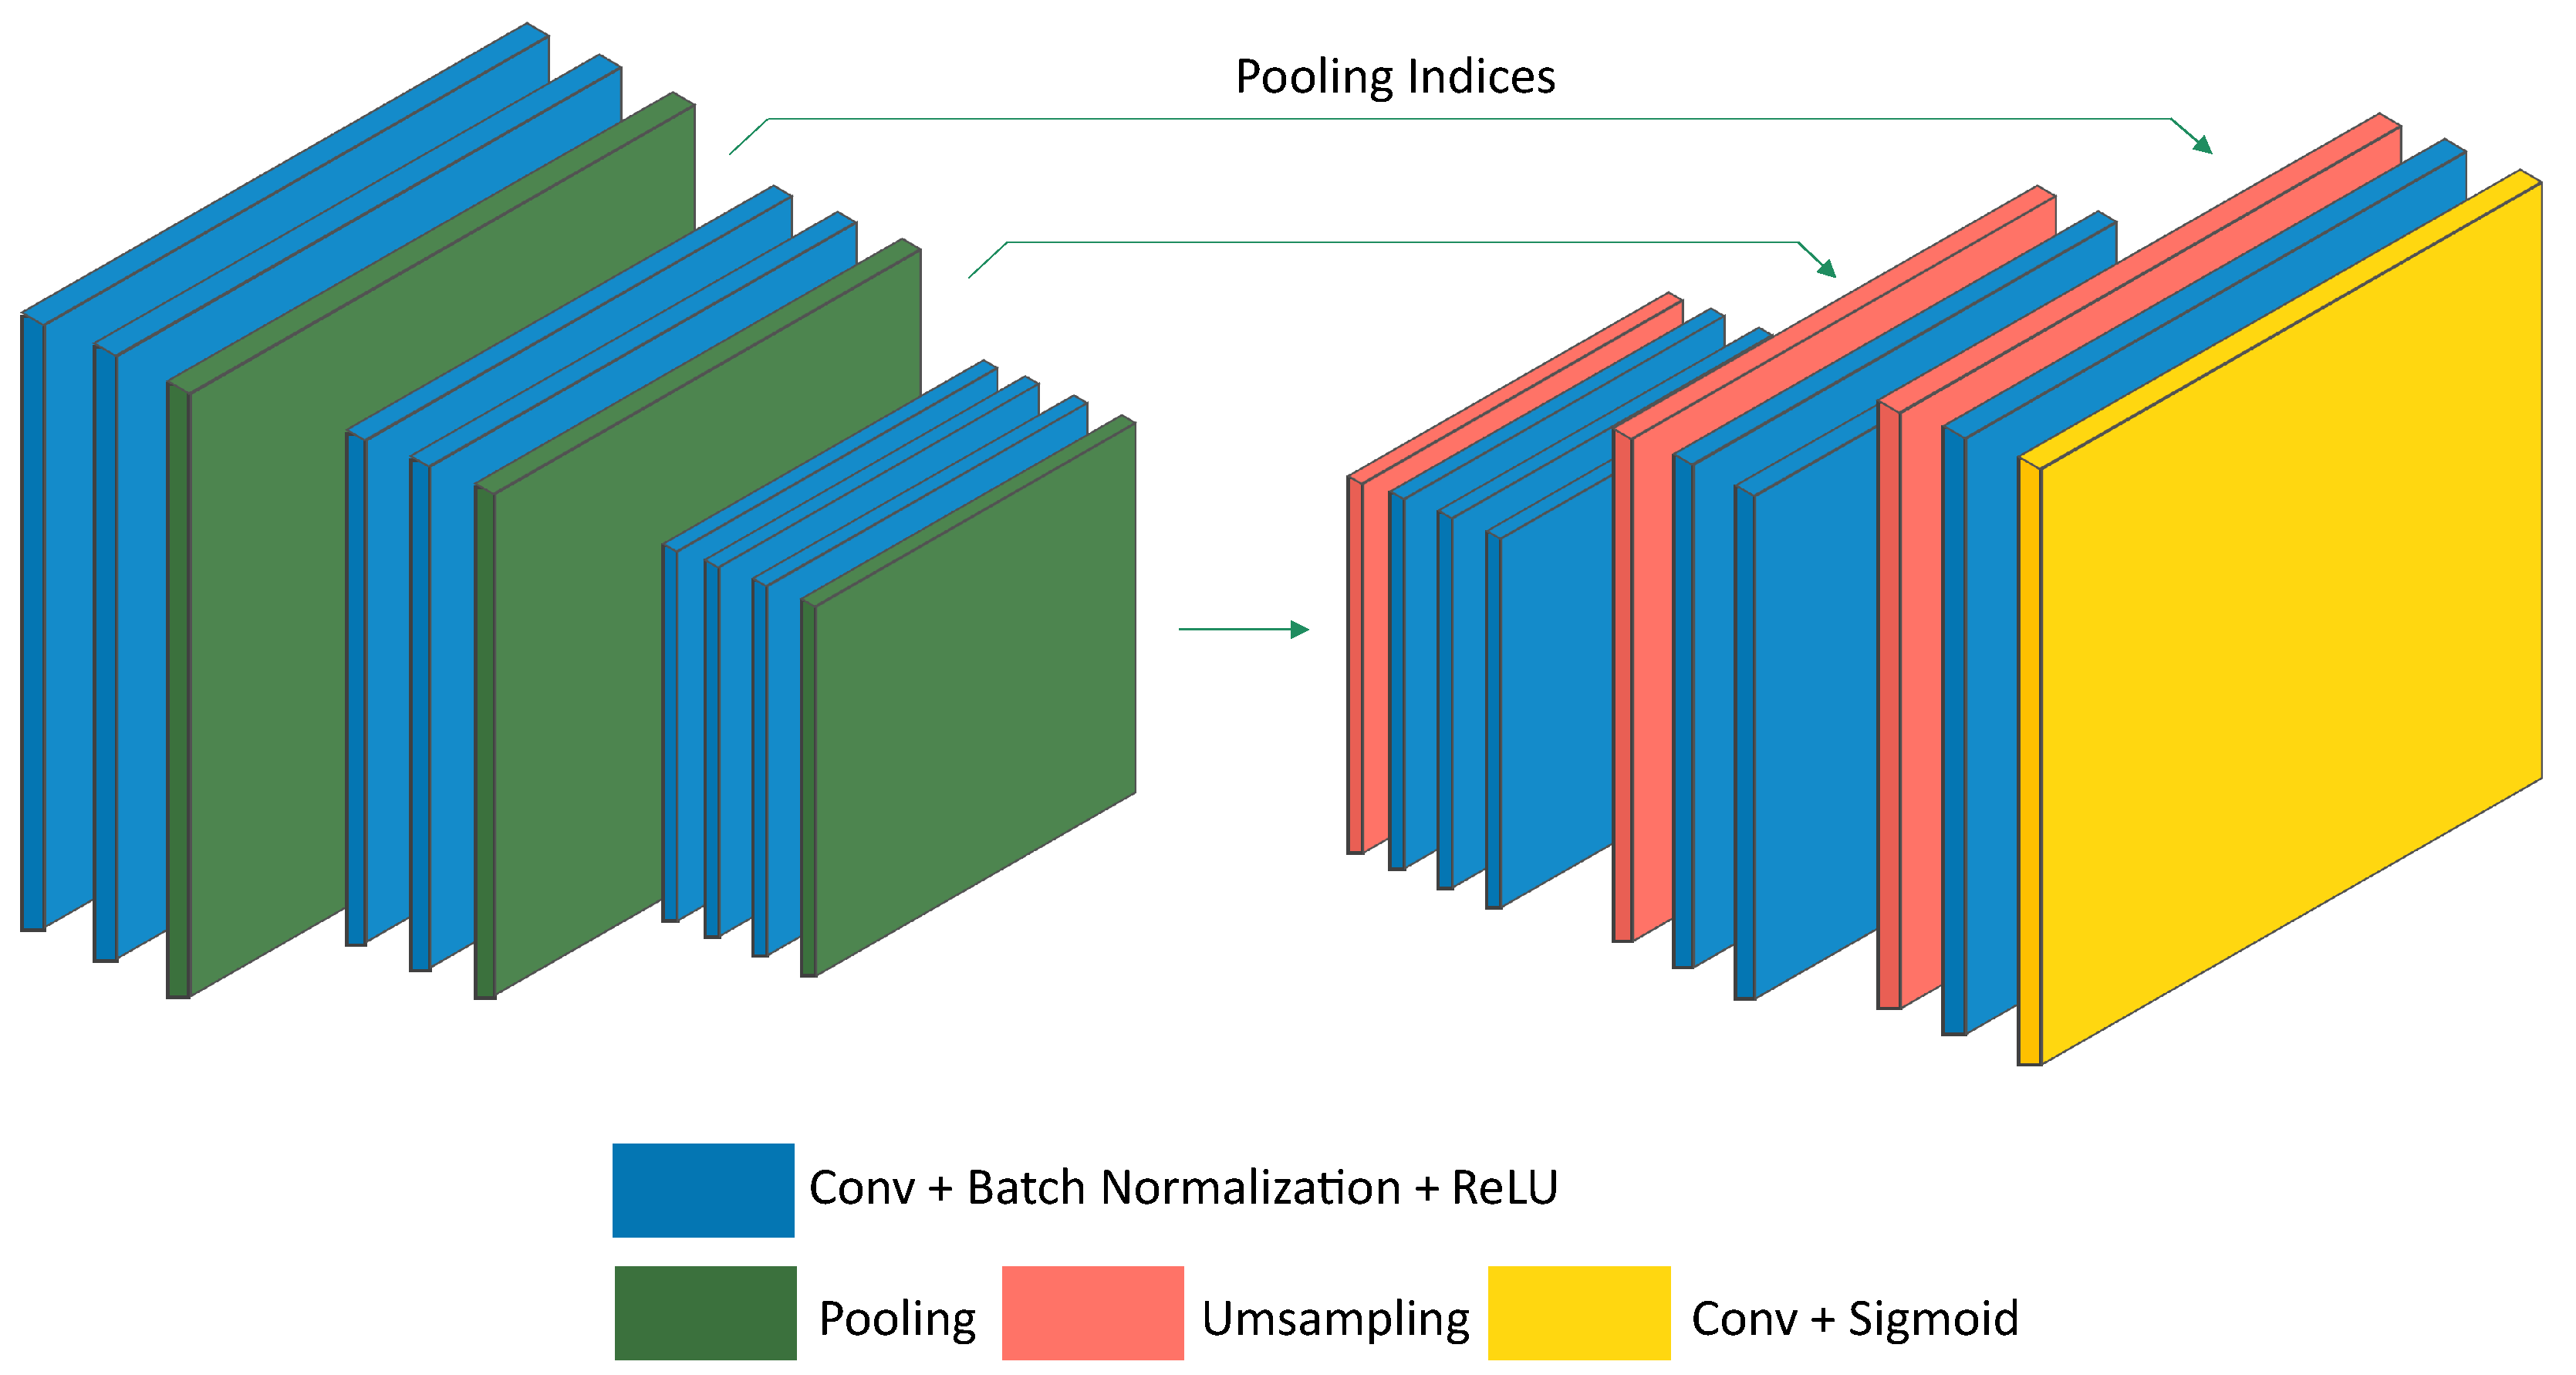
4.2. SegNet
SegNet, proposed in [
9], is similar to the U-Net architecture, which has encoding and decoding stages. The main difference is that, in SegNet, only the locations where max pooling is performed, which can also be referred to as pooling indices, are copied and used for upsampling to the decoding stage at the skip connection instead of copying the entire feature map from the encoding stage. Compared to the original SegNet, we have employed fewer steps both at the encoding and decoding stages. The model architecture used is illustrated in
Figure 7.
4.3. Model Pre-Training
To improve the performance of the encoder-decoder model in processing thermal images, pre-trained models such as VGG Net [
2] or ResNet [
3], which have been trained on optical images, can be used as encoders due to their well-designed network architecture. However, as thermal images often have many more image channels than the standard three-channel RGB images typically used in these pre-trained models, they cannot be directly applied to thermal imaging data.
To address this issue, we modified the parameters in the first layer of the pre-trained models to adapt them to the thermal imaging data by calculating new weights using the following formula:
Here, represents the weights of the neurons in the ith channel of the network’s first layer, with C being the original channel number (3 for RGB images). represents the new channel number, which in our case is 1000. The new weights, , are calculated by summing the weights of the original channels and dividing by the new channel number. This allowed us to utilize pre-trained VGG11 models on the ImageNet dataset to process our thermal imaging data.
4.4. Experiments on the Original Dataset
In this study, the data are divided into three distinct sets: training, validation, and test. The training set consisted of 13 measurements, while the validation and test sets comprised of three measurements each. To evaluate the impact of pre-training on performance, several models are employed, including modified versions of U-Net and SegNet, as well as U-Net and SegNet models that utilized a VGG11 encoder backbone [
41].
Stochastic gradient descent (SGD) is employed as the optimizer for training the models, which are trained for 3000 epochs. The loss function used in this study is binary cross-entropy, calculated according to the formula:
where
is the model’s binary classification prediction,
is the model’s prediction of the probability, and
N represents the number of samples.
The quantitative results of the models’ performance on the original test set are presented in
Table 1. The evaluation metric used is Intersection over Union (IoU), and the average IoU is calculated for the three test samples. U-Net with a VGG11 encoder achieves the highest average IoU of 0.722. Interestingly, U-Net with a pre-trained VGG11 encoder produces comparable results, suggesting that pre-training does not significantly affect performance. To provide visual insight into the models’ performance,
Figure 8 displays sample segmentations obtained by U-Net and SegNet. Both models produce satisfactory segmentations of the defects, with SegNet tending to classify more pixels as foreground than U-Net. Finally, the processing speed of the models is evaluated. The results indicate that they are relatively slow, achieving 1–2 frames per second (FPS) on a machine with two Intel Xeon E5-2630 v4 @ 2.20GHz CPUs. This suggests that the models may not be suitable for industrial deployment where faster processing speeds are often required.
4.5. Efficient Data Segmentation Methods
The use of deep learning models is motivated by their ability to extract features effectively. Thus, it is reasonable to apply them directly to raw data. However, PT data are often substantial in size, consuming a significant amount of computational resources, and making industrial deployment challenging. To address this issue, we will explore two strategies for reducing the size of PT data in this section.
4.5.1. Experiment with PPT and PCT Images
Manually inspecting a large number of frames in each PT measurement can be labor-intensive and tedious. To mitigate this issue, PPT, PCT, and TSR are often applied to extract the most relevant information from the original PT data and generate a more concise representation, thus reducing the number of images that need to be inspected. This highlights the potential of these methods as effective data preprocessing techniques to decrease the size of the training data for deep learning models, which in turn reduces the computational cost required for training. In our study, the first 10 images generated by PCT and PPT are selected as the training data.
We evaluate the performance of two models on the PPT and PCT images, using the Adam optimizer [
42] and consistent hyperparameters as described in
Section 4.4. The results are summarized in
Table 2. Additionally, the models processed the PPT and PCT images approximately three times faster than the models for the original PT data.
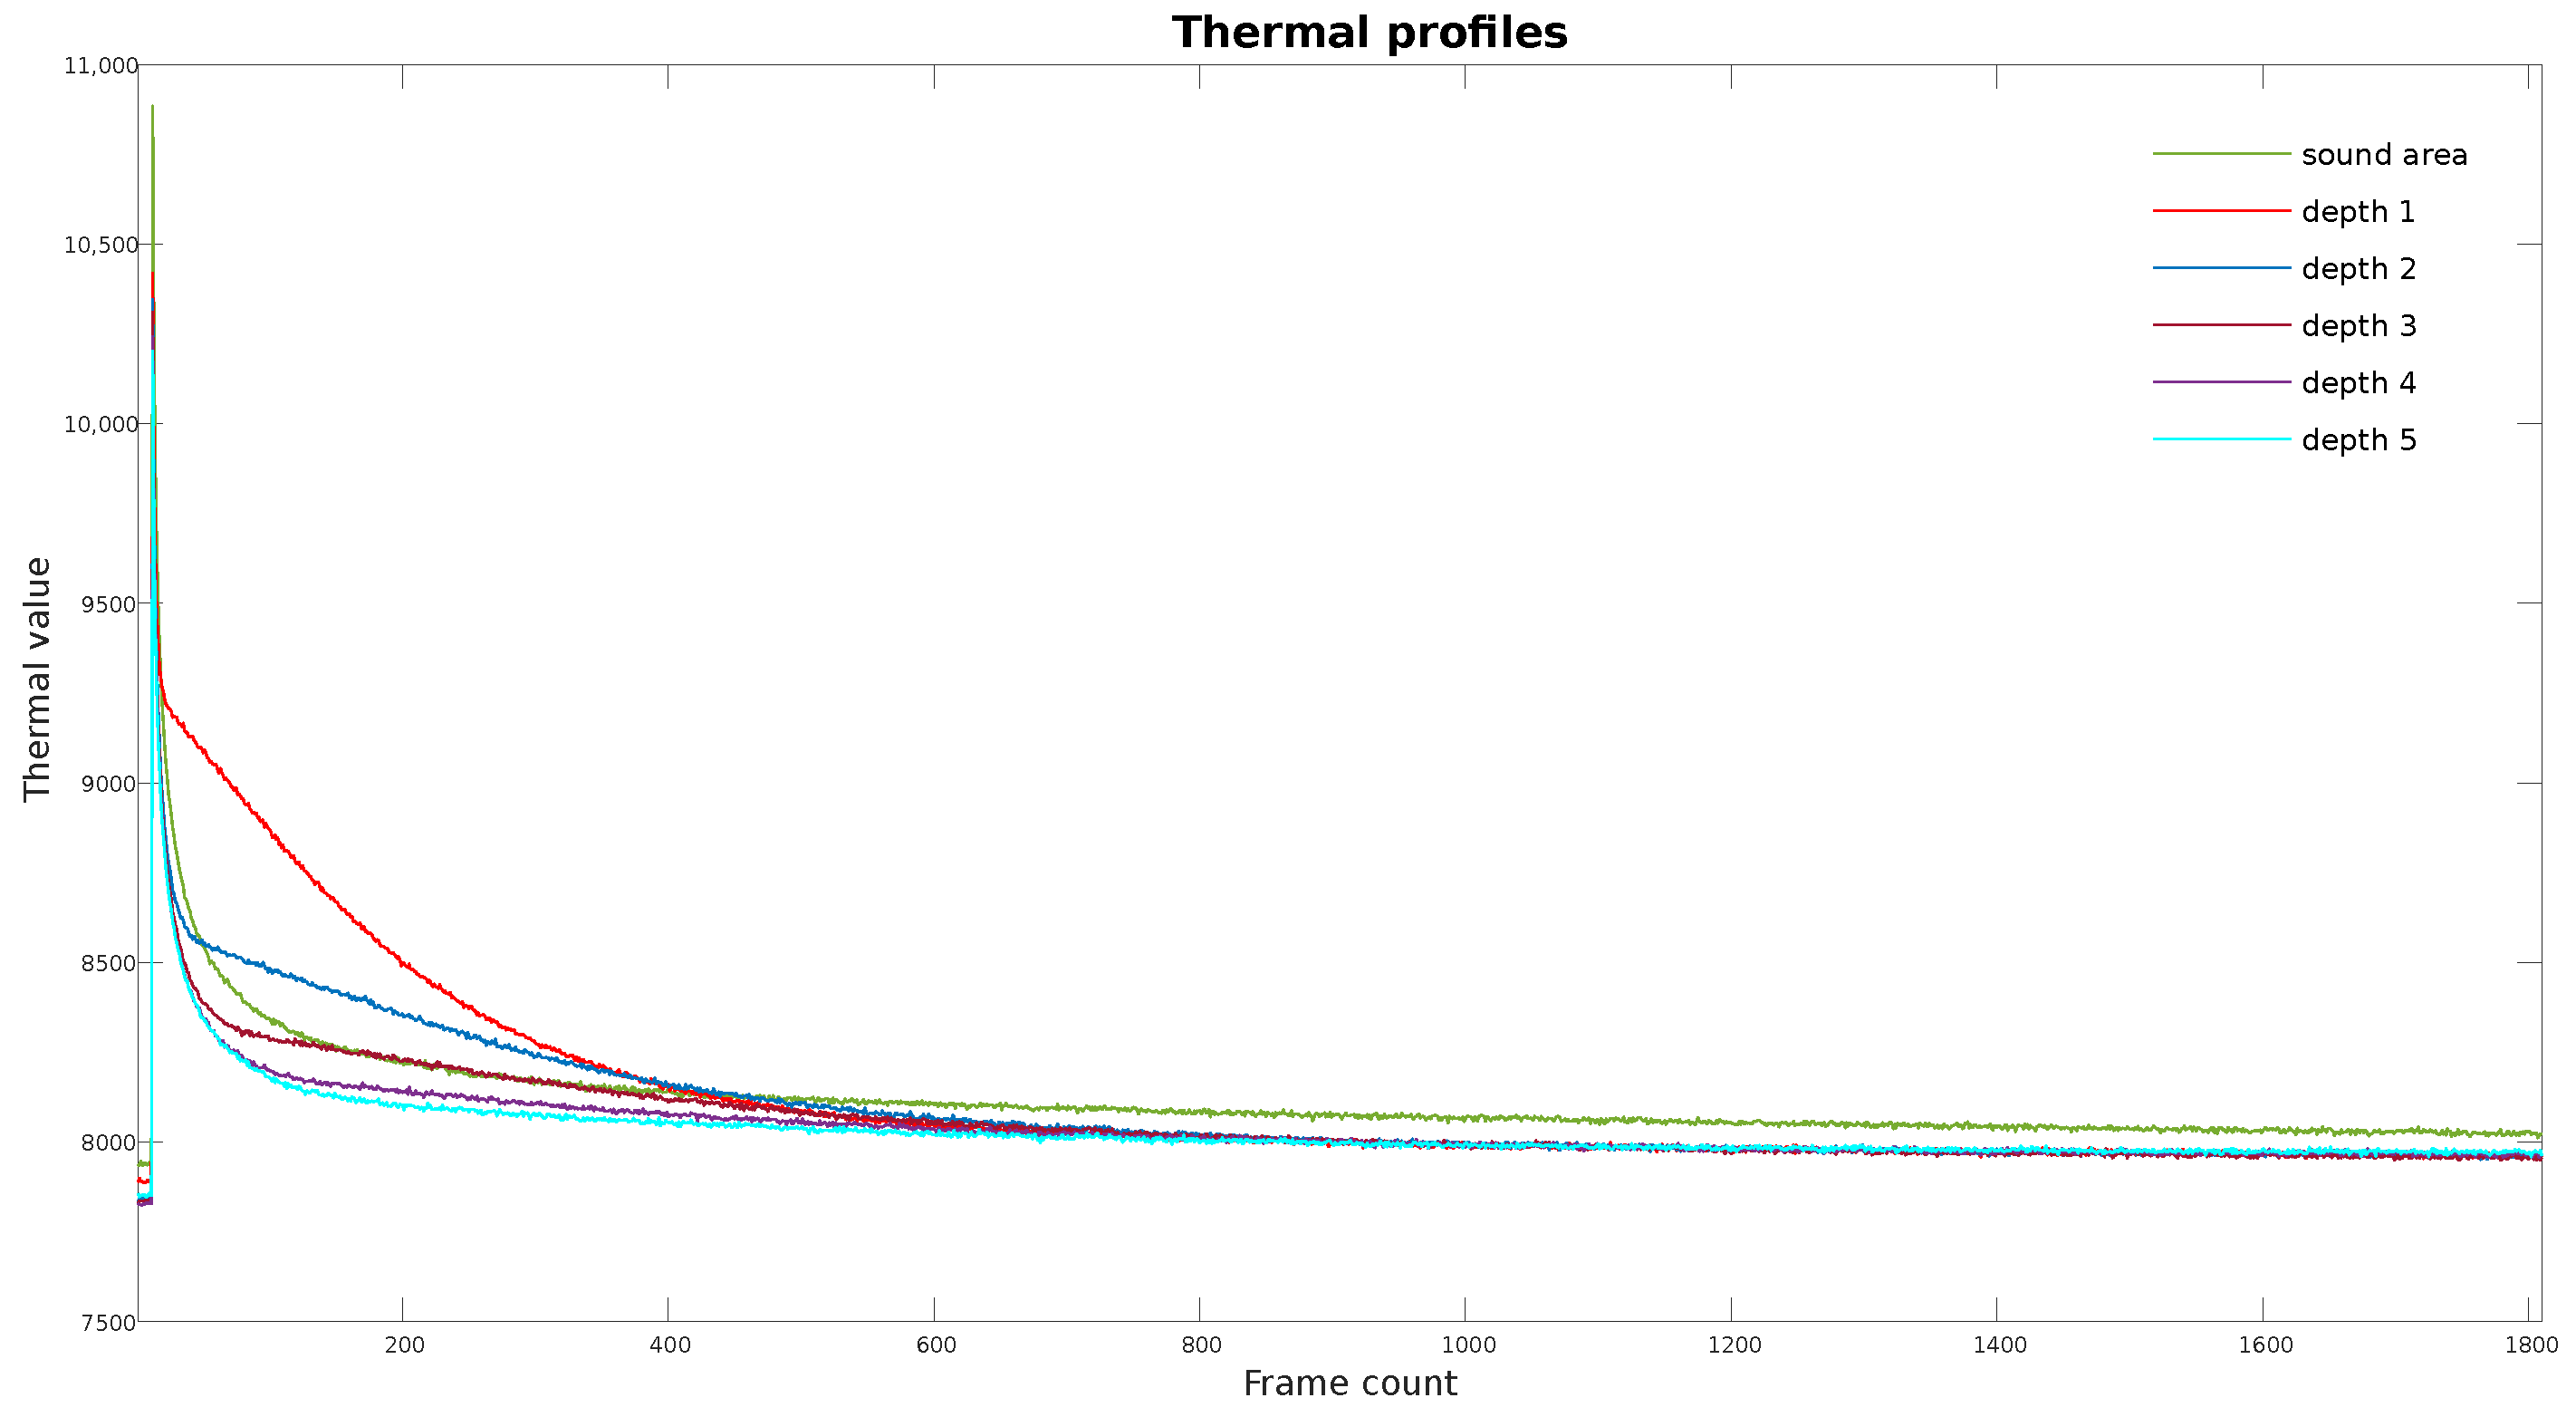
4.5.2. Experiment with Fewer Thermal Frames
The thermal profiles of six different areas, one sound and five defective, are compared in
Figure 9. The results demonstrate that the majority of the thermal value difference occurs in the early stage. Hence, using only the initial portion of the thermal sequence as input data may prove to be an effective approach for deep learning models to detect defects.
To assess the impact of the number of frames on the model performance, the Average Intersection over Union (IoU) metric is used on the validation dataset. The results of the experiment, as shown in
Table 3, highlight that the best performance is obtained with the use of the initial 200 frames of the thermal measurement. This suggests that the majority of the relevant information lies within the early stages, and that including additional trailing frames may not contribute significantly to the defect evaluation. The training hyperparameters are kept consistent with those used in
Section 4.4. Additionally, using 140 or 200 frames resulted in faster processing times, with the models running two to three times faster compared to the original dataset.
5. Discussion
The advancement of applied AI heavily relies on the availability of quality datasets. Despite this, public datasets in the NDE field are scarce due to difficulties in data acquisition. To address this, we present a dataset for the training of deep learning models in the field of NDE. The dataset comprises of 19 measurements collected from 19 PVC specimens with artificially introduced defects.
Unlike common NDE datasets that contain completely hidden defects, the defects in our dataset are visible from the bottom side, allowing for accurate and easy labeling. Our dataset is larger than many NDE datasets used for AI applications, for example, the dataset used in [
18], which contains fewer than 10 specimens. A larger dataset can help reduce the risk of overfitting in deep learning models.
Experiments are conducted using several deep encoder-decoder models for defect segmentation on the original dataset. The results indicate that the U-Net VGG11 model, without the use of pre-trained parameters, outperforms other models. The results also suggest that the use of a pre-trained model does not necessarily improve model performance, as observed in both U-Net and SegNet models. Incorporating VGG11 as the encoder backbone of the U-Net model improves its performance significantly, which is not the case for SegNet.
The results in
Table 2 demonstrate that PT data transformation methods, such as PCT and PPT, can effectively reduce the PT data size without sacrificing the performance of the models. Furthermore, the thermal profiles reveal that the most significant difference in thermal values between sound and defective areas occurs early in the measurement process. This issue is further explored by using only the leading frames as training data, where the results show that the model’s performance barely decreased. Models that use only 200 frames even performed better than those that use the entire dataset, suggesting that a significant portion of the raw thermal images contains redundant information.
The study has some limitations. Firstly, it does not consider the defects’ depth information, which is essential for some applications. Secondly, the models are only tested on defects of a single shape, and it would be valuable to evaluate their ability to detect defects of various shapes. Lastly, the dataset only contains one type of material, PVC. However, the proposed methods have the potential to apply to other materials, such as CFRP and steel, provided that the defects are visible within PT data. Despite these limitations, the study provides a valuable contribution to the development of AI-based methods for defect detection in PT data. The dataset and the results can serve as a benchmark for future research in this area.
6. Conclusions
In this study, we introduce the PVC-Infrared dataset, a dataset designed specifically for the detection of defects using PT as an NDE method. The purpose of this dataset is to further advance the research in this field and contribute to the growth of deep learning technologies. We have performed experiments with various deep learning models, including U-Net, SegNet, and their variants with a VGG network as a backbone. These experiments are conducted on both the original dataset and on transformed datasets that are processed using PPT and PCT techniques. Additionally, we have explored the impact of using only the leading thermal frames of the PT measurement. The results show that utilizing fewer frames can lead to comparable or even better performance compared to using the entire dataset. It opens up opportunities for improving the efficiency of deep learning methods for PT data processing in industrial settings. In future research, it is important to consider the depth information of defects and evaluate the effectiveness of AI models on PT datasets with defects of varying shapes. Additionally, the exploration of different frame selection methods can lead to improvements in the efficiency of defect segmentation models. By considering these factors, further research can enhance the accuracy and robustness of AI models for defect detection in PT data.
Author Contributions
Z.W.: methodology, data labeling, training the models and original drafting of the manuscript. A.O.: supervision, expertise in AI, manuscript review and editing. B.V.: supervision, funding acquisition, manuscript review and editing. X.M.: supervision, manuscript review and editing. All authors have read and agreed to the published version of the manuscript.
Funding
This research was supported by the European Regional Development Fund (ERDF).
Data Availability Statement
The PT dataset used in the paper can be accessed via the URL
https://www.kaggle.com/datasets/ziangwei/irtpvc (accessed on 23 February 2023). The dataset is available for academic and research use only. Papers using this dataset are kindly requested to refer to this paper.
Acknowledgments
Support from Fraunhofer IZFP is gratefully acknowledged. David Müller is acknowledged for the design and preparation of the test specimen used in the paper within their research on the evaluation of deep learning approaches for quantitative defect testing and reconstruction with thermography. Udo Netzelmann is acknowledged for providing advice for the experimental setup.
Conflicts of Interest
The authors declare no conflict of interest.
Abbreviations
The following abbreviations are used in this manuscript:
| AI | Artificial Intelligence |
| PT | Pulsed Thermography |
| PPT | Pulsed Phase Thermography |
| PCT | Principal component Thermography |
| TSR | Thermographic Signal Reconstruction |
| NDE | Nondestructive Evaluation |
| IoU | Intersection over Union |
| CFRP | Carbon Fiber Reinforced Polymers |
References
- Krizhevsky, A.; Sutskever, I.; Hinton, G.E. Imagenet classification with deep convolutional neural networks. Commun. ACM 2017, 60, 84–90. [Google Scholar] [CrossRef]
- Simonyan, K.; Zisserman, A. Very deep convolutional networks for large-scale image recognition. arXiv 2014, arXiv:1409.1556. [Google Scholar]
- He, K.; Zhang, X.; Ren, S.; Sun, J. Deep residual learning for image recognition. In Proceedings of the IEEE Conference on Computer Vision and Pattern Recognition, Las Vegas, NV, USA, 26 June–1 July 2016; pp. 770–778. [Google Scholar]
- Girshick, R.; Donahue, J.; Darrell, T.; Malik, J. Rich feature hierarchies for accurate object detection and semantic segmentation. In Proceedings of the IEEE Conference on Computer Vision and Pattern Recognition, Columbus, OH, USA, 23–28 June 2014; pp. 580–587. [Google Scholar]
- Girshick, R. Fast r-cnn. In Proceedings of the IEEE International Conference on Computer Vision, Santiago, Chile, 7–13 December 2015; pp. 1440–1448. [Google Scholar]
- Bochkovskiy, A.; Wang, C.Y.; Liao, H.Y.M. Yolov4: Optimal speed and accuracy of object detection. arXiv 2020, arXiv:2004.10934. [Google Scholar]
- Ronneberger, O.; Fischer, P.; Brox, T. U-net: Convolutional networks for biomedical image segmentation. In Proceedings of the International Conference on Medical Image Computing and Computer-Assisted Intervention, Munich, Germany, 5–9 October 2015; pp. 234–241. [Google Scholar]
- Zhao, H.; Shi, J.; Qi, X.; Wang, X.; Jia, J. Pyramid scene parsing network. In Proceedings of the IEEE Conference on Computer Vision and Pattern Recognition, Honolulu, HI, USA, 21–26 July 2017; pp. 2881–2890. [Google Scholar]
- Badrinarayanan, V.; Kendall, A.; Cipolla, R. Segnet: A deep convolutional encoder-decoder architecture for image segmentation. IEEE Trans. Pattern Anal. Mach. Intell. 2017, 39, 2481–2495. [Google Scholar] [CrossRef]
- Karpathy, A.; Toderici, G.; Shetty, S.; Leung, T.; Sukthankar, R.; Fei-Fei, L. Large-scale video classification with convolutional neural networks. In Proceedings of the IEEE conference on Computer Vision and Pattern Recognition, Columbus, OH, USA, 23–28 June 2014; pp. 1725–1732. [Google Scholar]
- Wang, X.; Girshick, R.; Gupta, A.; He, K. Non-local neural networks. In Proceedings of the IEEE Conference on Computer Vision and Pattern Recognition, Salt Lake City, UT, USA, 18–23 June 2018; pp. 7794–7803. [Google Scholar]
- Deng, J.; Dong, W.; Socher, R.; Li, L.J.; Li, K.; Fei-Fei, L. Imagenet: A large-scale hierarchical image database. In Proceedings of the 2009 IEEE Conference on Computer Vision and Pattern Recognition, Miami, FL, USA, 20–25 June 2009; pp. 248–255. [Google Scholar]
- Everingham, M.; Van Gool, L.; Williams, C.K.; Winn, J.; Zisserman, A. The pascal visual object classes (voc) challenge. Int. J. Comput. Vis. 2010, 88, 303–338. [Google Scholar] [CrossRef]
- Lin, T.Y.; Maire, M.; Belongie, S.; Hays, J.; Perona, P.; Ramanan, D.; Dollár, P.; Zitnick, C.L. Microsoft coco: Common objects in context. In Proceedings of the European Conference on Computer Vision, Zurich, Switzerland, 6–12 September 2014; pp. 740–755. [Google Scholar]
- Cordts, M.; Omran, M.; Ramos, S.; Rehfeld, T.; Enzweiler, M.; Benenson, R.; Franke, U.; Roth, S.; Schiele, B. The cityscapes dataset for semantic urban scene understanding. In Proceedings of the IEEE Conference on Computer Vision and Pattern Recognition, Las Vegas, NV, USA, 27–30 June 2016; pp. 3213–3223. [Google Scholar]
- Zhou, B.; Zhao, H.; Puig, X.; Fidler, S.; Barriuso, A.; Torralba, A. Scene parsing through ade20k dataset. In Proceedings of the IEEE Conference on Computer Vision and Pattern Recognition, Honolulu, HI, USA, 21–26 July 2017; pp. 633–641. [Google Scholar]
- Chakravarthy, A.D.; Bonthu, S.; Chen, Z.; Zhu, Q. Predictive models with resampling: A comparative study of machine learning algorithms and their performances on handling imbalanced datasets. In Proceedings of the 2019 18th IEEE International Conference On Machine Learning Furthermore, Applications (ICMLA), Boca Raton, FL, USA, 16–19 September 2019; pp. 1492–1495. [Google Scholar]
- Wei, Z.; Osman, A.; Gross, D.; Netzelmann, U. Artificial intelligence for defect detection in infrared images of solid oxide fuel cells. Infrared Phys. Technol. 2021, 119, 103815. [Google Scholar] [CrossRef]
- Wei, Z.; Fernandes, H.; Herrmann, H.G.; Tarpani, J.R.; Osman, A. A deep learning method for the impact damage segmentation of curve-shaped cfrp specimens inspected by infrared thermography. Sensors 2021, 21, 395. [Google Scholar] [CrossRef] [PubMed]
- Fang, Q.; Ibarra-Castanedo, C.; Maldague, X. Automatic defects segmentation and identification by deep learning algorithm with pulsed thermography: Synthetic and experimental data. Big Data Cogn. Comput. 2021, 5, 9. [Google Scholar] [CrossRef]
- Chung, Y.; Lee, S.; Kim, W. Latest advances in common signal processing of pulsed thermography for enhanced detectability: A review. Appl. Sci. 2021, 11, 12168. [Google Scholar] [CrossRef]
- Fleuret, J.R.; Ebrahimi, S.; Ibarra-Castanedo, C.; Maldague, X.P. Independent component analysis applied on pulsed thermographic data for carbon fiber reinforced plastic inspection: A comparative study. Appl. Sci. 2021, 11, 4377. [Google Scholar] [CrossRef]
- Ibarra-Castanedo, C.; Genest, M.; Servais, P.; Maldague, X.P.; Bendada, A. Qualitative and quantitative assessment of aerospace structures by pulsed thermography. Nondestruct. Test. Eval. 2007, 22, 199–215. [Google Scholar] [CrossRef]
- Jensen, F.; Terlau, M.; Sorg, M.; Fischer, A. Active Thermography for the Detection of Sub-Surface Defects on a Curved and Coated GFRP-Structure. Appl. Sci. 2021, 11, 9545. [Google Scholar] [CrossRef]
- Verspeek, S.; Ribbens, B.; Maldague, X.; Steenackers, G. Spot Weld Inspections Using Active Thermography. Appl. Sci. 2022, 12, 5668. [Google Scholar] [CrossRef]
- Yao, Y.; Sfarra, S.; Lagüela, S.; Ibarra-Castanedo, C.; Wu, J.Y.; Maldague, X.P.; Ambrosini, D. Active thermography testing and data analysis for the state of conservation of panel paintings. Int. J. Therm. Sci. 2018, 126, 143–151. [Google Scholar] [CrossRef]
- Bang, H.T.; Park, S.; Jeon, H. Defect identification in composite materials via thermography and deep learning techniques. Compos. Struct. 2020, 246, 112405. [Google Scholar] [CrossRef]
- Luo, Q.; Gao, B.; Woo, W.L.; Yang, Y. Temporal and spatial deep learning network for infrared thermal defect detection. Ndt Int. 2019, 108, 102164. [Google Scholar] [CrossRef]
- Alhammad, M.; Avdelidis, N.; Ibarra-Castanedo, C.; Torbali, M.; Genest, M.; Zhang, H.; Zolotas, A.; Maldgue, X. Automated Impact Damage Detection Technique for Composites Based on Thermographic Image Processing and Machine Learning Classification. Sensors 2022, 22, 9031. [Google Scholar] [CrossRef]
- Tao, Y.; Hu, C.; Zhang, H.; Osman, A.; Ibarra-Castanedo, C.; Fang, Q.; Sfarra, S.; Dai, X.; Maldague, X.; Duan, Y. Automated Defect Detection in Non-planar Objects Using Deep Learning Algorithms. J. Nondestruct. Eval. 2022, 41, 1–11. [Google Scholar] [CrossRef]
- Duan, Y.; Liu, S.; Hu, C.; Hu, J.; Zhang, H.; Yan, Y.; Tao, N.; Zhang, C.; Maldague, X.; Fang, Q.; et al. Automated defect classification in infrared thermography based on a neural network. Ndt Int. 2019, 107, 102147. [Google Scholar] [CrossRef]
- Liu, K.; Li, Y.; Yang, J.; Liu, Y.; Yao, Y. Generative principal component thermography for enhanced defect detection and analysis. IEEE Trans. Instrum. Meas. 2020, 69, 8261–8269. [Google Scholar] [CrossRef]
- Cheng, L.; Tong, Z.; Xie, S.; Kersemans, M. IRT-GAN: A generative adversarial network with a multi-headed fusion strategy for automated defect detection in composites using infrared thermography. Compos. Struct. 2022, 290, 115543. [Google Scholar] [CrossRef]
- Liu, Q.; He, Z.; Li, X.; Zheng, Y. PTB-TIR: A thermal infrared pedestrian tracking benchmark. IEEE Trans. Multimed. 2019, 22, 666–675. [Google Scholar] [CrossRef]
- Jia, X.; Zhu, C.; Li, M.; Tang, W.; Zhou, W. LLVIP: A visible-infrared paired dataset for low-light vision. In Proceedings of the IEEE/CVF International Conference on Computer Vision, Montreal, BC, Canada, 11–17 October 2021; pp. 3496–3504. [Google Scholar]
- Erazo-Aux, J.; Loaiza-Correa, H.; Restrepo-Giron, A.D.; Ibarra-Castanedo, C.; Maldague, X. Thermal imaging dataset from composite material academic samples inspected by pulsed thermography. Data Brief 2020, 32, 106313. [Google Scholar] [CrossRef] [PubMed]
- Fang, Q.; Ibarra-Castanedo, C.; Maldgue, X. University Laval Infrared Thermography Databases for Deep Learning Multiple Types of Defect Detections Training. Eng. Proc. 2021, 2, 8032. [Google Scholar]
- Maldague, X.; Marinetti, S. Pulse phase infrared thermography. J. Appl. Phys. 1996, 79, 2694–2698. [Google Scholar] [CrossRef]
- Maldague, X.; Largouët, Y.; Couturier, J.P. A study of defect depth using neural networks in pulsed phase thermography: Modelling, noise, experiments. Rev. Générale de Therm. 1998, 37, 704–717. [Google Scholar] [CrossRef]
- Rajic, N. Principal component thermography for flaw contrast enhancement and flaw depth characterisation in composite structures. Compos. Struct. 2002, 58, 521–528. [Google Scholar] [CrossRef]
- Iglovikov, V.; Shvets, A. Ternausnet: U-net with vgg11 encoder pre-trained on imagenet for image segmentation. arXiv 2018, arXiv:1801.05746. [Google Scholar]
- Kingma, D.P.; Ba, J. Adam: A Method for Stochastic Optimization. In Proceedings of the ICLR (Poster), San Diego, CA, USA, 7–9 May 2015. [Google Scholar]
| Disclaimer/Publisher’s Note: The statements, opinions and data contained in all publications are solely those of the individual author(s) and contributor(s) and not of MDPI and/or the editor(s). MDPI and/or the editor(s) disclaim responsibility for any injury to people or property resulting from any ideas, methods, instructions or products referred to in the content. |
© 2023 by the authors. Licensee MDPI, Basel, Switzerland. This article is an open access article distributed under the terms and conditions of the Creative Commons Attribution (CC BY) license (https://creativecommons.org/licenses/by/4.0/).


