1. Introduction
Currently, the indications and limitations of conventional impressions are well documented through decades of in vitro and in vivo trials [
1,
2]. An intraoral scanner (IOS) is used to directly record the structural surface shape of teeth and related structures within a patient’s mouth in order to obtain a digital impression, and laboratory scanners are powerful machines capable of digitizing gypsum models or conventional impressions with a very small deviation in trueness and precision [
3]. However, digital impressions are continually evolving, and there are still several unknowns that require thorough investigation.
The accuracy of an impression, either conventional or digital, is essential for the longevity of the final restoration. The accuracy of a digital impression is determined by assessing two variables that are independent of each other: trueness and precision. The trueness of an IOS determines the ability of rendering a 3D model as closely as possible regarding surface geometry to the real dimensions of the scanned surface. The precision of an IOS dictates the reproducibility of a scan and, therefore, the predictability of a scan [
4,
5].
Several factors have been identified to have an influence on the accuracy of a digital impression. Ambiental lighting conditions can generate artefacts on the 3D model by oversaturating the scanned surfaces [
6,
7,
8], the presence of liquid alters the reflective properties of intraoral structures [
9], and the scanning patterns may lead to over scans with an increased chance of mesh stitching errors [
10,
11]. Additionally, the experience of the operator, the calibration of the IOS, and the extension of the scanned surface have been shown to have an impact on the final accuracy of a digital model [
12,
13,
14], alongside the scanning distance [
15] and the model and generation of the IOS which must be taken into account [
16].
While in vitro scanning is in general easier to perform by following the recommended scanning protocol, in an in vivo scenario there are intraoral structures such as the buccal mucosa and the tongue that may impede the positioning of the scanning tip. The latest scanners provide fast surface recognition and data acquisition but, in most cases, a single scan of an area is not sufficient, since the light emitted from the IOS cannot reach all the surfaces of a tooth, particularly the interproximal spaces [
17]. These mesh holes can also be intentionally created by the operator by cutting off sections of the digital impressions to remove unwanted overlapped oral tissues or after adjustments made on the abutments after the initial scan. Some studies have analyzed the influence of digital cutting, rescanning, and overlapping of scanned surfaces on the accuracy of a digital impression [
18,
19], but the results can be inconsistent.
The purpose of this study was to identify which protocol produced the most accurate digital impression of one single tooth preparation, in which data was acquired from a single uninterrupted scan, a rescanning of the area of interest in order to obtain more data, or the deletion of the area of interest followed by a rescan. The null hypothesis was that there would be no significant difference found in the trueness and precision of the IOS scans captured with the three different scanning protocols and that there would be no significant difference in the trueness and precision of the IOS scans between the analyzed in vivo and in vitro cases.
2. Materials and Methods
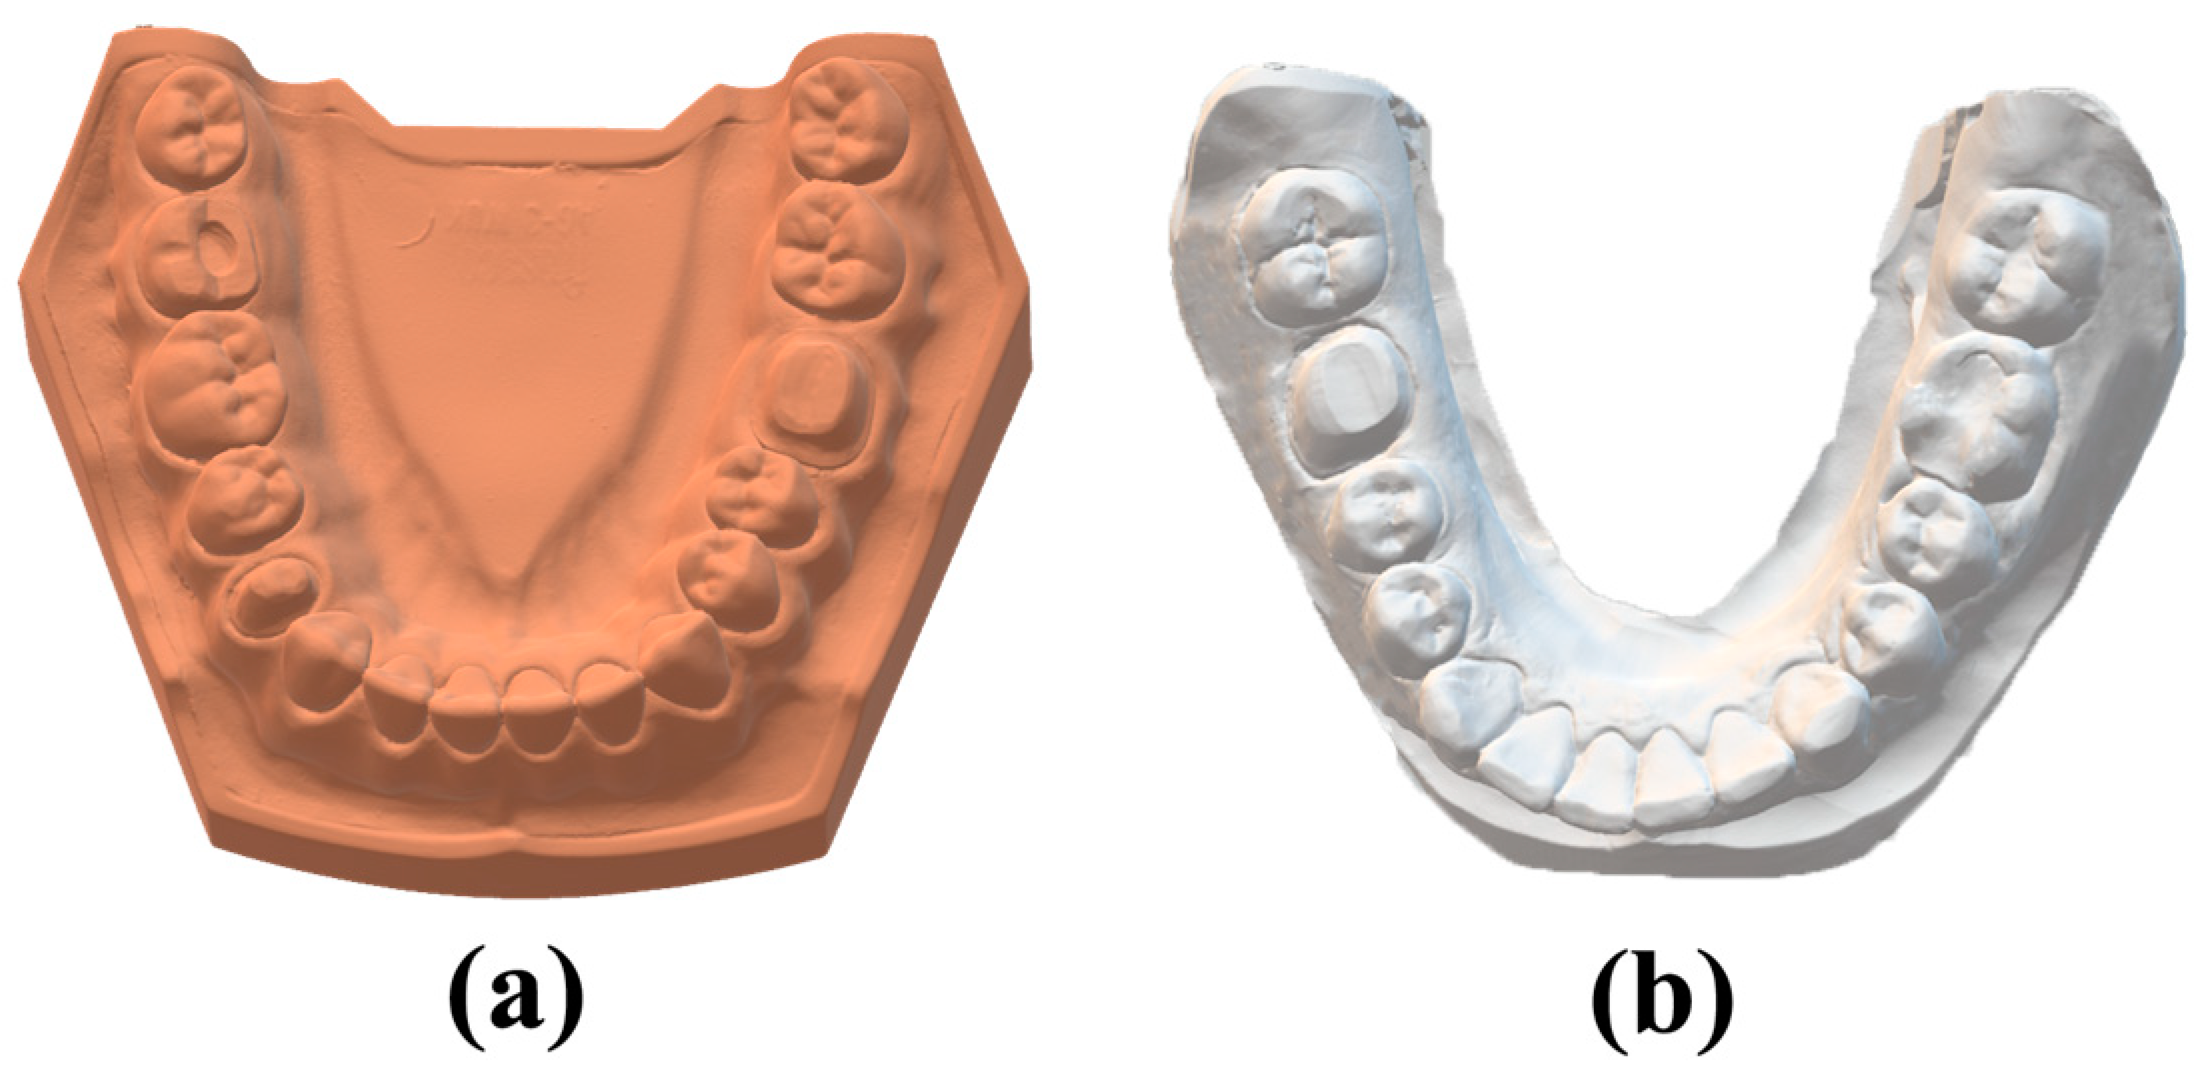
Two protocols (in vitro and in vivo) for crown preparation on the mandibular first molar were performed. For the in vitro part of the study, a typodont (AG-3; Frasaco, Tettnang, Germany) inserted in the mandibular articulation of a dental mannequin (Phantom head PK-2 TSE; Frasaco) was used. A full crown preparation with a chamfer margin was conducted on the left mandibular first molar of the typodont. The typodont was digitized with the help of a high-accuracy desktop scanner (Freedom HD; DOF) in order to obtain the reference data consisting of a standard tessellation language (STL) file (
Figure 1a).
For the in vivo part of the study, a clinical case was selected after obtaining informed consent and Ethical Committee approval from CECS UMFT Nr. 03/2023. A full crown vertical preparation on the right mandibular first molar was performed.
A conventional two-step impression technique using an elastomeric addition-cured silicone-based precision material (Variotime, Kulzer, Hanau, Germany) with a single retraction cord was performed. A cast model was produced using a high-strength, high-accuracy scannable plaster type IV (Ventura SuperDie Rock; Madespa, Toledo, Spain). The cast model was digitized with the same desktop scanner (Freedom HD; DOF) in order to obtain reference data for the clinical case. The desktop scanner was calibrated according to the manufacturer’s instructions; a high level of accuracy, <7 microns, is specified for this scanner.
With the use of a Medit I700 intraoral scanner, three different scanning protocols were conducted on the typodont. The scanning protocols consisted of:
- (1)
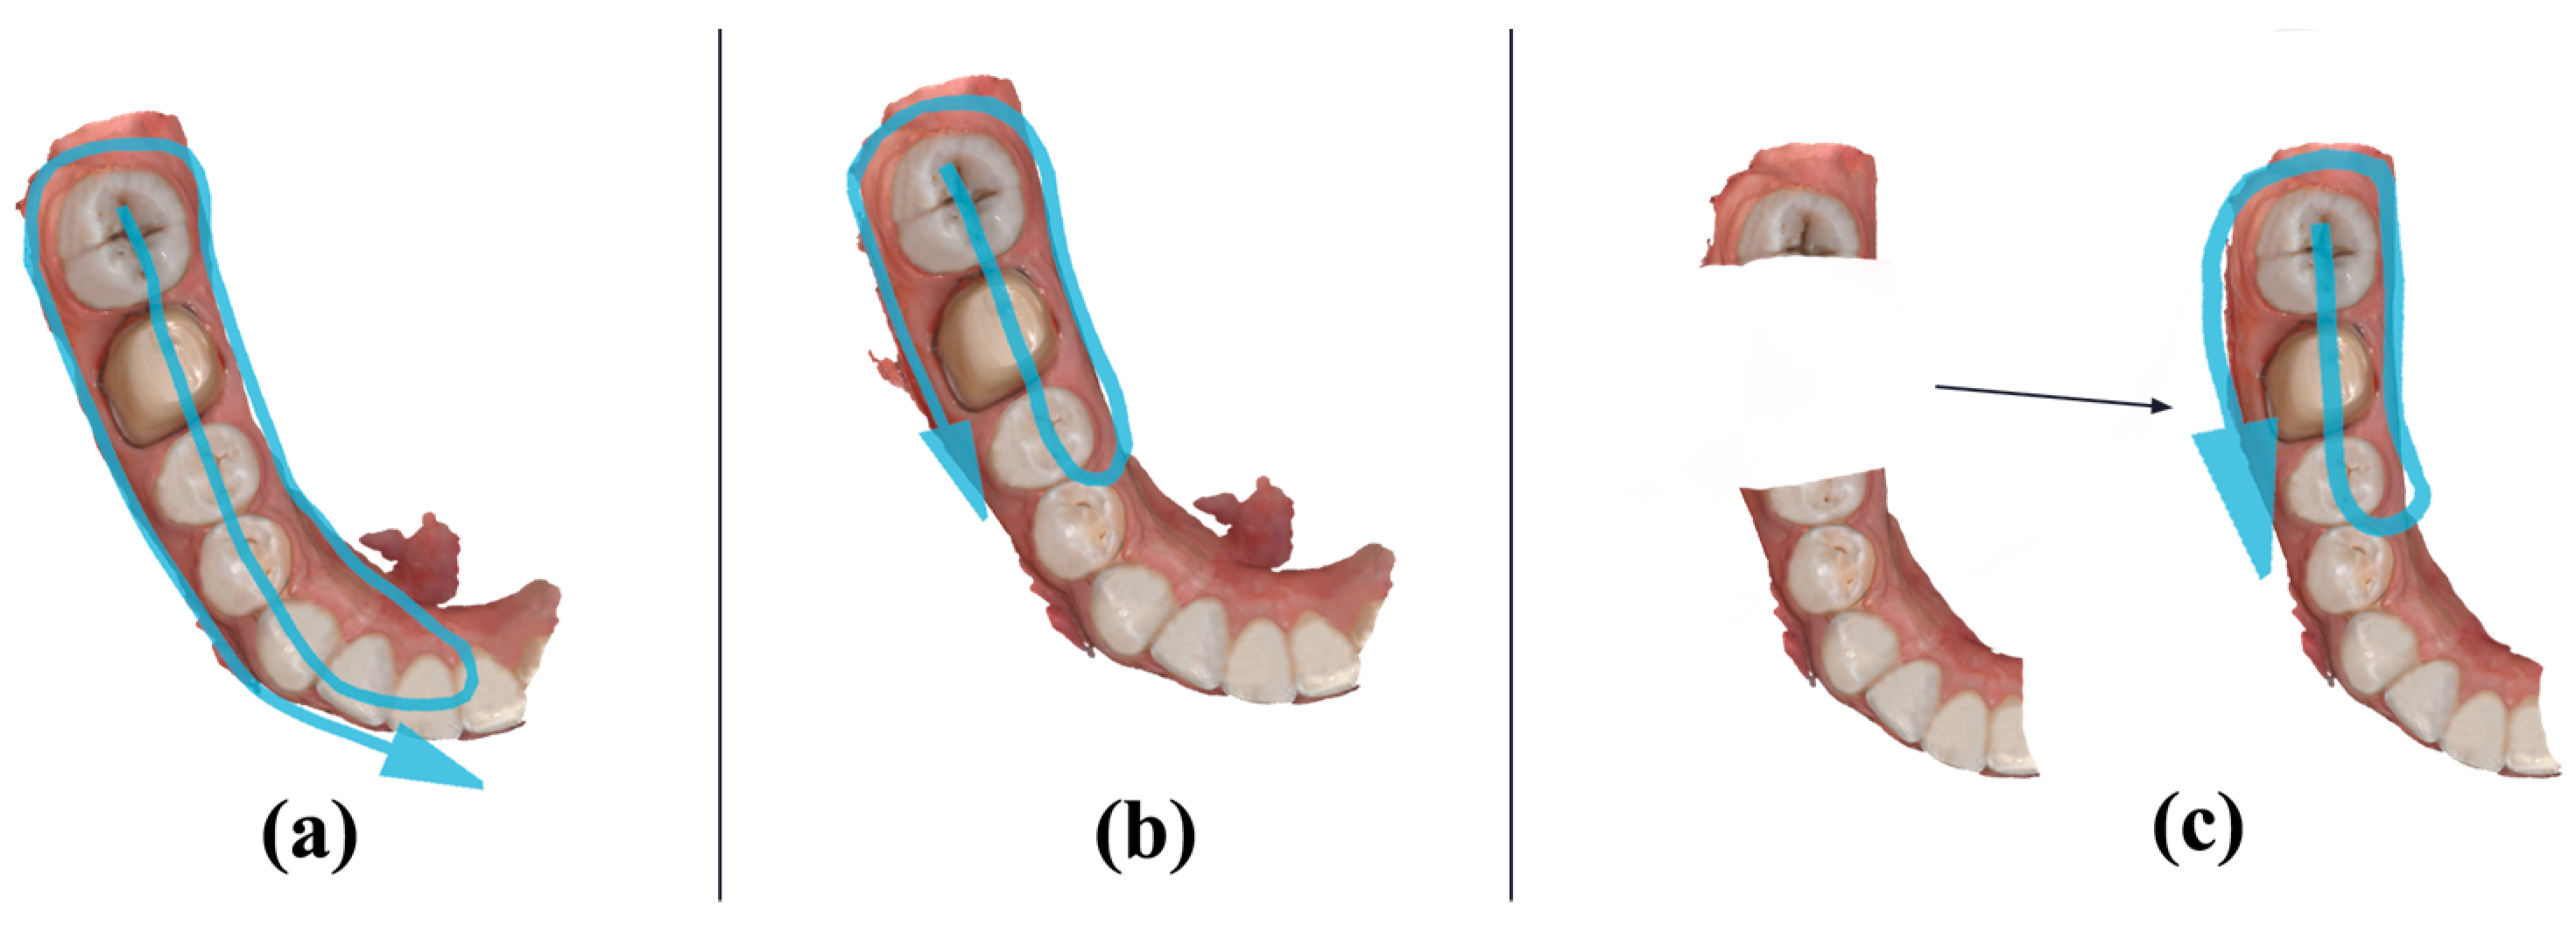
A single continuous scan without interruption, capturing as many data as possible without overlapping the already registered areas. The scanning path started distally on the left mandibular third molar and followed the occlusal plane until reaching the left mandibular central incisor at the median line, returning on the lingual side of the prosthetic plane, and finally capturing the buccal part of the prosthetic plane (
Figure 2a). This protocol was named the “SINGLESCAN” protocol. All subsequent scans obtained by this protocol were grouped in the “SINGLESCAN” measured data group.
- (2)
A second scan filling in the missing data and overlapping the already captured areas. The rescanning path started distally on the left mandibular second molar and followed the occlusal plane until reaching the left mandibular second premolar, returning on the lingual side of the prosthetic plane, and finally capturing the buccal part of the prosthetic plane (
Figure 2b). This protocol was named the “RESCAN” protocol. All subsequent scans obtained by this protocol were grouped in the “RESCAN” measured data group.
- (3)
A third scan in which the first scan was imported, and the crown preparation interest area was trimmed and rescanned. The trimmed area consisted of the prepared left mandibular first molar, the mesial half of the distal neighboring tooth (left mandibular second molar), and the distal half of the mesial neighboring tooth (left mandibular second premolar). The rescanning path started distally on the left mandibular second molar and followed the occlusal plane until reaching the left mandibular second premolar, returning on the lingual side of the prosthetic plane, and finally capturing the buccal part of the prosthetic plane (
Figure 2c). This protocol was named the “DELETE&RESCAN” protocol. All subsequent scans obtained by this protocol were grouped in the “DELETE&RESCAN” measured data group.
The scanning scenarios were repeated 30 times following the same protocol, obtaining a total of 90 STL files consisting of three groups of 30 subjects each, representing the measured data for the in vitro part of the study. During the scanning protocol, the typodont-mannequin ensemble was fixed in the same position on the dental chair, the ambient conditions were kept constant, the lighting conditions were kept constant at 1000 lux and were checked with the help of a digital lux meter (GM1010; Benetech, Shenzhen, China), and the unit lights were kept off during the scanning procedure. The consecutive scans were conducted by the same experienced prosthodontist with a 10 min break between the different scanning protocols in order to reduce operator fatigue. The intraoral scanner was calibrated before each scan according to the manufacturer’s protocol. Any missing data on the scanning mesh was automatically filled by the software by selecting the “Fill Major Holes” feature at the end of each scan. With this feature, based on the “Reliability Map”, the reliable areas were extended to cover the areas where data was not acquired.
The exact same scanning protocol was conducted on the clinical case consisting of 15 repetitions of the scanning scenarios, obtaining a total of 45 STL files representing the measured data for the in vivo part of the study. The conventional impression for the reference data was executed after the entire intraoral scanning procedure was completed, in order to maintain the prosthetic field unchanged and under the same conditions, especially considering the retraction cord, which must be the same and its position unchanged during the experiment for the reference impression to be relevant. Regarding the scanning protocol paths for the clinical case, in the “SINGLESCAN” protocol the scanning path started distally on the right mandibular second molar and followed the occlusal plane until reaching the right mandibular central incisor at the median line, returning on the lingual side of the prosthetic plane, and finally capturing the buccal part of the prosthetic plane (
Figure 3a). In the “RESCAN” protocol, the rescanning path started distally on the right mandibular second molar and followed the occlusal plane until reaching the right mandibular second premolar, returning on the lingual side of the prosthetic plane, and finally capturing the buccal part of the prosthetic plane (
Figure 3b). In the “DELETE&RESCAN” protocol, the trimmed area consisted of the prepared right mandibular first molar, the mesial half of the distal neighboring tooth (right mandibular second molar), and the distal half of the mesial neighboring tooth (right mandibular second premolar). The rescanning path started distally on the right mandibular second molar and followed the occlusal plane until reaching the right mandibular second premolar, returning on the lingual side of the prosthetic plane, and finally capturing the buccal part of the prosthetic plane (
Figure 3c).
The measured data (IOS scans) for both the in vitro and in vivo groups were sorted and further analyzed with the help of Geomagic Control X (Version:16.0.2.16496, 3D Systems, Wilsonville, OR, USA), inspection and metrology software, in order to obtain the standard deviation for trueness and precision of each scan.
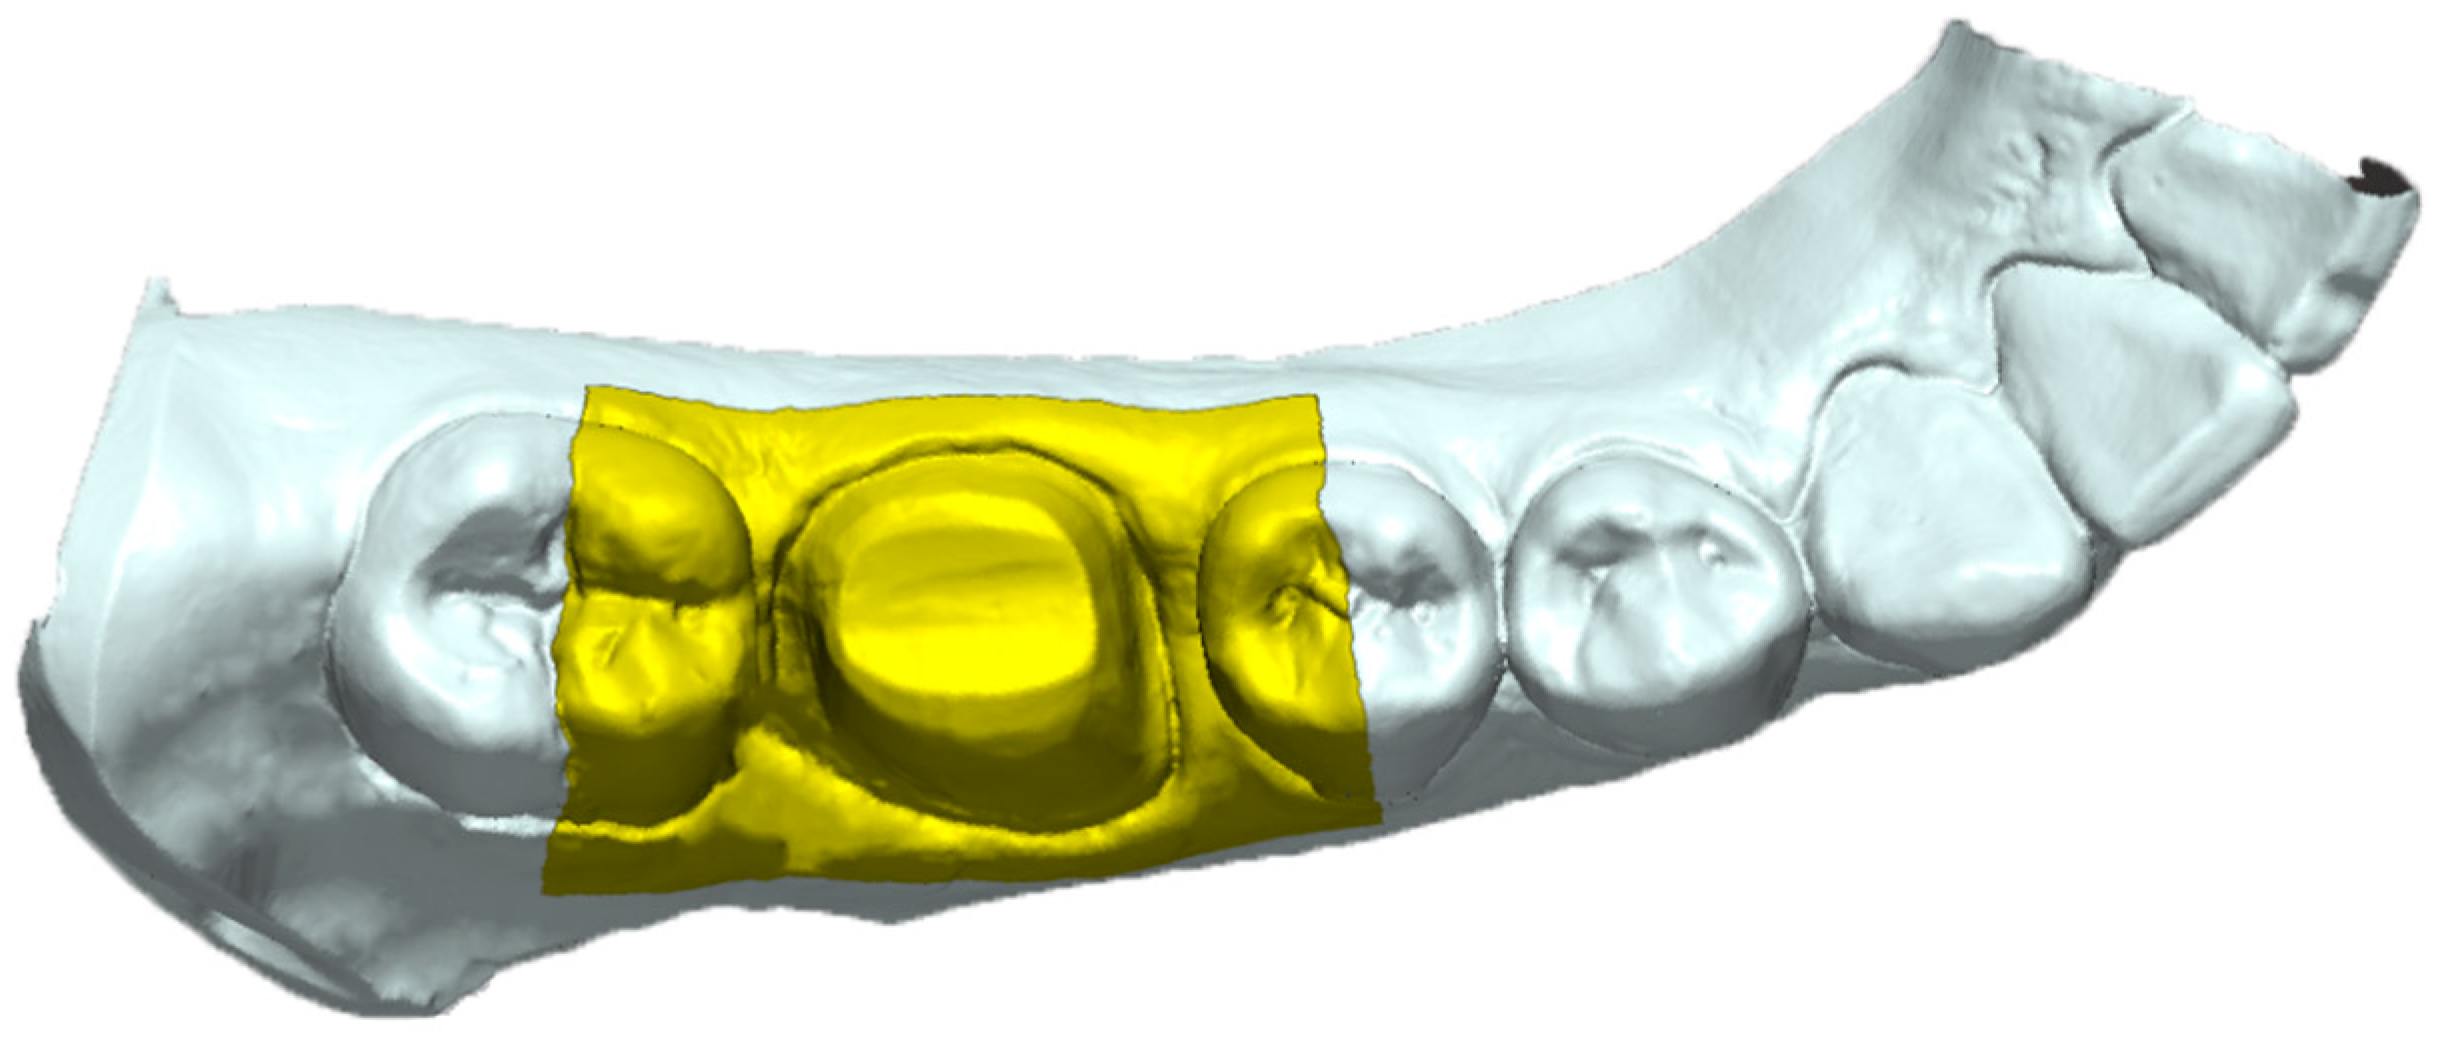
The reference data (laboratory desktop scans) were uploaded into the software and the area of interest was isolated from the rest of the 3D mesh to facilitate the following steps and the comparison protocol. The area of interest consisted of a rectangle that covered the entire area of the prepared tooth, the mesial half of the distal neighboring tooth, the distal half of the mesial neighboring tooth, and the adjacent zones that surround these landmarks extending 5 mm apically on the buccal and lingual slopes (
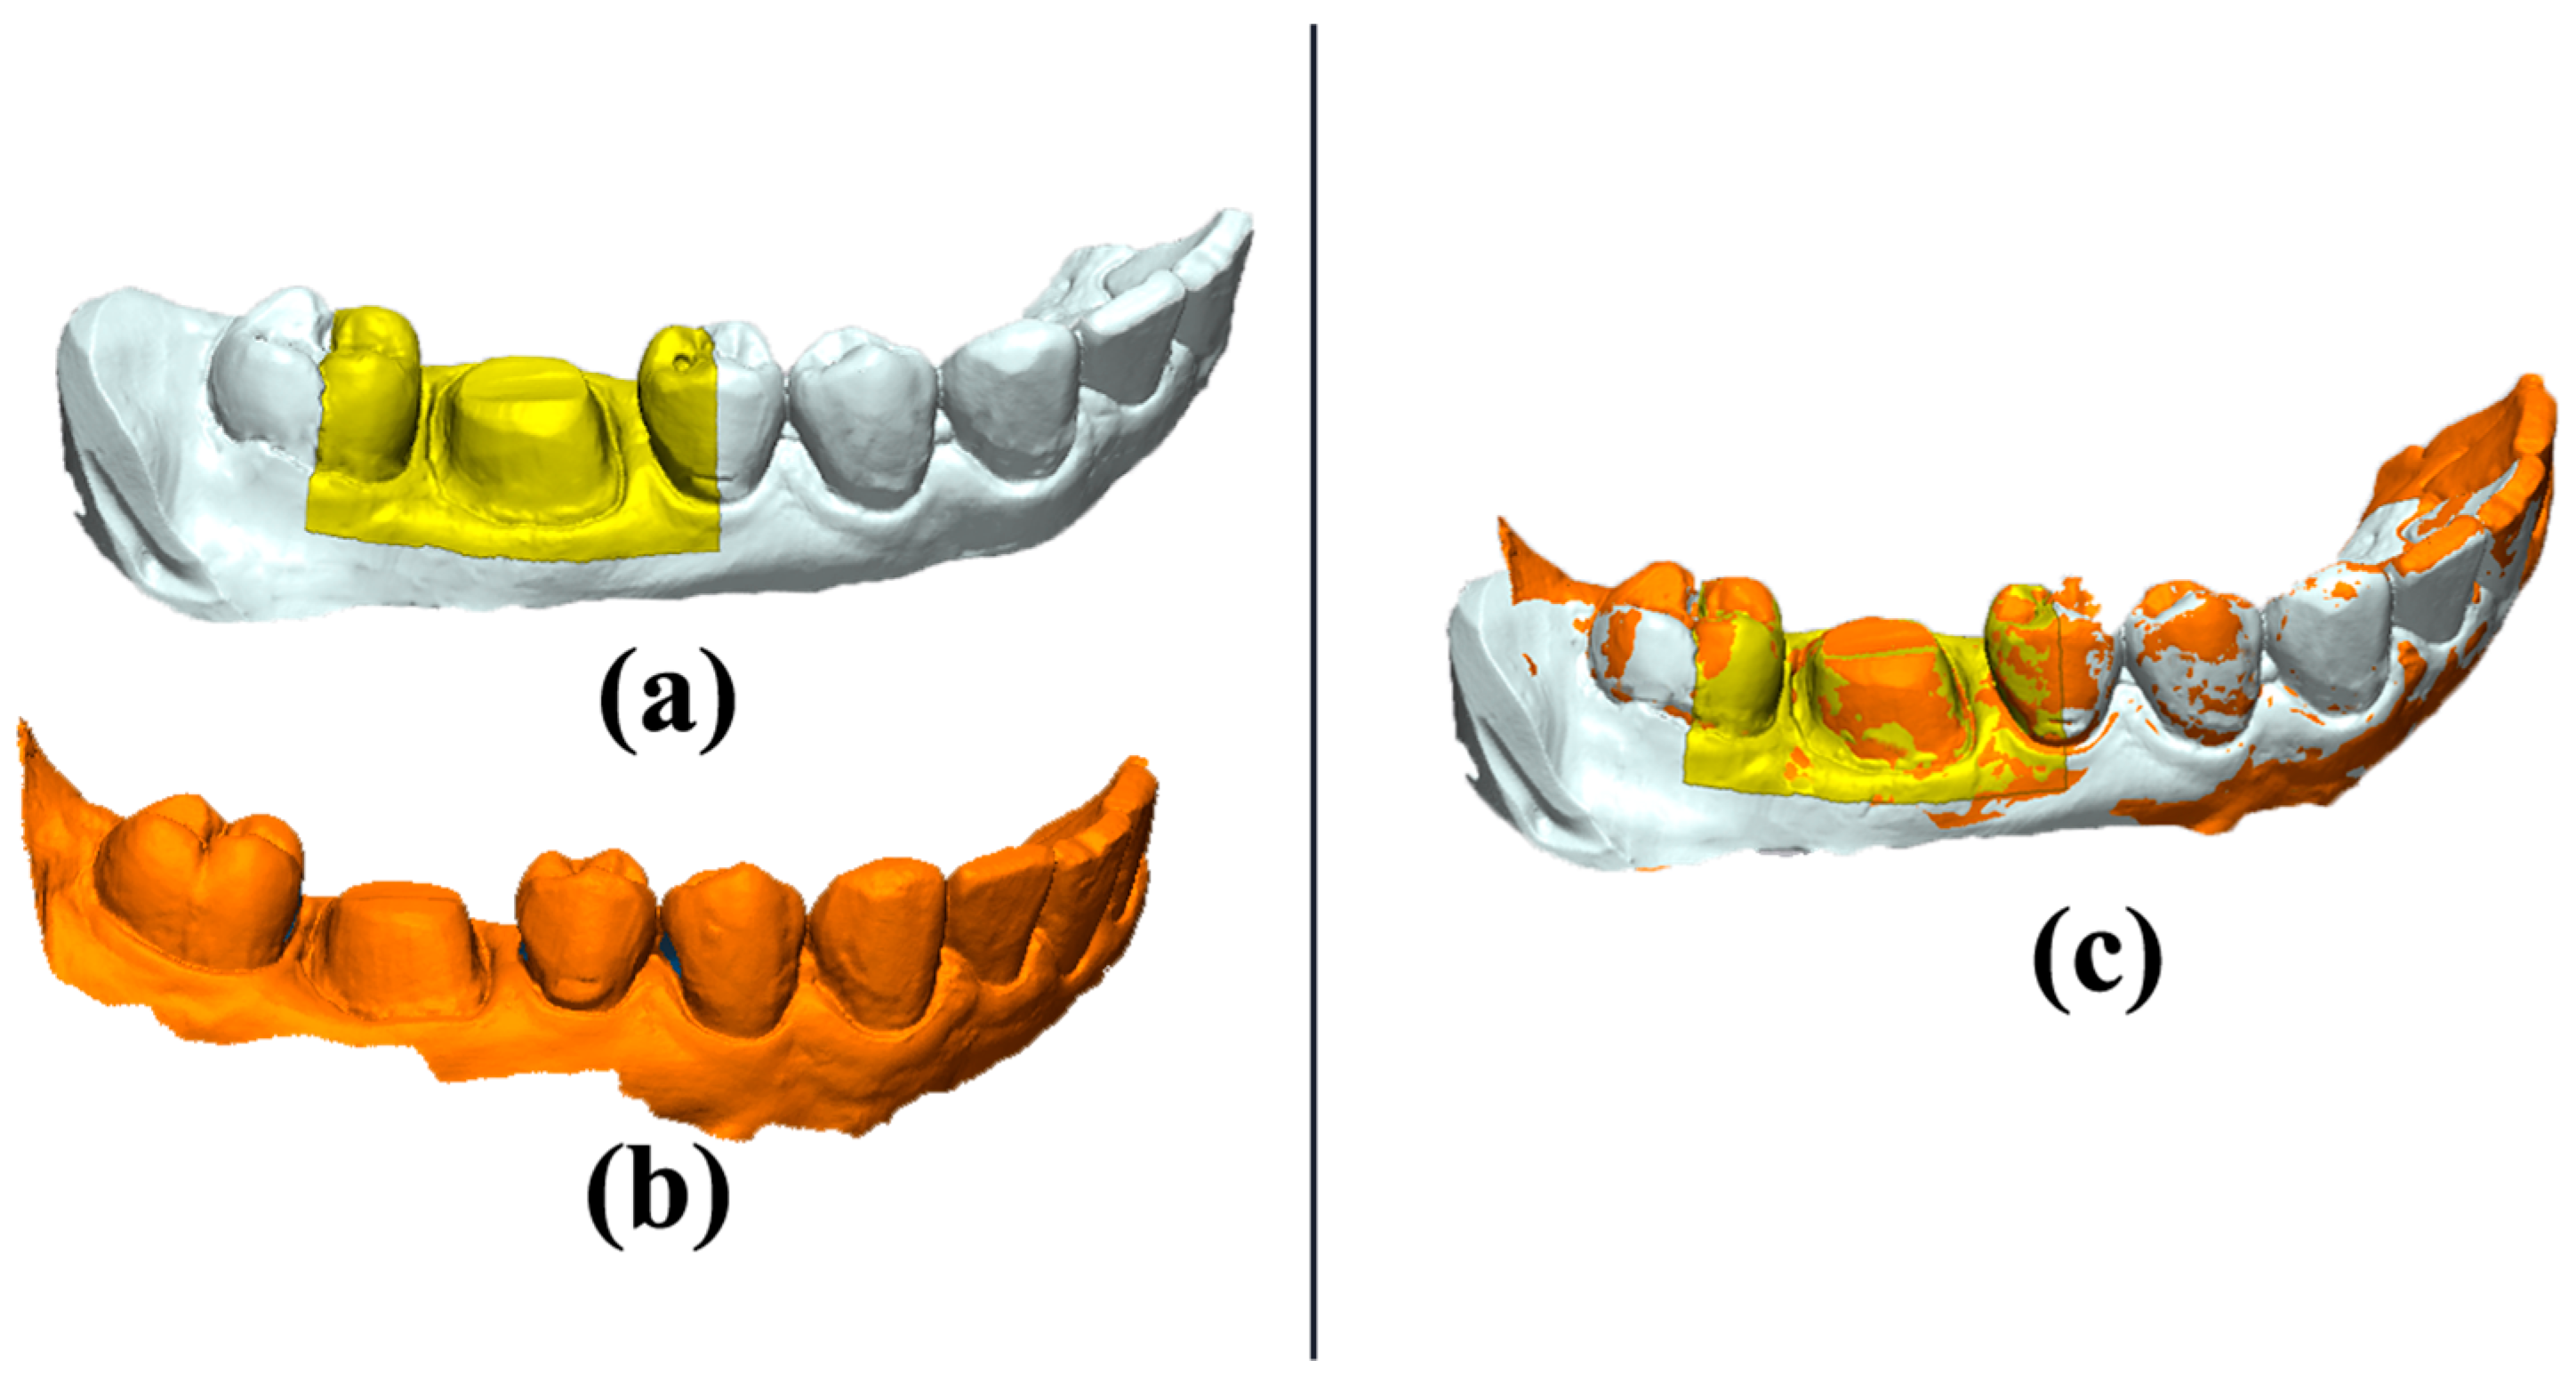
Figure 4). Only the predefined interest area was analyzed between the meshes. The metrology software offers the option to keep the same settings of the reference data while changing the measured data meshes to achieve consistency in the comparisons; therefore, the area of interest remained the same for all the following comparisons and only the measured data were swapped. In order to superimpose the IOS mesh over the reference mesh, an “initial alignment” procedure was conducted. For a precise overlapping of the interest area, the “best fit alignment” procedure was executed (
Figure 5).
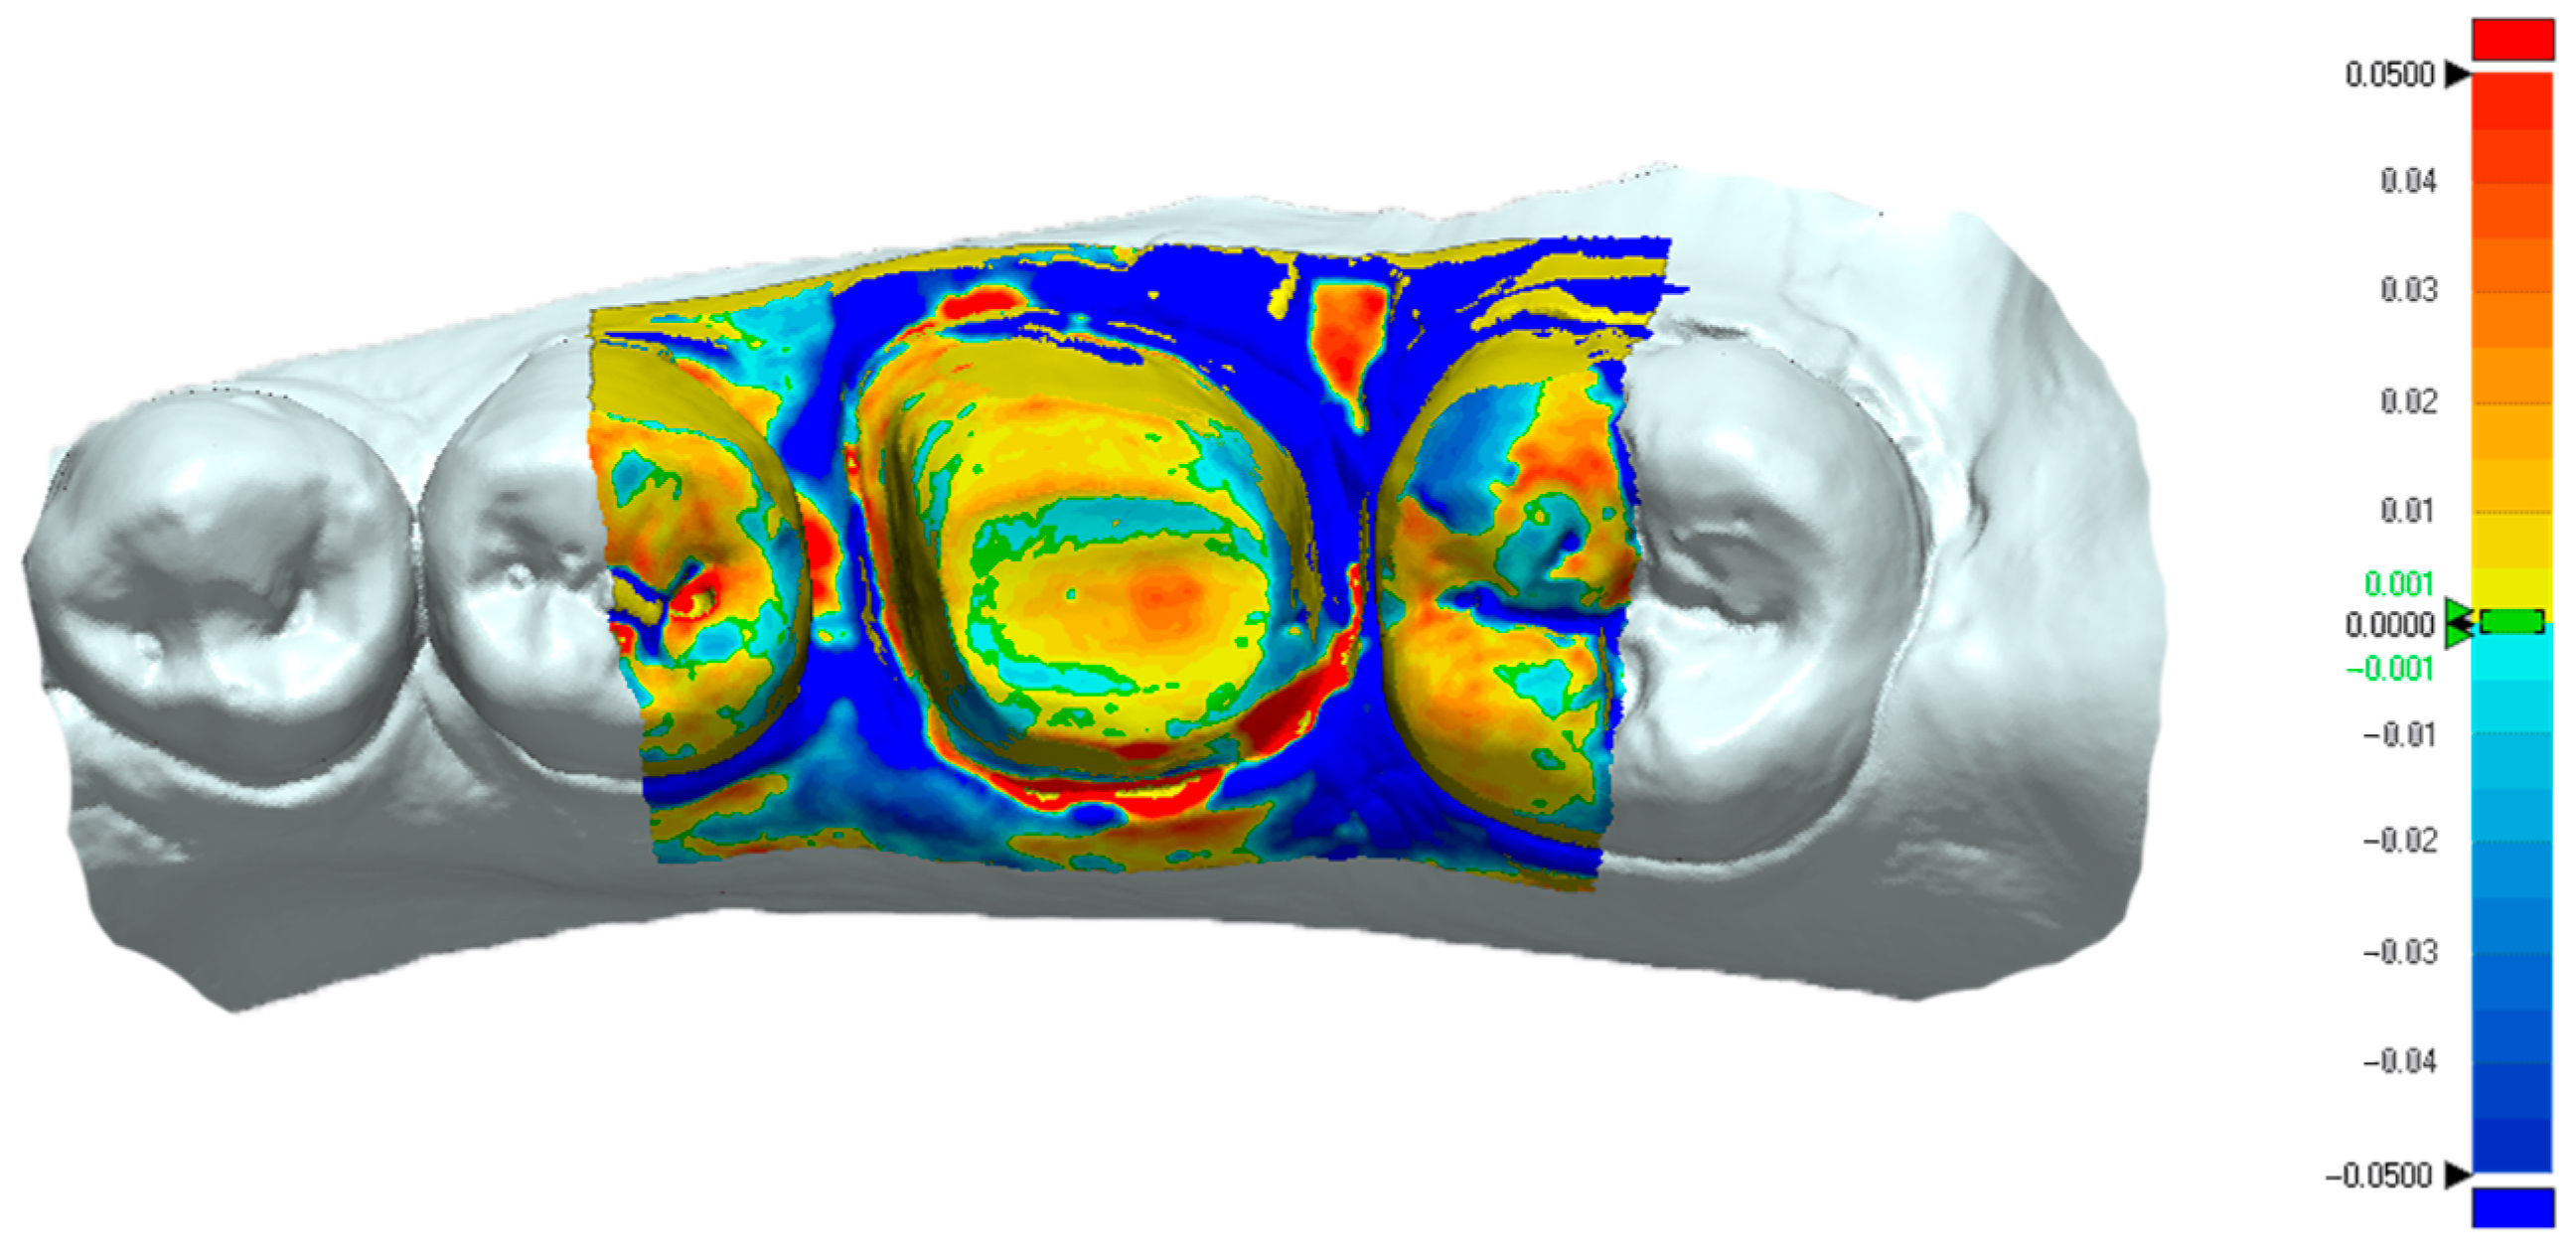
The “3D Compare” function of the metrology software presented the standard deviation results between the measured and reference data via projecting all paired points onto the reference data. The “3D Compare” function also rendered a color-coded map displaying the deviation patterns of the investigated surfaces between ±0.05 mm (50 µm). Outward displacement is presented on the color-coded map towards the red spectrum, inward displacement is presented towards the blue spectrum, and the green areas where there is less than ±1 μm difference indicate no deviation (
Figure 6).
The described protocol was conducted on all the measured data meshes of the in vivo and in vitro cases by comparison to their respective reference data to obtain the trueness values. To obtain the precision values, the same protocol was conducted by comparing each measured data mesh with all the other meshes within its group.
The organized trueness and precision values were uploaded into the MedCalc statistical software to conduct the statistical analysis. The Kolmogorov–Smirnov test for normality was conducted on the whole set of data and indicated that the trueness values of both in vitro and in vivo cases were parametric while the precision values of both in vitro and in vivo cases were non-parametric. The nonparametric data set underwent Kruskal–Wallis test analysis and post-hoc analysis (Conover test) was also executed. The parametric data set underwent a one-way ANOVA test and the Student–Newman–Keuls test for all pairwise comparisons was also executed. The level of significance was set to α = 0.05.
3. Results
The trueness and precision values of the in vitro case are presented in
Table 1 and the trueness and precision values of the in vivo case are presented in
Table 2.
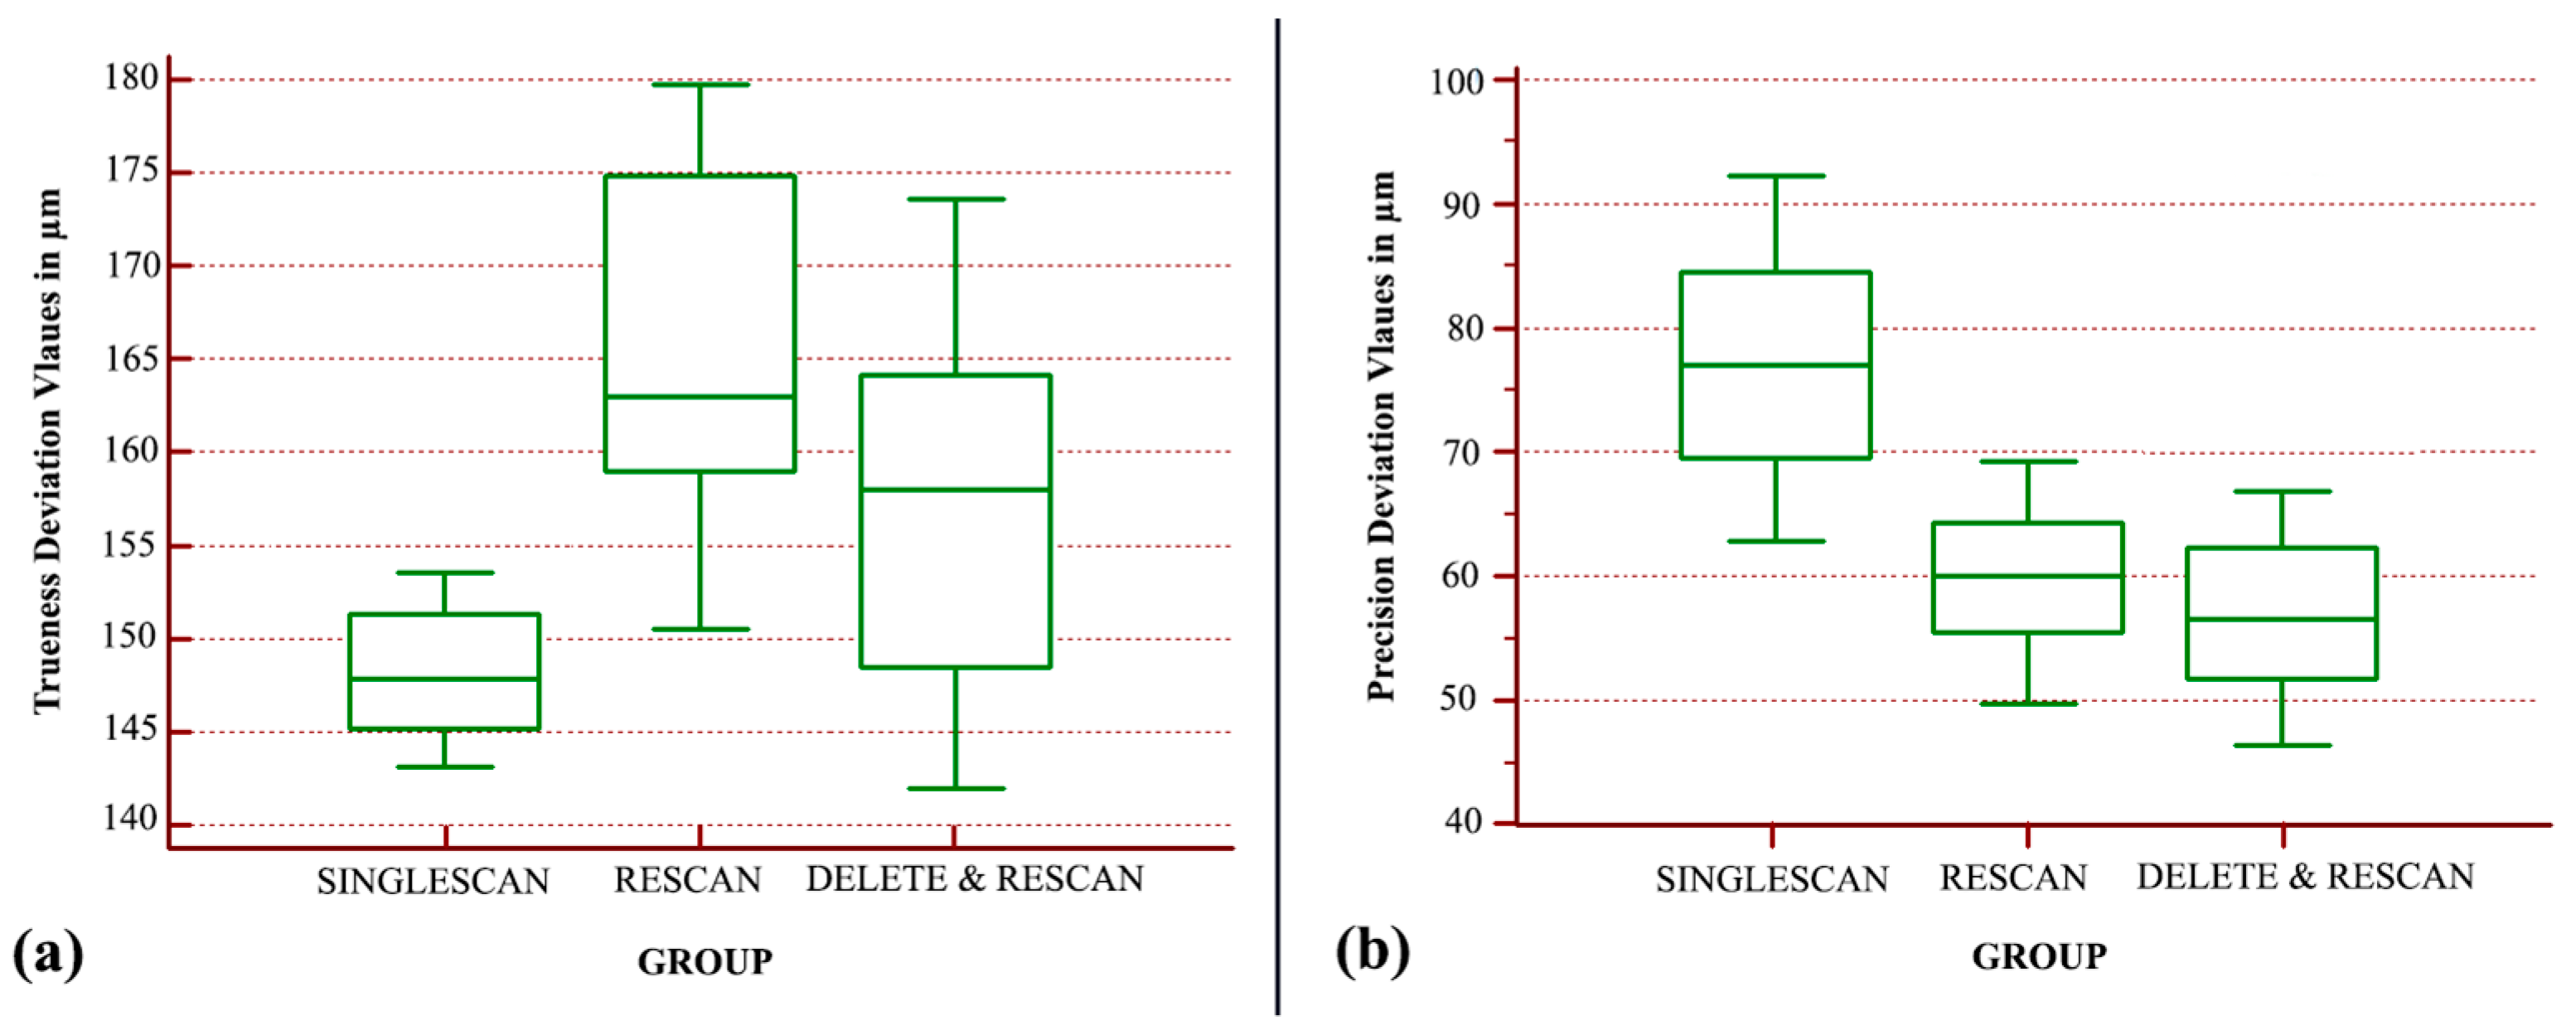
Regarding the in vitro case, the analysis indicated that there is a statistically significant difference between the trueness groups (
p < 0.001). The “SINGLESCAN” group displayed the best trueness, followed by the “DELETE&RESCAN” group with a 9.5 µm decrease in trueness, whereas the “RESCAN” group was the least true with a further 7 µm decrease (
Figure 7a). The overall trueness differences between the analyzed groups were no larger than 17 µm.
The statistical analysis of the nonparametric values indicated that there is a statistically significant difference between the precision groups (
p < 0.0001). The “DELETE&RESCAN” group displayed the best precision, followed by the “RESCAN” group with a 3.4 µm decrease, and the “SINGLESCAN” group was the least precise (
Figure 7b). There was a 20 µm precision difference between the best performing group and the least precise one.
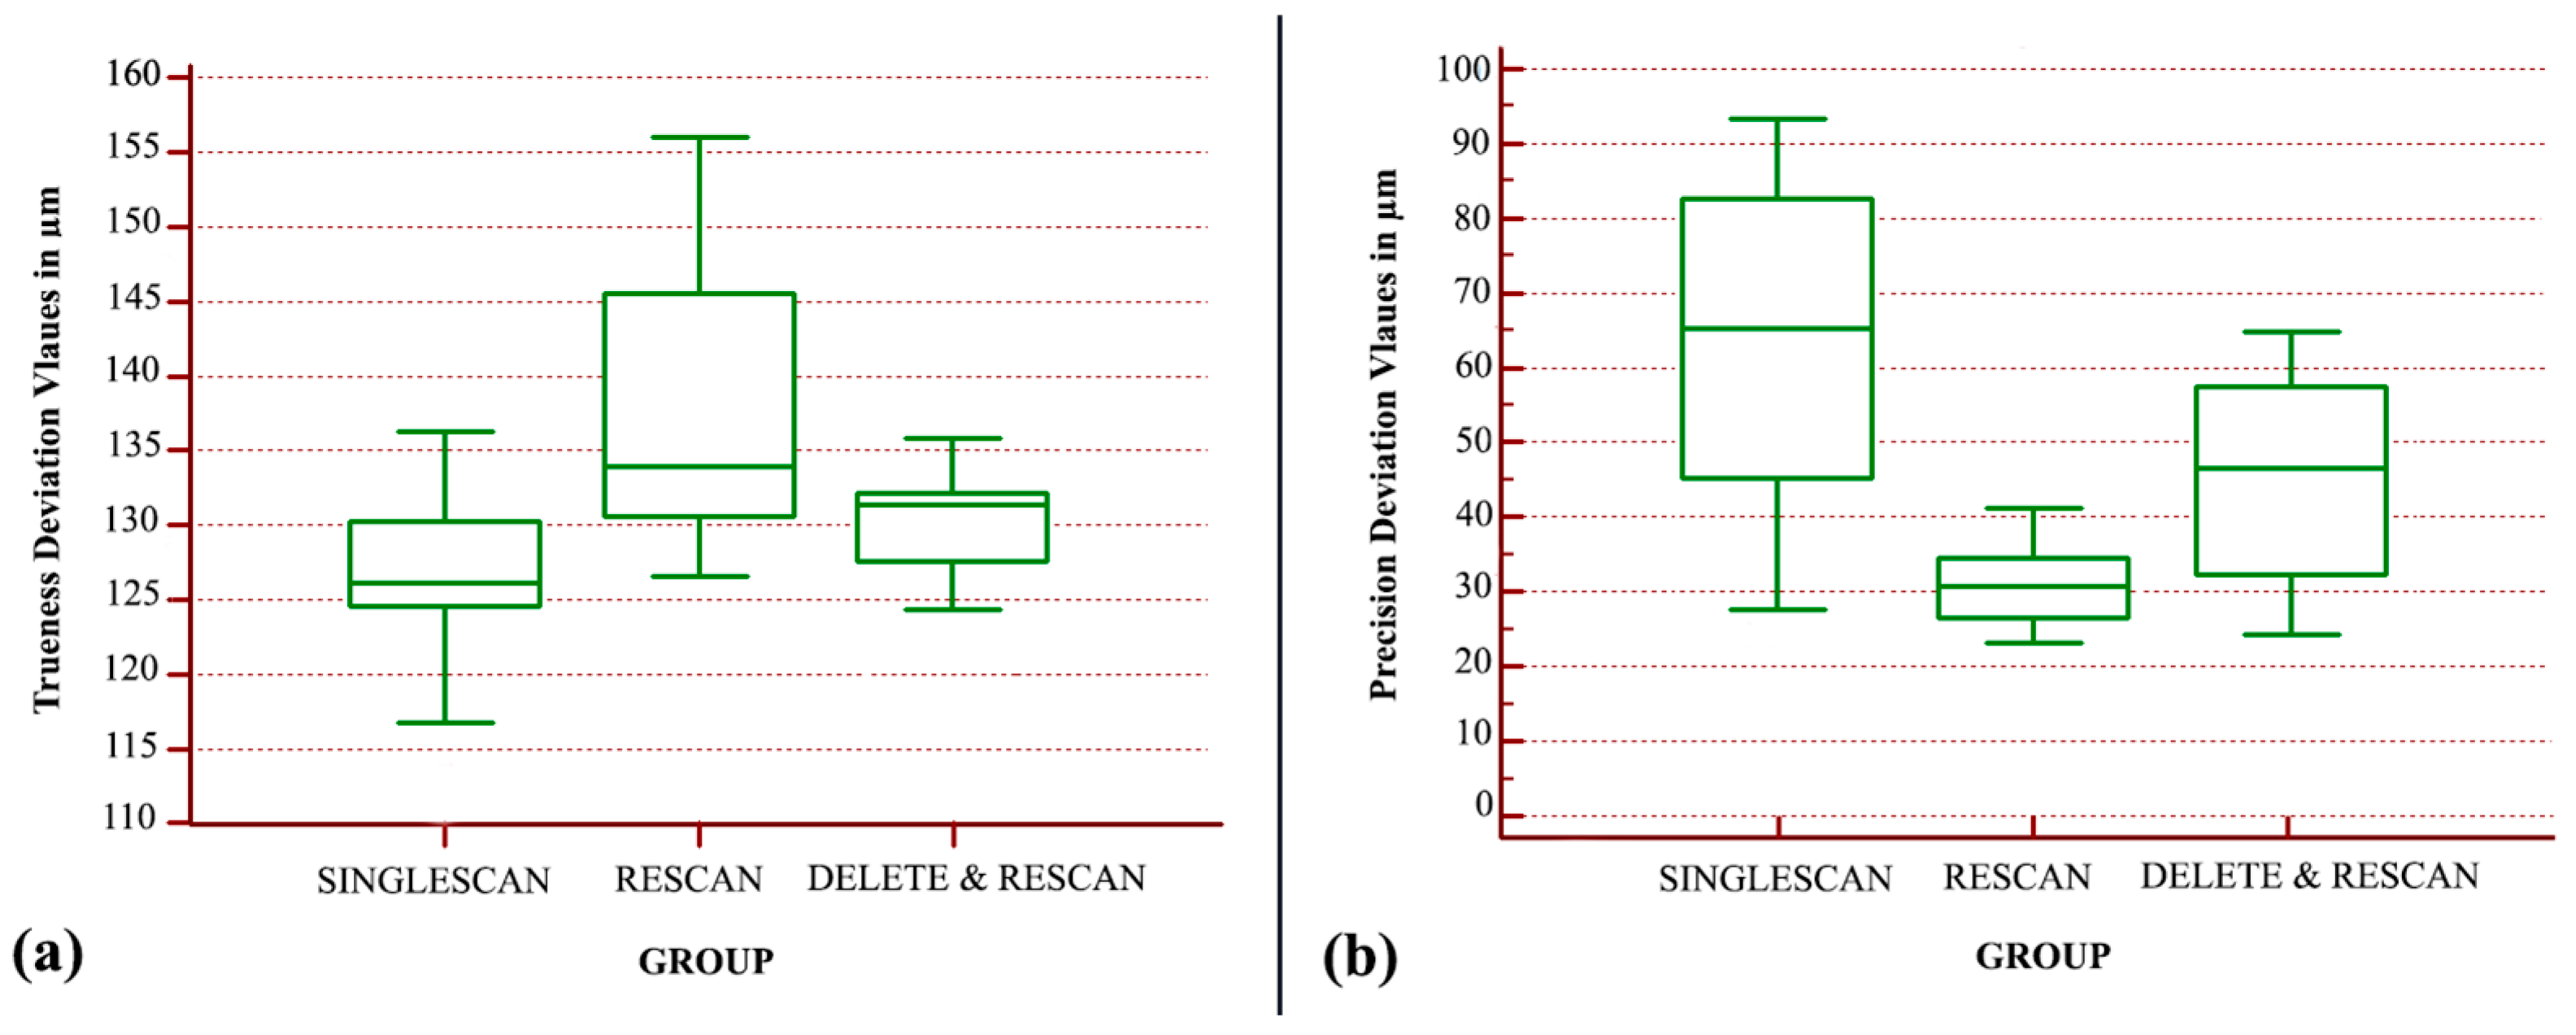
Regarding the in vivo case values, the analysis indicated that there is a statistically significant difference between the trueness groups (
p < 0.001). The “SINGLESCAN” group displayed the best trueness, followed by the “DELETE&RESCAN” group with a 1.8 µm decrease in trueness, and the “RESCAN” group was the least true with a further 9.3 µm decrease (
Figure 8a). The overall trueness differences between the analyzed groups were no larger than 11 µm.
The analysis of the nonparametric data indicated that there is a statistically significant difference between the precision groups (
p < 0.0001). The “RESCAN” group displayed the best precision, followed by the “DELETE&RESCAN” group with a 16 µm decrease, and the “SINGLESCAN” group was the least precise (
Figure 8b).
4. Discussion
The results of the present in vivo and in vitro study showed that rescanning and overlapping data, as well as trimming and rescanning a surface of a digital model and the different data acquisition protocol, influence the accuracy of the IOS. The present study raised several questions: “Accuracy wise, is it better to scan a single time the interest area leaving the IOS’s software to fill in the remaining mesh holes or is it better to scan multiple times the same area until complete geometry data acquisition?”. Another question was “in which way cropping an area followed by a consecutive scan influences the accuracy of a digital impression?” The simulated scenarios were selected in order to observe which option is the most reliable way to obtain an accurate digital impression. Moreover, these scenarios are implemented frequently during the digital impression stage and in some cases all of them can be applied on the same intraoral scan.
The study was conducted in both in vivo and in vitro scenarios. Initially, the purpose was to evaluate these variables in a controlled environment followed by clinical data corroboration. The results showed that in both in vivo and in vitro cases the accuracy values had a similar pattern. The best trueness was displayed by the “SINGLESCAN” group, and the trueness seemed to decrease as more data were overlapped in the other groups. When accounting for precision, the “SINGLESCAN” group was the least precise in both cases as there were more surfaces left unrecorded, especially on the proximal areas, during this protocol, in which the holes in the mesh were filled by the software and probably differed between the scans. The “RESCAN” group, having the least unrecorded areas, seemed the most precise. There was an inconsistency between the in vivo and in vitro cases regarding precision as the “DELETE & RESCAN” group was slightly better performing in the in vitro scenario, closely followed by the “RESCAN” group with a 3.4 µm decrease in precision, while in the in vivo scenario the “RESCAN” group was considerably superior.
The study presents high numerical values of the deviation between the IOS meshes and the reference meshes; this varied in the case of trueness from 100 to 170 µm, which could be considered clinically unacceptable. This results from the fact that a large area of the mesh was analyzed, and more surfaces produced a higher deviation than in the case of analyzing only the prepared tooth area, especially the tissue areas that were recorded with poorer accuracy. The overall trueness differences between the analyzed groups were no larger than 17 µm in the in vitro scenario and no larger than 11 µm in the in vivo case, indicating a small difference between the tested scanning protocols. The precision seems to be influenced a greater amount by the scanning protocol as the overall differences reached 35 µm.
The location of the evaluated scans was in the posterior arch. This scenario was intentionally selected since lateral proximal areas usually are harder to reach with the IOS’s tip and in some cases mesh holes may pass unnoticed. The influence of the preparation geometry was also observed. The in vitro abutment was prepared with a chamfer finish line while the in vivo case, due to conservative reasons, was prepared with a feather edge finish line. In both situations, the trueness values were similar and precision values differed slightly, showing that the equigingival positioning of the type of preparation had little to no influence on the accuracy of digital impressions in the present study.
Marta Revilla-Leon et al. investigated the influence of rescanning mesh holes with different diameters (2, 4, and 6 mm) using the Trios 4 IOS (3Shape, Copenhagen, Denmark), showing that the 6 mm group had the lowest trueness and precision. Regarding the influence of rescanning repetitions, they concluded that there were no significant differences between the groups with the same mesh hole diameter. The overall conclusions of the study were that the higher the number and diameter of the rescanned areas, the lower the accuracy [
20].
Miguel Gomez-Polo et al. performed a similar in vitro study using the Trios 3 IOS (3Shape, Copenhagen, Denmark) on full arch scans and with mesh holes of 12 mm placed on the occlusal surfaces of the left second first molar, incisal edges of the central incisors, and the right first molar for one of the test groups, and on the occlusal surface of the left first molar and left second and first premolars for the second test group. They concluded that rescanning mesh holes combined with the stitching software procedures decreased the trueness and precision of the IOS tested [
18].
Another similar in vitro study performed by Islam E Ali et al. evaluated the accuracy of another IOS (Medit i500, Medit, Seoul, Republic of Korea), after trimming and rescanning an ear model. The cut-out areas were 2, 5, and 8 mm. The conclusions drawn were in accordance with the other studies regarding the trueness. However, they reported that the precision values were relatively unaffected by the rescanning process [
19].
The majority of the research states that the clinically acceptable marginal gap falls between 100 and 120 µm [
21,
22,
23,
24,
25]. Based on this clinically permissible range, a number of prior studies have evaluated the fitness of fixed prostheses [
22,
26,
27,
28,
29], but as the obtained values varied, it is challenging to establish an objectively and universally accepted value for clinically acceptable differences when it comes to the marginal fit and accuracy of a digital impression [
30]. Based on the approach of the previously mentioned research, we suggest that the resulting trueness and precision differences in the present study, being smaller than 20 µm, could be deemed as clinically negligible.
The present study has several limitations. Firstly, the scenario tested was limited to a single full crown preparation and the adjacent area. A larger area comprised of multiple and/or different preparations as well as a full arch scan could render different results and changes in the accuracy of the scans. Larger scanned areas could also mean a higher chance of overlapping data, which would greatly alter the results. In the case of the in vivo scenario, the trueness analysis relies heavily on the capability of the conventional impression to produce a reference model as closely and accurately to the real intraoral prosthetic plane as possible, and certainly more accurate than the IOS scans with which it is compared. Within the present study, we took all the measures that were in our power to ensure this desideratum, but nevertheless different impression materials or different impression protocols could render more or less accurate reference models. Additional research and studies are advised to be conducted on this subject to better comprehend the influence of the scanning and rescanning protocol on the accuracy of the resulted digital impression.
5. Conclusions
Based on the results of the present study, the following conclusion can be drawn:
Statistical differences were found in the trueness and precision of the IOS scans captured with the three different scanning protocols, the “SINGLESCAN” group providing the best trueness and the “RESCAN” group providing the best precision.
From the three investigated protocols, no specific scanning protocol could be recommended to provide the best overall accuracy.
There were no major clinical differences regarding trueness and precision between the analyzed in vivo and in vitro cases. Trueness results were similar for both in vivo and in vitro cases, while the precision results differed slightly but the small difference could be deemed clinically negligible.
Author Contributions
Conceptualization, A.J.; methodology, A.B.F., A.J., R.N.R. and D.A.; software, A.B.F.; validation, A.J. and R.N.R.; formal analysis, A.B.F., A.J. and R.N.R.; investigation, A.B.F., R.N.R. and D.A.; resources, A.B.F., A.J., R.N.R. and D.A.; data curation, A.B.F. and R.N.R.; writing—original draft preparation, A.B.F. and R.N.R.; writing—review and editing, A.B.F., A.J., R.N.R. and D.A.; visualization, A.B.F., A.J. and R.N.R.; supervision, A.J. All authors have read and agreed to the published version of the manuscript.
Funding
This research received no external funding.
Institutional Review Board Statement
The study was conducted in accordance with the Declaration of Helsinki and approved by the Ethics Committee of UMFT Victor Babes (No. 03/2023) for studies involving humans.
Informed Consent Statement
Informed consent was obtained from all subjects involved in the study. Written informed consent has been obtained from the patient(s) to publish this paper.
Data Availability Statement
All data is available upon request.
Conflicts of Interest
The authors declare no conflict of interest.
References
- Jayaraman, S.; Singh, B.P.; Ramanathan, B.; Pazhaniappan Pillai, M.; Macdonald, L.; Kirubakaran, R. Final-impression techniques and materials for making complete and removable partial dentures. Cochrane Database Syst. Rev. 2018, 2018, CD012256. [Google Scholar] [CrossRef]
- Naumovski, B.; Kapushevska, B. Dimensional Stability and Accuracy of Silicone–Based Impression Materials Using Different Impression Techniques–A Literature Review. Prilozi 2017, 38, 131–138. [Google Scholar] [CrossRef]
- Natsubori, R.; Fukazawa, S.; Chiba, T.; Tanabe, N.; Kihara, H.; Kondo, H. In vitro comparative analysis of scanning accuracy of intraoral and laboratory scanners in measuring the distance between multiple implants. Int. J. Implant Dent. 2022, 8, 18. [Google Scholar] [CrossRef]
- Amornvit, P.; Rokaya, D.; Sanohkan, S. Comparison of Accuracy of Current Ten Intraoral Scanners. BioMed Res. Int. 2021, 2021, 2673040. [Google Scholar] [CrossRef]
- Zimmermann, M.; Ender, A.; Mehl, A. Local accuracy of actual intraoral scanning systems for single-tooth preparations in vitro. J. Am. Dent. Assoc. 2020, 151, 127–135. [Google Scholar] [CrossRef]
- Ochoa-López, G.; Cascos, R.; Antonaya-Martín, J.L.; Revilla-León, M.; Gómez-Polo, M. Influence of ambient light conditions on the accuracy and scanning time of seven intraoral scanners in complete-arch implant scans. J. Dent. 2022, 121, 104138. [Google Scholar] [CrossRef]
- Revilla-León, M.; Subramanian, S.G.; Özcan, M.; Krishnamurthy, V.R. Clinical Study of the Influence of Ambient Light Scanning Conditions on the Accuracy (Trueness and Precision) of an Intraoral Scanner. J. Prosthodont. 2020, 29, 107–113. [Google Scholar] [CrossRef]
- Jivanescu, A.; Faur, A.B.; Rotar, R.N. Can Dental Office Lighting Intensity Conditions Influence the Accuracy of Intraoral Scanning? Scanning 2021, 2021, 9980590. [Google Scholar] [CrossRef]
- Gómez-Polo, M.; Ortega, R.; Sallorenzo, A.; Agustín-Panadero, R.; Barmak, A.B.; Kois, J.C.; Revilla-León, M. Influence of the surface humidity, implant angulation, and interimplant distance on the accuracy and scanning time of complete-arch implant scans. J. Dent. 2022, 127, 104307. [Google Scholar] [CrossRef]
- Nedelcu, R.; Olsson, P.; Thulin, M.; Nyström, I.; Thor, A. In vivo trueness and precision of full-arch implant scans using intraoral scanners with three different acquisition protocols. J. Dent. 2023, 128, 104308. [Google Scholar] [CrossRef]
- Oh, K.C.; Park, J.M.; Moon, H.S. Effects of Scanning Strategy and Scanner Type on the Accuracy of Intraoral Scans: A New Approach for Assessing the Accuracy of Scanned Data. J. Prosthodont. 2020, 29, 518–523. [Google Scholar] [CrossRef] [PubMed]
- Revilla-León, M.; Kois, D.E.; Kois, J.C. A guide for maximizing the accuracy of intraoral digital scans. Part 1: Operator factors. J. Esthet. Restor. Dent. 2022. [Google Scholar] [CrossRef]
- Rehmann, P.; Sichwardt, V.; Wöstmann, B. Intraoral Scanning Systems: Need for Maintenance. Int. J. Prosthodont. 2017, 30, 27–29. [Google Scholar] [CrossRef] [PubMed]
- Abduo, J.; Elseyoufi, M. Accuracy of Intraoral Scanners: A Systematic Review of Influencing Factors. Eur. J. Prosthodont. Restor. Dent. 2018, 26, 101–121. [Google Scholar] [CrossRef]
- Rotar, R.N.; Faur, A.B.; Pop, D.; Jivanescu, A. Scanning Distance Influence on the Intraoral Scanning Accuracy—An In Vitro Study. Materials 2022, 15, 3061. [Google Scholar] [CrossRef]
- Jivănescu, A.; Bara, A.; Faur, A.B.; Rotar, R.N. Is there a significant difference in accuracy of four intraoral scanners for short-span fixed dental prosthesis? A comparative in vitro study. Appl. Sci. 2021, 11, 8280. [Google Scholar] [CrossRef]
- Carbajal Mejía, J.B.; Wakabayashi, K.; Nakamura, T.; Yatani, H. Influence of abutment tooth geometry on the accuracy of conventional and digital methods of obtaining dental impressions. J. Prosthet. Dent. 2017, 118, 392–399. [Google Scholar] [CrossRef]
- Gómez-Polo, M.; Piedra-Cascón, W.; Methani, M.M.; Quesada-Olmo, N.; Farjas-Abadia, M.; Revilla-León, M. Influence of rescanning mesh holes and stitching procedures on the complete-arch scanning accuracy of an intraoral scanner: An in vitro study. J. Dent. 2021, 110, 103690. [Google Scholar] [CrossRef]
- Ali, I.E.; Hattori, M.; Sumita, Y.I.; Wakabayashi, N. Effect of cut-out rescan procedures on the accuracy of an intraoral scanner used for digitizing an ear model: An in vitro study. J. Prosthodont. Off. J. Am. Coll. Prosthodont. 2022. [Google Scholar] [CrossRef]
- Revilla-León, M.; Quesada-Olmo, N.; Gómez-Polo, M.; Sicilia, E.; Farjas-Abadia, M.; Kois, J.C. Influence of rescanning mesh holes on the accuracy of an intraoral scanner: An in vivo study. J. Dent. 2021, 115, 103851. [Google Scholar] [CrossRef]
- Sachs, C.; Groesser, J.; Stadelmann, M.; Schweiger, J.; Erdelt, K.; Beuer, F. Full-arch prostheses from translucent zirconia: Accuracy of fit. Dent. Mater. 2014, 30, 817–823. [Google Scholar] [CrossRef] [PubMed]
- Alajaji, N.K.; Bardwell, D.; Finkelman, M.; Ali, A. Micro-CT Evaluation of Ceramic Inlays: Comparison of the Marginal and Internal Fit of Five and Three Axis CAM Systems with a Heat Press Technique. J. Esthet. Restor. Dent. 2017, 29, 49–58. [Google Scholar] [CrossRef] [PubMed]
- Krämer, N.; Lohbauer, U.; Frankenberger, R. Adhesive luting of indirect restorations. Am. J. Dent. 2000, 13, 60D–76D. [Google Scholar] [PubMed]
- Roperto, R.; Assaf, H.; Soares-Porto, T.; Lang, L.; Teich, S. Are different generations of CAD/CAM milling machines capable to produce restorations with similar quality? J. Clin. Exp. Dent. 2016, 8, e423–e428. [Google Scholar] [CrossRef]
- Goujat, A.; Abouelleil, H.; Colon, P.; Jeannin, C.; Pradelle, N.; Seux, D.; Grosgogeat, B. Marginal and internal fit of CAD-CAM inlay/onlay restorations: A systematic review of in vitro studies. J. Prosthet. Dent. 2019, 121, 590–597.e3. [Google Scholar] [CrossRef]
- Kim, D.Y.; Kim, J.H.; Kim, H.Y.; Kim, W.C. Comparison and evaluation of marginal and internal gaps in cobalt–chromium alloy copings fabricated using subtractive and additive manufacturing. J. Prosthodont. Res. 2018, 62, 56–64. [Google Scholar] [CrossRef]
- Kale, E.; Seker, E.; Yilmaz, B.; Özcelik, T.B. Effect of cement space on the marginal fit of CAD-CAM-fabricated monolithic zirconia crowns. J. Prosthet. Dent. 2016, 116, 890–895. [Google Scholar] [CrossRef]
- Sailer, I.; Fehér, A.; Filser, F.; Gauckler, L.J.; Lüthy, H.; Hämmerle, C.H.F. Five-year clinical results of zirconia frameworks for posterior fixed partial dentures. Int. J. Prosthodont. 2007, 20, 383–388. [Google Scholar]
- Holmes, J.R.; Bayne, S.C.; Holland, G.A.; Sulik, W.D. Considerations in measurement of marginal fit. J. Prosthet. Dent. 1989, 62, 405–408. [Google Scholar] [CrossRef]
- Son, K.; Lee, S.; Kang, S.H.; Park, J.; Lee, K.-B.; Jeon, M.; Yun, B.-J. A Comparison Study of Marginal and Internal Fit Assessment; Methods for Fixed Dental Prostheses. J. Clin. Med. 2019, 8, 785. [Google Scholar] [CrossRef]
| Disclaimer/Publisher’s Note: The statements, opinions and data contained in all publications are solely those of the individual author(s) and contributor(s) and not of MDPI and/or the editor(s). MDPI and/or the editor(s) disclaim responsibility for any injury to people or property resulting from any ideas, methods, instructions or products referred to in the content. |
© 2023 by the authors. Licensee MDPI, Basel, Switzerland. This article is an open access article distributed under the terms and conditions of the Creative Commons Attribution (CC BY) license (https://creativecommons.org/licenses/by/4.0/).
