Abstract
The soil engineering geological characteristics and hidden fault creep activity are the main geological factors affecting the stability of the Beijing–Zhangjiakou high-speed railway foundation. In order to reveal the deep formation structure and physical and mechanical properties of the soil under the Beijing–Zhangjiakou high-speed railway foundation and explore the influence of soil settlement under the static load and dynamic load of high-speed railways, according to the deep-hole engineering geological drilling and soil test, this paper reveals the soil structure and physical and mechanical properties within a 500 m buried depth of the Huailai section of the Beijing–Zhangjiakou high-speed railway. Based on the drilling data, we constructed a 3D geological structure model across fault segments to study the influence mechanism of the dynamic load of trains on differential ground settlement. The results show that the basic physical and mechanical parameters of all kinds of soil have little change with the increase of buried depth, and the ratio of secondary consolidation index Cs to compression index Cc is 0.0036–0.0516. Under the dynamic load of a high-speed train, the vertical displacement of soil gradually decreases with the increase of depth, which mainly affects the soil within a 50 m depth. Within the influence range, the vertical displacement at a certain point is negatively correlated with the speed of a high-speed railway and the horizontal distance from the railway line and the fault. The research results are expected to provide scientific support for the safe operation of the Beijing–Zhangjiakou high-speed railway.
1. Introduction
The Beijing–Zhangjiakou high-speed railway is the world’s first high-speed railway with a maximum designed speed of 350 km/h through the region with high cold and sandstorms. It played an important role as a transport hub during the 2022 Winter Olympics. With a total length of 174 km, the main high-speed railway line is an important link in the planning and construction of China’s “eight vertical and eight horizontal” high-speed railway main passages, as well as an important transport link to realizing the “Beijing–Tianjin–Hebei integration” and promote the “Beijing–Tianjin–Hebei coordinated development”.
The differential settlement of the subgrade is the main engineering geological problem in railway construction, operation and maintenance. This problem exists in many high-speed railways, such as the Beijing–Tianjin high-speed railway (Beijing section), the Beijing–Shanghai high-speed railway (Tianjin, Suzhou–Wuxi–Changzhou section) and the Lu Nan high-speed railway (Heze, Jining section) [1,2,3,4]. The research shows that the load is the main external cause of the settlement of railway subgrade, and the difference of subgrade geotechnical engineering characteristics is the main internal cause.
The predecessors have studied the differential settlement of the subgrade, considering the train load as a static load, and achieved fruitful results [5,6,7,8,9,10]. In the early stage, Seed et al. (1955) started the research on the strength and deformation of soil under a dynamic load by studying the relationship between the number of cycles and the total deformation of soil [11]. Monismith et al. (1975) proposed the exponential cumulative plastic strain formula on the basis of the experimental study to predict the subgrade settlement under the dynamic load of trains [12]. Huang et al. (2010) studied the influence of consolidation conditions and dynamic stress ratio on soil stiffness attenuation characteristics by using dynamic triaxial tests, and established a soil stiffness attenuation model reflecting static and dynamic eccentricity stresses [13]. Under the action of the cyclic dynamic load of a train, the settlement of different engineering geological conditions is different, which leads to the differential settlement of the high-speed railway foundation and threatens the operational safety of the high-speed railway [1]. Under the condition of high-speed running, the effect of the train’s dynamic load on a railway track is intensified, and affects the cumulative deformation and dynamic stability of the subgrade [14,15,16]. With the rapid development of computer technology and calculation methods, the numerical calculation method has been widely used in dynamic response analysis of the subgrade [17,18,19]. Scholars have used finite element methods to analyze the dynamic characteristics of a high-speed railway subgrade system and obtained fruitful results [20,21]. However, these studies are mainly based on the dynamic response in the continuous rock and soil medium, and they focus on the subgrade response characteristics. There are few reports on the response characteristics of soil in the ground of high-speed train crossing faults. Some scholars have carried out research on railway lines’ crossing ground fracture sites. Wang (2020) studied the Daxi (Datong–Xi’an) high-speed railway across the ground fracture in Taiyuan Basin, Shanxi Province by combining a field test, laboratory test, theoretical analysis and dynamic finite element numerical simulation. The research provided a scientific basis for the design of a high-speed railway foundation across the ground fracture zone [22]. Zhu (2019) analyzed the formation background, development status and distribution characteristics of ground fractures along the Neima railway. Combined with a large-scale indoor physical model test and numerical simulation, he studied the formation mode and propagation mechanism of ground fractures, but did not consider the related influence of ground fractures on the Neima railway [23]. Jiang et al. (2018) simulated the differential settlement of subgrade in the steep slope section of the Neima railway across the East African Rift Valley, but did not consider the influence of the upper load on the subgrade [24].
The landforms along the Beijing–Zhangjiakou high-speed railway are changeable. Among them, the Huailai section in Zhangjiakou is located on the compound of the Huaizhuo Basin and Yanfan Basin, and the Quaternary overburden is thick. In the basin, hidden active faults are developed, and the high-speed railway passes through the intersection of the Yanfan Basin northern margin fault and the Tumu–Huangtuyao fault. This key tectonic site is active today [25,26]. The difference of soil engineering geological characteristics and the ground subsidence caused by a creep of hidden faults in the basin will undoubtedly affect the long-term safe operation of the Beijing–Zhangjiakou high-speed railway.
The stratigraphic structure 500 m deep of a major project such as a high-speed railway has not been disclosed to the public. Previous studies on the deformation of high-speed railway foundations are limited to the long-term creep of static load or cyclic loading of dynamic load, and the deformation of a high-speed railway foundation across hidden active faults under different dynamic loads has not been considered. Considering the subgrade differential settlement of the Beijing–Zhangjiakou high-speed railway, this paper takes the Beijing–Zhangjiakou high-speed railway (Huailai section) as the research object and reveals the deep soil stratum structure of the key tectonic site through deep-hole drilling. Based on the representative soil geotechnical tests, this paper studies the law of the physical and mechanical parameters of the drilled core soil in the key tectonic site changing with depth, and reveals the compression characteristics of the high-speed railway foundation under a static load. Furthermore, we constructed a three-dimensional geological structure model of soil based on faults, and take a reasonable train load model to simulate the impact of a high-speed train dynamic load considering the fault effects on land subsidence at different speeds. This will provide data support for the safe operation and deformation monitoring of the Beijing–Zhangjiakou high-speed railway, and also provide basic scientific and technological support for the planning and construction of similar major projects across the tectonic plates.
2. The Engineering Geological Background of the Beijing–Zhangjiakou High-Speed Railway (Huailai Section)
2.1. Regional Structural Geology
The Beijing–Zhangjiakou high-speed railway is tectonically located in the Zhangjiakou area on the northern margin of North China Craton, at the intersection of the Taihang Mountain uplift belt, Yanshan uplift belt and Shanxi graben, and at the western segment of the Zhangjiakou–Bohai tectonic belt (Zhangbei–Huailai segment). The tectonic environment is complex (Figure 1a). Geomorphologically, the Zhangjiakou area is divided into two completely different geomorphological units, the Bashang Plateau area and the middle and low mountain basins. The main basins include the Yanqing–Fanshan (Yanfan) Basin, Huailai–Zhuolu (Huaizhuo) Basin, Tianzhen–Yanggao Basin, Yangyuan Basin, Yuxian Basin, Huaian Basin and Xuanhua Basin. In the Zhangjiakou area, the NE-NEE and NW-NWW trending faults are relatively developed (Figure 1b). The NE-NEE trending faults are relatively large in scale and long in extension. The main faults include the Huaizhuo Basin northern margin fault (F8), the Yanfan Basin northern margin fault (F9) and the Sunzhuangzi–Wulonggou fault (F12). The distribution of NW-NWW trending faults is discontinuous and hidden. The main faults are the Ximalin fault (F2), Zhangjiakou fault (F3), Tumu–Huangtuyao fault (F10), Xinbaoan–Shacheng fault (F11) and Shizhuang fault (F13) [27,28,29,30].
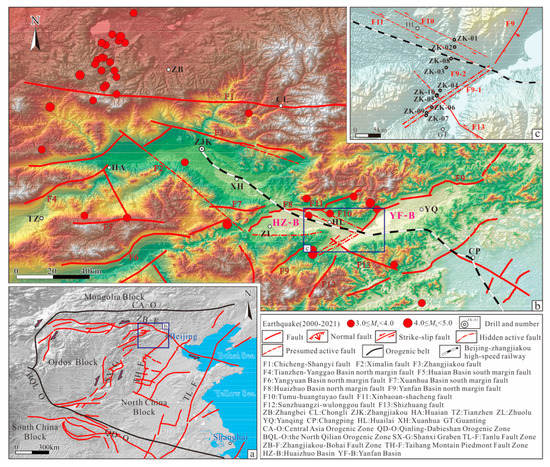
Figure 1.
Tectonic geology diagram of Zhangjiakou area.
The Zhangjiakou area is active in earthquakes. The Zhangbei strong earthquake area, located in the north of Zhangbei County, is one of the three strong earthquake areas in North China. There was an M6.3 earthquake in 1998. The seismic statistics since 2010 show that the main earthquakes in Zhangjiakou are small (M < 3.0), and the other earthquakes spread along the main active faults in the region. Among them, there were 387 M1.0~1.9 earthquakes, 240 M2.0~2.9 earthquakes, 186 M3.0~3.9 earthquakes and 28 M4.0~4.9 earthquakes. No earthquakes more than M5.0 were detected. Most of the earthquakes were concentrated in the Zhangbei strong earthquake area, and the rest were distributed along the main active faults. The Beijing–Zhangjiakou high-speed railway (Huailai section) spans the key tectonic site of the intersection of the Yanfan Basin northern margin fault and Tumu–Huangtuyao fault (Figure 1c). This key tectonic site has the strongest activity and the most complex engineering geological conditions since the Cenozoic era. Therefore, we chose this section as the research area to explore its potential impact on high-speed railway subgrade.
2.2. Typical Borehole Stratum Structure
Due to the thick quaternary overburden layer in the Yanfan Basin, the active faults on its periphery are mostly hidden. In order to reveal the deep stratum structure characteristics, activity mode and activity rate of the key tectonic sites of the Beijing–Zhangjiakou high-speed railway (Huailai section), engineering geological drillings were carried out in the key tectonic site (the upper and footwall of the Yanfan Basin northern margin fault). The borehole position is shown in Figure 1c, and the combined borehole profile is shown in Figure 2.
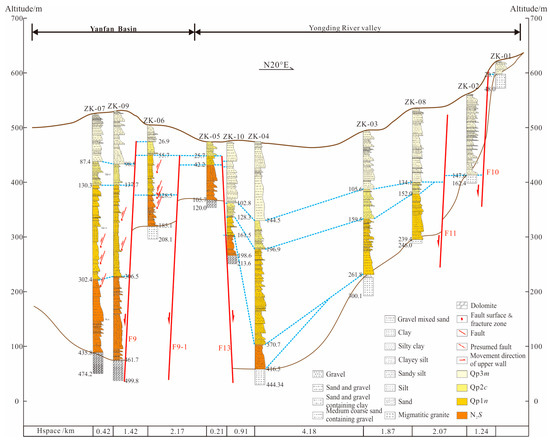
Figure 2.
Combined borehole profile of key tectonic site.
Based on the regional stratigraphic division [31] and combined with the OSL dating results (Table 1), we determined the Cenozoic sedimentary sequence of the Yanfan Basin. Taking ZK-09 as the representative borehole, the stratigraphic structure characteristics of the combined borehole profile in this key tectonic site are as follows (Figure 2 and Figure 3).

Table 1.
OSL dating parameters and test results of samples.
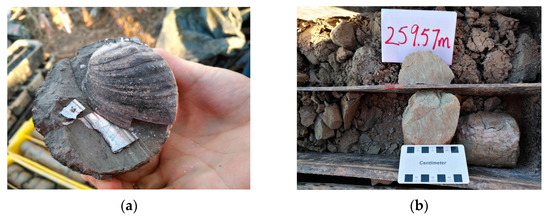
Figure 3.
Typical core characteristics and fault slip surface. (a) Core containing shells; (b) fault slip surface.
The Late Pleistocene Malan Formation (Qp3m): The surface to 98.50 m is mainly clay silt, sandy silt and gravel layers. In 98.50~62.19 m, the particle size of the gravel layer gradually changed from 10 cm to 3–4 cm from the bottom up, and gradually changed to the accumulation of clay silt with the formation cover, indicating the sedimentary environment of riverbeds and low floodplains. From 62.19 m to 44.30 m, the strata changed from gravel to clay and clay silt accumulation again, and coarse-fine sediments mainly formed by riverbed facies and floodplain accumulation were developed. From 44.30 m to the surface, gravel, fine sand, sandy silt and clay silt gradually transition to the surface, indicating that during this period, sand–gravel layer–fine sand and silty silt deposits dominated by riverbed and beach facies were developed, and relatively thin clay silt sediments were retained near the surface, indicating that the riverbed in this area was in a continuous downcutting stage at the end of the late Pleistocene. The movement of the earth’s crust is mainly up and down.
The Middle Pleistocene Chicheng Formation (Qp2c): 98.50~137.70 m, brown-yellow, gray-yellow and gray-black clay, silty clay and clay silt interphase accumulation, intermingled with a fine sand thin layer. There are local calcareous nodules and a small amount of broken shells (Figure 3a), iron and manganese rust, horizontal bedding and alluvial facies. It is revealed that the crust was reactive in this period, and the basin declined and the lake basin shrank under the influence of the Yanfan Basin northern margin fault.
The Lower Pleistocene Nihewan Formation (Qp1n): From 137.70~306.50 m, it is mainly composed of bluish-gray, black-gray and yellow-gray clay, silty clay and local sandy silty thin layers, clay: plastic–hard plastic, horizontal bedding, containing shells, ginger stones and a large number of carbon spots, stink, showing the characteristics of lacustrine facies deposition. There is a high-angle fault slip surface at 259.57 m with obvious scratches (Figure 3b). Sedimentary characteristics indicate that the crust is relatively stable and a set of fluvial lacustrine strata has accumulated.
The Pliocene Shixia Formation (N2s): 306.50~461.70 m is mainly composed of brown, yellow-brown red gravel, coarse sand, medium coarse sand, fine sand and sandy silt layers. From 461.70~381.30 m, it is mainly occasional gravel layers or brown-red sandy silt soil layers and mixed size coarse particles (sand and gravel), showing rapid accumulation characteristics; from 381.30~306.50 m, there is a sand and silt interaction deposition, showing riverbed and beach facies accumulation. This layer has the oldest sediments in the Yanfan Basin, marking the beginning of the formation of the basin.
The Middle Proterozoic dolomite (Pt2): 461.70~499.80 m. The bottom of the rock formation was not visible.
3. Mechanical Parameters of Deep Hole Soil
3.1. Analysis of Soil Basic Physical and Mechanical Parameters
Physical and mechanical tests were carried out in accordance with the Geotechnical Testing Procedures (SL237-1999). Basic physical and mechanical parameters such as the natural water content, natural density, soil grain specific gravity, liquid limit, plastic limit, plastic index and burning loss of soil were tested for each depth of soil. The liquid limit is measured according to the water content corresponding to the sinking of 10 mm by the 76 g watt conical instrument commonly used in China. The basic physical and mechanical parameters of the soil are shown in Table 2.
Table 2.
Basic physical and mechanical parameters of soil.
According to the experimental results, we analyzed the variation trend of the basic physical and mechanical parameters of the soil with depth. Different types of soil have different physical and mechanical properties, so we divided soils into three categories: silt, silty clay and clay, and analyzed their laws, respectively (Figure 4). The classification standard of soil was carried out in accordance with the Code for Investigation of Geotechnical Engineering (GB 50021-2001), (2009 edition) [32].
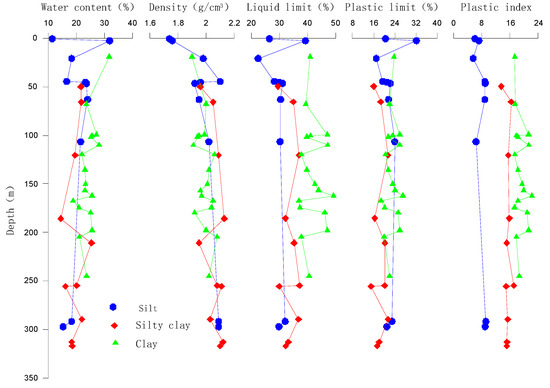
Figure 4.
Diagram of soil’s basic physical and mechanical parameters by burial depth.
As can be seen from Figure 4, the basic mechanical parameters of silt are relatively discrete due to its characteristics of a high silt particle content, low cohesion and easy disturbance. However, on the whole, the natural density of all kinds of soil has little change with the increase of depth. In particular, the density of clay changes little with depth, indicating that the soil is in a good consolidation state and belongs to normal consolidation or over-consolidation. At the same time, the liquid and plastic limits of clay are generally larger than those of silt and silty clay, and fluctuate with the burial depth. The plasticity index of all kinds of soils did not change significantly with depth, indicating that the external interference was low and the depositional environment was relatively simple during the depositional process. Because of the existence of underground water, the relationship between natural water content and buried depth is not a significant trend. However, the water content of silt is greater than that of the other two kinds of soil at a similar depth, which is related to the silt’s large particles, large pores and high water content.
3.2. Soil Compression Characteristic
Soil compressibility is not only related to the basic properties such as composition, state and structure, but also related to the stress conditions of soil. In current civil construction, the layered summation method is the most widely used settlement calculation method. Additionally, it is also the settlement calculation method stipulated in the Code for Design of Building Foundation (GB 50007-2011). The total settlement S consists of consolidation settlement Sc and secondary consolidation settlement Ss.
In each layer, the consolidation settlement amount is calculated by Formula (1)
In the formula, Sc—compressive deformation of layered soil, m; Cc—compression index; H—soil layer thickness, m; e0—initial void ratio of soil layer; p1, p2—vertical stresses at the top and bottom of soil layers, kPa.
In each layer, the secondary consolidation settlement is calculated by Formula (2)
In the formula, Ss—secondary consolidation compression deformation of layered soil, m; Cs—secondary consolidation index; t1—time of demarcation point between primary and secondary consolidation of soil mass, s; t2—the time to obtain the amount of secondary consolidation settlement, s.
Therefore, the total settlement of soil St is
The influence of foundation deformation on a high-speed railway is mainly manifested in the compression characteristics and shear strength of soil. Therefore, we carried out high pressure consolidation tests, direct shear tests and triaxial undrained consolidation tests. The mechanical strength parameters of soil are shown in Table 3.
Table 3.
Table of soil mechanical strength parameters.
From Formulas (1) and (2), it can be seen that the main parameters affecting the soil settlement are the vertical stresses p, the thickness H, the initial void ratio e0, the compression index Cc and the secondary consolidation index Cs. When the vertical pressure and soil thickness are known, e0, Cc and Cs of each soil layer are the direct influencing parameters of settlement calculation. Therefore, we just need to analyze the relationship between these three parameters.
From Figure 5, there is an obvious linear relationship between soil initial void ratio e0 and its natural water content ω. The slope of e0 and the natural water content ω is 0.0262. We obtained an empirical Formula (4).
e0 = 0.0262ω + 0.0697 R2 = 0.92
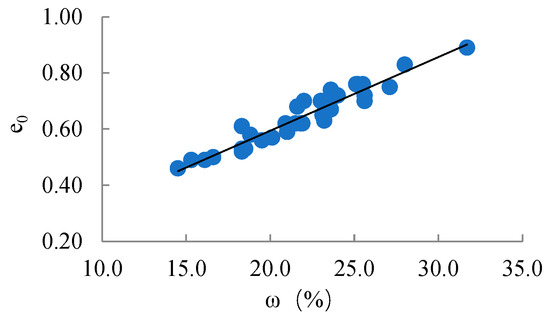
Figure 5.
Correlation diagram of initial void ratio e0 and natural moisture content ω in soil.
Park et al. (2004) proposed that there was a highly linear relationship between Cc/e0 and Cc of Japanese Ariming clay, and it was independent of soil layer sensitivity [33]. Wei et al. (1980) analyzed the relationship between Cc and e0 of the 3rd and 4th layers of clay in Shanghai [34]. Azzouz (1976), Nagaraj (1986) and Gao et al. (1986) gave the empirical formula between Cc and e0 of a certain layer or a certain soil property [35,36,37]. As can be seen from Figure 6, there is a linear relationship between Cc/e0 and Cc, the correlation is independent of soil property and the slope of Cc/e0 and Cc is 1.2413. Therefore, we obtained the empirical formula between Cc and e0, which is independent of soil property and burial depth.
Cc/e0 = 1.2413Cc + 0.0255 R2 = 0.89
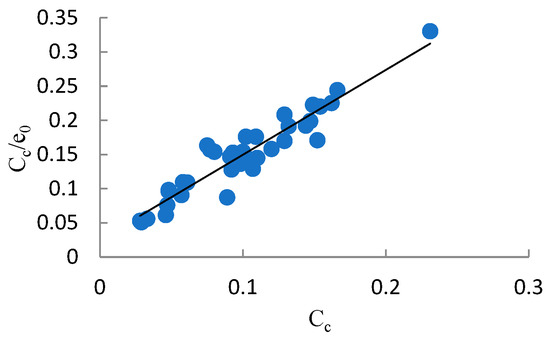
Figure 6.
Correlation diagram of Cc/e0 and Cc in soil.
Formula (4) can be used to calculate the initial void ratio of soil after a simple water content test when all test conditions are not available in field operations. Then, from Formula (5), the compression index of soil can be deduced. Based on this, engineers can make a preliminary assessment of the compactness and compression characteristics of the soil.
Mesri et al. (1977) pointed out that the ratio of Cs/Cc was between 0.025 and 0.10 [38]. Meng et al. (2012) concluded that the ratio of Cs/Cc in the Beijing plain was between 0.0099 and 0.0108 [39]. In this paper, we also statistically analyzed the ratio in the Zhangjiakou area (Table 4).
Table 4.
Relationship between soil secondary consolidation index and compression index.
From Table 4, the ratio of Cs/Cc in Zhangjiakou is between 0.0036 and 0.0516, which can be considered as a constant. The ratio has almost no change in different soil layers and different buried depths. Therefore, the initial void ratio e0, compression index Cc and secondary consolidation index Cs of soil can be preliminarily determined according to the Formulas (4) and (5) when the water content is known. In this way, the final settlement of the soil foundation can be preliminarily estimated under the condition that the thickness of the overlying soil and external load are known. This can be used in the early stage of the engineering investigation. It is convenient for engineers to determine whether a foundation treatment is necessary and what treatment plan to adopt.
4. Simulation Analysis of Differential Settlement across Fault Subgrade under Cyclic Dynamic Load of High-Speed Railway
Under the cyclic dynamic load of a high-speed railway, the development of active faults in different areas, engineering geological conditions and human activities will affect the safe operation of the high-speed railway. The Beijing–Zhangjiakou high-speed railway (Huailai section) is mainly located in the Yanfan Basin. In the basin, the Quaternary system is thick, hidden active faults are developed and the soil structures are relatively complex. In different sections, the engineering properties of soil are different and the response of the soil to train the dynamic load is also different. There are different speed requirements for regular and cross-line trains (interim regulations on the design of new passenger-dedicated railway lines with a speed of 300–350 km/h). During the process of starting and stopping, the speed of the train also changes. The change of the train speed changes the load and frequency of the track subgrade, leading to corresponding changes in the dynamic response of the subgrade. The problems of dynamic stability and the subsequent settlement of the subgrade become more prominent. ANSYS is simple and convenient to operate and has become the most popular finite element analysis software in the world. It has been widely used in geotechnical engineering. This paper used ANSYS to analyze the settlement of soil along the Beijing–Zhangjiakou high-speed railway line. Therefore, based on the ANSYS 14.5 simulation software, taking the Beijing–Zhangjiakou high-speed railway as the prototype, we studied the influence mechanism of dynamic load on land subsidence under the condition of crossing faults and different speeds.
4.1. Geological Model
According to the stratigraphic structure revealed by engineering geological drilling, it can be inferred that the Yanfan Basin northern margin fault (F9) is a normal fault (Figure 2), which is a strong active fault since the late Pleistocene. The fault strike is NE, and the dip angle is about 60~80°. In the Middle Pleistocene clay (Qp2c), the fault displacement is about 68 m. In the Lower Pleistocene organic clay (Qp1n), the fault displacement is about 82 m. In the Neogene silty clay (N2s), the fault displacement is 178 m and the separation in the bedrock is 277 m.
According to the stratum structure exposed by the borehole (Figure 2), we established a simplified three-dimensional geological structure model of the Beijing–Zhangjiakou high-speed railway (Huailai section) across active faults. Considering the boundary effect and size effect in the numerical simulation, along the high-speed railway line, the model is 500 m long, 200 m deep and 200 m wide. The dip angle of the active fault F9 is 60°. The fault displacement in the Middle Pleistocene clay (Qp2c) is 70 m, and the fault displacement in the Lower Pleistocene organic clay layer (Qp1n) is 80 m. The schematic diagram of the three-dimensional geological model is shown in Figure 7. Based on the drilling data, the hanging wall was divided into eight layers and the footwall into six layers. The soil was regarded as an elastic-plastic material. The Drucher–Prager model was used, and the parameters were selected based on laboratory tests and empirical values. The calculation parameters of soil in different depths are shown in Table 5.
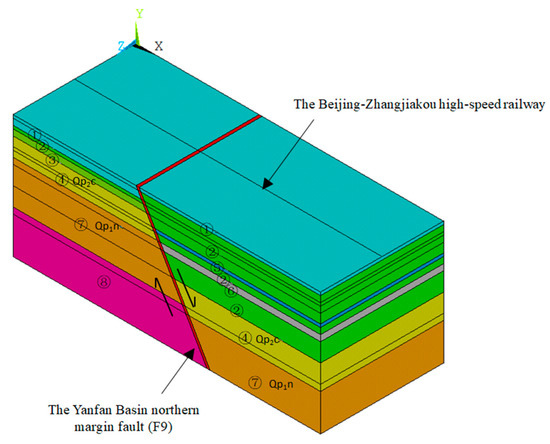
Figure 7.
The 3D geological model considering the fault.
Table 5.
The parameters of each soil layer.
4.2. Mathematical Model
The paper uses the SOLID185 element to mesh the model (Figure 8). The element is defined by eight nodes, and each node has three degrees of freedom that translate along the x, y and z directions. The unit has the characteristics of superelasticity, stress toughening, creep, large strain capacity and large deformation. The 3D geological model was constructed through the finite element modeling technique. As the model is far away from the Guanting reservoir, groundwater seepage is not considered in this paper. The normal displacement constraints are applied to the front, back, left and right sides of the model, respectively. The vertical displacement constraints are applied to the bottom boundary of the model, and the top of the model is a free surface without any constraints. Triangle meshing is adopted and the mesh size is 10 m. Using free grid division, the number of elements is 24,197 and the number of nodes is 5276. The simulation time is different for different train velocities. Using a period of vibration, the simulation time for 200 km/h, 250 km/h, 300 km/h and 350 km/h is 0.45 s, 0.36 s, 0.3 s and 0.26 s, respectively.
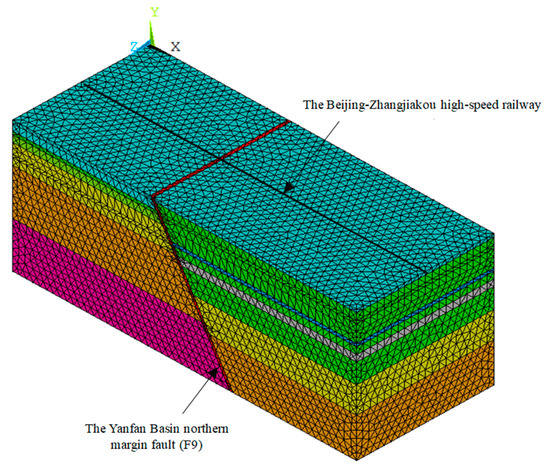
Figure 8.
The 3D mathematical mode considering the fault.
During the meshing stage, a coarse grid division was first made, and then the fine grid division was made. In the calculations, it was found that they were convergent at one point. So, the error was considered negligible. The selection of elastic modulus, Poisson ratio, density and other physical and mechanical parameters are based on laboratory tests and empirical values. We did not use other values of the parameters to analyze their effect on the results. However, we can still find that the value of elastic modulus and density affects the modeling results significantly. For example, the values of the two parameters of the active fault are both lower than other soil layers, and the vertical displacement is the maximum.
According to the existing research results [25,29,40], the relative vertical motion rates of the upper and footwall of the Yanfan Basin northern margin fault (F9) are determined to be 1.0~1.9 mm/a, and the relative sliding rate along the fault plane is 2.2 mm/a after conversion using the maximum velocity.
4.3. Train Dynamic Load
There are many methods to determine the train vibration load. The wheel–rail force time history obtained from the analysis of the unsmoothness spectrum and vehicle–track coupling dynamics of the rail inspection vehicle is relatively close to the reality, but the calculation process is complicated. According to the research of the British Railway Technology Center, it is reasonable to consider the train vibration load with vertical wheel–rail force.
F(t) = P0 + P1sinω1t + P2sinω2t + P3sinω3t)
In the formula, P0—static load of the wheel; P1, P2 and P3—the vibration load amplitude of a typical value in the stable running condition of I, additional dynamic load of II, waveform wear of III and control conditions, respectively; M0—unsprung mass of train; hi—height of the vector; ωi—vibration PI of the rail; vi—train speed; Li—wavelength of the geometrically unsmooth curve. Table 6 lists the values of the related parameters.
Table 6.
Geometric irregularity management value for UK track.
In this paper, the train dynamic load is simplified into a sum of static load and sine function.
F(t) = P0 + Psinωt
In the Formula (9), t—time, s; P0—static load of the wheel, kN; ω—vibration PI of the rail; P—corresponding vibration load, kN.
P = M0 hω2
In the Formula (10), M0—unsprung mass of train, kg; h—height of the vector, mm.
Taking CRH2 train as an example, the unsprung mass of the train is 750 kg, the static load of the wheel is 70 kN and the dynamic load directly imposed on the soil at different speeds is shown in Table 7.
Table 7.
Conversion table of train speed and dynamic load.
4.4. Simulation Results
Different train types and operating speeds result in different train dynamic loads. Taking the CRH2 train (the unsprung mass of the train is 750 kg, the static load of the wheel is 70 kN) as an example, we analyzed the influence of four different speeds (200 km/h, 250 km/h, 300 km/h and 350 km/h) on subgrade deformation.
When the vehicle speed is 200 km/h, the dynamic load F(t) = 10.5 + 0.31sin(17.46t) kN. We calculated the vertical displacement distribution curves of the soil in different depths (Figure 9). The vertical displacement distribution of the surface soil perpendicular to the direction of the high-speed railway line and different distances from the fault can also be calculated (Figure 10).
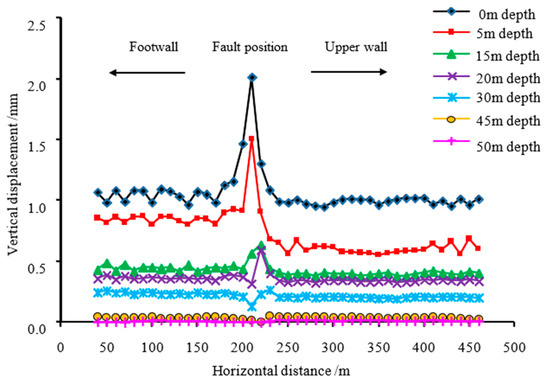
Figure 9.
Distribution curves of vertical displacement at different depths along the high-speed railway line at the speed of 200 km/h.
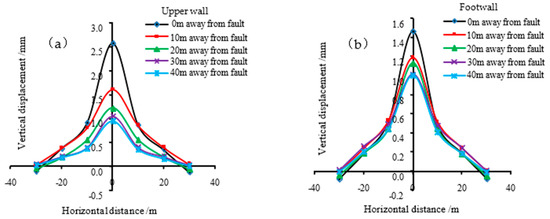
Figure 10.
Vertical displacement distribution curves of surface soil at different distances from the fault and perpendicular to the high-speed railway line. (a) At different distances of the upper wall; (b) at different distances of the footwall.
As shown in Figure 9, the maximum vertical displacement occurs at the fault. With the increase of depth, the vertical displacement gradually decreases, and the affected depth is about 50 m. From Figure 10, the vertical displacement decreases with the increase of the distance from the fault. The displacement curves of the upper and footwall basically coincide 30 m away from the fault, and the influence range of the fault is about 60 m. As the distance from the railway line increases, the vertical displacement decreases, and the influence width of the train dynamic load is about 60 m.
Based on the above simulation calculation method, we drew the influence curves of four different vehicle speeds on the vertical displacement of the surface soil (Figure 11) and the distribution of the vertical displacement of the surface soil perpendicular to the high-speed railway line and 0 m from the fault at different vehicle speeds (Figure 12). As can be seen from Figure 11, the vertical displacement gradually decreases with the increase of vehicle speed. This phenomenon may be caused by the small dynamic load at a low vehicle speed, but its operation time is longer, resulting in a relatively large vertical displacement. From Figure 12, with the increase of the speed, the influence width of the train dynamic load decreases from 60 m to 40 m.
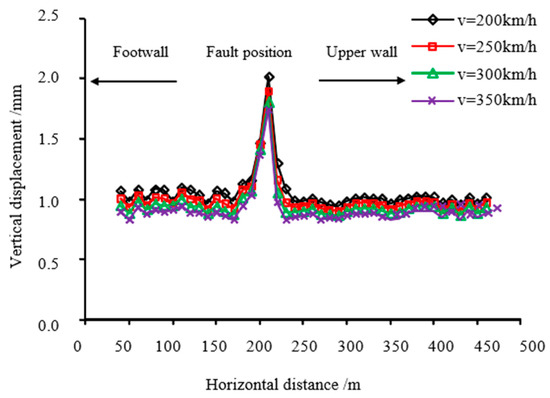
Figure 11.
Vertical displacement distribution curve of surface soil along high-speed railway line at different vehicle speeds.
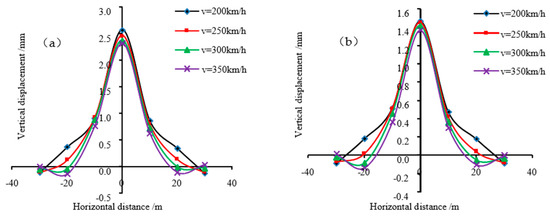
Figure 12.
Vertical displacement distribution curves of surface soil at 0 m away from the fault and perpendicular to the high-speed railway line. (a) Upper wall 0 m away from the fault; (b) footwall 0 m away from the fault.
5. Discussion
5.1. Selection of Physical and Mechanical Parameters of Mathematical Model
During the establishment of a 3D geological structure model of a cross-active fault foundation, dynamic tests were not carried out on the soil samples. The selection of physical and mechanical parameters of the soil is based on conventional laboratory tests and empirical values. Zhang (2018) used dynamic triaxial test results to analyze the relationship between dynamic stress and dynamic strain under different frequencies on the deformation characteristics of the Beijing–Zhangjiakou high-speed railway (Guanting section) [41]. Through the test and simulation, he pointed out that when the train vibration frequency is 2 Hz, the influence on the subgrade deformation is greater than that when the train vibration frequency is 3 Hz (the dynamic load frequency of 2 Hz and 3 Hz roughly correspond to the speed of a high-speed train of 200 km/h and 300 km/h [42]). The conclusion is similar to the results obtained in this paper by using conventional soil physical and mechanical parameters to build a geological model. Therefore, combined with reasonable train dynamic load, the selection of parameters obtained from conventional physical and mechanical tests has little influence on the analysis results.
5.2. Discussion on the Reasonable Loading Mode of Dynamic Load in Numerical Simulation
The numerical simulation results show that the dynamic stress range of surface soil along the high-speed railway is 0.5~1.2 kPa (Figure 13), which is basically consistent with the measured value (about 1~1.5 kPa) [21,43]. So, it can be considered that the loading mode of dynamic load is reasonable in numerical simulation.
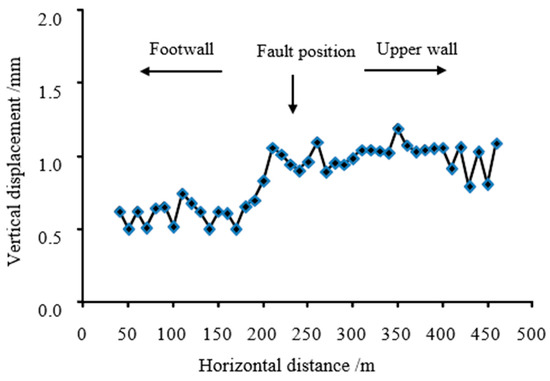
Figure 13.
Dynamic stress distribution curve of surface soil along high-speed railway line.
5.3. Comparison between Numerical Simulation Results and Actual Subgrade Settlement
According to the above numerical simulation analysis, the maximum vertical displacement of the subgrade occurs at the fault. With the increase of the underlying soil depth, the vertical displacement gradually decreases, and the affected depth is about 50 m. Combined with InSAR data monitoring after high-speed rail operation, this conclusion is consistent with the actual monitoring results. In the later stage, we will continuously monitor and analyze the subgrade deformation after one year, two years and five years to correct the accuracy of the model.
6. Conclusions
This paper analyzed the borehole engineering geological characteristics of the key tectonic site of the Beijing–Zhangjiakou high-speed railway. Through deep-hole drilling, the stratigraphic lithology, structure and faults distribution characteristics of the Beijing–Zhangjiakou high-speed railway (Huailai section) were revealed at a depth of about 500 m. Through experimental analysis, this paper reveals that the sedimentary environment of the underlying soil along the Beijing–Zhangjiakou high-speed railway is relatively stable with less external interference. The empirical formula of the initial pore ratio with water content and compression index is given.
Through the ANSYS simulation, the differential settlement under the action of train dynamic load at different speeds is analyzed. Through the analysis, it can be found that the values of elastic modulus and density have a significant impact on the modeling results. Under the dynamic load of the high-speed railway, the vertical displacement of soil gradually decreases with the increase of depth. The depth range of the dynamic load is 50 m. Within the influence range, the vertical displacement at a certain point is negatively correlated with the speed of the high-speed railway and the horizontal distance from the railway line and fault. In future work, the soil deformation caused by the joint action of train dynamic load and fault creep will be deeply analyzed, and the monitoring data will be integrated to monitor the influence of various factors on the soil deformation caused by the operation of the high-speed railway for one year, two years, five years and ten years.
Author Contributions
Conceptualization, J.M., C.F. and Y.W.; data curation, B.Q. and Y.F.; formal analysis, J.M. and M.W.; funding acquisition, J.M. and C.T.; investigation, P.Z. and M.W.; methodology, J.M. and C.T.; project administration, C.F. and C.T.; resources, C.F. and Y.W.; software, M.W. and J.L.; supervision, J.M. and C.F.; validation, J.M. and Y.W.; visualization, J.M. and Y.F.; writing—original draft, J.M.; writing—review and editing, C.F. and M.W. All authors have read and agreed to the published version of the manuscript.
Funding
This research was funded by the China Geological Survey, grant numbers: DD20221738, DD20190317 and DD20160267.
Institutional Review Board Statement
Not applicable.
Informed Consent Statement
Not applicable.
Data Availability Statement
All data can be obtained from the corresponding author by request.
Acknowledgments
The authors would like to thank Li Bin for his guidance and all the team members of the “Beijing–Tianjin–Hebei Project Team”.
Conflicts of Interest
The authors declare no conflict of interest.
References
- Liu, H.H.; Zhang, Y.Q.; Wang, R.; Gong, H.-L.; Gu, Z.-Q.; Kan, J.-L.; Luo, Y.; Jia, S.-M. Monitoring and analysis of land subsidence along the Beijing-Tianjin high-speed rail-way (Beijing section). Chin. J. Geophys. 2016, 59, 2424–2432. [Google Scholar]
- Wang, Y.B.; Zhang, X.Z. Spatial interpolation methods of surface subsidence in Tianjin region of Beijing-Shanghai high-speed railway. Bull. Surv. Mapp. 2009, 12, 19–22. [Google Scholar]
- Liu, F.S. Analysis on developing tendency of land subsidence around Suzhou-Wuxi-Changzhou area as well as its impacts on Beijing-Shanghai high-speed railway. Railw. Investig. Surv. 2011, 1, 33–37. [Google Scholar]
- Yue, J.G. Analysis on the current situation and causes of land subsidence along the Lunan high speed railway. Railw. Investig. Surv. 2020, 2, 60–65. [Google Scholar]
- Chen, S.H.; Cui, J.J.; Luo, Q.; Wang, X.; Wang, Y.F.; Wang, Y.W. Prediction and analysis of subgrade settlement of medium-low compression soil for high-speed railway. Railw. Stand. Des. 2023, 67, 1–7. [Google Scholar]
- Zhou, C.B.; Li, N.; Ye, D. Analysis on deformation characteristics of existing high-speed railway widened subgrade with deep compressible foundation. Subgrade Eng. 2021, 6, 81–87. [Google Scholar]
- Xu, Y.B. Research on Creep Characteristics and Reinforcement Effect of Soft Rock of High-Speed Railway Foundation under Water Soaking. Master’s Thesis, Liaoning Technical University, Liaoning, China, 2021. [Google Scholar]
- Shen, K. Impacts and Solutions of the Regional Land Subsidence to the Subgrade of (Beijing-Shanghai) High-Speed Railway. Master’s Thesis, Southwest Jiaotong University, Chengdu, China, 2013. [Google Scholar]
- Wu, L.J. Study on Compressibility and Consolidation of Unsaturated Soil and Reinforced Technique on High-Speed Railway. Ph.D. Thesis, Southwest Jiaotong University, Chengdu, China, 2011. [Google Scholar]
- Jiang, G.L.; Wang, H.L.; Li, A.H. Study on calculation method of subgrade stress of high-speed railway. Railw. Eng. 2009, 4, 65–69. [Google Scholar]
- Seed, H.B.; Chan, C.K.; Monismith, C.L. Effects of repeated loading on the strength and deformation of compacted clay. Highw. Res. Board Proc. 1955, 34, 541–558. [Google Scholar]
- Monismith, C.L.; Ogawa, N.; Freeme, C.R. Permanent deformation characteristics of subgrade soils due to repeated loading. Transp. Res. Rec. 1975, 537, 1–17. [Google Scholar]
- Huang, M.S.; Li, S. Degradation of stiffness and strength of offshore saturated soft clay under long-term cyclic loading. Chin. J. Geotech. Eng. 2010, 32, 1491–1498. [Google Scholar]
- Wu, M.; Meng, S.; Peng, J.B.; Zang, M.; Deng, Y.H. Analysis on dynamic response of embankment of railway passsenger-dedicated line in ground fissure area. Railw. Stand. Des. 2014, 58, 18–22. [Google Scholar]
- Liang, B.; Sun, C.X. A study on the sudden changes or double peaks in the dynamic response of subgrade of high speed railway. China Civ. Eng. J. 2006, 39, 117–122. [Google Scholar]
- Liang, D.; Cheng-Gang, Z.; De-Gou, C.; Qian-li, Z.H.A.N.G.; Yang-sheng, Y.E. Method for dynamic response of subgrade subjected to high-speed moving load. Eng. Mech. 2008, 25, 231–236. [Google Scholar]
- Zhou, Z.Y. Numerical Simulation Analysis of Dynamic Response Characteristics of Subgrade on Wuhan-Guangzhou Passenger Dedicated Line. Master’s Thesis, Central South University, Changsha, China, 2010. [Google Scholar]
- Liu, X.H. Research on Dynamic Stability of Red Clay Subgrade under Ballastless Track of High-Speed Railway. Ph.D. Thesis, Central South University, Changsha, China, 2011. [Google Scholar]
- Qu, C.Z. Dynamic Response and Long-Term Dynamic Stability of Closely Spaced Transition Sections Subgrade for High-Speed Railway. Ph.D. Thesis, Central South University, Changsha, China, 2013. [Google Scholar]
- Guo, Z.G.; Wei, L.M.; Zhou, Z.Y. Numerical simulation and field test of the dynamic stress of ballastless track subgrade. Hydrogeol. Eng. Geol. 2013, 40, 51–57. [Google Scholar]
- Wang, X.; Zhang, J.S.; Wang, Q.Y. Three-dimensional numerical simulation for vehicle dynamic load and dynamic response if ballastless track subgrade. China Earthq. Eng. J. 2014, 36, 857–867. [Google Scholar]
- Wang, T. Research on the Dynamic Stability and Long-Term Settlement of High-Speed Railway Subgrade Crossing Ground Fissure Zone. Master’s Thesis, Chang’an University, Xi’an, China, 2020. [Google Scholar]
- Zhu, F.J. Preliminary Study on the Genetic Mechanism of Ground Fissures along Kenya’s Neima Railway. Master’s Thesis, Chang’an University, Xi’an, China, 2019. [Google Scholar]
- Jiang, Z.S.; Gou, Z.L. Analysis of uneven settlement and influencing factors of steep slope at Nairobi-Malabar Railway. J. Hunan Univ. (Nat. Sci.) 2018, 45, 25–29. [Google Scholar]
- Xu, X.W.; Yu, G.H.; Ran, Y.K.; Yang, X.P.; Zhang, L.M. An Overview of Urban Active Faults in China; Seismological Press: Beijing, China, 2015. [Google Scholar]
- Qi, B.S.; Feng, C.J.; Tan, C.X.; Zhang, P.; Meng, J.; Wang, M.; Zhang, C.; Yang, W.; Lei, X. Study on the regional crustal stability in Zhangjiakou and its adjacent areas. Urban Geol. 2018, 13, 1–14. [Google Scholar]
- Xu, X.W.; Deng, Q.D. The basin-range structure in the tensile area at the northern part of Shanxi province and its mechanism of formation. Earthq. Res. China 1988, 2, 21–29. [Google Scholar]
- Xu, X.W.; Ma, X.Y.; Deng, Q.D. Neotectonic activity along the Shanxi Rift system. Tectonophysics 1993, 219, 305–325. [Google Scholar] [CrossRef]
- Fang, Z.J.; Cheng, S.P.; Ran, Y.K. Yanhuai basin-ridge structure and some features of late quaternary fracture movement. Prog. Geophys. 1993, 4, 274–275. [Google Scholar]
- Wang, H.; Tan, C.; Feng, C.; Qi, B.; Wang, J.; Yang, W.; Zhang, C.; Zhang, P.; Meng, J.; Yang, X.; et al. Activity structure and crustal stability in Beijing-Tianjin-Hebei collaborative development zone. Geol. Bull. China 2022, 41, 1322–1341. [Google Scholar]
- Li, S.Z.; Wang, J.X.; Wang, X.F.; Deng, S.Y.; Lu, X.L.; Tian, Y.P.; Xu, H.C.; Li, X.; Chen, Y.G.; Yang, Y.S.; et al. Lithostratigraphy of Hebei Province; China University of Geosciences Press: Beijing, China, 1996. [Google Scholar]
- Ministry of Construction of the People’s Republic of China. Code for Investigation of Geotechnical Engineering; Ministry of Construction of the People’s Republic of China: Beijing, China, 2002. [Google Scholar]
- Park, J.H.; Koumoto, T. New compression index equation. J. Geotech. Geoenvironmental Eng. 2004, 130, 223–226. [Google Scholar] [CrossRef]
- Wei, D.D.; Hu, Z.X. Experimental study of preconsolidation pressure and compressibility parameters of Shanghai subsoil. Chin. J. Geotech. Eng. 1980, 2, 13–22. [Google Scholar]
- Azzous, A.S.; Krizek, R.J.; Corotis, R.B. Regression analysis of soil compressibility. Soils Found. 1976, 16, 19–29. [Google Scholar] [CrossRef]
- Nagaraj, T.S.; Murthy, B.R.S. A critical reappraisal of compression index equations. Géotechnique 1986, 36, 27–32. [Google Scholar] [CrossRef]
- Gao, D.Z.; Wei, D.D.; Hu, Z.X. Geotechnical Properties of Shanghai Soils and Engineering Applications; ASTM: West Conshohocken, PA, USA, 1986; pp. 161–177. [Google Scholar]
- Mesri, G.; Godlewski, P.M. Time and stress-compressibility interrelationship. J. Geotech. Eng. Div. 1977, 103, 417–430. [Google Scholar] [CrossRef]
- Meng, J.; Wang, Y.L. Experimental investigation about soft cohesive soil coefficient of secondary consolidation in Beijing plain. J. Eng. Geol. 2012, 20, 466–470. [Google Scholar]
- Ran, Y.K.; Fang, Z.J.; Duan, R.T. Model for paleoearthquake recurrence along baying segment of the north margin fault of fanshan basin in Hebei province. Earthq. Res. China 1998, 14, 47–58. [Google Scholar]
- Zhang, S.X. Experimental Study on Deformation Characteristics of the Deeply Pile-Tip Soil under Cyclic Loading-Taking the Guanting Section of Beijing to Zhangjiakou High-Speed Railway as an Example. Master’s Thesis, China University of Geosciences, Beijing, China, 2018. [Google Scholar]
- Yang, P.; Ye, W.M.; Zhang, Y.W. Analysis of dynamic deformation of subgrade soil under dynamic train load. Chin. J. Undergr. Space Eng. 2009, 5, 1166–1169. [Google Scholar]
- He, K.; Peng, J.B.; Huang, Q.B. Simulation test of metro tunnel parallels ground fissure with short distance. Chin. J. Rock Mech. Eng. 2014, 33, 4086–4095. [Google Scholar]
Disclaimer/Publisher’s Note: The statements, opinions and data contained in all publications are solely those of the individual author(s) and contributor(s) and not of MDPI and/or the editor(s). MDPI and/or the editor(s) disclaim responsibility for any injury to people or property resulting from any ideas, methods, instructions or products referred to in the content. |
© 2023 by the authors. Licensee MDPI, Basel, Switzerland. This article is an open access article distributed under the terms and conditions of the Creative Commons Attribution (CC BY) license (https://creativecommons.org/licenses/by/4.0/).