Abstract
A significant issue in the construction sector is poor safety performance. Construction sites are hazardous and prone to crashes, with several risks that can lead to accidents, injuries, or even the deaths of site workers or passing road users. Numerous studies have addressed this topic but there aren’t many studies in Saudi Arabia that are comparable. The purpose of this research is to determine which obstacles are standing in the way of the construction industry’s adoption of health and Safety Program. Starting with literature research, obstacles to the implementation of safety initiatives are noted. An analysis method known as the Partial Least Square Structural Equation Model (PLS-SEM) was utilized to look into additional barriers. It is recommended that a national governance structure be established in order to overcome these barriers and improve safety performance in the construction industry. Decision-makers would move decisively to establish and enhance safety practices in light of the proposed model’s outcomes. By identifying, assessing, and reducing the primary obstacles to safety program implementation, the study’s findings help Saudi Arabia improve safety practices for building projects.
1. Introduction
One of the riskiest industries has always been the construction industry [1]. Unfortunately, the perception of the building sector as one of the occupations with the highest risk of injury has not changed in today’s culture [2]. While safety has significantly improved over the years, the construction industry still has the highest accident rate [3]. For instance, more accidents occur in Saudi Arabia’s construction sector than in any other [4]. However, most countries around the world also have this issue. Even though there are attempts being made to lower the chances of illnesses and injuries in the construction sector in the US, it is nonetheless still regarded as being among the most hazardous industries [5]. An important economic force in Malaysia, construction is one of the most hazardous sectors [6]. Nevertheless, according to international norms, China’s safety records for work sites are subpar [7]. In addition, research suggests that, in comparison to the average across all other industries, the injury and expense rates are the greatest in the construction field [5]. The people and workers may suffer significant effects as a result of accidents that take place in the construction sector [3]. There were approximately 69,241 work-related accidents reported in Saudi Arabia in 2014 [4]. A total of 51.35 percent of these accidents occurred in the construction sector [4]. This large percentage may be caused by a number of factors unique to the construction industry, for example, the fact that construction sites are notably dynamic environments that constantly change [1,3], Thus, it is customary to always have many work teams working in the same region of the site on different tasks, changing as the project proceeds [3]. Since the workers do not share the same history while working in the same location, there may be a variety of hazards. A building site with multiple contractors and subcontractors must be organized in order to reduce the potential for accidents [1]. The low adoption of safety programs on building sites may also be a significant contributor. The risk of workplace injuries or fatalities increases when safety programs are not implemented correctly [8]. For instance, some employees object to safety regulations because they think that they complicate their lives [9], which increases the number of accidents that take place at work because of the numerous dangers there. Regarding the safety and health of workers, a significant number of tasks performed during the implementation process of construction projects are dangerous [3]. They may result in physical injuries, chronic diseases [6], or fatalities [10]. According to a study, the construction industry’s high accident incidence is mostly caused by two things: (1) the inherent risk associated with the setting and unique features of construction projects and organizations; and (2) the increased expense associated with implementing extra safety measures in a competitive industry [3]. The construction business must therefore implement a safety program. Efforts to increase safety through an organized collection of guidelines and operations are referred to as “safety programs” [3]. A safety program is “a systematic combination of activities, processes, and facilities created to establish and maintain a safe and healthy workplace”, the Industrial Accident Prevention Association claims [11]. The responsibility of ensuring that each project is completed without incidents or injuries rests with the construction team, which consists of the client, architect or engineer, contractor, construction manager, subcontractors, and suppliers [12], and it is their obligation to put safety programs in place. Programs for safety are thought to be the primary means of promoting health and safety in construction projects [7]. Since its adoption, accident rates have declined and safe workplace conditions have been established [13,14]. In addition, the implementation of safety programs and the growth of a safety culture have the potential to promote communication between upper management and their staff [15]. Even though their advantages are obvious, Saudi Arabia’s construction industry has only a relatively small number of safety measures in place. Safety efforts are either non-existent or not properly carried out as a result of poor management and a lack of attention to safety. Outdated safety regulations and standards that are not being followed are to blame for the Saudi Arabian construction industry’s poor performance. Construction is regarded as a major cause of workplace accidents in Saudi Arabia. A significant rate of accidents is being caused by the current subpar safety record in the building industry [4]. In order to fill this gap, this research will examine the challenges that the Saudi Arabian construction industry faces in implementing its safety program. By using intervention strategies that are prioritized and employed to address these barriers based on their relevance levels, safety programs can be successfully implemented in this setting.
2. Research History
2.1. Program for Safety
Various researchers have provided a variety of definitions for safety programs. A safety program is “the control of the working environment, equipment, procedures, and personnel with the objective of reducing unintentional injuries and losses in the workplace”, according to Al Haadir and Panuwatwanich [13]. Rowlinson [16] The following objectives were cited as the main focus of safety programs in construction companies: (1) prevent improper behaviour that could cause accidents; (2) make sure that improper behaviour is identified and reported; and (3) make sure that incidents are correctly recorded and handled. Safety programs are made up of a number of different elements, such as safety protocols, safety awareness, accident investigations, internal safety rules, safety incentive programs, control of subcontractors, individual behaviours and attitudes, protective equipment, emergency preparedness, safety promotions, safety record keeping, and job hazard analyses [16]. Additionally, the successful application of safety programs has a number of advantages for the construction industry [17,18]. The reduced accident and sickness rates at work cut the expenses associated with accidents, lowered absence and turnover, enhanced productivity, and increased employee satisfaction [19]. According to Rowlinson [16], the goals of applying safety protocols to construction projects are to stop unnecessary and dangerous behaviours, report risks and hazards, and ensure that occurrences are appropriately recorded and managed. Organizations that have safety procedures in place improve the integrity of their output, boost their reputation, foster better teamwork among employees, and raise revenues, according to Oliveira, et al. [20].
2.2. The Construction Industry’s Obstacles to Implementing a Safety Program
Numerous obstacles to the implementation of safety programs have been highlighted in earlier studies. Members of certain project teams believe that safety officials are the only ones accountable for workplace safety [21,22]. Due to a shortage of qualified labour in the industry in developing countries, some businesses hire unskilled labourers to satisfy the main factor [23,24]. The risks of working on construction sites are not known to these unskilled labourers, nor are they concerned for their safety. Even worse, a lot of construction sites lack a safety officer who can perform routine site inspections. The use of safety programs in the construction sector is further hampered by ineffective accident investigation procedures and an insufficient enforcement of safety laws [25,26]. Tight project timetables are another obstacle that prevent construction businesses from establishing safety programs because they believe that these programs may impede the progress of their projects at a time when they are under pressure to complete the work in a short amount of time [21,27,28]. The ability of management staff to implement safety measures is also impacted by a lack of resources [27]. The poor adherence to safety programs throughout the organization is a result of constraints, including a lack of executive commitment to and knowledge about safety [22,23,29]. Due to all these obstacles, safety is being prioritized less on the job site, which results in a generally bad safety culture [22,23,27]. The main obstacles to the implementation of safety programs are listed in Table 1 based on literature analysis. Furthermore, Buniya, et al. [30] classification was used in the simulation model. The creation of the conceptual model for this study was built on two main stages, namely; 1) identification of model constructs (previous studies) and 2) classification of model constructs, as stated in Buniya, et al. [30] classification [31]. Therefore, the following four assumptions are included in the study’s conceptual model, which was created as a result (Figure 1):

Table 1.
Implementation of the safety program: obstacles.
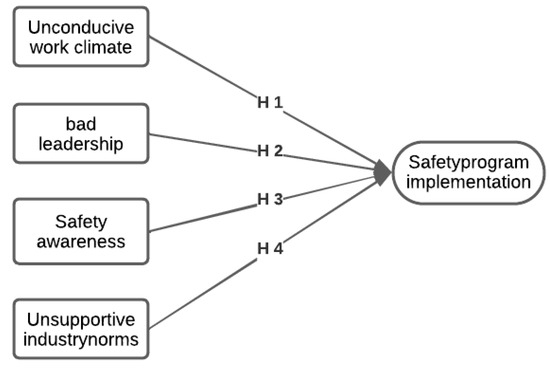
Figure 1.
Model hypotheses.
H1.
Overcoming an unfavorable work environment improves the effectiveness of safety program implementation.
H2.
Improving governance affects the execution of safety programs favorably.
H3.
Improving the lack of safety awareness affects the execution of safety programs favorably.
H4.
Overcoming unfavorable industrial standards affects the implementation of safety programs in a positive way.
3. The Development of a Research Method and Model
The goal of this study was to investigate and pinpoint the obstacles inhibiting safety management in the Saudi Arabian construction industry. As a result, the exploratory study method was used to conduct the critical literature review approach, and several phases of data collecting and organization were accordingly used [35]. A critical review demonstrates that the author has carefully researched and critically analyzed earlier research; it goes beyond merely presenting well-known articles to include new ideas and perspectives [36]. Data for this study was acquired through analyzing a variety of sources, including published publications, research papers, government documents, and green building codes in order to gain a thorough knowledge and understanding. The data analysis, refining, and categorization of earlier investigations were then completed. Through selection, simplification, and data abstraction, the information acquired must be reduced as part of the data review process. The aforementioned speaks about categorizing data into important categories or notions [37]. By making sure that each piece of information is given to the right subgroups (subconstructs) to major constructs, this categorization has been carried out [35]. This approach helps the writers analyze unprocessed data and generate hypotheses through ongoing assessment, which includes data gathering, improvement, and classification. Therefore, a group consisting of 12 barriers was developed from the literature analysis on challenges to safety program implementation and were deemed acceptable for the development of the PLS-SEM model. In particular, business research and the social sciences have given much attention to Partial Least Square Structural Equation Modeling (PLS-SEM) [38]. The PLS-SEM technique has been the subject of numerous studies that have lately been published in well-known SSCI publications [39,40,41]. In order to apply SEM to estimate the priority of the barriers to safety program implementation, the most recent version of the software, SMART-PLS 3.2.7, was used to evaluate the collected data. Despite the fact that there is just a little difference between the two approaches, PLS-SEM was first praised for its high prediction capabilities over covariance-based structural equation modelling (CB-SEM) [42] although the differences between the two strategies are comparatively slight [43]. The statistical analysis in this research included measurement and a structural model evaluation technique. The research design (Figure 2) was modified to fit Buniya, et al. [30] and Kineber, et al. [44].
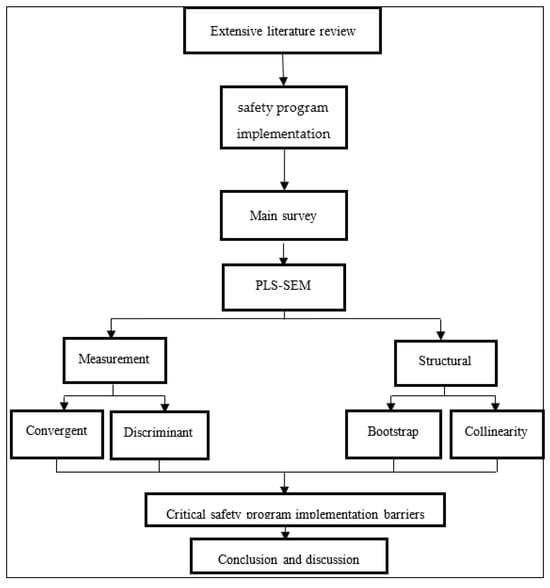
Figure 2.
Research design.
3.1. Model for Measurement
The measuring model reveals the current link between the objects and their underlying latent structure [45]. The next subsections provided a thorough discussion of the measurement model’s convergent and discriminant validity.
3.2. Validity Convergence
Convergent validity is a measure of how closely two or more measurements (barriers) of the same idea (category) agree [46]. It is acknowledged to contribute somewhat to the construct’s validity. The convergent validity of the calculated constructs could be determined using three tests to evaluate the convergent validity of the derived constructs in the case of PLS: Cronbach’s alpha (), composite reliability scores (_c), and average variance extracted (AVE) [47]. Nunnally and Bernstein [48] proposed a ρ_c value of 0.7 because 0.7 was proposed as the cutoff point for the composite’s “moderate” reliability. Values above 0.70 for all types of research and above 0.60 for exploratory research were considered satisfactory [49]. AVE was the last examination. It is a commonly used test to evaluate a model’s constructs’ convergent validity, indicating adequate convergent validity are results larger than 0.50 [49].
3.3. Comparative Effectiveness
Discriminant validity means that no measurements can reliably identify the phenomenon under study in a SEM since the phenomenon is empirically unique [50]. In order to establish discriminating validity, Campbell and Fiske [51] argued that measures’ similarity to one another shouldn’t be excessive.
3.4. Analysis of Structural Models
In this study, the importance of the implementation constraints for safety programs were modelled using SEM. In order to do this, the parameters of the model between the measured factors must be identified. In this case, a four-way direct connection (path relation) between £ (safety program implementation limits) and µ (safety program implementation) was found, as shown in Figure 1. The structure of the formulas for £, µ, and €1 that was recognised as the intrinsic relationship can, in fact, be written as a mathematical expression, as shown in equation [52]:
where (β) is the path coefficient linking safety program implementation barriers constructs and the residual variance at this structural level is supposed to reside in (€1). Here, β is the standardized regression weight, identical to the β weight of a multiple regression model. A clear indication needs to be statistically significant and concur with the predictions of the model. Finding the route coefficient’s significance, β, is the current issue.
µ = β £+ €1
The path coefficients’ average errors were calculated using an implementation strategy included in the SmartPLS3.2.7 program, just like with CFA. The t-statistics used in propositional analysis were defined by Henseler, et al. [38] and this was carried out using 5000 subsamples based on their recommendation. Four structural equations describing the PLS Model’s barriers to safety program implementation were developed in order to express the internal relationships between the concepts and equations (1).
4. Data Collection
A larger variety of potential Saudi Arabian participants in the residential building industry were contacted for the questionnaire survey in order to investigate the implementation challenges for safety programs. The survey was divided into three major sections: the claimant’s demographic characteristics; the process safety difficulties (Table 1); and the open-ended questions (to include any obstacles the users felt were necessary to be mentioned).
Providers, specialists, and customers were the three principal target audiences that were contacted. Designers, electricians, cost engineers, construction managers, and manufacturers could all be further separated based on their professions or occupations. According to information and experience, respondents evaluated implementation hurdles for safety programs using a Likert 5-point scale, where 5 was extremely high, 4 was high, 3 was average, 2 was modest, and 1 was no or very tiny. In some earlier research [53,54,55,56,57,58,59,60], this scale was employed. Sampling procedure of the relevant subpopulation was taken into consideration because safety is still relatively new in Saudi Arabia [29]. Likewise, the methodological purpose analysis was performed to estimate the size of the sample for this study [61]. In order to use SEM, the sample size, according to Yin [62], should be greater than 100. A total of 115 participants out of 150 people were contacted for this study because it used a SEM methodology, translating to a response rate of around 75%. According to previous research, this amount of return was deemed suitable for this kind of investigation [63,64].
5. Analysis of the Data and Results
5.1. Respondents’ Features and Demographic Profiles
According to their years of experience, professionalism, present positions, education, and organizational function, the authors categorized the respondents to this study, as shown in Table 2. According to these data for “Professionality”, “Civil Engineer” had the highest frequency (24.8%), followed by “Architect” (20.1%), and “Mechanical Engineer and Quantity Surveying” had the lowest frequency (17.8%). The “Site Engineer” had the highest frequency (43.5%), followed by the “Design Engineer” (24.3%), and the director had the lowest frequency (7.9%), according to the results of the present job. Contractors made up the largest percentage of respondents for the organizational function (39.3%), followed by clients/developers (31.8%). For bachelor’s, master’s, and doctoral degrees, the respondent’s credentials were rated at 81%, 53%, and 35%, respectively. Table 2 also reveals that the greatest proportion of respondents—7.5%—had employment experience ranging from one year to five years or less. The percentage of respondents who had worked for five to ten years, fifteen to twenty years, or more was around 21%, 26.2%, and 13%, respectively. The greatest percentage of respondents, 32.2%, had worked for ten to fifteen years. This shows that the study’s participants are knowledgeable and able to learn from it.
Table 2.
Demographic characteristic frequency distribution.
5.2. Analysis Model
Figure 1’s conceptual model from the study is replicated by the SEM shown in Figure 3. According to Hair Jr, et al. [65], the consistency of each indication, the overall consistency, the average extracted variance (AVE), and the discriminant validity must all be estimated for the measurement model assessment. The PLS algorithm throughout this work responds to the advice of Wong [49]: weighting scheme: path weighing; data metric with mean 0 and variance 1; 300 maximum iterations; 1 × 10⁵” 1.0E-5 abort criteria; and initial weights of 1.0. In general, indicators with outer loadings of 0.40 to 0.70 should only be taken into account for exclusion from the scale if doing so leads to a considerably greater composite reliability and AVE [66]. It has been determined that outer load variables with values lower than 0.6 do not meet this condition and should not be the subject of future research [65]. At this level, the variance explained by an indicator’s component accounts for almost half of its variance and the percentage of variance exceeds the uncertainty variable. Figure 3 displays the outside loadings for each variable in the existing and updated measurement scales. Therefore, the previous research instrument was removed together with all exterior loads, except maybe one item connected to the unsupportive industry norm “B3”; it was discarded because it had a rating of less than 0.6, indicating that it had little impact on the critical factors. After these variables were removed, a modified model was examined further. Cronbach alpha limits, a measure of sensitivity to the amount of elements included, have been used to assess the internal consistency of composite reliability (cr) Hair Jr, et al. [65]. Hair Jr, et al. [65] state that values above 0.70 are appropriate for all types of analysis and that values above 0.60 are ideal for exploratory research [49]. According to the results, all models that met the criteria of cr > 0.70 were deemed acceptable. Values above 0.50 indicate a sufficient convergent value, making the AVE a popular metric for assessing the convergent validity of model architectures [49]. According to the findings in Table 3, all structures pass this test.
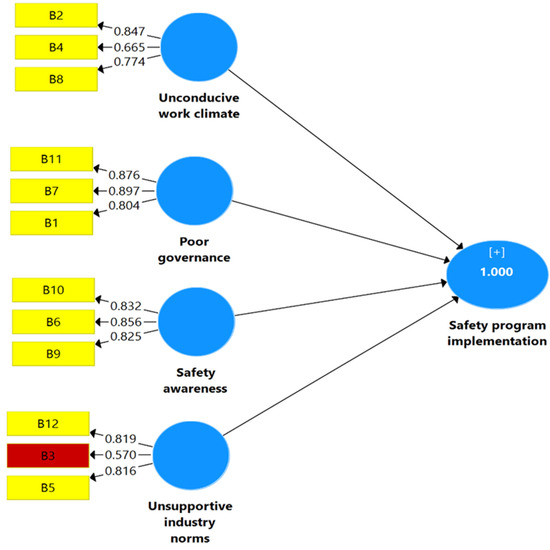
Figure 3.
Structural model.
Table 3.
Construct reliability and validity tests.
Discriminant validity is well-defined once the construct appropriately differs from all the other constructs by the observed standards. So, the construct is unique and covers occurrences that aren’t specified by additional model constructs according to its founding discriminatory validity [67]. Fornell-Larcker’s (1981) and the cross-loading criteria can be used to test discriminant validity, respectively. By comparing the square root of the AVE of each construct to the correlations of a particular construct with any other constructs, one can evaluate the discriminating validity of the construct. Fornell and Larcker [47] rules dictate that the square root of the AVE must be greater than the correlation between the latent variables. Table 4 indicates that the outcome supports the measurement model’s discriminant validity [68].
Table 4.
Correlation of latent variables and discriminant validity (Fornell-Larcker).
However, many academics disagree with the Fornell and Larcker [47] definition of distinctive validity for discrimination. This study also employed the cross-loading criterion, which Henseler, et al. [69] proposed as an important way of evaluating discriminatory validity to ascertain discriminatory validity. According to this strategy, indicators should load more heavily on a particular latent construct than they should on all other latent constructs combined. Loading indicators (items) for their constructs should be higher than for another build. According to Table 4’s findings, there is a stronger cross loading on the allocated latent construct than there is for any of its indicators (by row) (Table 5). For each component, the outcome indicated a sizable degree of one-dimensionality.
Table 5.
Cross loading analysis.
5.3. Structural Model (Path Analysis)
Linear regression statistical analysis is done using paths. In social science and management, path analysis is the most used analytical method. Corresponding to this, path analysis is a commonly used technique for simultaneously evaluating all complex relationships [70]. Structural equation modelling is used in the first stage of the SEM study. Analyzing the interrelationships between the research constructs can be done using the architectural framework. Once the model has been fitted, the structural equation model is the next significant stage in SEM analysis. It is possible to use the structural model by identifying relationships between the variables. The links between the variables are elucidated. The data illustrates the connection between endogenous or dependent factors and independent and exogenous variables [71,72]. The total model fit is considered in the assessment of the structural design after the magnitude, direction, and applicability of the assumed parameters [71]. Based on the research theories shown in Figure 1, the final step was verifying the suggested study relationship. SEM was employed for the research hypothesis. In Figure 4, the corresponding research hypothesis model is displayed. The importance of the hypothesis for the model was assessed as part of the bootstrapping approach. The bootstrapping procedure is used in conjunction with the random resampling of the original dataset to create fresh samples that are the same size as the entire data. The accuracy of the generated path coefficients is therefore verified using this procedure, which additionally examines the data set’s validity and statistical significance [73]. The pathway importance, with p-values for each path, is depicted in Figure 4 together with the standardised path coefficients (β) and p-values. Four hypotheses had a statistically significant impact on the findings.
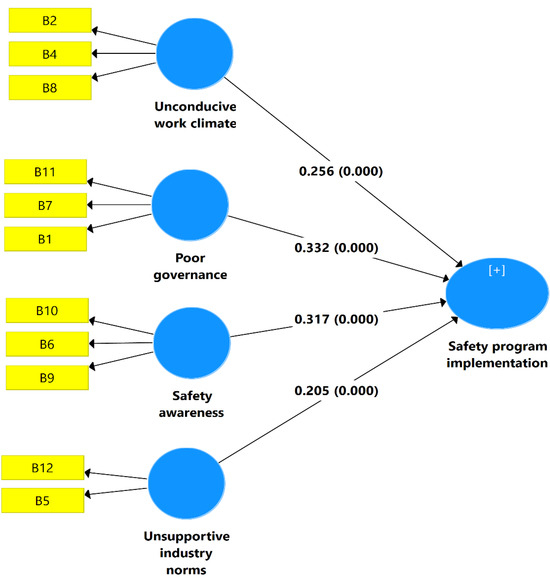
Figure 4.
Performing bootstrapping analysis.
5.4. The Structural Model’s Predictive Significance (Q2)
Taking into account the structural model’s predictive power, the PLS-SEM approach evaluates the model’s effectiveness [41]. A blindfolding procedure was conducted to test the cross-validated redundancy measures for each dependent construct. The results demonstrate that independent constructions have predictive relevance for dependent constructs when the Q2 values of a project’s success have a value of (0.53) or above [43].
6. Discussion
The role of safety management in Saudi Arabia’s construction industry is quite small, despite the fact that many industrialized nations rely heavily on it. In terms of risk and accidents, construction quality has been a challenge and inconsistently high in Saudi Arabia. This underlines how critical it is to create safety management guidelines to deal with these issues. In order for the government, organizations, and policymakers to develop and use relevant and practical interventions to gradually remove the barriers and enhance safety performance, it is imperative that constraints to safety programs in the Saudi Arabian construction field be identified. In order for safety to steadily be an inherent component of construction company efforts, it should start with the establishment of an appropriate national governance framework to promote the execution of safety programs. In order to effectively run this type of government, safety program legislation must be established and properly enforced. As a result, construction firms are forced to begin including safety considerations in their daily operations. The development of safety awareness and management commitment at the organizational level is possible through ongoing commitments to safety at the national and industry levels. For progress to be made and for the Saudi Arabia construction industry to change, consistency in this coordinated effort to improve safety is essential.
The PLS-SEM approach was employed in this work to extract four phases of safety management barriers in building projects in Saudi Arabia. The barriers are classified as follows: ineffective governance, safety awareness, discrimination case culture, and aggressive industry norms. A further point made by the suggested model is that the adoption of safety management is significantly impacted by each of the four safety management challenges. In doing so, construction projects may be more successful. In order to improve safety performance without compromising project functions, construction companies can cut costs and time by applying safety management. In order to encourage these decision-makers in construction companies to implement process safety, requirements for safety management must be adopted. The ways that the barriers that interact with PLS-SEM should be reduced are discussed in the subsection that follows:
6.1. Poor Governance
An issue with bad governance is the first component. The three barriers that comprise this component’s (β) of 0.332 are the absence of safety requirements, guidelines, and persons in charge of safety. Poor safety management and governance are factors in all of these obstacles. Managers and stakeholders cannot effectively implement safety programs without clear safety policies, rules, and laws. As stated by Aksorn and Hadikusumo [74], the lack of safety regulations, guidelines, and requirements is a significant barrier to the program’s implementation. To build and manage a secure workplace and for a strong safety culture to grow, it is important to communicate safety regulations and requirements to all parties involved [75,76]. Safety officers, a key component of safety control, are absent [77,78]. One of the consequences of this lack of safety and the absence of safety management governance is that there are no leaders who have the crucial responsibility to oversee the implementation of safety programs that integrate everyone in the process.
6.2. Safety Awareness
The second hurdle is a lack of safety knowledge. Lack of skills, obliviousness to risks and issues related to safety, and an absence of safety inspection are the three obstacles found in this component. Once more, there is a connection between these factors. Lack of training results in an inadequate understanding of hazards and safety, which reflects the management team’s ignorance of safety-related concerns. As a result, managers will be unable to identify, mitigate, and control hazards, as well as conduct insufficient safety inspections [75,79,80].
6.3. A Hostile Work Environment
Unfriendly workplace conditions make up the third element of the obstacles to implementing the safety program. Lack of funding, an absence of dedication to OSH, and the belief that only safety personnel are responsible for maintaining safety are some of the obstacles faced. The effectiveness of the safety program’s operation is based on how well these barriers are overcome. For instance, Goh and Chua [27] claim that the management staff’s low level of dedication to OSH is caused by a lack of resources. However, a lack of resources for putting safety plans into action shows unwavering disregard for safety [81,82,83].
Considering safety to be the duty of workers is another frequent example of a lack of commitment to OSH. Unsatisfactory safety programs and credit risk result from problems in collaboration involving company employees and safety personnel, safety controls, and performance metrics [77,84]. According to safety studies, the aspect of success that is typically praised is administrative dedication. To be able to resolve concerns related to a negative work environment, management’s commitment to OHS must be improved.
6.4. Unsupportive Industry Norms
The fourth barrier is a result of unsupportive industry norms and is represented by the three factors listed: a lack of qualified personnel in the construction sector, a constrained project timetable, and a lesser priority for safety. In the construction business, a lack of qualified workers is a major problem that limits their ability to implement a safety program. To make the problem worse, it is typical in the sector for building projects to have a constrained and inappropriate schedule. Contractors therefore place a high focus on finishing projects as soon as possible within the allotted timeframe [77]. Developers often give less emphasis to safety in this case because they are short of resources and have an absence of commitment to it [77,85].
7. In Summary
Health and Safety Program in the building industry are a method to lessen dangers to people, reduce accidents and fatalities, eliminate expenses related to subpar safety performance, and safeguard the reputation of construction organizations. Despite these advantages, there are still challenges to the effective application of safety initiatives in Saudi Arabian construction companies. In order to increase the execution of safety programs in the Saudi Arabian construction industry, the research highlighted four key impediments that must be addressed. In this study, a PLS-SEM was utilized to analyze and highlight the key implementation difficulties for safety programs. The outcomes show that the implementation of safety programs is considerably impacted by all four barrier factors. The absence of a safety management program, for example, is a sign of inadequate governance. Second, there is a lack of safety awareness, which is supported by inadequate safety training, knowledge, especially among senior management levels, and control. Third, an unfavorable work environment is brought on by a lack of safety resources, a lack of commitment to safety, and a lack of accountability for safety. Fourth, because of the emphasis on working on the project as quickly and economically as feasible, the standards in the Saudi Arabian construction industry would not support the use of safety measures. This validation offers numerical support for the dimensions of barriers and other factors that impede the use of safety programs in the Saudi construction sector.
7.1. Managerial Implication
The theoretical and practical ramifications of this study are extensive. One of the key factors in Saudi Arabia’s inability to advance in the delivery of construction projects may be the country’s refusal to accept reform, which leads to the implementation of projects using a similar methodology. Stakeholders, especially those who directly affect the construction process, must be motivated to use new philosophies if these changes are to be implemented. The results of this study suggest that, in order to overcome the barriers to safety program implementation in the Saudi Arabian construction industry, a framework and road map should be developed. As a result, through lectures, seminars, and conferences, stakeholders must be made aware of how embracing new ideas would help the project succeed. In addition, it alleviates the client’s worries and dispels their misunderstanding of the increased price of virtual computers. However, this study significantly advances knowledge in the following areas, all of which have considerable ramifications for the building industry:
- It offers a list of implementation hurdles for safety programs, along with information about how to weigh them and how to get over them so that safety programs can be implemented;
- It aids clients, consultants, and contractors in analyzing and removing implementation barriers for safety programs to enhance the reliability and planning of construction projects;
- It presents systematic evidence that could help Saudi Arabia and other developing countries adopt safety programs by getting over current obstacles;
- Developed countries have been the primary study’s principal subject, which is the implementation of safety programs. Implementing safety measures programs in underdeveloped countries has received little attention from researchers, particularly in Saudi Arabia’s building sector. The adoption of safety programs and the Saudi Arabian construction sector can thus be successfully linked, thanks to this study. Consequently, it established a strong platform for dealing with the use of safety program implementation in enhancing the viability of regional building initiatives and closing research gaps;
- Policymakers can use this study’s tool to help create safety programs that are fairly implemented. The goal of this study is to investigate the barriers to the implementation of safety programs in the construction industry by introducing the partial least squares (PLS-SEM) prediction technique. In light of this, this approach has the potential to revolutionize construction projects;
- This study’s conclusions can assist with the establishment of a safety program in Saudi Arabian construction projects. The knowledge objectives for creating a safety program are based on our findings. So, by developing and putting into practice the required techniques, all stakeholders may concentrate on the project’s objectives in terms of cost, time, and output. The project’s impact is ultimately positive when it has a high level of sustainability.
7.2. Theoretical Implications
Adoption of safety programs is significantly hampered by the recommended prioritization strategy, mainly in the building sector. To identify the difficulties in implementing safety programs, this study followed the suggested methodology. Thanks to this study, the theoretical and practical aspects of safety programs are now closer together. As far as we can tell, however, the adoption of safety programs in the Saudi Arabian construction industry is not the subject of any scholarly investigation looking at the impact of removing obstacles to their deployment. In order to install safety programs in the construction sector, this study first empirically analyzes the key impediments to safety program deployment. This finding opens the door for more investigation into the difficulties safety programs in undeveloped countries confront, particularly in the area of structural engineering. The academic parts of this study provide a conceptual basis for deciding the safety program barriers that may have been appropriately used in Saudi Arabia. With the help of PLS-SEM, the four safety program barriers in the Saudi Arabian construction industry were compared. In order to assist representatives who are interns in adopting safety programs impartially, this study offers a method.
8. Future Directions and Research Limitations
Despite the fact that this study greatly advances knowledge and practice, there are still many unexplored areas that could be explored in other studies. The study achieved its goals and exceeded expectations despite these limitations that were involved in the data analysis; 115 respondents provided responses. For a different crucial factor, a larger sample can be demonstrated. The problem with smaller samples might be solved by employing the PLS measurement approach. In this analysis, those three responses (from the contractor, consultant, and landowner) were referred to as a “unified entity”. The industry’s relationship with the different user groups should be studied further. It is advised to conduct additional studies in the future to forecast the effect on other performance metrics. The following suggestions have been made in light of the study’s findings in order to create a successful and useful application of safety program implementation:
- According to the study’s findings, shareholders and superiors will gain an improved understanding of the significant impediments to the application of safety programs. The notions, principles, and methods that were utilized in the safety program technology adoption must be made clear to construction stakeholders;
- Technical building organizations in Saudi Arabia ought to organize frequent learning sessions for their members on adopting safety protocols and include such in their individualized training exams;
- Additionally, the government is crucial in the creation and preservation of laws, regulations, and rules for all various industries operating in the country. As a result, by establishing rules, laws, and policies that would support the employment of safety programs throughout the nation in construction projects, the government can aid in promoting their acceptance;
- At the corporate level, organizations operating in the construction industry cannot implement a safety program on their own or train their workers without the support of senior management. Additionally, in order to guarantee complete compliance, adequate implementation methods for safety program guidelines must be developed.
Author Contributions
Conceptualization, A.A.-O. and A.F.K.; methodology, A.A.-O. and A.F.K.; software, A.A.-O. and A.F.K. validation, A.A.-O. and A.F.K.; formal analysis, A.A.-O. and A.F.K.; investigation, A.A.-O. and A.F.K.; resources, A.A.-O. and A.F.K.; data curation, A.A.-O. and A.F.K.; writing—original draft preparation, A.A.-O. and A.F.K.; writing—review and editing, A.A.-O. and A.F.K.; visualization, A.A.-O. and A.F.K. supervision, A.A.-O. and A.F.K.; project administration, A.A.-O. and A.F.K.; funding acquisition, A.A.-O. and A.F.K. All authors have read and agreed to the published version of the manuscript.
Funding
This research received no external funding.
Institutional Review Board Statement
Not applicable.
Informed Consent Statement
Not applicable.
Data Availability Statement
Not applicable.
Acknowledgments
The authors would like to thank the Deanship of Scientific Research at Shaqra University for supporting this work.
Conflicts of Interest
The authors declare no conflict of interest.
Correction Statement
This article has been republished with a minor correction to the existing affiliation information. This change does not affect the scientific content of the article.
References
- Pinto, A.; Nunes, I.L.; Ribeiro, R.A. Occupational risk assessment in construction industry—Overview and reflection. Saf. Sci. 2011, 49, 616–624. [Google Scholar] [CrossRef]
- Larsson, T.J.; Field, B.J. The distribution of occupational injury risks in the Victorian construction industry. Saf. Sci. 2002, 40, 439–456. [Google Scholar] [CrossRef]
- Sousa, V.; Almeida, N.M.; Dias, L.A. Risk-based management of occupational safety and health in the construction industry–Part 1: Background knowledge. Saf. Sci. 2014, 66, 75–86. [Google Scholar] [CrossRef]
- Mosly, I. Management. Safety performance in the construction industry of Saudi Arabia. Int. J. Constr. Eng. Manag. 2015, 4, 238–247. [Google Scholar]
- Waehrer, G.M.; Dong, X.S.; Miller, T.; Haile, E.; Men, Y. Costs of occupational injuries in construction in the United States. Accid. Anal. Prev. 2007, 39, 1258–1266. [Google Scholar] [CrossRef]
- Torghabeh, Z.J.; Hosseinian, S.S.; Ressang, A. Relative Importance of Hazards at Construction Sites. In Applied Mechanics and Materials; Trans Tech Publications Ltd.: Wollerau, Switzerland, 2013; pp. 867–871. [Google Scholar]
- Tam, C.M.; Zeng, S.; Deng, Z. Identifying elements of poor construction safety management in China. Saf. Sci. 2004, 42, 569–586. [Google Scholar] [CrossRef]
- Yakubu, D.; Bakri, I.M. Evealuation of safety and health performance on construction sites (Kuala Lampur). J. Mgmt. Sustain. 2013, 3, 100. [Google Scholar] [CrossRef][Green Version]
- Wadick, P. Safety culture among subcontractors in the domestic housing construction industry. Struct. Surv. 2010, 28, 108–120. [Google Scholar] [CrossRef]
- Gürcanlı, G.; Baradan, S.; Uzun, M. Risk perception of construction equipment operators on construction sites of Turkey. Int. J. Ind. Ergon. 2015, 46, 59–68. [Google Scholar] [CrossRef]
- Farouk Kineber, A.; Othman, I.B.; Oke, A.E.; Chileshe, N. Modelling the relationship between value management’s activities and critical success factors for sustainable buildings. J. Eng. Des. Technol. 2022, 20, 414–435. [Google Scholar] [CrossRef]
- Hinze, J.; Wiegand, F. management. Role of designers in construction worker safety. J. Constr. Eng. Manag. 1992, 118, 677–684. [Google Scholar] [CrossRef]
- Al Haadir, S.; Panuwatwanich, K. Critical success factors for safety program implementation among construction companies in Saudi Arabia. Procedia Eng. 2011, 14, 148–155. [Google Scholar] [CrossRef]
- Othman, I.; Majid, R.; Mohamad, H.; Shafiq, N.; Napiah, M. Variety of accident causes in construction industry. MATEC Web Conf. 2018, 203, 02006. [Google Scholar] [CrossRef]
- Hinze, J.; Hallowell, M.; Baud, K. management. Construction-safety best practices and relationships to safety performance. J. Constr. Eng. Manag. 2013, 139, 04013006. [Google Scholar] [CrossRef]
- Rowlinson, S. Construction Safety Management Systems; Routledge: Abingdon, UK, 2004. [Google Scholar]
- Hinze, J.; Gambatese, J. Factors that influence safety performance of specialty contractors. J. Constr. Eng. Manag. 2003, 129, 159–164. [Google Scholar] [CrossRef]
- Findley, M.; Smith, S.; Kress, T.; Petty, G.; Kim, E. Safety program elements in construction. Prof. Saf. 2004, 49, 14. [Google Scholar]
- Buniya, M.K.; Othman, I.; Sunindijo, R.Y.; Kineber, A.F.; Mussi, E.; Ahmad, H. Barriers to safety program implementation in the construction industry. Ain Shams Eng. J. 2021, 12, 65–72. [Google Scholar] [CrossRef]
- Oliveira, O.J.D.; Oliveira, A.B.D.; Almeida, R.A.D. Diretrizes para implantação de sistemas de segurança e saúde do trabalho em empresas produtoras de baterias automotivas. Gestão Produção 2010, 17, 407–419. [Google Scholar] [CrossRef][Green Version]
- Stephen, C.; Hunt, B. Safety management systems in Hong Kong: Is there anything wrong with the implementation? Manag. Audit. J. 2002, 17, 588–592. [Google Scholar]
- Kogi, K. Work improvement and occupational safety and health management systems: Common features and research needs. Ind. Health 2002, 40, 121–133. [Google Scholar] [CrossRef] [PubMed]
- Yiu, N.S.; Sze, N.; Chan, D.W. Implementation of safety management systems in Hong Kong construction industry–A safety practitioner–s perspective. J. Saf. Res. 2018, 64, 1–9. [Google Scholar] [CrossRef]
- Howell, G.A.; Ballard, G.; Abdelhamid, T.S.; Mitropoulos, P. Working near the edge: A new approach to construction safety. In Proceedings of the 10th Annual Conference of the International Group for Lean Constructi, Gramado, Brazil, 6–8 August 2002. [Google Scholar]
- Yiu, N.; Chan, D. A taxonomic review of the application of safety management systems in construction. J. Int. Sci. Publ. Ecol. Saf. 2016, 19, 394–408. [Google Scholar]
- Abdelhamid, T.S.; Everett, J.G. Identifying root causes of construction accidents. J. Constr. Eng. Manag. 2000, 126, 52–60. [Google Scholar]
- Goh, Y.M.; Chua, D. Neural network analysis of construction safety management systems: A case study in Singapore. Constr. Manag. Econ. 2013, 31, 460–470. [Google Scholar] [CrossRef]
- Ju, C.; Rowlinson, S. Institutional determinants of construction safety management strategies of contractors in Hong Kong. Constr. Manag. Econ. 2014, 32, 725–736. [Google Scholar] [CrossRef]
- Fang, D.; Chen, Y.; Wong, L. Safety climate in construction industry: A case study in Hong Kong. J. Constr. Eng. Manag. 2006, 132, 573–584. [Google Scholar] [CrossRef]
- Oke, A.E.; Kineber, A.F.; Akindele, O.; Ekundayo, D. Determining the Stationary Barriers to the implementation of Radio Frequency Identification (RFID) technology in an emerging construction industry. J. Eng. Des. Technol. 2023, 15, 825. [Google Scholar]
- Christensen, C.M. The ongoing process of building a theory of disruption. J. Prod. Innov. Manag. 2006, 23, 39–55. [Google Scholar] [CrossRef]
- Zaid Alkilani, S.; Jupp, J.; Sawhney, A. Issues of construction health and safety in developing countries: A case of Jordan. Australas. J. Constr. Econ. Build. 2013, 13, 141. [Google Scholar] [CrossRef]
- Priyadarshani, K.; Karunasena, G.; Jayasuriya, S. Construction safety assessment framework for developing countries: A case study of Sri Lanka. J. Constr. Dev. Ctries. 2013, 18, 33–51. [Google Scholar]
- Raheem, A.A.; Hinze, J.W. Disparity between construction safety standards: A global analysis. Saf. Sci. 2014, 70, 276–287. [Google Scholar] [CrossRef]
- Corbin, J.; Strauss, A. Basics of Qualitative Research: Techniques and Procedures for Developing Grounded Theory; Sage Publications: New York, NY, USA, 2014. [Google Scholar]
- Grant, M.J.; Booth, A. A typology of reviews: An analysis of 14 review types and associated methodologies. Health Inf. Libr. J. 2009, 26, 91–108. [Google Scholar] [CrossRef] [PubMed]
- Miles, M.B.; Huberman, A.M. Qualitative Data Analysis: An Expanded Sourcebook; Sage Publications: Thousand Oaks, CA, USA, 1994. [Google Scholar]
- Shields, P.M.; Tajalli, H. Intermediate theory: The missing link in successful student scholarship. J. Public Aff. Educ. 2006, 12, 313–334. [Google Scholar] [CrossRef]
- Chileshe, N.; Rameezdeen, R.; Hosseini, M.R.; Martek, I.; Li, H.X.; Panjehbashi-Aghdam, P. Factors driving the implementation of reverse logistics: A quantified model for the construction industry. Waste Manag. 2018, 79, 48–57. [Google Scholar] [CrossRef]
- Henseler, J.; Hubona, G.; Ray, P.A. Using PLS path modeling in new technology research: Updated guidelines. Ind. Manag. Data Syst. 2016, 116, 2–20. [Google Scholar] [CrossRef]
- Banihashemi, S.; Hosseini, M.R.; Golizadeh, H.; Sankaran, S. Critical success factors (CSFs) for integration of sustainability into construction project management practices in developing countries. Int. J. Proj. Manag. 2017, 35, 1103–1119. [Google Scholar] [CrossRef]
- Lee, C.; Hallak, R. Investigating the moderating role of education on a structural model of restaurant performance using multi-group PLS-SEM analysis. J. Bus. Res. 2018, 88, 298–305. [Google Scholar] [CrossRef]
- Hult, G.T.M.; Hair Jr, J.F.; Proksch, D.; Sarstedt, M.; Pinkwart, A.; Ringle, C.M. Addressing endogeneity in international marketing applications of partial least squares structural equation modeling. J. Int. Mark. 2018, 26, 1–21. [Google Scholar] [CrossRef]
- Hair Jr, J.F.; Matthews, L.M.; Matthews, R.L.; Sarstedt, M. PLS-SEM or CB-SEM: Updated guidelines on which method to use. Int. J. Multivar. Data Anal. 2017, 1, 107–123. [Google Scholar] [CrossRef]
- Hair, J.F.; Ringle, C.M.; Sarstedt, M. PLS-SEM: Indeed a silver bullet. J. Mark. Theory Pract. 2011, 19, 139–152. [Google Scholar] [CrossRef]
- Kineber, A.F.; Othman, I.; Oke, A.E.; Chileshe, N.; Zayed, T. Exploring the value management critical success factors for sustainable residential building–A structural equation modelling approach. J. Clean. Prod. 2021, 293, 126115. [Google Scholar] [CrossRef]
- Al-Ashmori, Y.Y.; Othman, I.; Rahmawati, Y.; Amran, Y.M.; Sabah, S.A.; Rafindadi, A.D.U.; Mikić, M. BIM benefits and its influence on the BIM implementation in Malaysia. Ain Shams Eng. J. 2020, 11, 1013–1019. [Google Scholar] [CrossRef]
- Hulland, J. Use of partial least squares (PLS) in strategic management research: A review of four recent studies. Strateg. Manag. J. 1999, 20, 195–204. [Google Scholar] [CrossRef]
- Fornell, C.; Larcker, D.F. Evaluating structural equation models with unobservable variables and measurement error. J. Mark. Res. 1981, 18, 39–50. [Google Scholar] [CrossRef]
- Nunnally, J.C.; Bernstein, I. The role of university in the development of entrepreneurial vocations: A Spanish study. In Psychometric Theory; McGraw-Hill: New York, NY, USA, 1978; pp. 387–405. [Google Scholar]
- Wong, K.K.-K. Partial least squares structural equation modeling (PLS-SEM) techniques using SmartPLS. Mark. Bull. 2013, 24, 1–32. [Google Scholar]
- Hair, J.F.; Anderson, R.E.; Babin, B.J.; Black, W.C. Multivariate Data Analysis: A Global Perspective; Pearson: Upper Saddle River, NJ, USA, 2010; Volume 7. [Google Scholar]
- Campbell, D.T.; Fiske, D.W. Convergent and discriminant validation by the multitrait-multimethod matrix. Psychol. Bull. 1959, 56, 81. [Google Scholar] [CrossRef]
- Zaid Alkilani, S. Performance Measurement and Improvement Model for Small and Medium Contractors in Developing Countries. Ph.D. Thesis, The University of New South Wales, Sydney, Australia, 2018. [Google Scholar]
- Al-Mekhlafi, A.-B.A.; Isha, A.S.N.; Chileshe, N.; Abdulrab, M.; Kineber, A.F.; Ajmal, M. Impact of Safety Culture Implementation on Driving Performance among Oil and Gas Tanker Drivers: A Partial Least Squares Structural Equation Modelling (PLS-SEM) Approach. Sustainability 2021, 13, 8886. [Google Scholar] [CrossRef]
- Buniya, M.K.; Othman, I.; Durdyev, S.; Sunindijo, R.Y.; Ismail, S.; Kineber, A.F. Safety Program Elements in the Construction Industry: The Case of Iraq. Int. J. Environ. Res. Public Health 2021, 18, 411. [Google Scholar] [CrossRef]
- Olanrewaju, O.I.; Kineber, A.F.; Chileshe, N.; Edwards, D.J. Modelling the Impact of Building Information Modelling (BIM) Implementation Drivers and Awareness on Project Lifecycle. Sustainability 2021, 13, 8887. [Google Scholar] [CrossRef]
- Oke, A.E.; Kineber, A.F.; Albukhari, I.; Othman, I.; Kingsley, C. Assessment of Cloud Computing Success Factors for Sustainable Construction Industry: The Case of Nigeria. Buildings 2021, 11, 36. [Google Scholar] [CrossRef]
- Oke, A.E.; Kineber, A.F.; Al-Bukhari, I.; Famakin, I.; Kingsley, C. Exploring the benefits of cloud computing for sustainable construction in Nigeria. J. Eng. Des. Technol. Soc. 2021. [Google Scholar] [CrossRef]
- Rady, M.; Kineber, A.F.; Hamed, M.M.; Daoud, A.O. Partial Least Squares Structural Equation Modeling of Constraint Factors Affecting Project Performance in the Egyptian Building Industry. Mathematics 2023, 11, 497. [Google Scholar]
- Badewi, A. Investigating benefits realisation process for enterprise resource planning systems. Ph.D. Thesis, Cranfield University, Cranfield, UK, 2016. [Google Scholar]
- Yin, R.K. Case Study Research: Design and Methods, 4th ed.; Sage: Thousand Oaks, CA, USA, 2009; Volume 5. [Google Scholar]
- Kothari, C. Research Methodology Methods and Techniques, 2nd Revised ed.; New Age International publishers: New Delhi, India, 2009; Volume 20, p. 2018. [Google Scholar]
- Wahyuni, D. The research design maze: Understanding paradigms, cases, methods and methodologies. J. Appl. Manag. Account. Res. 2012, 10, 69–80. [Google Scholar]
- Hair, J.F., Jr.; Hult, G.T.M.; Ringle, C.; Sarstedt, M. A Primer on Partial Least Squares Structural Equation Modeling (PLS-SEM); Sage publications: Thousand Oaks, CA, USA, 2016. [Google Scholar]
- Henseler, J.; Ringle, C.M.; Sinkovics, R.R. The use of partial least squares path modeling in international marketing. In New Challenges to International Marketing; Emerald Group Publishing Limited: Bingley, UK, 2009. [Google Scholar]
- Hair, J.F.; Ringle, C.M.; Sarstedt, M. Partial least squares structural equation modeling: Rigorous applications, better results and higher acceptance. Long Range Plan. 2013, 46, 1–12. [Google Scholar] [CrossRef]
- Chin, W.W.; Newsted, P.R. Structural equation modeling analysis with small samples using partial least squares. Stat. Strateg. Small Sample Res. 1999, 1, 307–341. [Google Scholar]
- Henseler, J.; Ringle, C.M.; Sarstedt, M. A new criterion for assessing discriminant validity in variance-based structural equation modeling. J. Acad. Mark. Sci. 2015, 43, 115–135. [Google Scholar] [CrossRef]
- Tabachnick, B.G.; Fidell, L.S.; Ullman, J.B. Using Multivariate Statistics; Pearson: Boston, MA, USA, 2007; Volume 5. [Google Scholar]
- Hair, J.F.; Black, W.C.; Babin, B.J.; Anderson, R.E.; Tatham, R.L. Multivariate Data Analysis; Pearson Prentice Hall: Upper Saddle River, NJ, USA, 2006; Volume 6. [Google Scholar]
- Ho, Y.-S. Review of second-order models for adsorption systems. J. Hazard. Mater. 2006, 136, 681–689. [Google Scholar] [CrossRef]
- Chin, W.W. Commentary: Issues and opinion on structural equation modeling. JSTOR 1998, 22, vii–xvi. [Google Scholar]
- Aksorn, T.; Hadikusumo, B.H. Critical success factors influencing safety program performance in Thai construction projects. Saf. Sci. 2008, 46, 709–727. [Google Scholar] [CrossRef]
- Mahmoudi, S.; Ghasemi, F.; Mohammadfam, I.; Soleimani, E. Framework for continuous assessment and improvement of occupational health and safety issues in construction companies. Saf. Health Work 2014, 5, 125–130. [Google Scholar] [CrossRef]
- Ghahramani, A. Factors that influence the maintenance and improvement of OHSAS 18001 in adopting companies: A qualitative study. J. Clean. Prod. 2016, 137, 283–290. [Google Scholar] [CrossRef]
- Yiu, N.S.; Chan, D.W.; Shan, M.; Sze, N. Implementation of safety management system in managing construction projects: Benefits and obstacles. Saf. Sci. 2019, 117, 23–32. [Google Scholar] [CrossRef]
- Mohamed, S. Safety climate in construction site environments. J. Constr. Eng. Manag. 2002, 128, 375–384. [Google Scholar]
- Yazdani, A.; Neumann, W.P.; Imbeau, D.; Bigelow, P.; Pagell, M.; Wells, R. Prevention of musculoskeletal disorders within management systems: A scoping review of practices, approaches, and techniques. Appl. Ergon. 2015, 51, 255–262. [Google Scholar] [CrossRef]
- Mitropoulos, P.; Abdelhamid, T.S.; Howell, G.A. Systems model of construction accident causation. J. Constr. Eng. Manag. 2005, 131, 816–825. [Google Scholar]
- Zeng, S.X.; Shi, J.J.; Lou, G. A synergetic model for implementing an integrated management system: An empirical study in China. J. Clean. Prod. 2007, 15, 1760–1767. [Google Scholar] [CrossRef]
- Mohammadfam, I.; Kamalinia, M.; Momeni, M.; Golmohammadi, R.; Hamidi, Y.; Soltanian, A. Developing an integrated decision making approach to assess and promote the effectiveness of occupational health and safety management systems. J. Clean. Prod. 2016, 127, 119–133. [Google Scholar] [CrossRef]
- İnan, U.H.; Gül, S.; Yılmaz, H. A multiple attribute decision model to compare the firms’ occupational health and safety management perspectives. Saf. Sci. 2017, 91, 221–231. [Google Scholar] [CrossRef]
- Trinh, M.T.; Feng, Y.; Mohamed, S. Framework for measuring resilient safety culture in Vietnam’s construction environment. J. Constr. Eng. Manag. 2019, 145, 04018127. [Google Scholar]
- Othman, I.; Harahap, M.I.P.; Mohamad, H.; Shafiq, N.; Napiah, M. Development of BIM-Based Safety Management Model Focusing on Safety Rule Violations. MATEC Web Conf. 2018, 203, 02007. [Google Scholar] [CrossRef]
Disclaimer/Publisher’s Note: The statements, opinions and data contained in all publications are solely those of the individual author(s) and contributor(s) and not of MDPI and/or the editor(s). MDPI and/or the editor(s) disclaim responsibility for any injury to people or property resulting from any ideas, methods, instructions or products referred to in the content. |
© 2023 by the authors. Licensee MDPI, Basel, Switzerland. This article is an open access article distributed under the terms and conditions of the Creative Commons Attribution (CC BY) license (https://creativecommons.org/licenses/by/4.0/).